


PSYC 354
STEPHANIE GEORGE
PSYC 354
SUB-TERM B
SPSS HOMEWORK: VARIABILITY TEMPLATE
Problem Set 1: The following data are based on numbers taken from the Bureau of Labor
Statistics surveys from the year 2019 (located as a resource on the assignment page in Canvas),
for community, service, social science, and education occupations. They represent the average
weekly pay for wage and salary earners measured during 2019 and broken down by gender.
Enter these data into a new file containing one grouping variable for gender and one variable for
salary.
For the Gender variable in column 1, code women as 1 and men as 2
Remember to define these in Value Labels as covered in the presentations.
There will be thirteen “1”s and thirteen “2”s (as many participants as in each group) in the
Gender column in SPSS.
The corresponding earnings will be entered in the Salary column in SPSS.
Remember to put your initials within any and all variable names.
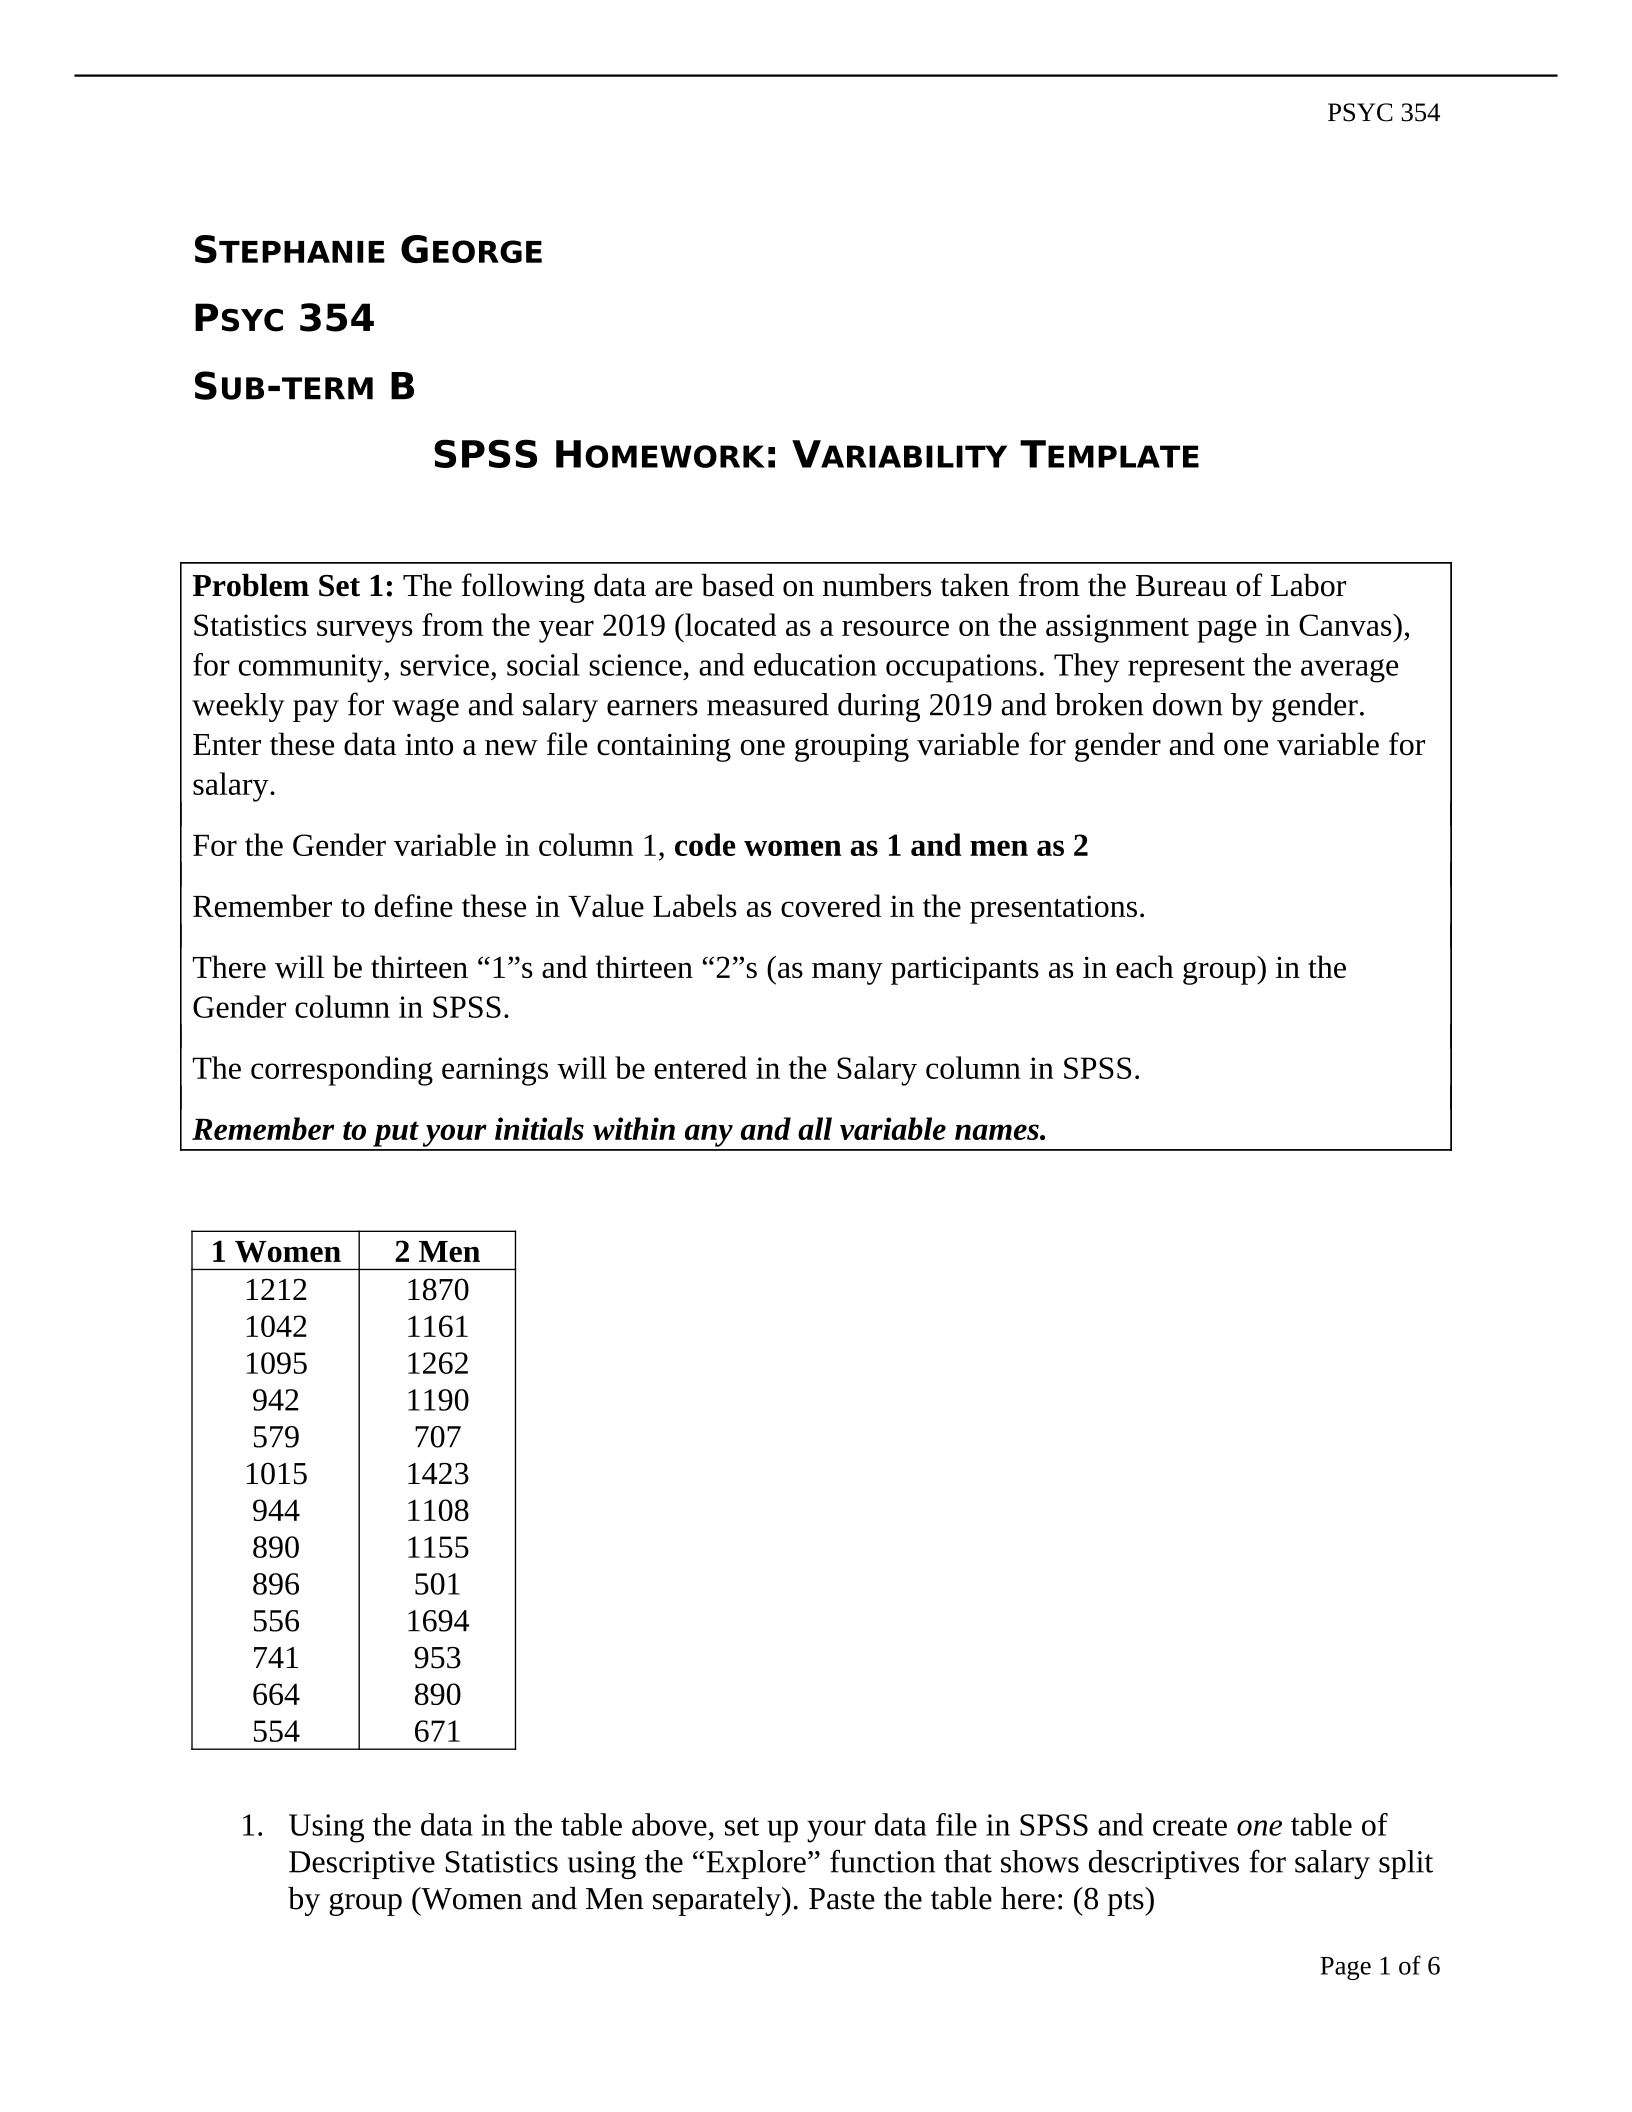
1 Women 2 Men
1212
1042
1095
942
579
1015
944
890
896
556
741
664
554
1870
1161
1262
1190
707
1423
1108
1155
501
1694
953
890
671
1. Using the data in the table above, set up your data file in SPSS and create one table of
Descriptive Statistics using the “Explore” function that shows descriptives for salary split
by group (Women and Men separately). Paste the table here: (8 pts)
Page 1 of 6

PSYC 354
Descriptives
GenderSG Statistic Std. Error
SalaryS
G
Women Mean 856.1538 60.42858
95% Confidence Interval
for Mean
Lower
Bound
724.4913
Upper
Bound
987.8164
5% Trimmed Mean 853.1709
Median 896.0000
Variance 47470.974
Std. Deviation 217.87835
Minimum 554.00
Maximum 1212.00
Range 658.00
Interquartile Range 407.00
Skewness -.133 .616
Kurtosis -1.166 1.191
Men Mean 1121.9231 108.83918
95% Confidence Interval
for Mean
Lower
Bound
884.7829
Upper
Bound
1359.0633
5% Trimmed Mean 1114.8590
Median 1155.0000
Variance 153997.577
Std. Deviation 392.42525
Minimum 501.00
Maximum 1870.00
Range 1369.00
Interquartile Range 544.00
Skewness .353 .616
Kurtosis -.135 1.191
2. What are the mean and standard deviation of salaries for women? (5 pts)
Mean: 856.1538
Page 2 of 6
PSYC 354
Standard Deviation: 217.878
3. Find the values for skewness in the table. What kind of skew is present for each group? (5
pts)
Women: -.133 Negative skew present (data skewed left)
Men: .353 Positive skew present (data skewed right)
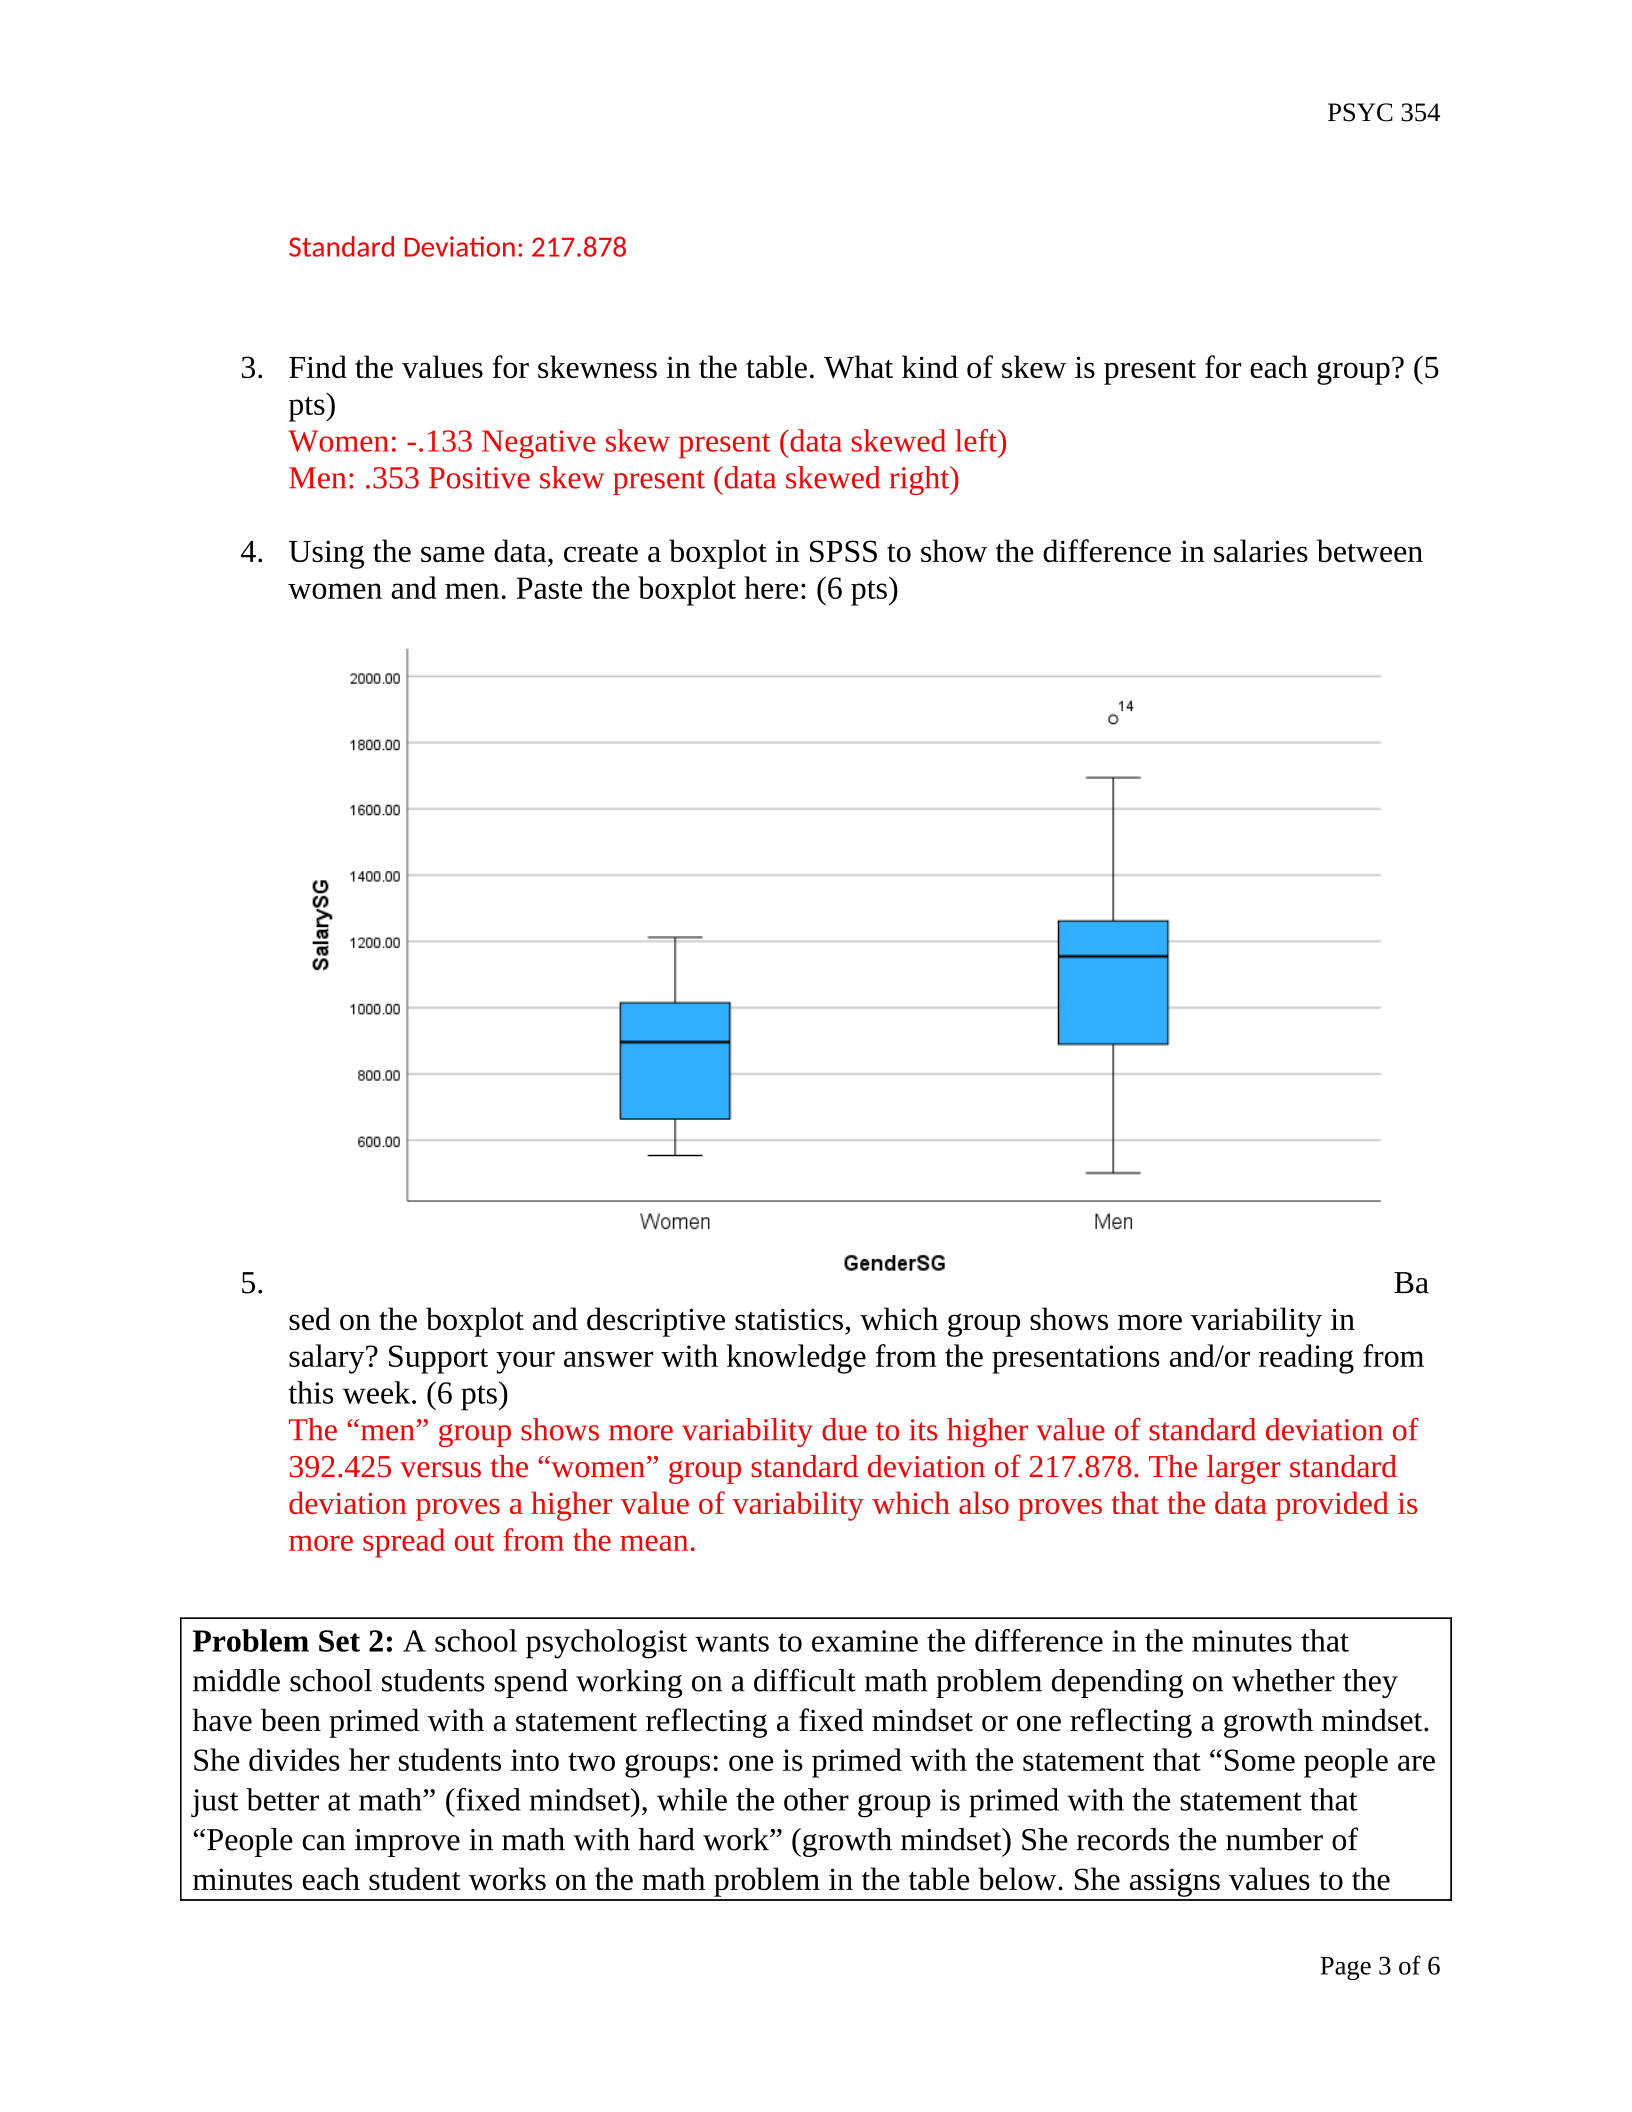
4. Using the same data, create a boxplot in SPSS to show the difference in salaries between
women and men. Paste the boxplot here: (6 pts)
5. Ba
sed on the boxplot and descriptive statistics, which group shows more variability in
salary? Support your answer with knowledge from the presentations and/or reading from
this week. (6 pts)
The “men” group shows more variability due to its higher value of standard deviation of
392.425 versus the “women” group standard deviation of 217.878. The larger standard
deviation proves a higher value of variability which also proves that the data provided is
more spread out from the mean.
Problem Set 2: A school psychologist wants to examine the difference in the minutes that
middle school students spend working on a difficult math problem depending on whether they
have been primed with a statement reflecting a fixed mindset or one reflecting a growth mindset.
She divides her students into two groups: one is primed with the statement that “Some people are
just better at math” (fixed mindset), while the other group is primed with the statement that
“People can improve in math with hard work” (growth mindset) She records the number of
minutes each student works on the math problem in the table below. She assigns values to the
Page 3 of 6

PSYC 354
Mindset Group variable as follows: 1 = Fixed; 2 = Growth. Remember to put your initials
within any and all variable names.
Mindset Group
(1 = Fixed; 2 =
Growth)
Minutes Spent
on Difficult
Math Problem
1
1
1
1
1
1
1
1
1
2
2
2
2
2
2
2
2
2
2
1.5
1.2
1.9
1.8
0.6
1.4
3.7
0.9
0.7
2.1
2.8
1.8
1.3
2.4
4.6
3.5
2.2
1.4
3.3
1. Using the data in the table above, set up a data file in SPSS and create one table of
descriptive statistics using the “Explore” command that is split by “Mindset” group. Paste
the table here: (8 pts)
Descriptives
MindsetSG Statistic Std. Error
MinutesS
G
Fixed Mean 1.5222 .31171
95% Confidence Interval
for Mean
Lower
Bound
.8034
Upper
Bound
2.2410
5% Trimmed Mean 1.4525
Median 1.4000
Variance .874
Std. Deviation .93512
Minimum .60
Page 4 of 6
PSYC 354
Maximum 3.70
Range 3.10
Interquartile Range 1.05
Skewness 1.727 .717
Kurtosis 3.787 1.400
Growth Mean 2.5400 .32530
95% Confidence Interval
for Mean
Lower
Bound
1.8041
Upper
Bound
3.2759
5% Trimmed Mean 2.4944
Median 2.3000
Variance 1.058
Std. Deviation 1.02870
Minimum 1.30
Maximum 4.60
Range 3.30
Interquartile Range 1.65
Skewness .786 .687
Kurtosis .260 1.334
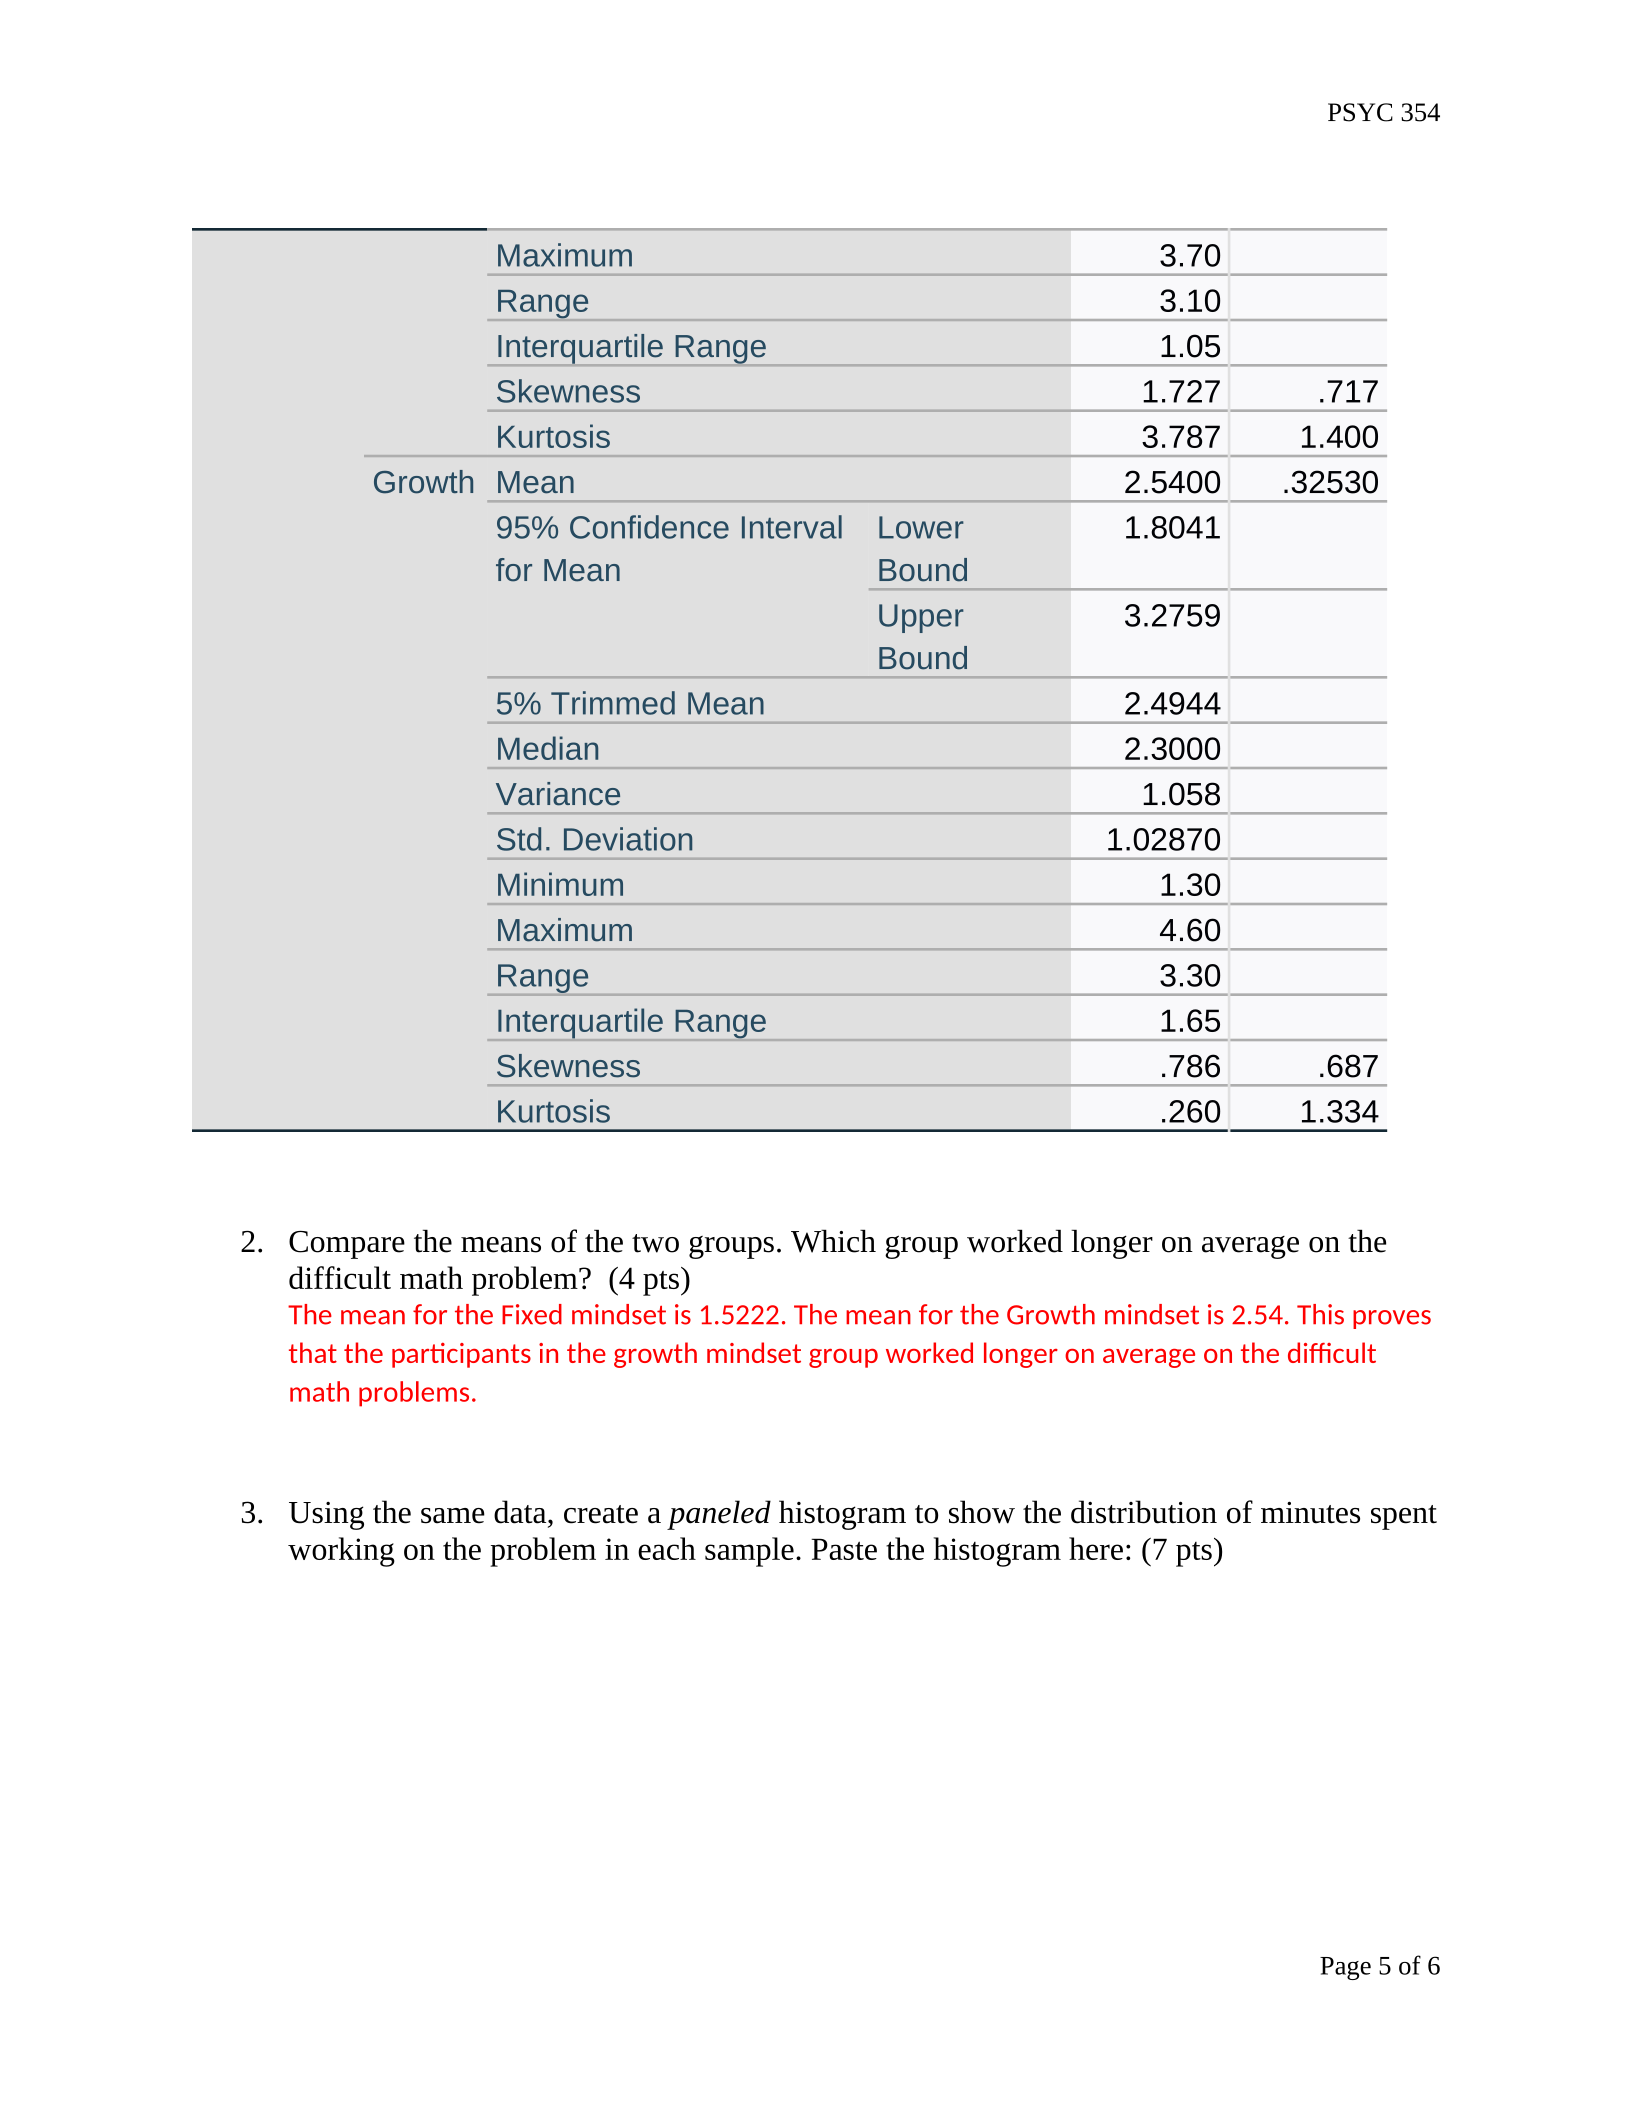
2. Compare the means of the two groups. Which group worked longer on average on the
difficult math problem? (4 pts)
The mean for the Fixed mindset is 1.5222. The mean for the Growth mindset is 2.54. This proves
that the participants in the growth mindset group worked longer on average on the difficult
math problems.
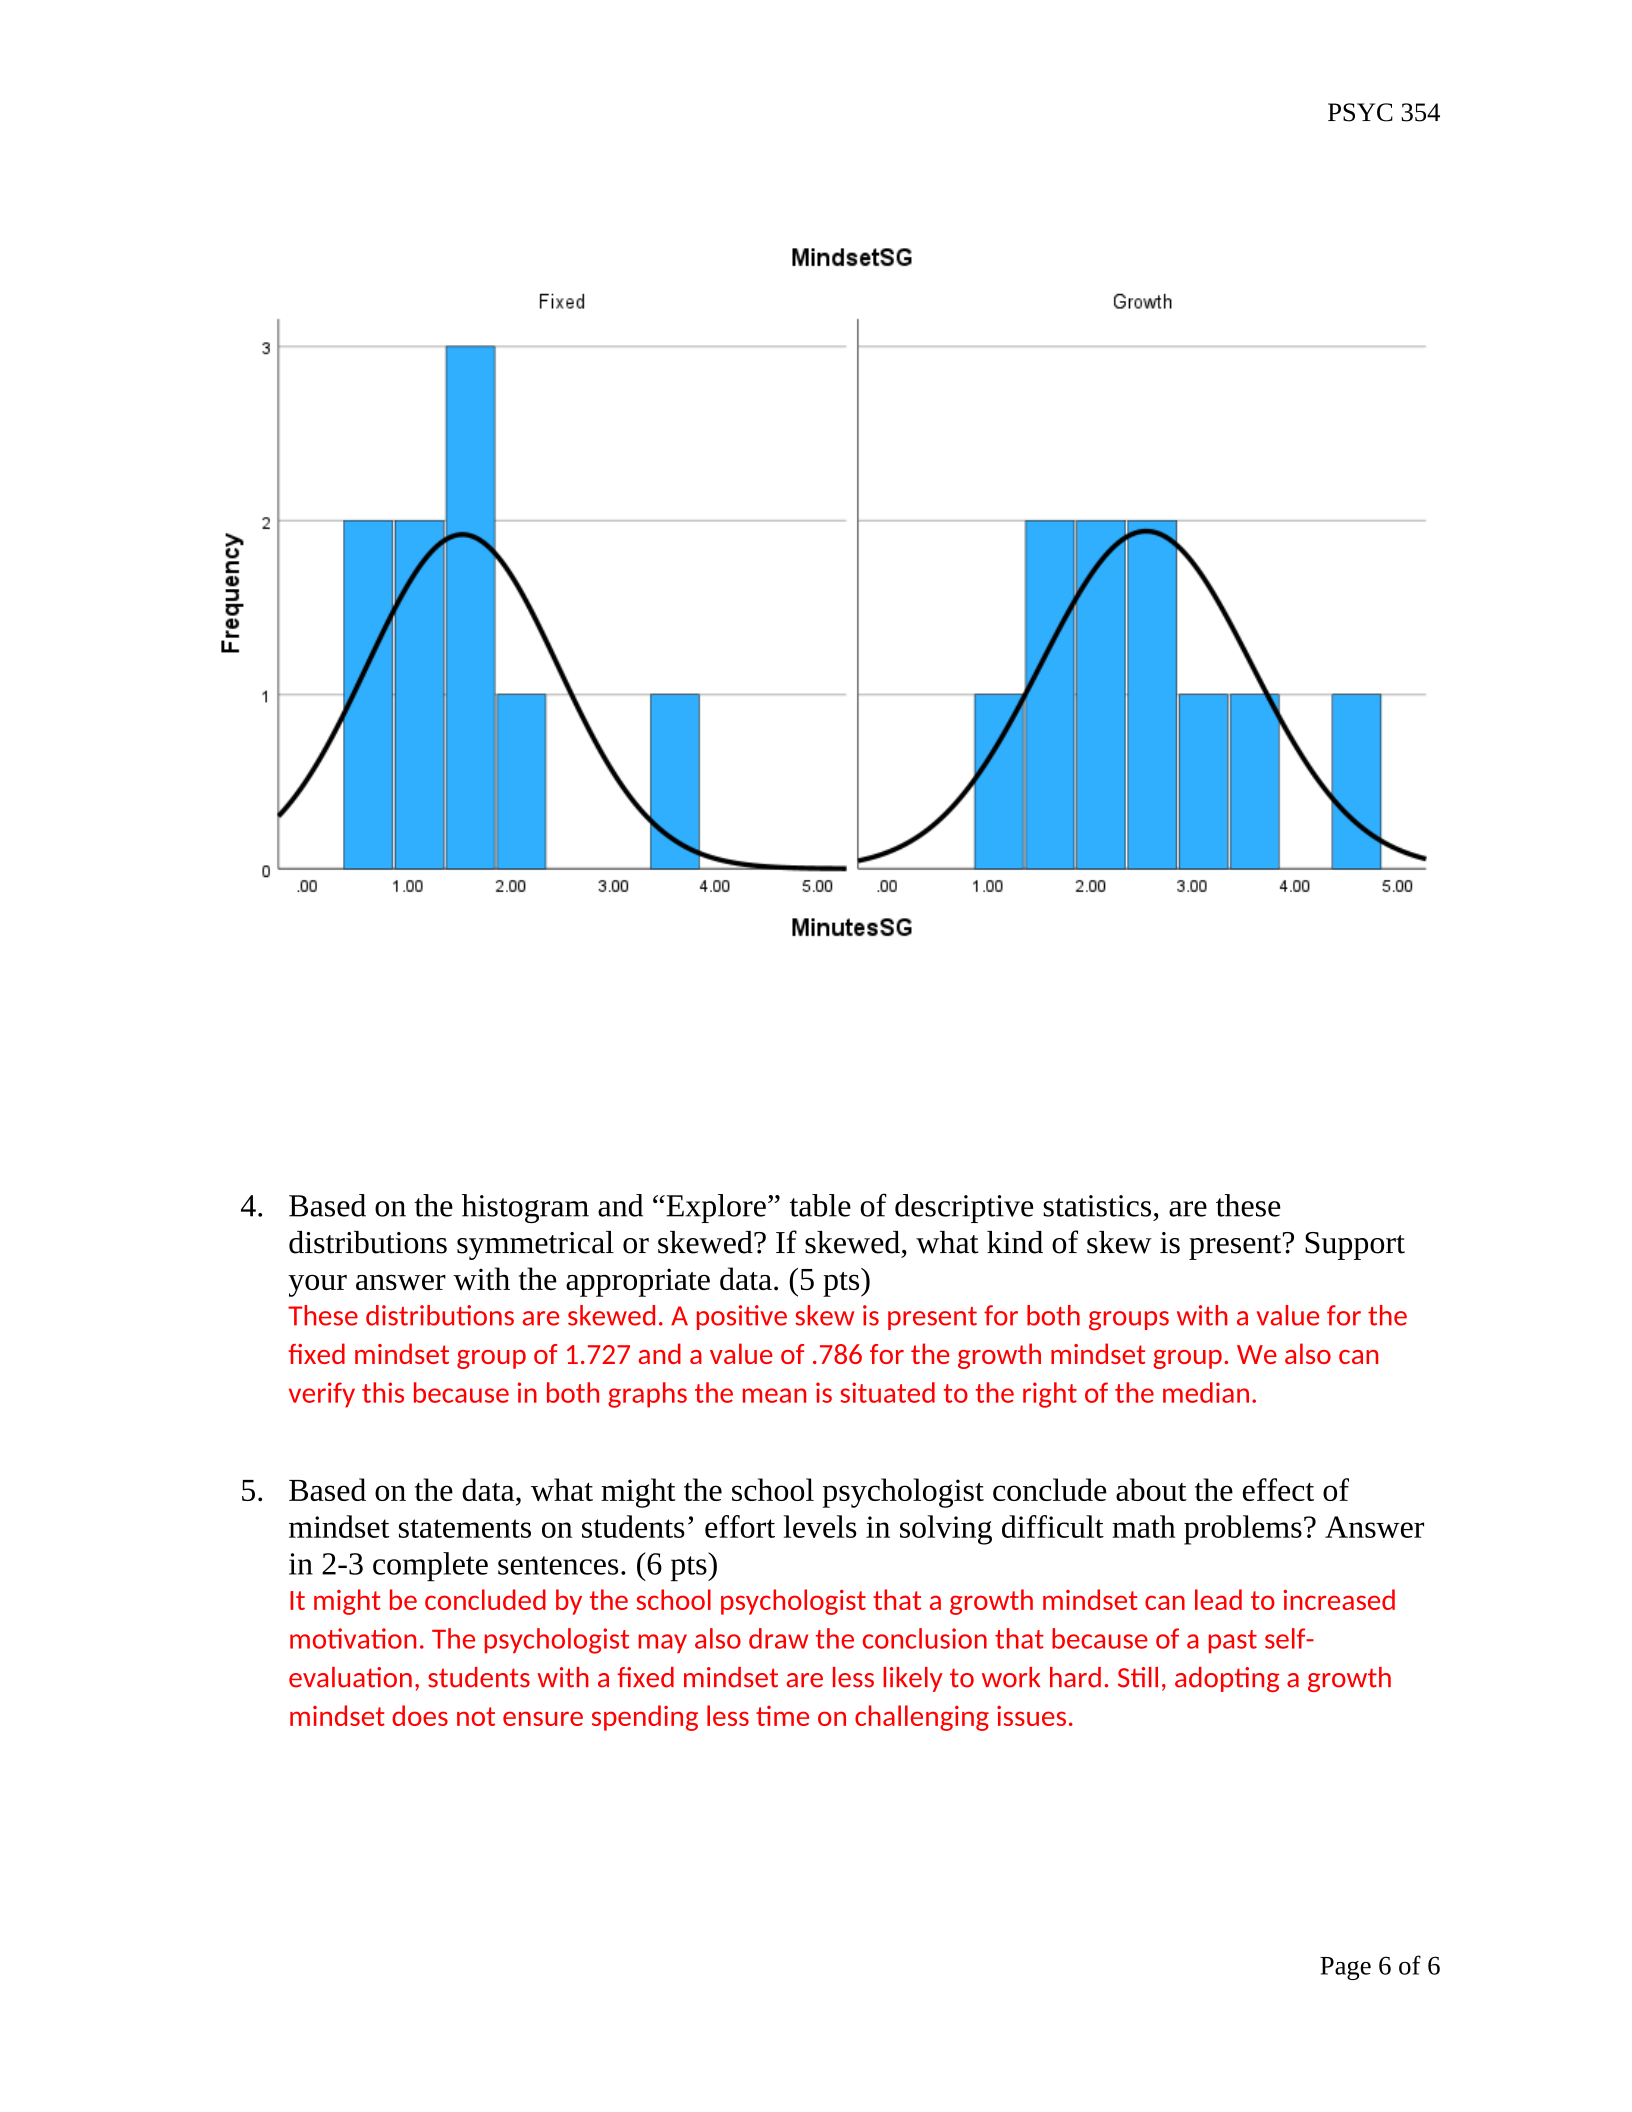
3. Using the same data, create a paneled histogram to show the distribution of minutes spent
working on the problem in each sample. Paste the histogram here: (7 pts)
Page 5 of 6
PSYC 354
4. Based on the histogram and “Explore” table of descriptive statistics, are these
distributions symmetrical or skewed? If skewed, what kind of skew is present? Support
your answer with the appropriate data. (5 pts)
These distributions are skewed. A positive skew is present for both groups with a value for the
fixed mindset group of 1.727 and a value of .786 for the growth mindset group. We also can
verify this because in both graphs the mean is situated to the right of the median.
5. Based on the data, what might the school psychologist conclude about the effect of
mindset statements on students’ effort levels in solving difficult math problems? Answer
in 2-3 complete sentences. (6 pts)
It might be concluded by the school psychologist that a growth mindset can lead to increased
motivation. The psychologist may also draw the conclusion that because of a past self-
evaluation, students with a fixed mindset are less likely to work hard. Still, adopting a growth
mindset does not ensure spending less time on challenging issues.
Page 6 of 6
Powered by TCPDF (www.tcpdf.org)

