



MATH 125 - FINITE MATHEMATICS
- Plot and analyze geometric shapes
Question Bank - Set 2
Liberty University
Question 1
Question
Consider the following geometric shape: a circle centered at (3,−2) with a radius
of 5.
(a) Find the equation of the circle in standard form.
(b) Determine the coordinates of the vertices of a square inscribed in this
circle.
(c) Calculate the area of the square.
Solution
(a) To find the equation of the circle in standard form, we use the general
equation of a circle:
(x−h)2+ (y−k)2=r2,
where (h, k) is the center of the circle and ris the radius. Given that the center
is (3,−2) and the radius is 5, we have:
(x−3)2+ (y+ 2)2= 25.
(b) To determine the coordinates of the vertices of a square inscribed in
this circle, we note that the diagonal of the square will be the diameter of the
circle (which is equal to 10 units). The diagonal of a square divides it into two
congruent right triangles, so the sides of the square would be 10
√2= 5√2 units.
The vertices of the square would lie on the circle, so by considering the distances
from the center of the circle, we find the four vertices: (3 ±5√2,−2±5√2).
(c) The area of a square is given by A=s2, where sis the length of a side.
In this case, s= 5√2, so the area of the square is:
A= (5√2)2= 50.
Thus, the area of the square inscribed in the given circle is 50 square units.

Question 2
Question
Consider the following parametric equations for a curve in the xy-plane:
x= 2 sin(t), y = 3 cos(t),0≤t≤2π.
(a) Plot the curve generated by the parametric equations. (b) Determine the
equation of any tangent lines to the curve at the points where t=π
2. (c) Find
the area enclosed by the curve.
Solution
(a) To plot the curve, we can eliminate the parameter tand express yin terms
of x:
y= 3 cos arcsin x
2= 3r1−x
22.
This equation represents the top half of an ellipse centered at the origin with
semi-major axis of 3 units along the y-axis and semi-minor axis of 2 units along
the x-axis. The plot of the curve is the top half of this ellipse.
(b) To find the equation of the tangent lines at t=π
2, we need to find the
slope of the curve at this point. The slope of the curve at any point is given by
dy
dx =dy/dt
dx/dt .
dy
dt =−3 sin(t),dx
dt = 2 cos(t).
At t=π
2,dy
dt =−3, dx
dt = 0, so the slope is undefined. This means the tangent
line at this point is vertical and its equation is x= 2.
(c) To find the area enclosed by the curve, we integrate 1
2y dx over one period
of the curve:
Area = Z2π
0
1
2·3 cos(t)·2 cos(t)dt =Z2π
0
3 cos2(t)dt.
Using the double angle identity cos(2t) = 2 cos2(t)−1, we can rewrite the
integral as:
Area = 3
2Z2π
0
(1 + cos(2t)) dt =3
2t+1
2sin(2t)
2π
0
=9π
2.
Therefore, the area enclosed by the curve is 9π
2.
Question 3
Question
Consider the two-dimensional region in the xy-plane bounded by the curves
y=x2and y= 2x−x2. Calculate the area of the region enclosed by these
curves.
2

Solution
To find the area of the region bounded by the curves y=x2and y= 2x−x2,
we first need to determine the points of intersection of these two curves.
Step 1: Find the points of intersection Setting x2= 2x−x2gives us
2x= 2x2, which simplifies to x(2 −2x) = 0. So, x= 0 or x= 1.
Step 2: Determine the bounds for integration The region is bounded
by the curves y=x2and y= 2x−x2between x= 0 and x= 1.
Step 3: Compute the area The area enclosed by the curves is given by
the definite integral of the difference of the two curves:
A=Z1
0
((2x−x2)−x2)dx
Step 4: Evaluate the integral
A=Z1
0
(2x−2x2)dx =x2−2
3x31
0
= 1 −2
3=1
3
So, the area of the region enclosed by the curves y=x2and y= 2x−x2is
1
3.
Question 4
Question
Consider the following geometric shapes in the coordinate plane: a circle cen-
tered at (2,−1) with radius 3, and a line passing through the points (1,5) and
(4,−2). Determine the points of intersection, if any, between these two shapes.
Solution
Step 1: The equation of the circle can be written in the form (x−h)2+(y−k)2=
r2, where (h, k) are the coordinates of the center and ris the radius. For this
circle, we have (x−2)2+ (y+ 1)2= 9.
Step 2: The equation of the line passing through two points (x1, y1) and
(x2, y2) can be found using the point-slope formula: y−y1=y2−y1
x2−x1(x−x1).
Substituting (1,5) and (4,−2) into this formula, we obtain the equation of the
line as y=−7
3x+26
3.
Step 3: To find the points of intersection between the circle and the line, we
substitute the expression for yfrom the equation of the line into the equation
of the circle. This gives us a quadratic equation in terms of x.
Step 4: Solve the quadratic equation to find the possible x-coordinates of
the points of intersection. These x-coordinates can then be substituted back
into the equation of the line to find the corresponding y-coordinates.
Step 5: Finally, check if the points of intersection lie on both the circle and
the line. If they do, then those points are the actual points of intersection.
Otherwise, there are no points of intersection between the circle and the line.
3
Question 5
Question
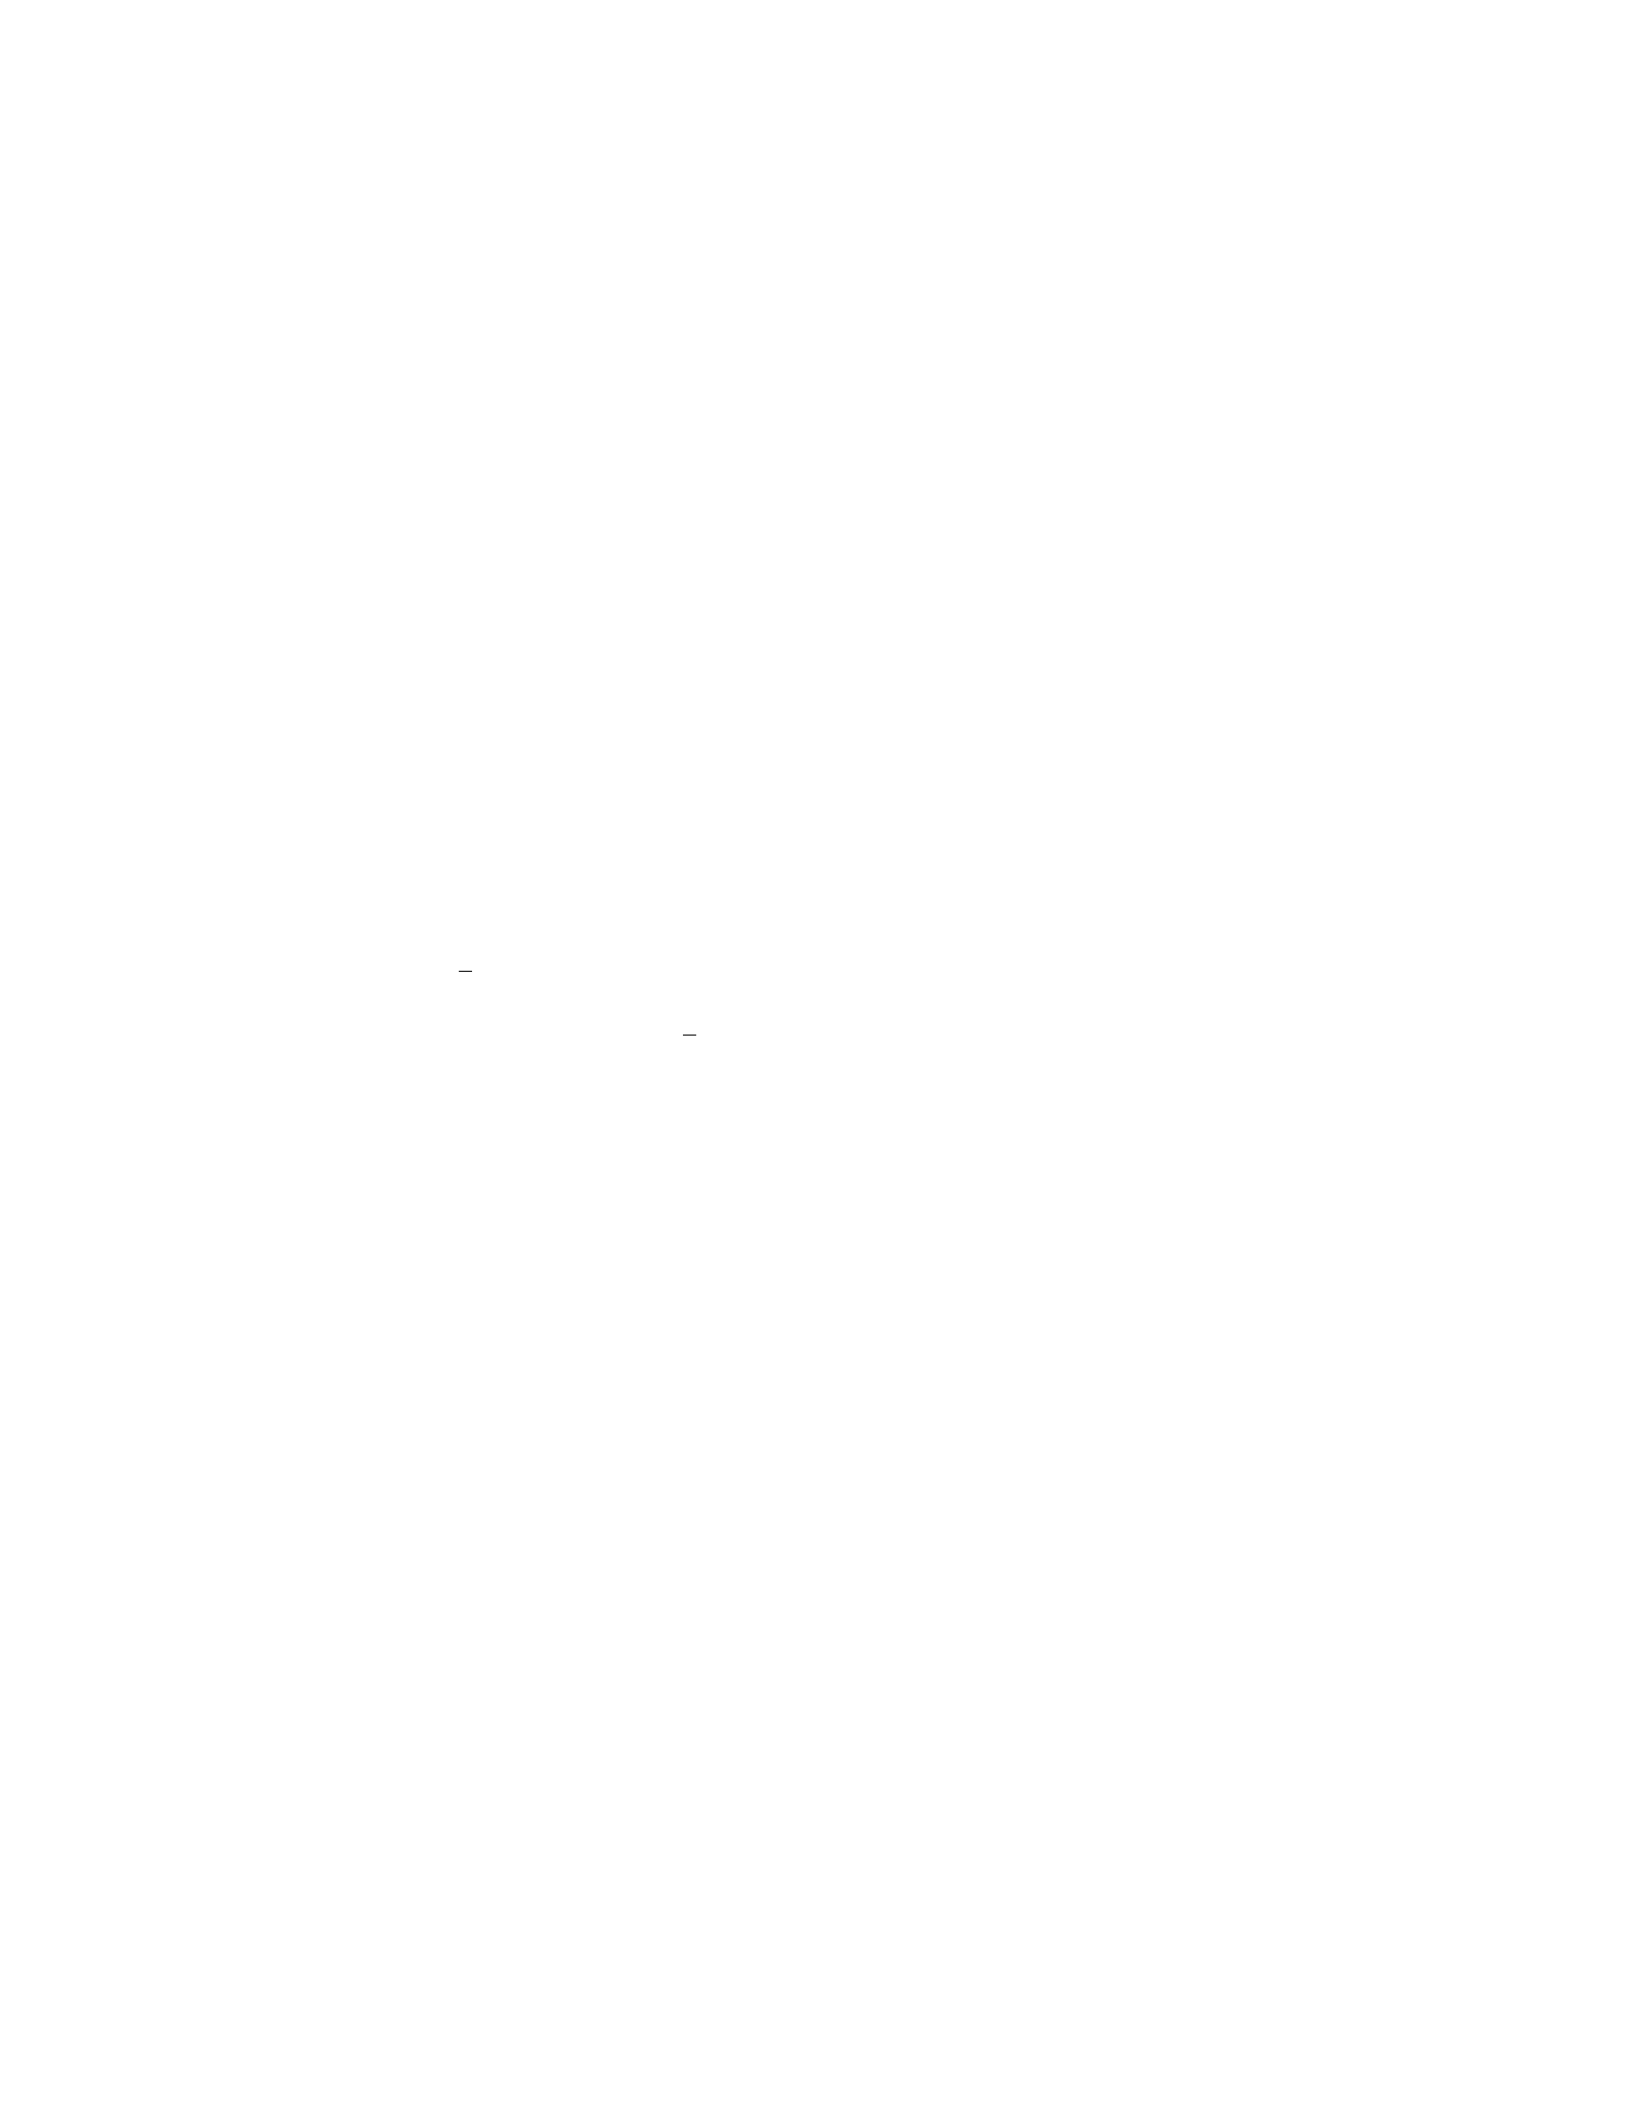
Consider the geometric shape in the xy-plane defined by the following inequal-
ities:
x2−4x+y2+ 2y≤0
x+y≤4
x≥0
Sketch and analyze the geometric shape formed by the above inequalities.
Solution
To analyze the given geometric shape defined by the system of inequalities, let’s
break it down step by step:
Step 1: First, let’s examine the boundary of the region. To find the boundary
where the inequalities become equalities, we set each inequality to equality and
solve for xand y. For x2−4x+y2+ 2y= 0, we complete the square to rewrite
it as (x−2)2+ (y+ 1)2= 5. This represents a circle centered at (2,−1) with
radius √5. For x+y= 4, the boundary line passes through (4,0) and (0,4).
Step 2: Now, we will sketch the boundary of the region. The circle with
center (2,−1) and radius √5 is sketched, along with the line x+y= 4. This
boundary divides the plane into different regions.
Step 3: Next, we will check the regions defined by the given inequalities to
determine the solution set. Evaluating the inequalities at a test point in each
region allows us to determine the valid solution set. For example, we can test
the region below the circle but above the line by plugging in (0,0) into the
inequalities. We find that all inequalities are satisfied in this region.
Step 4: Finally, we summarize that the geometric shape defined by the given
inequalities is the closed region bounded by the circle (x−2)2+ (y+ 1)2= 5,
the line x+y= 4, the x-axis, and the y-axis. This region includes the center of
the circle and is the solution set.
Therefore, the solution is the region enclosed by the circle (x−2)2+(y+1)2=
5, the line x+y= 4, the x-axis, and the y-axis.
Question 6
Question
Consider the region Din the xy-plane bounded by the curve y=x2and the
line y=x+ 2. Sketch the region Dand calculate the area enclosed by the curve
and the line.
4

Solution
To find the area enclosed by the curve y=x2and the line y=x+ 2, we first
need to determine the points of intersection.
Step 1: Find the points of intersection.
Setting x2=x+ 2, we have:
x2−x−2=0
Factoring the quadratic equation, we get:
(x−2)(x+ 1) = 0
So, x= 2 or x=−1.
Therefore, the points of intersection are at (−1,1) and (2,4).
Step 2: Sketch the region D
The region Dis enclosed by the curve y=x2and the line y=x+ 2. It lies
between the x-values −1 and 2.
xy2;2y=x+ 2
Step 3: Calculate the area enclosed by the curve and the line.
The area enclosed by the two curves can be found by integrating the differ-
ence of the two functions over the interval [−1,2]:
Area = Z2
−1
(x+ 2 −x2)dx
Now, we compute the integral:
Area = x2
2+ 2x−x3
32
−1
=22
2+ 2(2) −23
3−(−1)2
2+ 2(−1) −(−1)3
3
= (2 + 4 −8
3)−(1
2−2 + 1
3)
=17
6
Therefore, the area enclosed by the curve y=x2and the line y=x+ 2 is
17
6square units.
Question 7
Question
Consider the geometric shape defined by the equation x2+y2+z2−x−y−z= 0.
Plot and analyze this geometric shape.
5

Solution
To begin, we rewrite the given equation in standard form by completing the
square for each variable:
x2−x+1
22
+y2−y+1
22
+z2−z+1
22
=1
22
+1
22
+1
22
Simplifying, we have:
(x−1
2)2+ (y−1
2)2+ (z−1
2)2=3
4
Step 1: The equation defines a sphere with center (1
2,1
2,1
2) and radius
q3
4=√3
2.
Step 2: We now analyze the properties of the sphere. - Center: The
center of the sphere is at (1
2,1
2,1
2). - Radius: The radius of the sphere is √3
2.
-Surface Area: The surface area of a sphere is given by 4πr2, where ris the
radius. Thus, the surface area of this sphere is 4π√3
22= 3π. - Volume: The
volume of a sphere is given by 4
3πr3. Therefore, the volume of this sphere is
4
3π√3
23=π√3
2.
Hence, the given equation represents a sphere with center (1
2,1
2,1
2) and radius
√3
2. This sphere has a surface area of 3πsquare units and a volume of π√3
2cubic
units.
Question 8
Question
Consider the following parametric equations:
x= 2 sin(t), y = 3 cos(t)
(a) Sketch the curve formed by these parametric equations in the xy-plane.
(b) Determine the equation of the tangent line to the curve at the point
where t=π
4.
Solution
(a) To sketch the curve, we can eliminate the parameter tby eliminating sine
and cosine. Since sin2(t) + cos2(t) = 1, we have:
x2= 4 sin2(t)
y2= 9 cos2(t)
6

Now, substituting x2and y2into the equation sin2(t) + cos2(t) = 1 gives us:
x2
4+y2
9= 1
This equation represents an ellipse with major axis along the y-axis and minor
axis along the x-axis.
(b) To find the equation of the tangent line at t=π
4, we first need to find
the coordinates of the point on the curve at this tvalue. Substituting t=π
4
into the parametric equations gives:
x= 2 sin π
4= 2 1
√2=√2
y= 3 cos π
4= 3 1
√2=3
√2
The point on the curve at t=π
4is (√2,3
√2).
To find the slope of the tangent line, we differentiate xand ywith respect
to t:dx
dt = 2 cos(t)
dy
dt =−3 sin(t)
At t=π
4:
dx
dt t=π
4
= 2 cos π
4=√2
dy
dt t=π
4
=−3 sin π
4=−3
√2
Therefore, the slope of the tangent line at t=π
4is dy
dx =−3/√2
√2=−3
2.
Using the point-slope form of the equation of a line, the equation of the
tangent line is:
y−3
√2=−3
2x−√2
Question 9
Question
Consider the following parametric equations for a curve in the xy-plane:
x(t) = 2 cos(t), y(t) = sin(t), t ∈[0,2π].
Plot the curve represented by these parametric equations and determine the
points of intersection with the x-axis.
7

Solution
To plot the curve represented by the parametric equations x(t) = 2 cos(t) and
y(t) = sin(t), we will vary the value of tfrom 0 to 2π.
Step 1: Plotting the curve Let’s compute the values of xand yfor various
values of t.
t0π
4
π
2
3π
4π5π
4
3π
2
7π
4
x2√2 0 −√2 -2 −√20√2
y0 1 1 1 0 -1 -1 -1
Plotting these points will give us the curve.
Step 2: Plotting the curve
Now, let’s plot the curve represented by the parametric equations x(t) =
2 cos(t) and y(t) = sin(t).
parametric_curve.png
Step 3: Determining points of intersection with the x-axis
The curve intersects the x-axis at the points where y(t) = 0. Thus, we need
to solve sin(t) = 0 for tin the interval [0,2π].
The solutions to sin(t) = 0 are t= 0, π. Therefore, the curve intersects the
x-axis at the points (2,0) and (−2,0).
In conclusion, the curve intersects the x-axis at the points (2,0) and (−2,0).
Question 10
Question
Consider the following functions: 1. f(x) = x3−3x2−4x+ 12 2. g(x) =
x2−4x−5
(a) Plot f(x) and g(x) on the same set of axes.
(b) Determine the points of intersection of f(x) and g(x).
(c) Find the area enclosed by the curve f(x), the x-axis, and the lines x= 1
and x= 5.
Solution
(a) To plot f(x) and g(x) on the same set of axes, we will first graph each
function separately and then overlay the plots.
Step 1: Graph f(x): Since f(x) = x3−3x2−4x+ 12, we first find the
critical points by setting f′(x) = 0:
f′(x)=3x2−6x−4
8

Setting f′(x) = 0 gives us:
3x2−6x−4=0
Solving for x, we find x=−1 and x=4
3as critical points.
Step 2: Graph g(x): Since g(x) = x2−4x−5, we can easily graph this
quadratic function.
Step 3: Overlay the plots of f(x) and g(x):
Now, we overlay the plots of f(x) and g(x) on the same set of axes to visualize
their intersection points.
(b) To determine the points of intersection, we solve f(x) = g(x):
x3−3x2−4x+ 12 = x2−4x−5
Rearranging the terms gives us:
x3−4x2+x+ 7 = 0
One of the roots of this equation is x= 1.
To find the other roots, we divide the cubic polynomial by (x−1) using
polynomial long division or synthetic division. This will give us a quadratic
equation that can be solved to find the other roots.
(c) To find the area enclosed by the curve f(x), the x-axis, and the lines
x= 1 and x= 5, we calculate the definite integral of |f(x)|between x= 1 and
x= 5. This will give us the total area enclosed by the curve.
Question 11
Question
Consider the following geometric figure: a square with side length sand an
inscribed circle. Let Asand Acdenote the areas of the square and circle,
respectively. Express the ratio Ac
Asin terms of s.
Solution
Step 1: Find the area of the square.
The area of a square with side length sis given by As=s2.
Step 2: Find the area of the circle inscribed in the square.
The circle is inscribed in the square, so its diameter is equal to the side length
of the square, which is s. The radius of the circle is thus r=s
2. The area of the
circle is Ac=πr2=πs
22=πs2
4.
Step 3: Determine the ratio of the areas.
Now we can express the ratio of the areas as:
Ac
As
=
πs2
4
s2=π
4
Therefore, the ratio Ac
Asis π
4in terms of s.
9
Question 12
Question
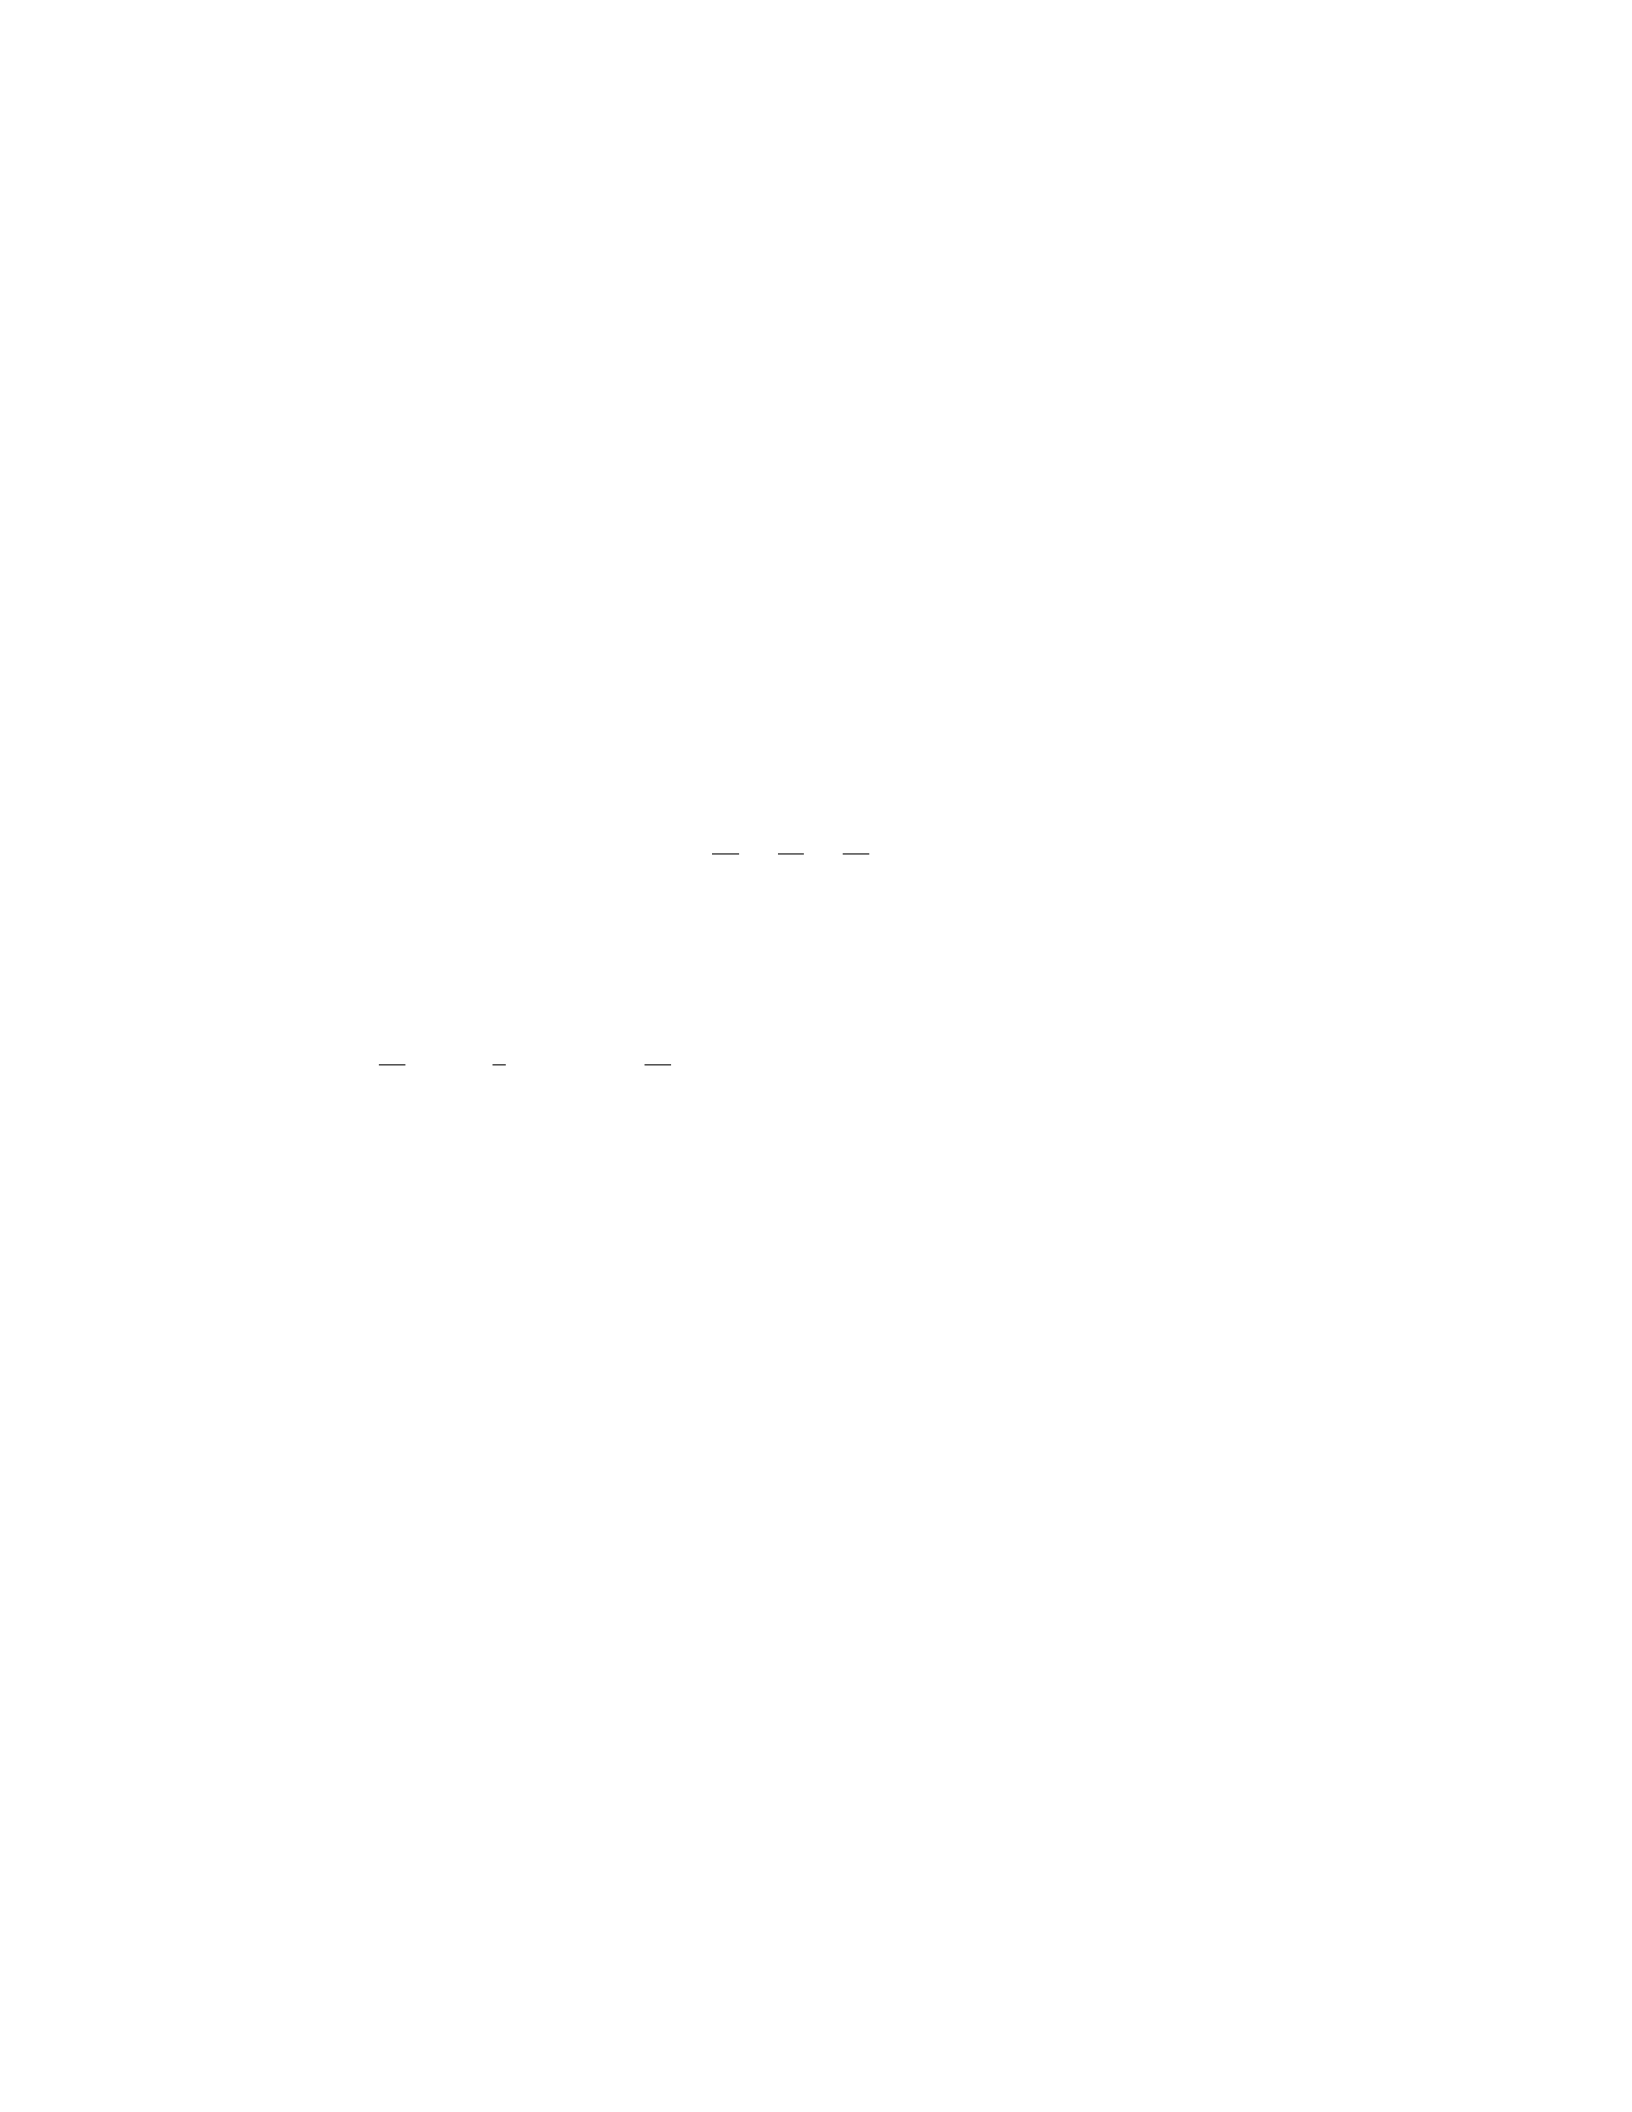
Consider the geometric shape defined by the equation x2+ 4y2+z2= 16.
Determine the type of shape represented by this equation and sketch its graph.
Identify any important features of the shape, such as its center, axes, and asymp-
totes.
Solution
Step 1: To determine the type of shape represented by the equation x2+ 4y2+
z2= 16, we can rewrite it in standard form. Since the coefficients of x2,y2, and
z2are positive, this suggests that the shape is an ellipsoid.
Step 2: We rewrite the equation by dividing each term by 16:
x2
16 +y2
4+z2
16 = 1
Step 3: Next, we identify the center of the ellipsoid. The center is at (h, k, l)
where h= 0, k= 0, and l= 0. Thus, the center of the ellipsoid is at the origin
(0,0,0).
Step 4: We find the semi-axes lengths of the ellipsoid. The semi-axes lengths
along the x-axis, a, along the y-axis, b, and along the z-axis, c, are given by
√16 = 4, √4 = 2, and √16 = 4 respectively.
Step 5: Now we sketch the graph of the ellipsoid. The ellipsoid is centered
at the origin with semi-axes lengths 4, 2, and 4 along the x-, y-, and z-axes,
respectively. The ellipsoid has no asymptotes and is symmetric about each axis.
Question 13
Question
Consider the following set of points in the coordinate plane:
S={(x, y)|x2+y2= 9, x ≥0, y ≥0}
Plot the set Sin the coordinate plane and analyze the geometric shape
formed by these points.
Solution
1. To plot the set S, we first note that the equation x2+y2= 9 represents a circle
with radius 3 centered at the origin. However, since we are only considering
points where both xand yare non-negative, we are only interested in the top-
right quarter of the circle.
2. We can now proceed to plot the set Sin the coordinate plane.
10

xy33
3. The geometric shape formed by the set Sis a quarter circle in the first
quadrant of the coordinate plane, with radius 3 and the x-axis and y-axis as its
boundaries.
4. This shape is often referred to as a quarter circle.
Question 14
Question
Consider the following piecewise-defined function:
f(x) = (x2if x < 0,
2x+ 1 if x≥0.
Plot the graph of the function f(x) and analyze the behavior of the func-
tion for both x < 0 and x≥0. Identify any critical points, intervals of in-
crease/decrease, local extrema, and concavity.
Solution
To plot the graph of the function f(x), we need to consider two cases: x < 0
and x≥0.
Case 1: x < 0 For x < 0, the function is given by f(x) = x2. This is a
simple parabolic graph which opens upwards. The critical point for this part of
the graph occurs at x= 0 where the minimum of the parabola is located.
Case 2: x≥0 For x≥0, the function is given by f(x)=2x+ 1. This is
a linear function with a slope of 2 and a y-intercept of 1. There are no critical
points for this linear function as it is a straight line.
Now, let’s plot the graphs for both pieces of the function on the same coor-
dinate system to get a complete picture of f(x).
xf(x)2; [domain = 0 : 4, samples = 100, color =red, ]2 ∗x+ 1;
From the graph, we can see that the function f(x) behaves differently for
x < 0 and x≥0: - For x < 0, f(x) is a parabola opening upwards with a
minimum at x= 0. - For x≥0, f(x) is a straight line with a positive slope.
Therefore, the function f(x) has a local minimum at x= 0 and is increasing
for x < 0 and x≥0. It is concave up for x < 0 and has no concavity for x≥0.
11

Question 15
Question
Consider the following system of equations:
(x2+y2= 4
y=x2
Plot and analyze the geometric shapes represented by these equations.
Solution
Step 1: To analyze the shapes represented by the equations, let’s first plot them
on the coordinate plane.
Step 2: The first equation x2+y2= 4 represents a circle with center at the
origin and radius 2.
Step 3: The second equation y=x2represents a parabola opening upwards
with vertex at the origin.
Step 4: Now, let’s plot both the circle and the parabola on the same coor-
dinate plane to analyze their intersection points.
Step 5: From the plot, we can see that the circle intersects the parabola at
two points: (−1,1) and (1,1).
Step 6: Therefore, the geometric shapes represented by the given system of
equations are a circle with center at the origin and radius 2, and a parabola
opening upwards with vertex at the origin. They intersect at the points (−1,1)
and (1,1).
Question 16
Question
Consider the region bounded by the curves y=x3and y=x2in the first
quadrant. Plot the region and find the area enclosed by these curves.
Solution
Step 1: To find the points of intersection between the curves y=x3and y=x2,
we set x3=x2and solve for x.
x3=x2
x3−x2= 0
x2(x−1) = 0
x= 0 or x= 1
12

Step 2: Next, we find the area enclosed by the curves by integrating the
difference x3−x2from 0 to 1.
Area = Z1
0
(x3−x2)dx
=x4
4−x3
31
0
=1
4−1
3−(0 −0)
=1
12
Therefore, the area enclosed by the curves y=x3and y=x2in the first
quadrant is 1
12 .
Question 17
Question
Plot and analyze the geometric shape defined by the equation x2+y2−6x+
4y−12 = 0.
Solution
Step 1: Complete the square for xand y.
We rearrange the terms in the equation to group xand yterms together:
(x2−6x)+(y2+ 4y) = 12
To complete the square for x, we add (6/2)2= 9 inside the parentheses:
(x2−6x+ 9) + (y2+ 4y) = 12 + 9
To complete the square for y, we add (4/2)2= 4 inside the parentheses:
(x2−6x+ 9) + (y2+ 4y+ 4) = 12 + 9 + 4
This simplifies to:
(x−3)2+ (y+ 2)2= 25
Step 2: Identify the center and radius.
Comparing the equation to the standard form of a circle (x−h)2+(y−k)2=
r2, we see that the center is at (3,−2) and the radius is 5.
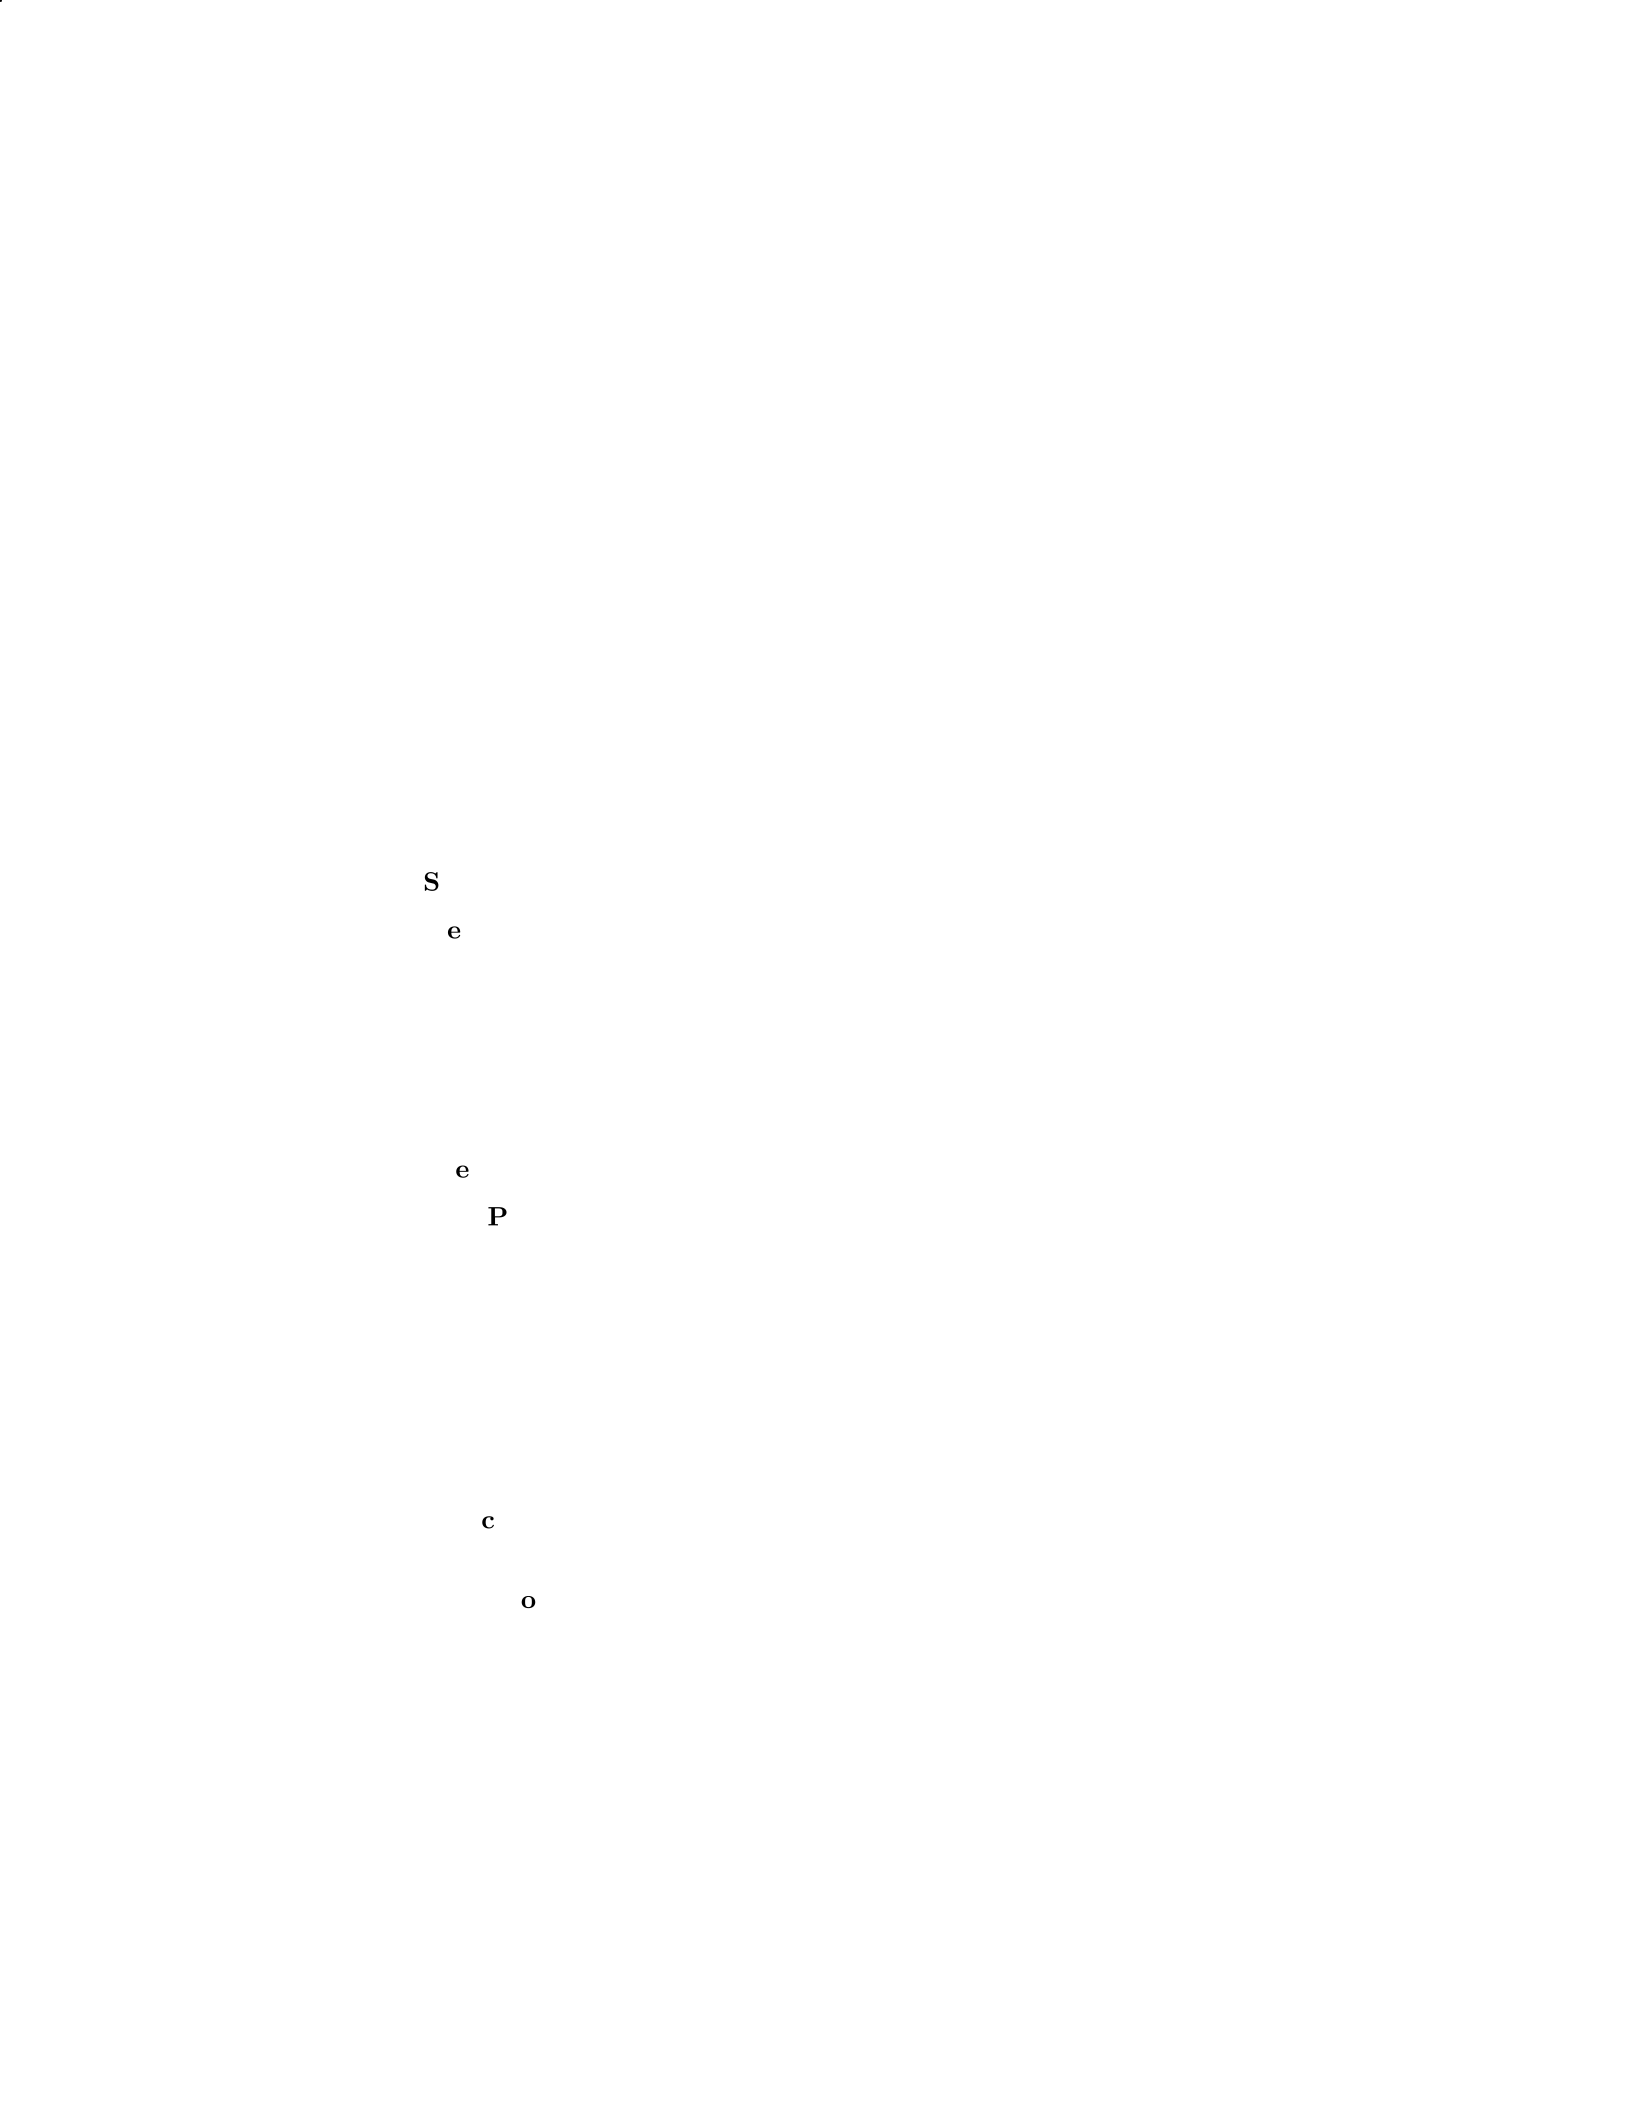
Step 3: Plot the circle.
The circle has center (3,−2) and radius 5.
Step 4: Analyze the circle.
The circle has center (3,−2) and radius 5. It represents all points in the
plane that are equidistant from the center (3,−2).
13
Question 18
Question
Consider the following geometric shapes:
Shape A: A circle with radius 3 centered at the origin.
Shape B: A square with side length 6 centered at the point (2,2).
Shape C: An ellipse centered at the origin with semi-major axis length 4
along the x-axis and semi-minor axis length 2 along the y-axis.
For each shape, sketch the shape on the coordinate plane and analyze its
key properties (e.g., symmetry, intercepts, asymptotes).
Solution
To analyze each shape, we will consider the characteristics of circles, squares,
and ellipses.
Shape A: Circle with radius 3 centered at the origin
Sketch: This circle is centered at the origin and has a radius of 3.
Key Properties:
– Symmetry: The circle is symmetric with respect to both the x-axis
and the y-axis.
– Intercepts: The circle intersects the x-axis at (-3, 0) and (3, 0), and
the y-axis at (0, -3) and (0, 3).
Shape B: Square with side length 6 centered at the point (2, 2)
Sketch: This square is centered at the point (2, 2) and has side length 6.
Key Properties:
– Symmetry: The square is symmetric with respect to both the x-axis
and the y-axis.
– Intercepts: The square intersects the x-axis at (-1, 2) and (5, 2),
and the y-axis at (2, -1) and (2, 5).
Shape C: Ellipse centered at the origin with semi-major axis of
length 4 along the x-axis and semi-minor axis of length 2 along the
y-axis
Sketch: This ellipse is centered at the origin with semi-major axis length
4 along the x-axis and semi-minor axis length 2 along the y-axis.
Key Properties:
– Symmetry: The ellipse is symmetric with respect to both the x-axis
and the y-axis.
– Intercepts: The ellipse intersects the x-axis at (-4, 0) and (4, 0),
and the y-axis at (0, -2) and (0, 2).
– Asymptotes: There are no asymptotes for an ellipse.
14

Question 19
Question
Consider the following parametric equations:
x(t) = sin(t) + 2 cos(t), y(t) = sin(t)−2 cos(t)
Plot and analyze the geometric shape represented by these parametric equa-
tions.
Solution
To plot and analyze the geometric shape represented by the parametric equa-
tions, we need to eliminate the parameter and find the Cartesian equation of
the curve.
Step 1: Eliminate the parameter tTo eliminate the parameter t, we can
square both equations and add them together to get rid of the trigonometric
functions:
(x(t))2+ (y(t))2= (sin(t) + 2 cos(t))2+ (sin(t)−2 cos(t))2
x2+y2= sin2(t) + 4 sin(t) cos(t) + 4 cos2(t) + sin2(t)−4 sin(t) cos(t) + 4 cos2(t)
x2+y2= 2(sin2(t) + cos2(t)) + 8 cos2(t)
x2+y2= 2 + 8 cos2(t)
Step 2: Analyze the Cartesian equation The Cartesian equation we
found is x2+y2= 2 + 8 cos2(t). This is the equation of a circle centered at the
origin with radius p2 + 8(1) = √10.
Step 3: Plot the geometric shape The geometric shape represented by
the parametric equations is a circle centered at the origin with radius √10.
Therefore, the plot of the geometric shape is a circle centered at the origin
with radius √10.
Question 20
Question
Consider the geometric shape defined by the following equation:
4x2+ 9y2−16x+ 36y−36 = 0
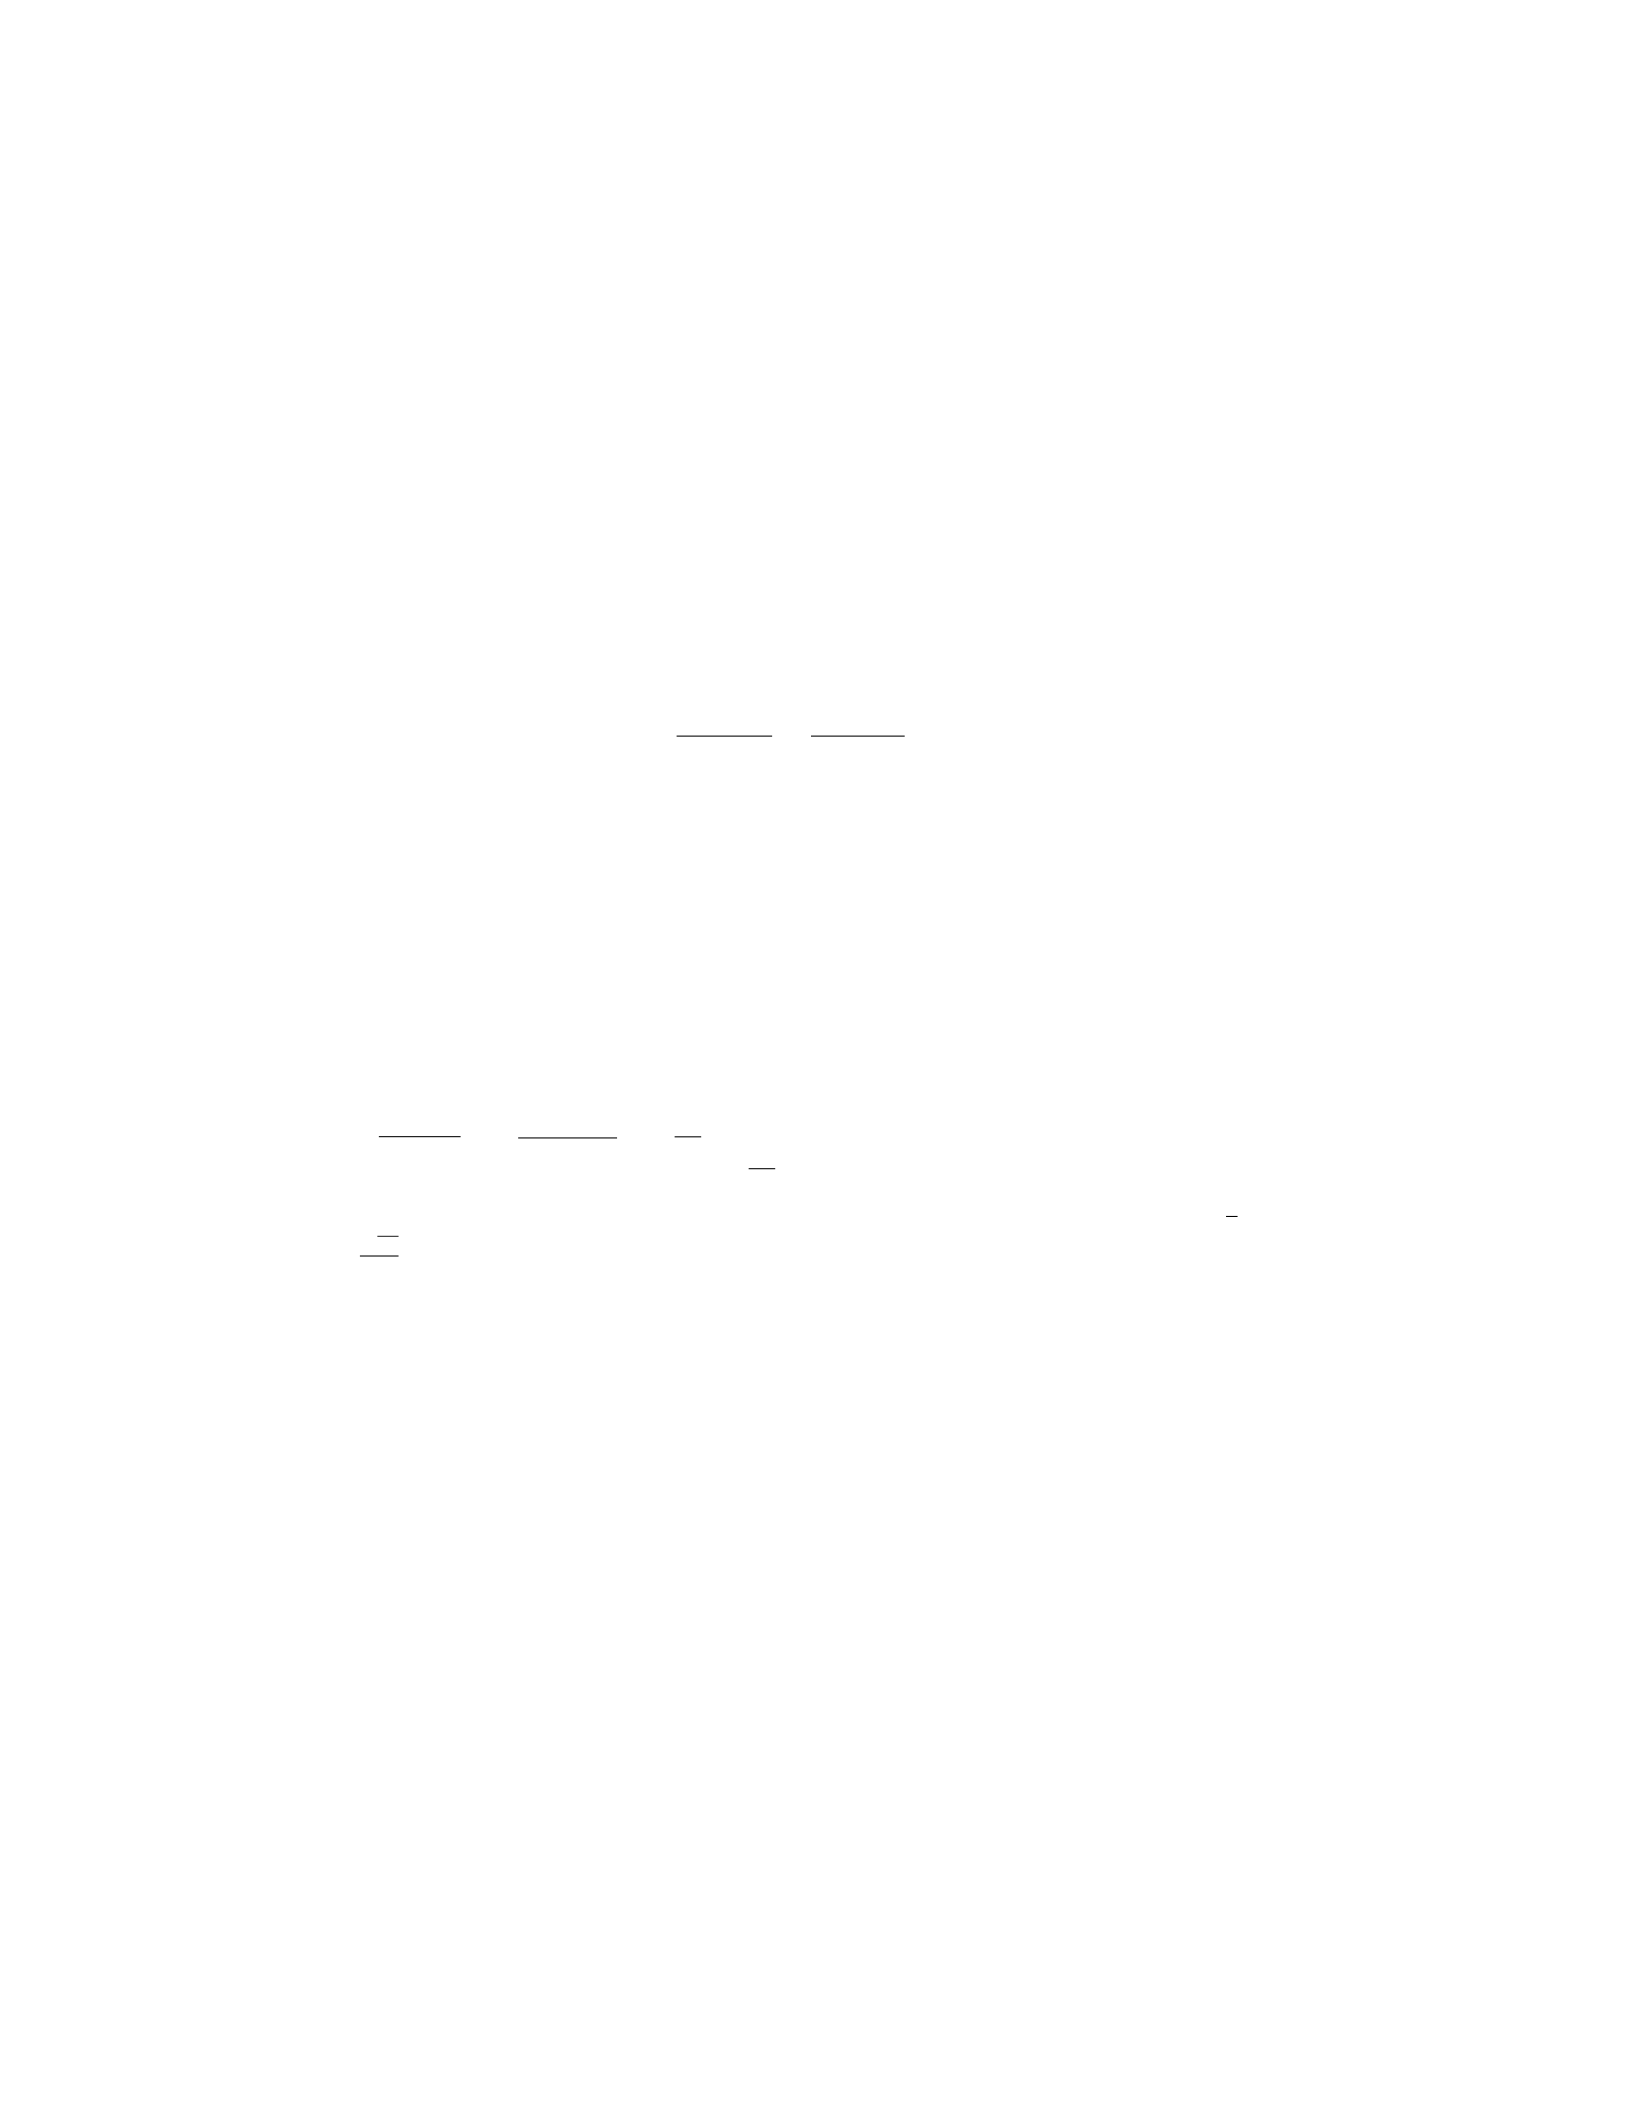
Determine the type of shape the equation represents and plot the shape.
Analyze the characteristics of the shape including the center, major axis, minor
axis, foci, and eccentricity.
15
Solution
Step 1: Rearrange the equation to determine the type of shape.
4x2−16x+ 9y2+ 36y= 36
4(x2−4x) + 9(y2+ 4y) = 36
4(x2−4x+ 4) + 9(y2+ 4y+ 4) = 36 + 4(4) + 9(4)
4(x−2)2+ 9(y+ 2)2= 100
Comparing the equation to the standard form of the ellipse:
(x−h)2
a2+(y−k)2
b2= 1
We can see that this equation represents an ellipse.
Step 2: Identify the center and radii of the ellipse. The center of the ellipse
is (2, -2). The major axis has length 2a= 20 and the minor axis has length
2b= 18. Therefore, a= 10 and b= 9.
Step 3: Determine the major and minor axes. The major axis is along the
x-axis, which means the ellipse is wider horizontally. The endpoints of the major
axis are (2 ±10,−2) = (12,−2) and (−8,−2). The length of the major axis is
20.
The minor axis is along the y-axis. The endpoints of the minor axis are
(2,−2±9) = (2,7) and (2,−11). The length of the minor axis is 18.
Step 4: Find the foci. The distance from the center to the foci is c=
√a2−b2=√100 −81 = √19.
The foci are located at (2 ±√19,−2) ≈(6.36,−2) and (−2.36,−2).
Step 5: Calculate the eccentricity. The eccentricity is given by e=c
a=
√19
10 ≈0.44.
Thus, the given equation represents an ellipse centered at (2, -2) with a
major axis of length 20, a minor axis of length 18, foci at approximately (6.36,
-2) and (-2.36, -2), and an eccentricity of approximately 0.44.
Question 21
Question
Plot and analyze the geometric shape defined by the equation 4x2+ 9y2−8x+
36y−4 = 0.
Solution
Step 1: Rewrite the equation in standard form by completing the square for
both xand yterms.
16

Step 2: Begin with the xterms.
4x2−8x= 4(x2−2x)
= 4(x2−2x+ 1 −1)
= 4((x−1)2−1)
= 4(x−1)2−4
Step 3: Now work on the yterms.
9y2+ 36y= 9(y2+ 4y)
= 9(y2+ 4y+ 4 −4)
= 9((y+ 2)2−4)
= 9(y+ 2)2−36
Step 4: Substitute these results back into the original equation.
4(x−1)2−4 + 9(y+ 2)2−36 −4=0
4(x−1)2+ 9(y+ 2)2= 44
Step 5: Divide by 44 to get the standard form of the equation.
(x−1)2
√44
√42+(y+ 2)2
√44
√92= 1
(x−1)2
11 +(y+ 2)2
4= 1
Step 6: Compare the resulting equation with the standard form of the ellipse,
(x−h)2
a2+(y−k)2
b2= 1. This ellipse has a center at (1,−2), a horizontal axis of
length 2a= 2√11, and a vertical axis of length 2b= 2 ·2 = 4.
Step 7: Thus, the plot is an ellipse centered at (1,−2) with a horizontal axis
of length 2√11 and a vertical axis of length 4.
Question 22
Question
Consider the geometric shape defined by the following equations:
x= 2 cos(t), y = 3 sin(t), z =t
where 0 ≤t≤2π. Plot this shape in 3D space and analyze its properties.
17

Solution
To plot this shape and analyze its properties, we first need to parameterize the
given equations. Let P(t) = (2 cos(t),3 sin(t), t) for 0 ≤t≤2π.
Step 1: Plotting the Shape
We can plot this shape by varying the parameter tfrom 0 to 2π. This will
give us a curve in 3D space. Let’s plot this curve using a graphing software.
Step 2: Analyzing the Shape
From the plot, we observe that the shape defined by the given equations is
a helix. It spirals upwards along the z-axis as tincreases from 0 to 2π.
Step 3: Calculating Length of the Curve
To calculate the length of the curve, we use the formula for the arc length
of a curve in 3D space:
L=Zt2
t1sdx
dt 2
+dy
dt 2
+dz
dt 2
dt
Here, dx
dt =−2 sin(t), dy
dt = 3 cos(t), and dz
dt = 1.
Thus, the length of the curve P(t) from t= 0 to t= 2πis:
L=Z2π
0p(−2 sin(t))2+ (3 cos(t))2+ 12dt
After evaluating this integral, we can find the total length of the helix.
Question 23
Question
Consider the following parametric equations:
x(t) = 2 cos(t)
y(t) = 3 sin(t)
Determine the shape of the curve described by these equations and analyze its
properties.
Solution
Step 1: To find the shape of the curve, we can eliminate the parameter tby
expressing yin terms of x.
y(t) = 3 sin(t)
⇒sin(t) = y
3
Similarly,
x(t) = 2 cos(t)
18
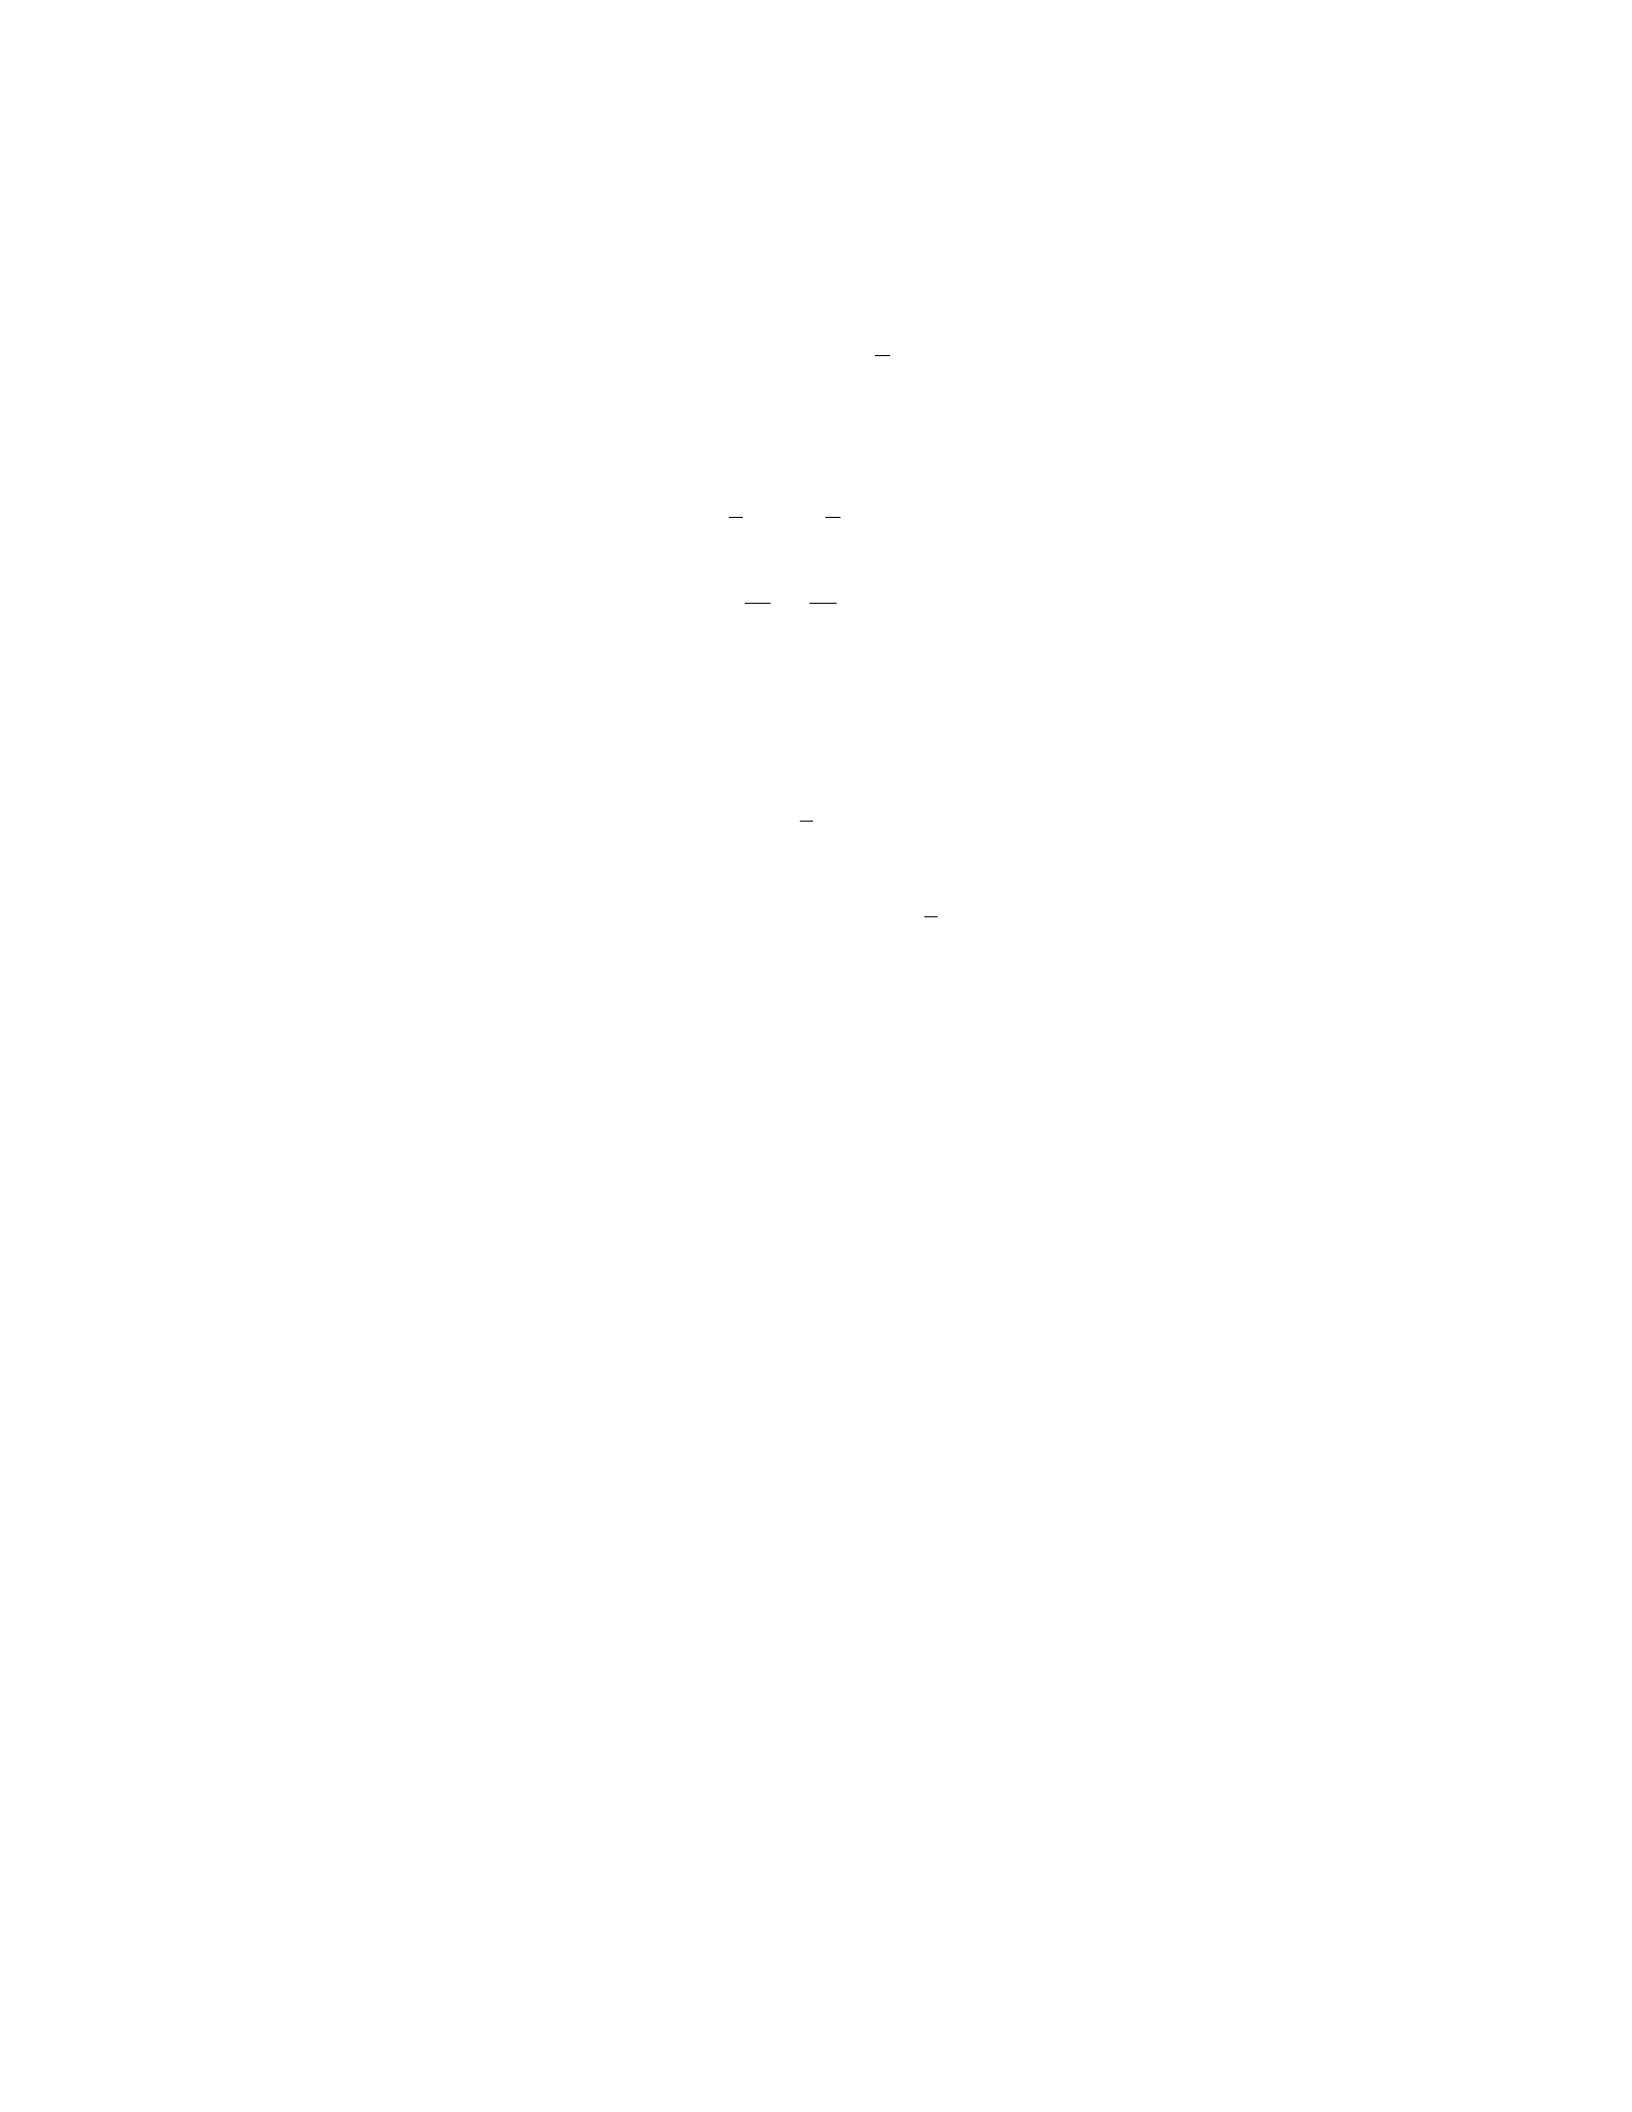
⇒cos(t) = x
2
Step 2: Since sin2(t) + cos2(t) = 1, we can substitute the expressions for
sin(t) and cos(t) into this equation.
y
32+x
22= 1
y2
9+x2
4= 1
4x2+ 9y2= 36
Step 3: The equation 4x2+ 9y2= 36 is the equation of an ellipse centered
at the origin with major axis along the y-axis and minor axis along the x-axis.
Step 4: The major axis has length 2a= 6 and the minor axis has length
2b= 4. Thus, the semi-major axis a= 3 and the semi-minor axis b= 2.
Step 5: The ellipse has foci (0,±√5).
Therefore, the curve described by the parametric equations x(t) = 2 cos(t)
and y(t) = 3 sin(t) is an ellipse centered at the origin with major axis along the
y-axis, minor axis along the x-axis, foci at (0,±√5), semi-major axis a= 3, and
semi-minor axis b= 2.
Question 24
Question
Consider the following geometric shape in the xy-plane:
16x2−24xy + 9y2+ 32x−36y+ 36 = 0
Determine the type of conic section represented by this equation, sketch the
shape, and identify its key features.
Solution
Step 1: Identify the Conic Section
To determine the type of conic section represented by the given equation, we
examine the coefficients of x2,xy, and y2. Since the coefficients of x2and y2
are both positive and the coefficient of xy is negative, the conic section is an
ellipse.
Step 2: Find the Center of the Ellipse
To find the center of the ellipse, we complete the square for both xand yterms.
16(x2+ 2x)−24xy + 9(y2−4y) = −36
16(x+ 1)2+ 9(y−2)2= 36
The center of the ellipse is (−1,2).
19
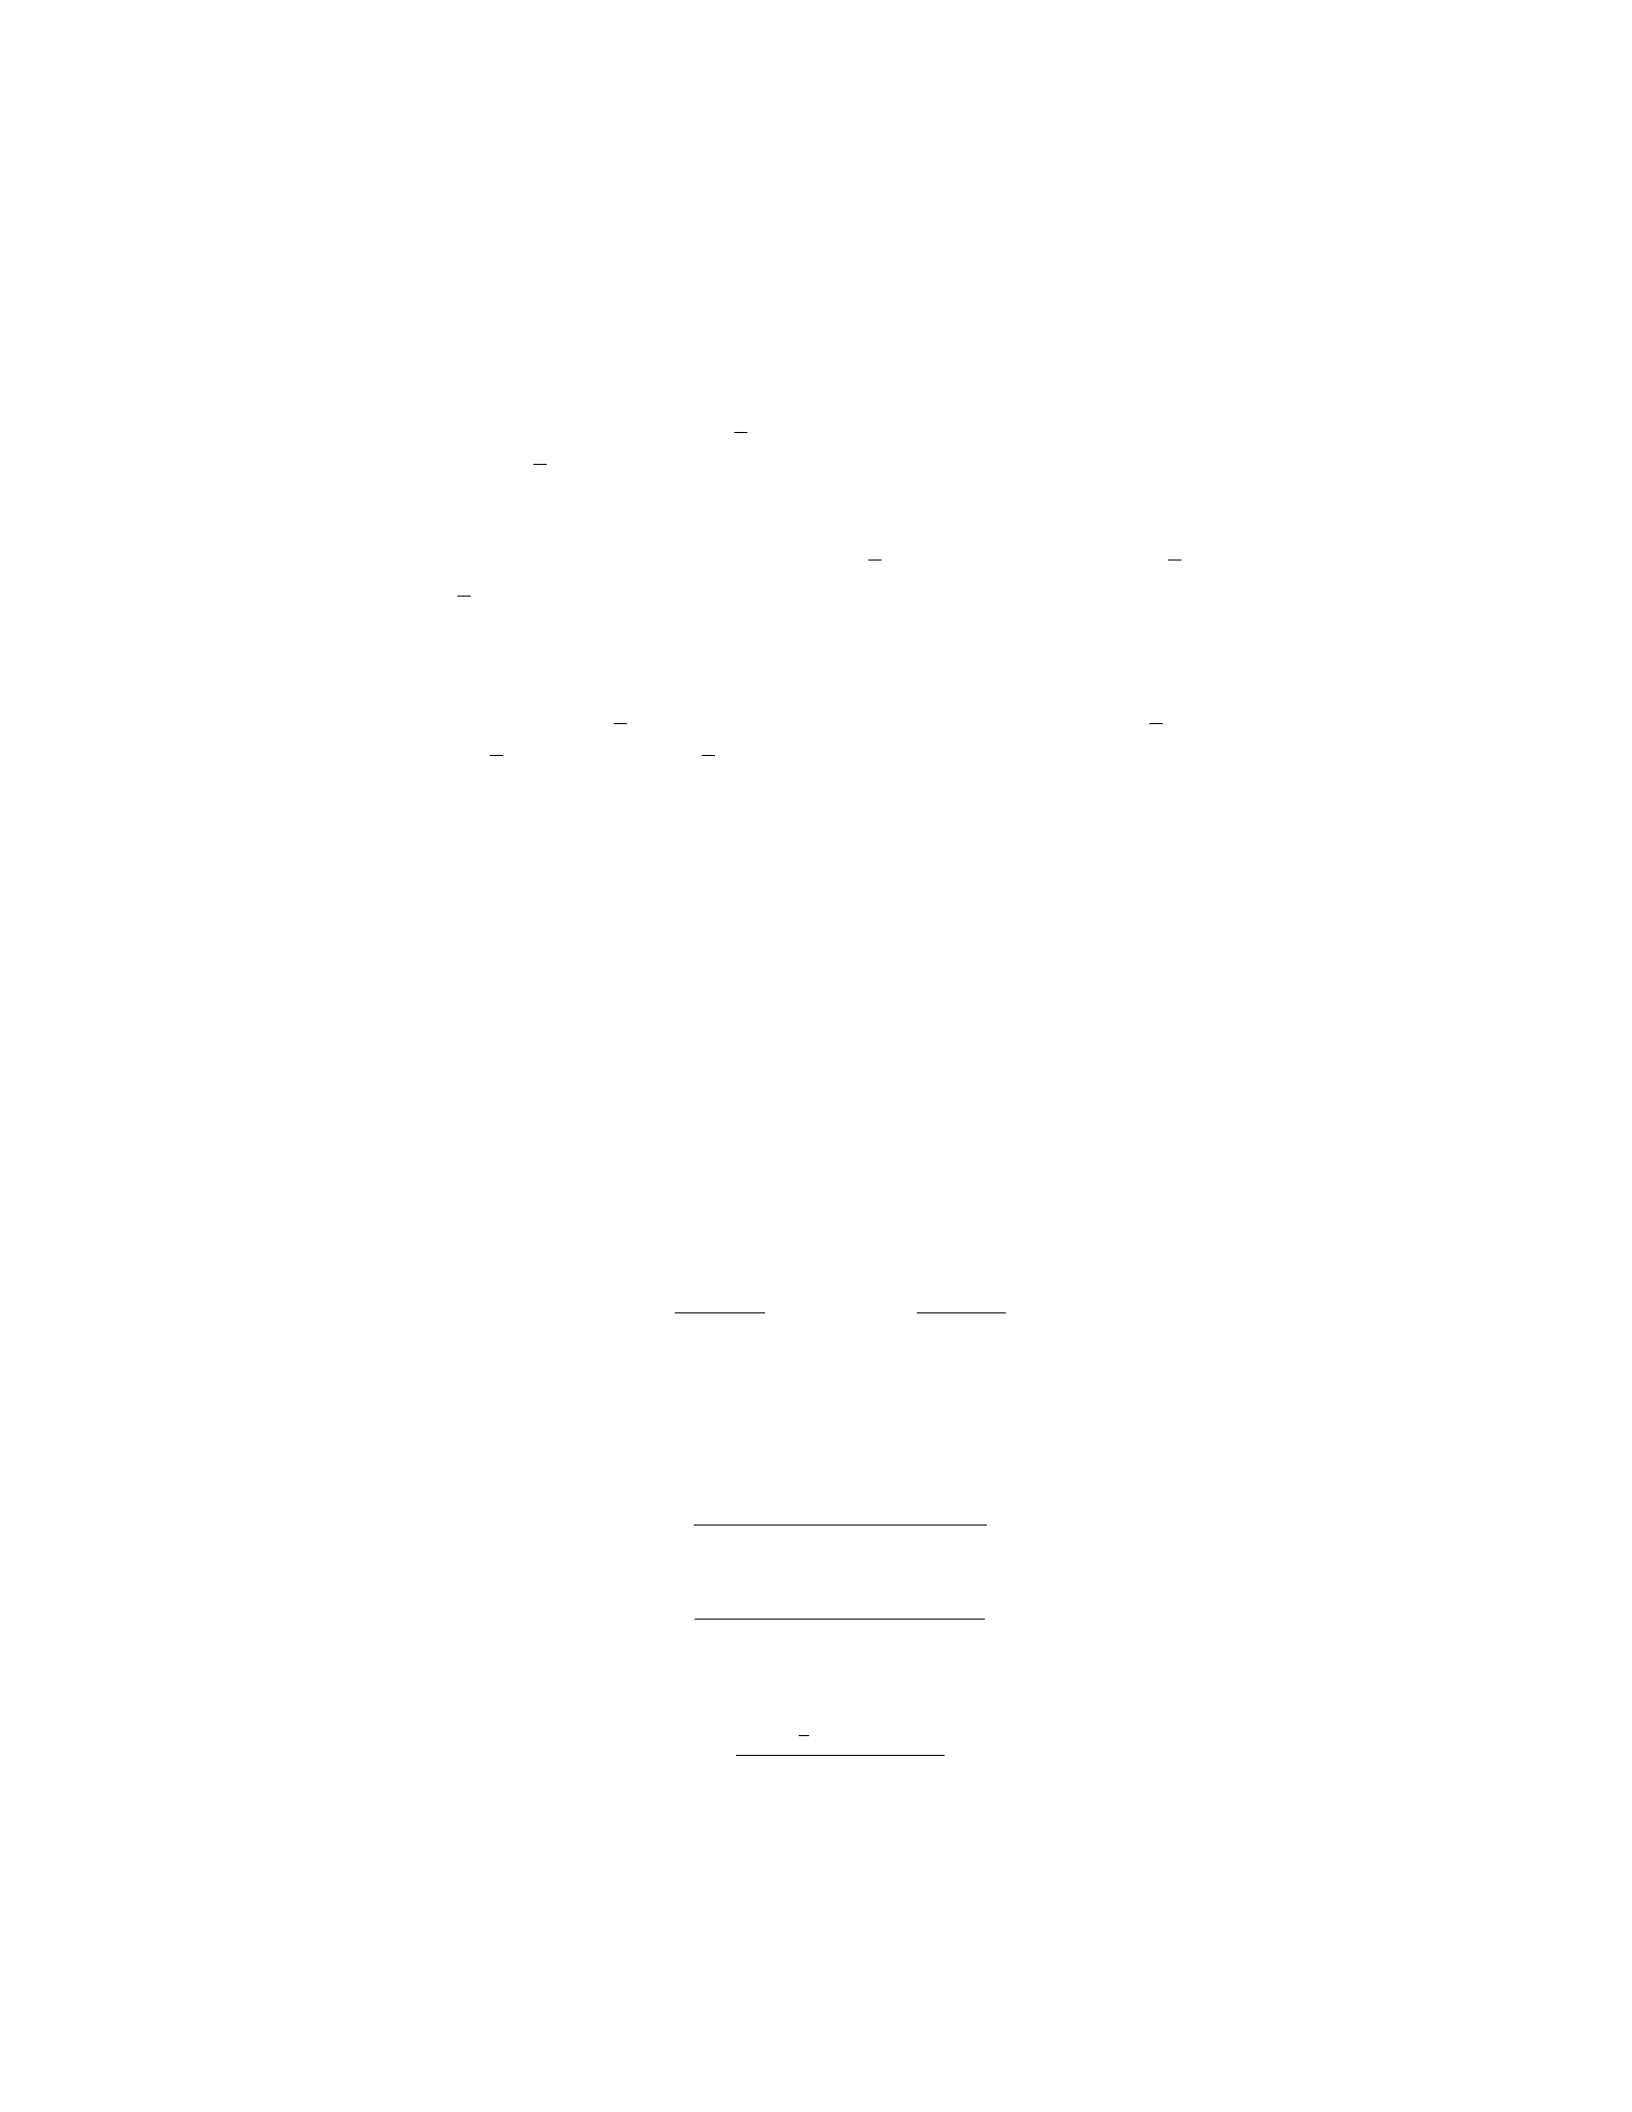
Step 3: Determine the Major and Minor Axes
The major axis of the ellipse corresponds to the larger of the 16 and 9 coefficients.
The minor axis corresponds to the smaller coefficient. So, the major axis is along
the x-axis with length 2a= 2√6 and the minor axis is along the y-axis with
length 2b= 2√4.
Step 4: Find the Foci of the Ellipse
The foci of an ellipse are located at a distance cfrom the center, where c2=
a2−b2. Here, c2= 6 −4 = 2, so c=√2. The foci are −1−√2,2and
−1 + √2,2.
Step 5: Plot and Analyze the Ellipse
With the center, major and minor axes, and foci identified, we can sketch the
ellipse in the xy-plane. The ellipse has center (−1,2), major axis along the
x-axis with length 2√6, minor axis along the y-axis with length 2√4, and foci
at −1−√2,2and −1 + √2,2.
Question 25
Question
Consider the graph of the region defined by x2+y2≤1. Calculate the area of
the region and find the centroid of the region.
Solution
Step 1: To find the area of the region, we will calculate the area of the circle
with radius 1.
Area = π·(radius)2=π·12=π
Step 2: Next, to find the centroid of the region, we will use the formulas:
¯x=Rx·dA
Area and ¯y=Ry·dA
Area
where dA =dx ·dy.
Step 3: For the given region, we will switch to polar coordinates, with x=
r·cos(θ) and y=r·sin(θ). The integral for centroid calculation then becomes:
¯x=R2π
0R1
0(r·cos(θ)) ·r dr dθ
π
¯y=R2π
0R1
0(r·sin(θ)) ·r dr dθ
π
Step 4: Evaluating the integrals, we get:
¯x=R2π
01
3·cos(θ)dθ
π
20
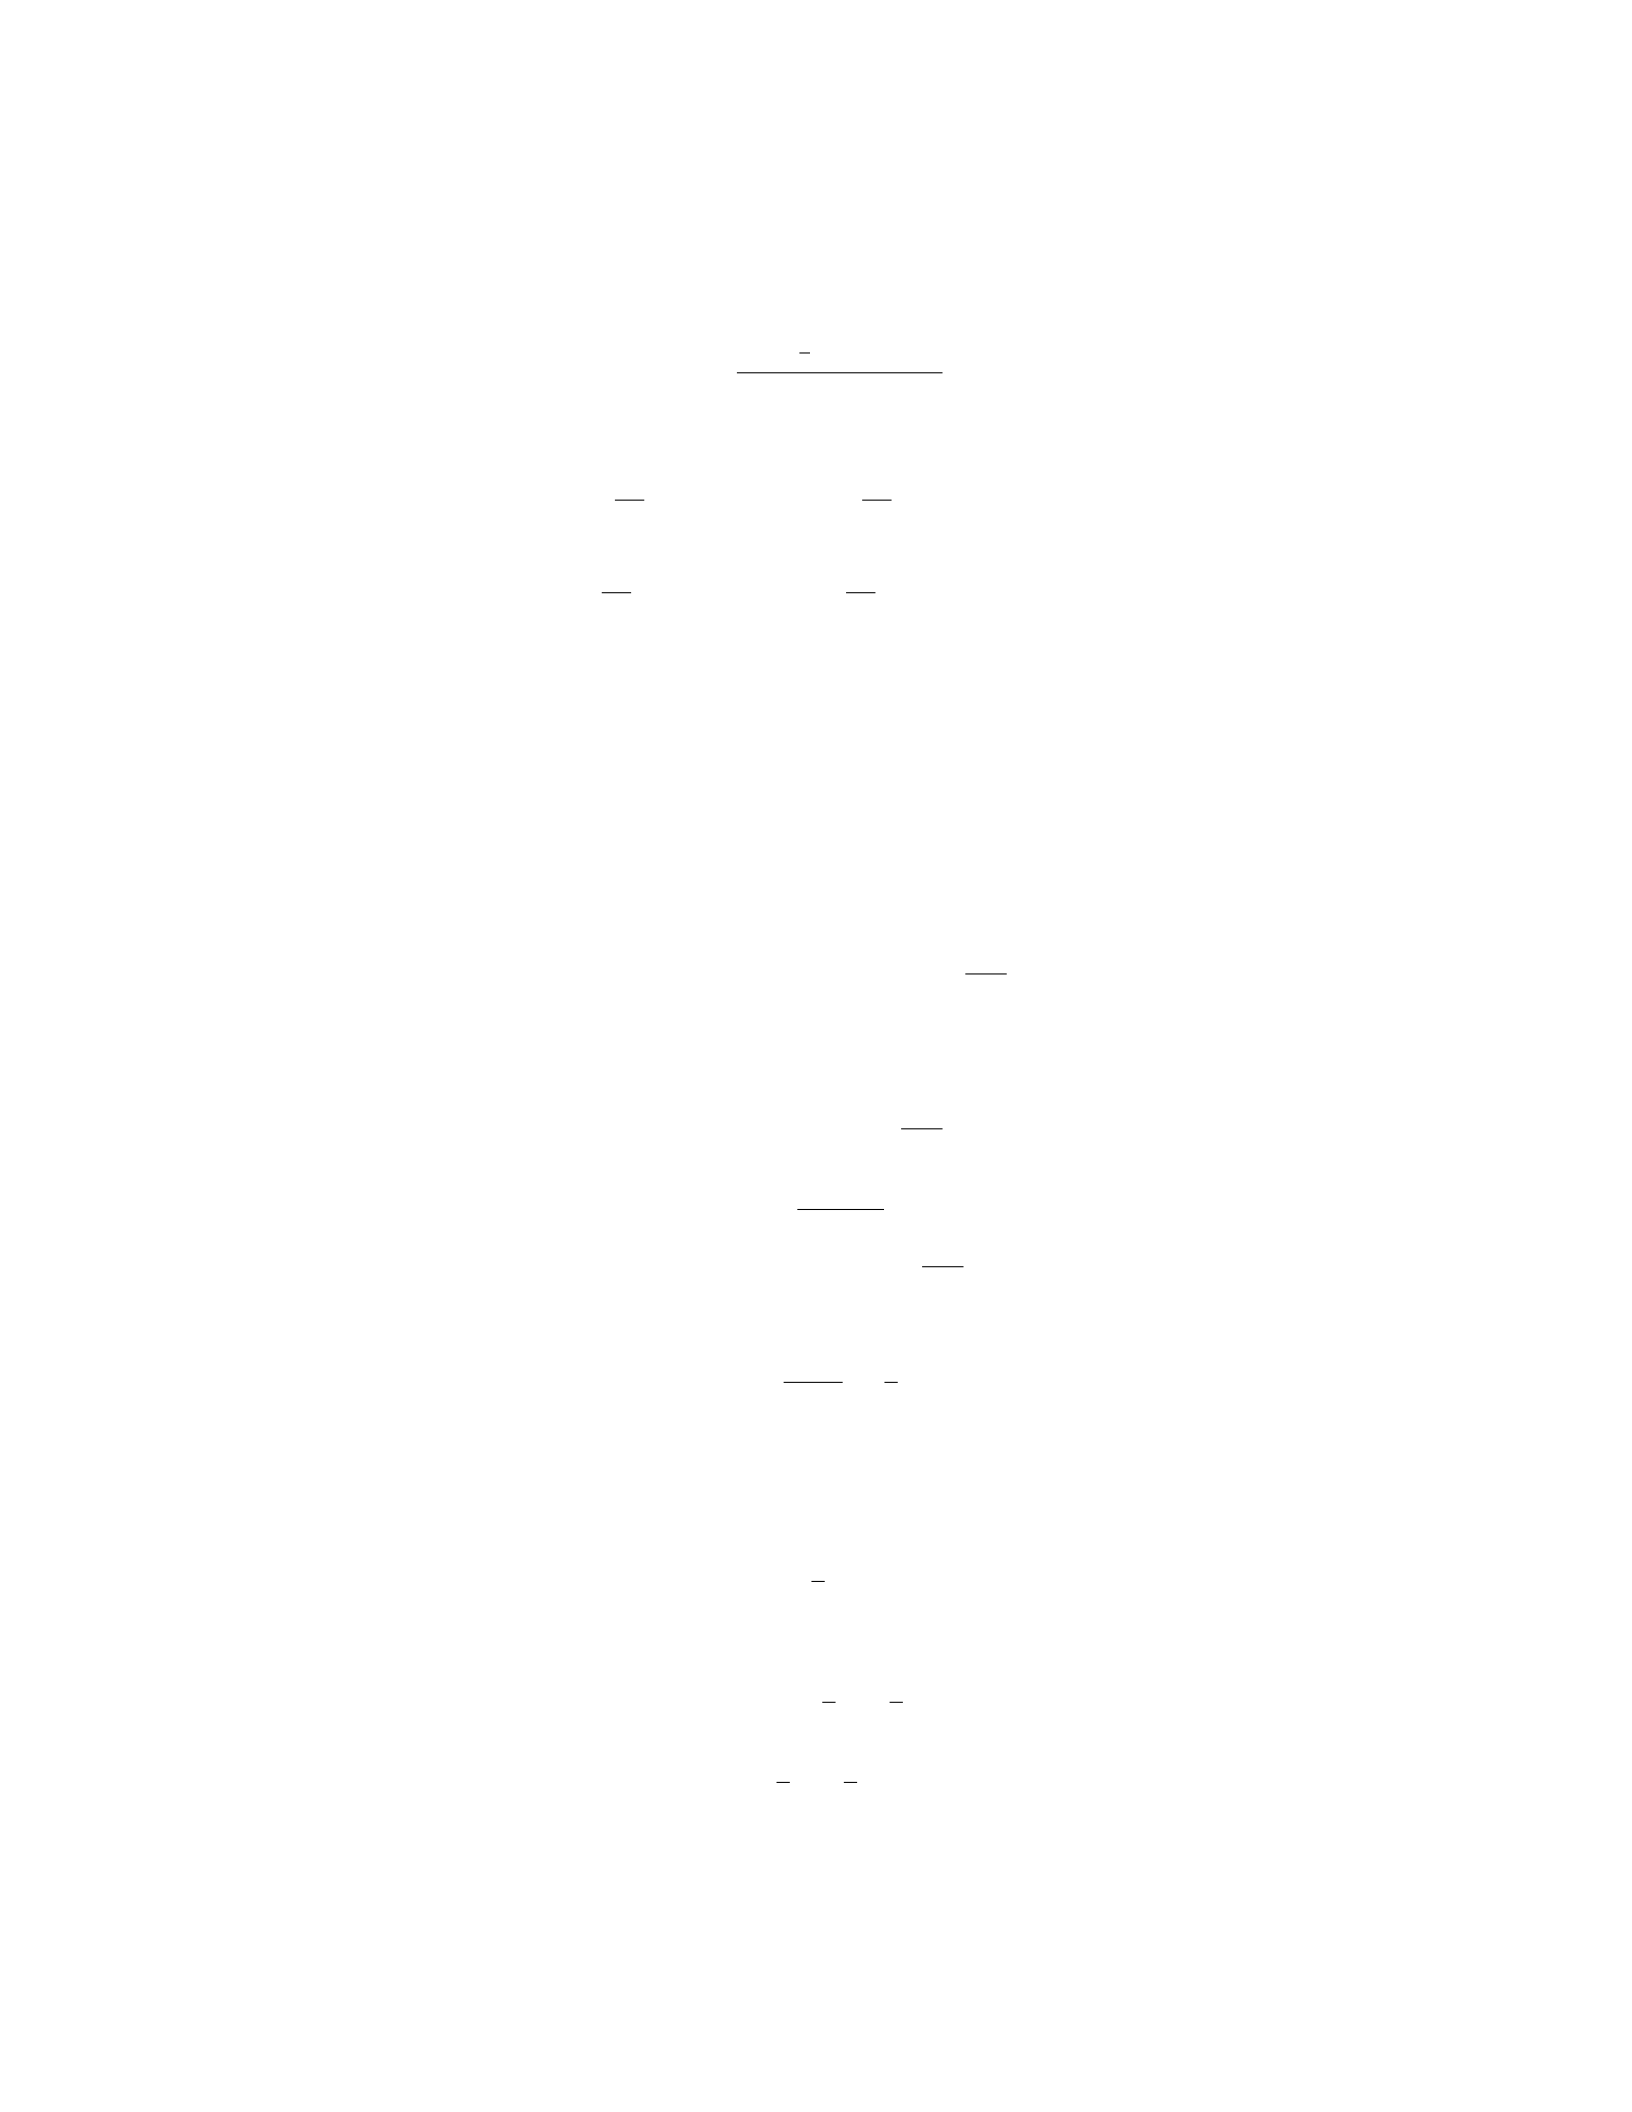
¯y=R2π
01
3·sin(θ)dθ
π
Step 5: Solving the integrals, we find:
¯x=1
3π·Z2π
0
cos(θ)dθ =1
3π·[sin(θ)]2π
0= 0
¯y=1
3π·Z2π
0
sin(θ)dθ =1
3π·[−cos(θ)]2π
0= 0
Step 6: Therefore, the centroid of the given region is (0,0).
Question 26
Question
Let Abe the point (2,3), and let Bbe the point (5,7). Determine the equations
of:
1. the line passing through Aand B,
2. the perpendicular bisector of the line segment AB.
Solution
To determine the equations of the lines passing through the points Aand B, we
first need to find the slope of the line segment AB using the formula:
m=y2−y1
x2−x1
.
Step 1: Find the slope of line segment AB.Given points A(2,3) and
B(5,7), the slope mof the line passing through Aand Bis:
m=7−3
5−2=4
3.
Step 2: Determine the equation of the line passing through Aand
B.Since the equation of a line with slope mpassing through point (x1, y1) is
given by y−y1=m(x−x1), the equation of the line passing through points A
and Bis:
y−3 = 4
3(x−2).
Expanding and simplifying:
y−3 = 4
3x−8
3
y=4
3x−8
3+ 3
21

y=4
3x−8
3+9
3
y=4
3x+1
3.
Therefore, the equation of the line passing through Aand Bis y=4
3x+1
3.
Step 3: Find the midpoint of line segment AB.To find the midpoint
of the line segment AB, we use the midpoint formula:
x1+x2
2,y1+y2
2.
For points A(2,3) and B(5,7), the midpoint Mof the line segment AB is:
2+5
2,3+7
2=7
2,10
2=7
2,5.
Step 4: Determine the slope of the perpendicular bisector. The
slope of a line perpendicular to a line with slope mis −1
m. Thus, the slope of
the perpendicular bisector of the line segment AB is:
−1
4
3
=−3
4.
Step 5: Find the equation of the perpendicular bisector. Since the
perpendicular bisector passes through the midpoint M7
2,5and has a slope of
−3
4, its equation is:
y−5 = −3
4x−7
2.
Expanding and simplifying:
y−5 = −3
4x+21
8
y=−3
4x+21
8+ 5
y=−3
4x+21
8+40
8
y=−3
4x+61
8.
Therefore, the equation of the perpendicular bisector of the line segment AB
is y=−3
4x+61
8.
Question 27
Question
Consider the set of points in R2defined by the equation 3x2+ 4xy + 3y2= 1.
(a) Sketch the graph of this equation. (b) Classify the shape of the graph
and explain your reasoning.
22
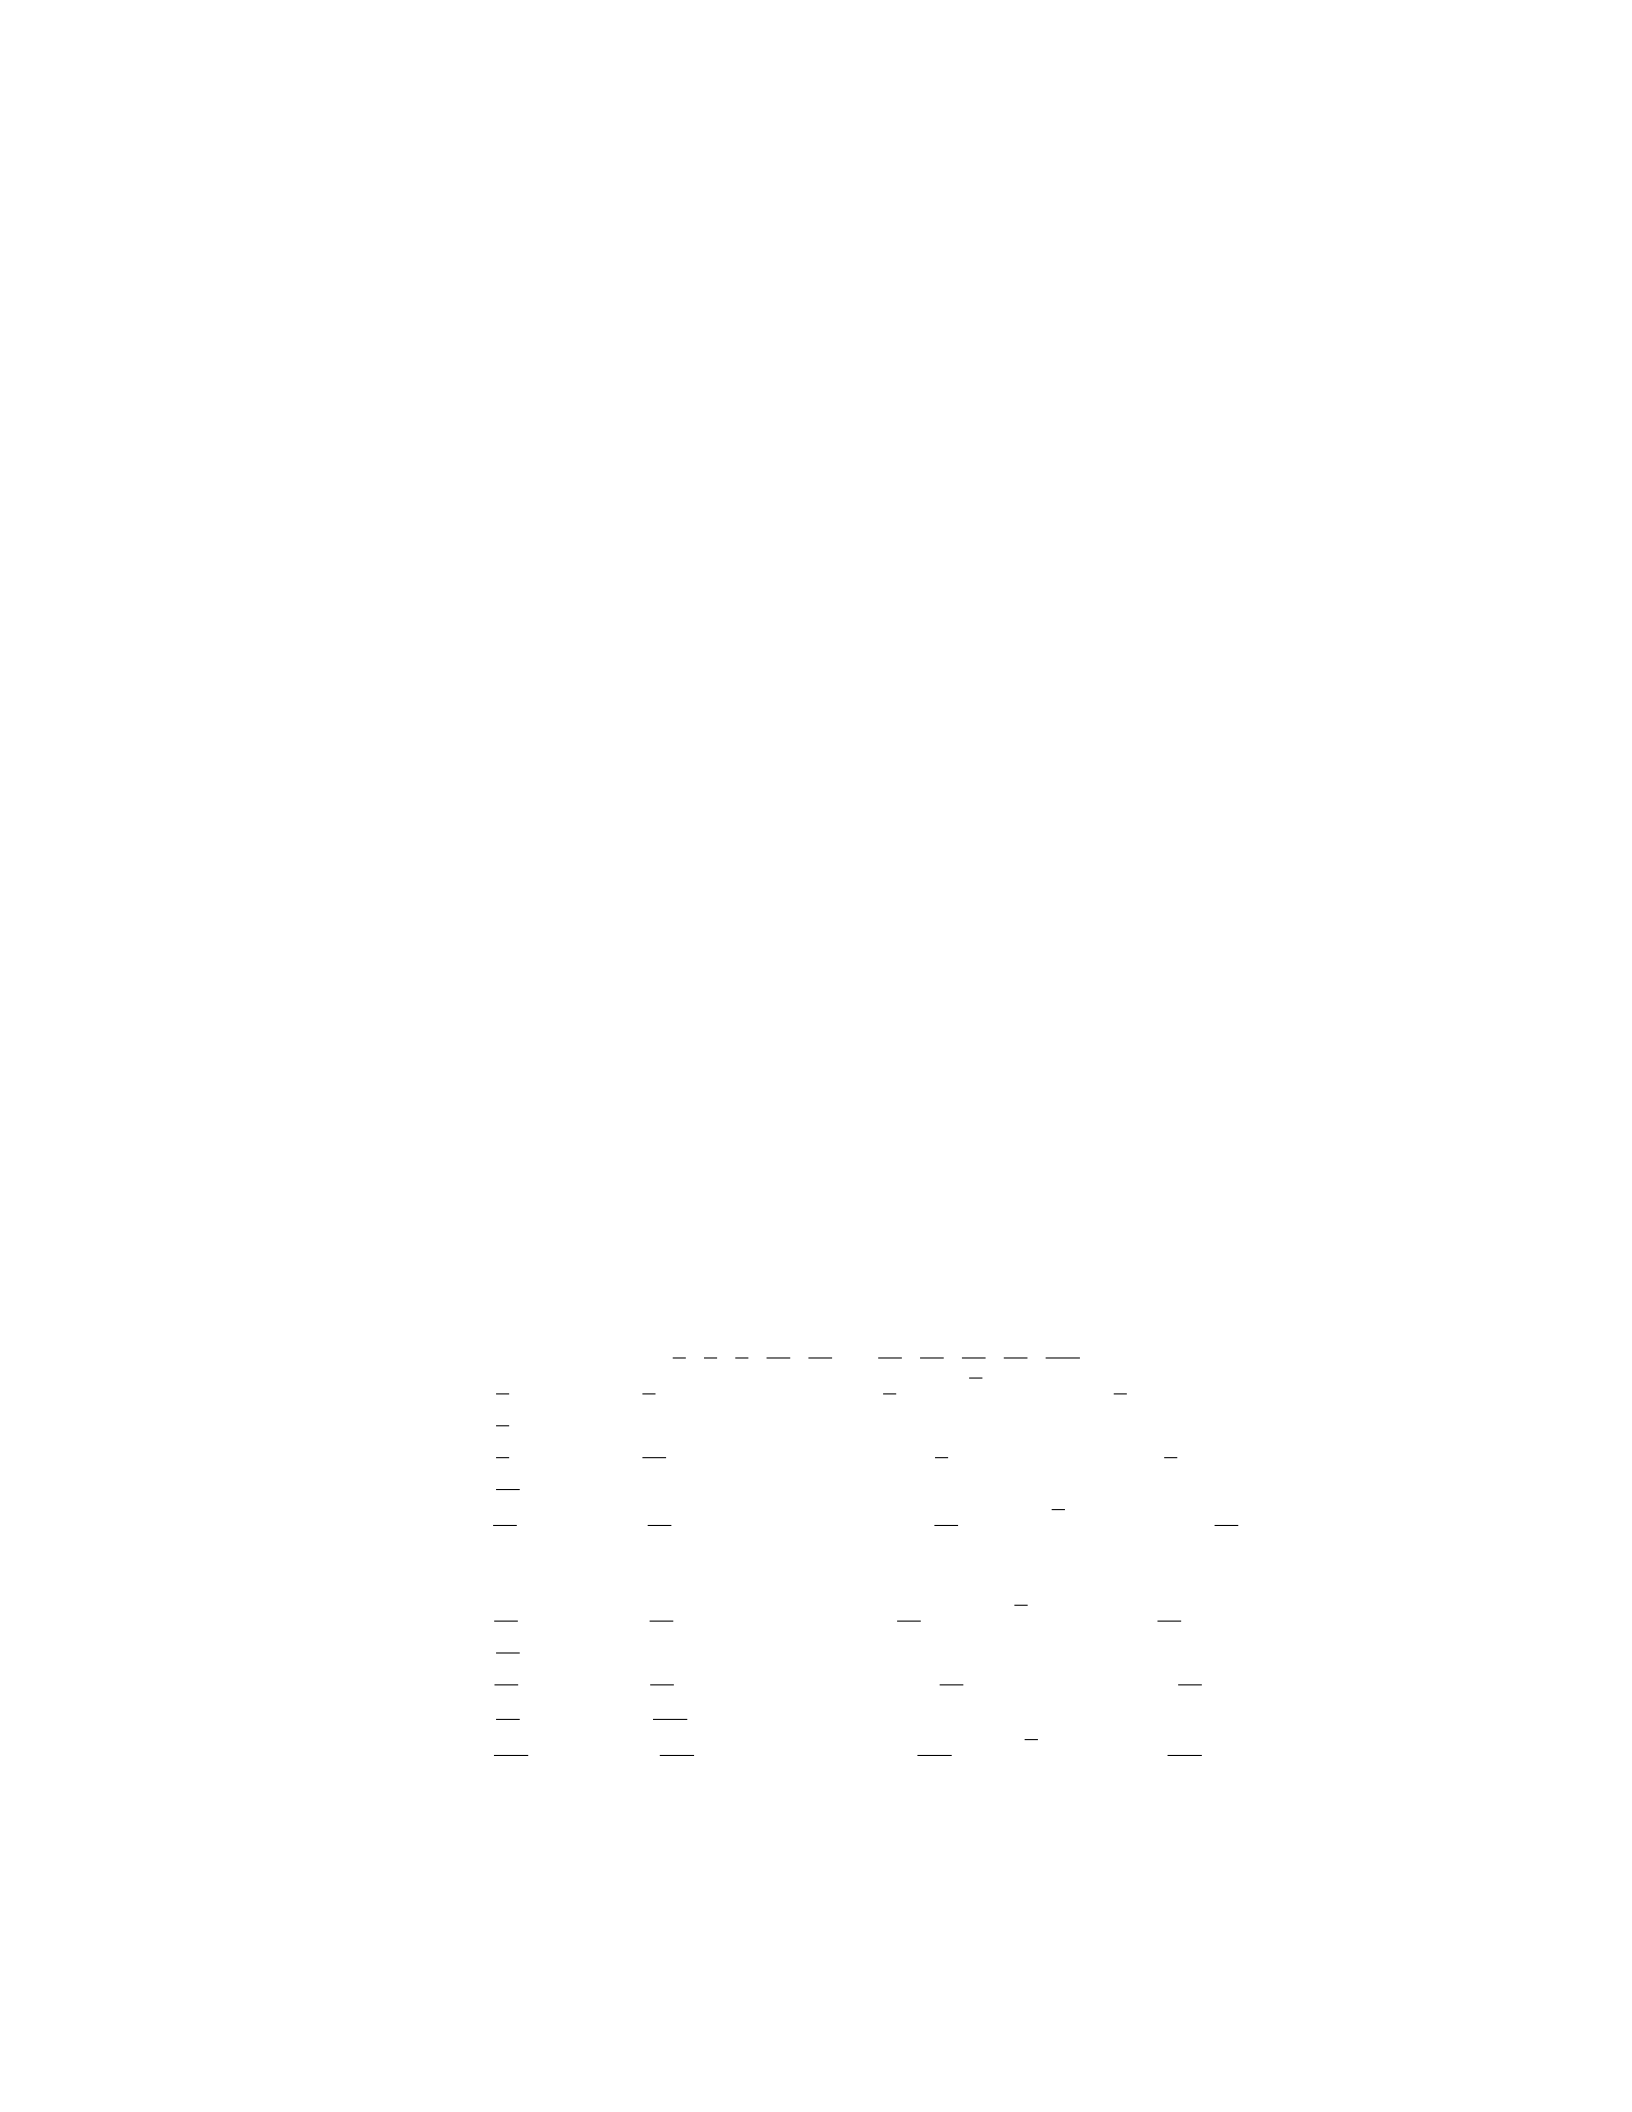
Solution
(a) To sketch the graph of the equation 3x2+ 4xy + 3y2= 1, let’s first rewrite
the equation in matrix form:
x y3 2
2 3x
y= 1
This is a quadratic equation in two variables, which represents a conic sec-
tion. To sketch the graph, we will analyze its level curves.
(b) To classify the shape of the graph, we will analyze the matrix 3 2
2 3.
The determinant of this matrix is 3 ×3−2×2 = 5, and the trace is 3 + 3 = 6.
Since the determinant is positive and the trace is greater than zero, we conclude
that the graph represents an ellipse.
Therefore, the graph of the equation 3x2+ 4xy + 3y2= 1 is an ellipse in R2.
Question 28
Question
Consider the curve defined by the polar equation r= 2 sin(3θ).
(a) Plot the graph of the curve.
(b) Determine the number of petals in the graph and provide a geometric
interpretation for this number.
Solution
(a) To plot the graph of the curve defined by the polar equation r= 2 sin(3θ),
we can first consider different values of θin the interval 0 ≤θ≤2πand compute
the corresponding values of r. Then we can convert the polar coordinates to
Cartesian coordinates using the formulas x=rcos(θ) and y=rsin(θ).
When θ= 0, r= 0, so the point is at the origin.
Let’s now consider θ=π
6,π
3,π
2,2π
3,5π
6, π, 7π
6,4π
3,3π
2,5π
3,11π
6,2π:
For θ=π
6,r= 2 sinπ
2= 2 ⇒x= 2 cosπ
6=√3, y= 2 sinπ
6= 1.
For θ=π
3,r= 2 sin(π) = 0 ⇒x= 0, y= 0.
For θ=π
2,r= 2 sin3π
2=−2⇒x=−2 cosπ
2= 0, y=−2 sinπ
2=−2.
For θ=2π
3,r= 2 sin(2π)=0⇒x= 0, y= 0.
For θ=5π
6,r= 2 sin3π
2=−2⇒x=−2 cos5π
6=−√3, y=−2 sin5π
6=
−1.
For θ=π,r= 2 sin(3π)=0⇒x= 0, y= 0.
For θ=7π
6,r= 2 sin5π
2= 2 ⇒x= 2 cos7π
6=−√3, y= 2 sin7π
6=−1.
For θ=4π
3,r= 2 sin(3π)=0⇒x= 0, y= 0.
For θ=3π
2,r= 2 sin9π
2=−2⇒x=−2 cos3π
2= 0, y=−2 sin3π
2= 2.
For θ=5π
3,r= 2 sin15π
2= 0 ⇒x= 0, y= 0.
For θ=11π
6,r= 2 sin33π
6= 2 ⇒x= 2 cos11π
6=√3, y= 2 sin11π
6= 1.
Finally, for θ= 2π,r= 2 sin(6π)=0⇒
23

Question 29
Question
Consider the following geometric shape in the xy-plane: - Circle centered at
(2,3) with radius 4. - Line passing through points (5,−1) and (1,5).
Plot the circle and the line on the same set of axes and find the points of
intersection, if any.
Solution
To plot the circle and the line on the same set of axes, we first need to find their
equations.
Step 1: Find the equation of the circle The equation of a circle with
center (h, k) and radius ris given by:
(x−h)2+ (y−k)2=r2
In this case, the center of the circle is (2,3) and the radius is 4, so the
equation of the circle is:
(x−2)2+ (y−3)2= 16
Step 2: Find the equation of the line The equation of a line passing
through two points (x1, y1) and (x2, y2) can be found using the point-slope form
given by:
y−y1=y2−y1
x2−x1·(x−x1)
Using the points (5,−1) and (1,5), we have:
y−(−1) = 5−(−1)
1−5·(x−5)
y+ 1 = 6
−4·(x−5)
y+ 1 = −3
2(x−5)
y=−3
2x+13
2
Step 3: Plot the circle and the line Now, we can plot the circle with
equation (x−2)2+ (y−3)2= 16 and the line y=−3
2x+13
2on the same set of
axes.
Step 4: Find the points of intersection To find the points of intersection,
we need to solve the system of equations formed by the circle and the line.
Substituting y=−3
2x+13
2into the equation of the circle:
(x−2)2+−3
2x+13
2−32
= 16
24

Question 2
Question
Consider the following parametric equations for a curve in the xy-plane:
x= 2 sin(t), y = 3 cos(t),0≤t≤2π.
(a) Plot the curve generated by the parametric equations. (b) Determine the
equation of any tangent lines to the curve at the points where t=π
2. (c) Find
the area enclosed by the curve.
Solution
(a) To plot the curve, we can eliminate the parameter tand express yin terms
of x:
y= 3 cos arcsin x
2= 3r1−x
22.
This equation represents the top half of an ellipse centered at the origin with
semi-major axis of 3 units along the y-axis and semi-minor axis of 2 units along
the x-axis. The plot of the curve is the top half of this ellipse.
(b) To find the equation of the tangent lines at t=π
2, we need to find the
slope of the curve at this point. The slope of the curve at any point is given by
dy
dx =dy/dt
dx/dt .
dy
dt =−3 sin(t),dx
dt = 2 cos(t).
At t=π
2,dy
dt =−3, dx
dt = 0, so the slope is undefined. This means the tangent
line at this point is vertical and its equation is x= 2.
(c) To find the area enclosed by the curve, we integrate 1
2y dx over one period
of the curve:
Area = Z2π
0
1
2·3 cos(t)·2 cos(t)dt =Z2π
0
3 cos2(t)dt.
Using the double angle identity cos(2t) = 2 cos2(t)−1, we can rewrite the
integral as:
Area = 3
2Z2π
0
(1 + cos(2t)) dt =3
2t+1
2sin(2t)
2π
0
=9π
2.
Therefore, the area enclosed by the curve is 9π
2.
Question 3
Question
Consider the two-dimensional region in the xy-plane bounded by the curves
y=x2and y= 2x−x2. Calculate the area of the region enclosed by these
curves.
2

Solution
To find the area of the region bounded by the curves y=x2and y= 2x−x2,
we first need to determine the points of intersection of these two curves.
Step 1: Find the points of intersection Setting x2= 2x−x2gives us
2x= 2x2, which simplifies to x(2 −2x) = 0. So, x= 0 or x= 1.
Step 2: Determine the bounds for integration The region is bounded
by the curves y=x2and y= 2x−x2between x= 0 and x= 1.
Step 3: Compute the area The area enclosed by the curves is given by
the definite integral of the difference of the two curves:
A=Z1
0
((2x−x2)−x2)dx
Step 4: Evaluate the integral
A=Z1
0
(2x−2x2)dx =x2−2
3x31
0
= 1 −2
3=1
3
So, the area of the region enclosed by the curves y=x2and y= 2x−x2is
1
3.
Question 4
Question
Consider the following geometric shapes in the coordinate plane: a circle cen-
tered at (2,−1) with radius 3, and a line passing through the points (1,5) and
(4,−2). Determine the points of intersection, if any, between these two shapes.
Solution
Step 1: The equation of the circle can be written in the form (x−h)2+(y−k)2=
r2, where (h, k) are the coordinates of the center and ris the radius. For this
circle, we have (x−2)2+ (y+ 1)2= 9.
Step 2: The equation of the line passing through two points (x1, y1) and
(x2, y2) can be found using the point-slope formula: y−y1=y2−y1
x2−x1(x−x1).
Substituting (1,5) and (4,−2) into this formula, we obtain the equation of the
line as y=−7
3x+26
3.
Step 3: To find the points of intersection between the circle and the line, we
substitute the expression for yfrom the equation of the line into the equation
of the circle. This gives us a quadratic equation in terms of x.
Step 4: Solve the quadratic equation to find the possible x-coordinates of
the points of intersection. These x-coordinates can then be substituted back
into the equation of the line to find the corresponding y-coordinates.
Step 5: Finally, check if the points of intersection lie on both the circle and
the line. If they do, then those points are the actual points of intersection.
Otherwise, there are no points of intersection between the circle and the line.
3
Question 5
Question
Consider the geometric shape in the xy-plane defined by the following inequal-
ities:
x2−4x+y2+ 2y≤0
x+y≤4
x≥0
Sketch and analyze the geometric shape formed by the above inequalities.
Solution
To analyze the given geometric shape defined by the system of inequalities, let’s
break it down step by step:
Step 1: First, let’s examine the boundary of the region. To find the boundary
where the inequalities become equalities, we set each inequality to equality and
solve for xand y. For x2−4x+y2+ 2y= 0, we complete the square to rewrite
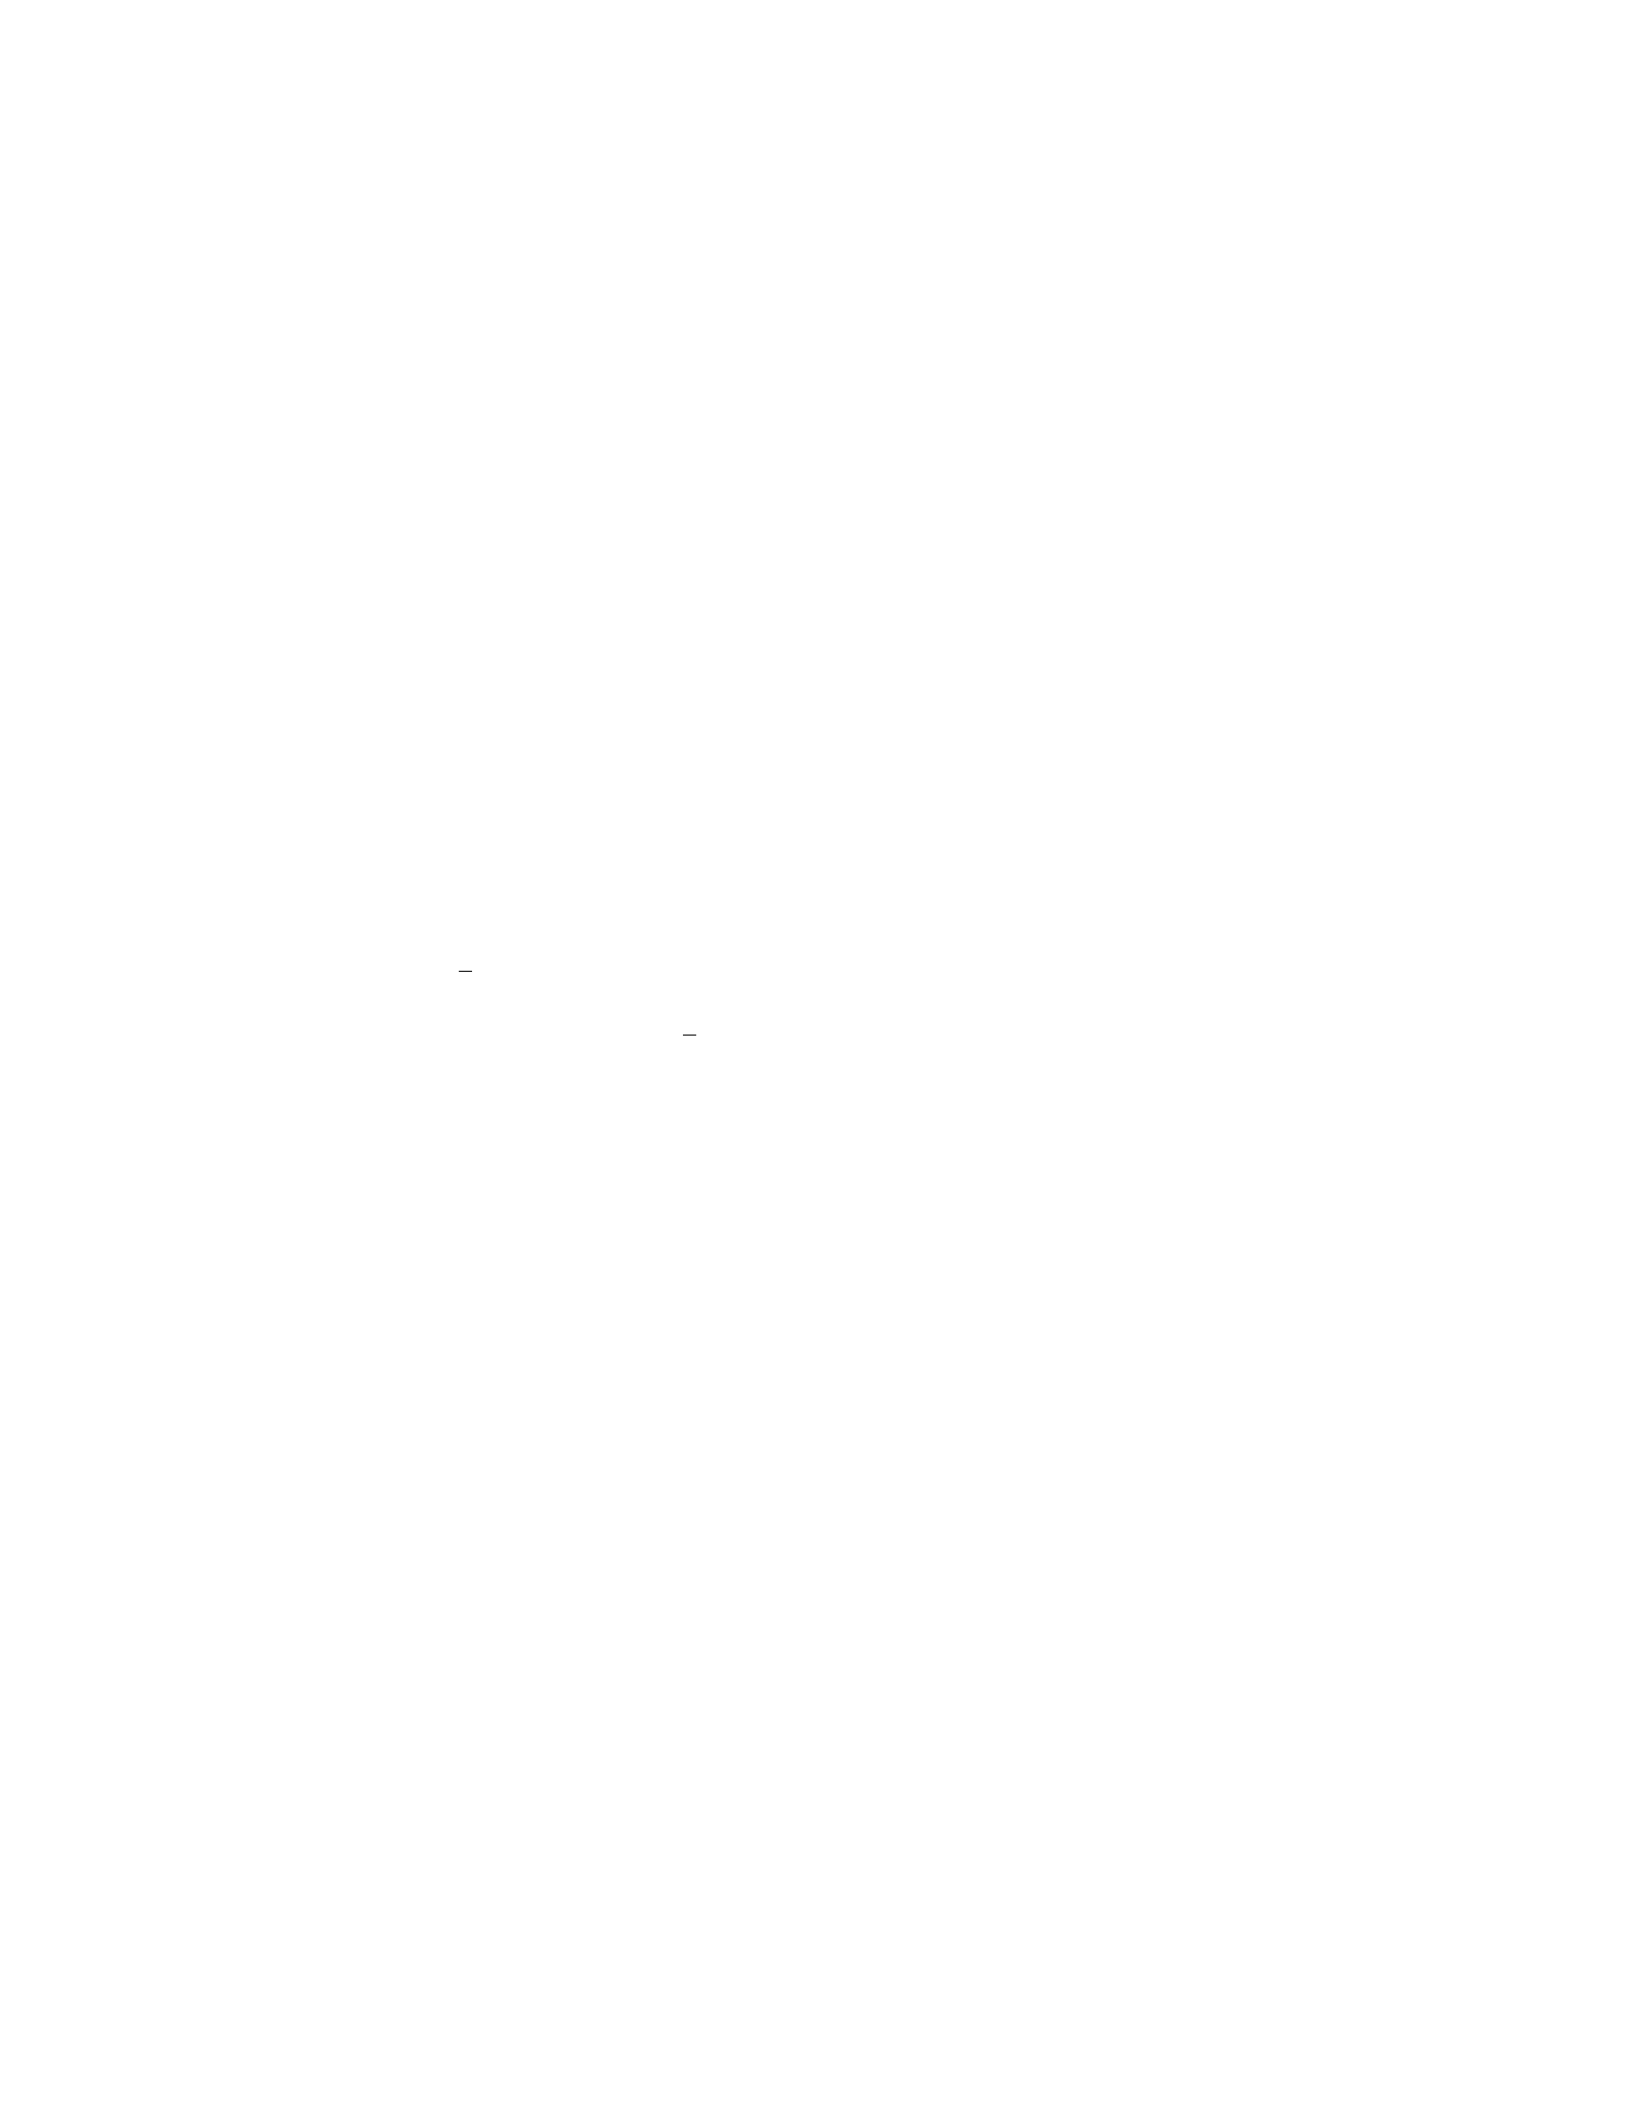
it as (x−2)2+ (y+ 1)2= 5. This represents a circle centered at (2,−1) with
radius √5. For x+y= 4, the boundary line passes through (4,0) and (0,4).
Step 2: Now, we will sketch the boundary of the region. The circle with
center (2,−1) and radius √5 is sketched, along with the line x+y= 4. This
boundary divides the plane into different regions.
Step 3: Next, we will check the regions defined by the given inequalities to
determine the solution set. Evaluating the inequalities at a test point in each
region allows us to determine the valid solution set. For example, we can test
the region below the circle but above the line by plugging in (0,0) into the
inequalities. We find that all inequalities are satisfied in this region.
Step 4: Finally, we summarize that the geometric shape defined by the given
inequalities is the closed region bounded by the circle (x−2)2+ (y+ 1)2= 5,
the line x+y= 4, the x-axis, and the y-axis. This region includes the center of
the circle and is the solution set.
Therefore, the solution is the region enclosed by the circle (x−2)2+(y+1)2=
5, the line x+y= 4, the x-axis, and the y-axis.
Question 6
Question
Consider the region Din the xy-plane bounded by the curve y=x2and the
line y=x+ 2. Sketch the region Dand calculate the area enclosed by the curve
and the line.
4

Solution
To find the area enclosed by the curve y=x2and the line y=x+ 2, we first
need to determine the points of intersection.
Step 1: Find the points of intersection.
Setting x2=x+ 2, we have:
x2−x−2=0
Factoring the quadratic equation, we get:
(x−2)(x+ 1) = 0
So, x= 2 or x=−1.
Therefore, the points of intersection are at (−1,1) and (2,4).
Step 2: Sketch the region D
The region Dis enclosed by the curve y=x2and the line y=x+ 2. It lies
between the x-values −1 and 2.
xy2;2y=x+ 2
Step 3: Calculate the area enclosed by the curve and the line.
The area enclosed by the two curves can be found by integrating the differ-
ence of the two functions over the interval [−1,2]:
Area = Z2
−1
(x+ 2 −x2)dx
Now, we compute the integral:
Area = x2
2+ 2x−x3
32
−1
=22
2+ 2(2) −23
3−(−1)2
2+ 2(−1) −(−1)3
3
= (2 + 4 −8
3)−(1
2−2 + 1
3)
=17
6
Therefore, the area enclosed by the curve y=x2and the line y=x+ 2 is
17
6square units.
Question 7
Question
Consider the geometric shape defined by the equation x2+y2+z2−x−y−z= 0.
Plot and analyze this geometric shape.
5

Solution
To begin, we rewrite the given equation in standard form by completing the
square for each variable:
x2−x+1
22
+y2−y+1
22
+z2−z+1
22
=1
22
+1
22
+1
22
Simplifying, we have:
(x−1
2)2+ (y−1
2)2+ (z−1
2)2=3
4
Step 1: The equation defines a sphere with center (1
2,1
2,1
2) and radius
q3
4=√3
2.
Step 2: We now analyze the properties of the sphere. - Center: The
center of the sphere is at (1
2,1
2,1
2). - Radius: The radius of the sphere is √3
2.
-Surface Area: The surface area of a sphere is given by 4πr2, where ris the
radius. Thus, the surface area of this sphere is 4π√3
22= 3π. - Volume: The
volume of a sphere is given by 4
3πr3. Therefore, the volume of this sphere is
4
3π√3
23=π√3
2.
Hence, the given equation represents a sphere with center (1
2,1
2,1
2) and radius
√3
2. This sphere has a surface area of 3πsquare units and a volume of π√3
2cubic
units.
Question 8
Question
Consider the following parametric equations:
x= 2 sin(t), y = 3 cos(t)
(a) Sketch the curve formed by these parametric equations in the xy-plane.
(b) Determine the equation of the tangent line to the curve at the point
where t=π
4.
Solution
(a) To sketch the curve, we can eliminate the parameter tby eliminating sine
and cosine. Since sin2(t) + cos2(t) = 1, we have:
x2= 4 sin2(t)
y2= 9 cos2(t)
6

Now, substituting x2and y2into the equation sin2(t) + cos2(t) = 1 gives us:
x2
4+y2
9= 1
This equation represents an ellipse with major axis along the y-axis and minor
axis along the x-axis.
(b) To find the equation of the tangent line at t=π
4, we first need to find
the coordinates of the point on the curve at this tvalue. Substituting t=π
4
into the parametric equations gives:
x= 2 sin π
4= 2 1
√2=√2
y= 3 cos π
4= 3 1
√2=3
√2
The point on the curve at t=π
4is (√2,3
√2).
To find the slope of the tangent line, we differentiate xand ywith respect
to t:dx
dt = 2 cos(t)
dy
dt =−3 sin(t)
At t=π
4:
dx
dt t=π
4
= 2 cos π
4=√2
dy
dt t=π
4
=−3 sin π
4=−3
√2
Therefore, the slope of the tangent line at t=π
4is dy
dx =−3/√2
√2=−3
2.
Using the point-slope form of the equation of a line, the equation of the
tangent line is:
y−3
√2=−3
2x−√2
Question 9
Question
Consider the following parametric equations for a curve in the xy-plane:
x(t) = 2 cos(t), y(t) = sin(t), t ∈[0,2π].
Plot the curve represented by these parametric equations and determine the
points of intersection with the x-axis.
7

Solution
To plot the curve represented by the parametric equations x(t) = 2 cos(t) and
y(t) = sin(t), we will vary the value of tfrom 0 to 2π.
Step 1: Plotting the curve Let’s compute the values of xand yfor various
values of t.
t0π
4
π
2
3π
4π5π
4
3π
2
7π
4
x2√2 0 −√2 -2 −√20√2
y0 1 1 1 0 -1 -1 -1
Plotting these points will give us the curve.
Step 2: Plotting the curve
Now, let’s plot the curve represented by the parametric equations x(t) =
2 cos(t) and y(t) = sin(t).
parametric_curve.png
Step 3: Determining points of intersection with the x-axis
The curve intersects the x-axis at the points where y(t) = 0. Thus, we need
to solve sin(t) = 0 for tin the interval [0,2π].
The solutions to sin(t) = 0 are t= 0, π. Therefore, the curve intersects the
x-axis at the points (2,0) and (−2,0).
In conclusion, the curve intersects the x-axis at the points (2,0) and (−2,0).
Question 10
Question
Consider the following functions: 1. f(x) = x3−3x2−4x+ 12 2. g(x) =
x2−4x−5
(a) Plot f(x) and g(x) on the same set of axes.
(b) Determine the points of intersection of f(x) and g(x).
(c) Find the area enclosed by the curve f(x), the x-axis, and the lines x= 1
and x= 5.
Solution
(a) To plot f(x) and g(x) on the same set of axes, we will first graph each
function separately and then overlay the plots.
Step 1: Graph f(x): Since f(x) = x3−3x2−4x+ 12, we first find the
critical points by setting f′(x) = 0:
f′(x)=3x2−6x−4
8

Setting f′(x) = 0 gives us:
3x2−6x−4=0
Solving for x, we find x=−1 and x=4
3as critical points.
Step 2: Graph g(x): Since g(x) = x2−4x−5, we can easily graph this
quadratic function.
Step 3: Overlay the plots of f(x) and g(x):
Now, we overlay the plots of f(x) and g(x) on the same set of axes to visualize
their intersection points.
(b) To determine the points of intersection, we solve f(x) = g(x):
x3−3x2−4x+ 12 = x2−4x−5
Rearranging the terms gives us:
x3−4x2+x+ 7 = 0
One of the roots of this equation is x= 1.
To find the other roots, we divide the cubic polynomial by (x−1) using
polynomial long division or synthetic division. This will give us a quadratic
equation that can be solved to find the other roots.
(c) To find the area enclosed by the curve f(x), the x-axis, and the lines
x= 1 and x= 5, we calculate the definite integral of |f(x)|between x= 1 and
x= 5. This will give us the total area enclosed by the curve.
Question 11
Question
Consider the following geometric figure: a square with side length sand an
inscribed circle. Let Asand Acdenote the areas of the square and circle,
respectively. Express the ratio Ac
Asin terms of s.
Solution
Step 1: Find the area of the square.
The area of a square with side length sis given by As=s2.
Step 2: Find the area of the circle inscribed in the square.
The circle is inscribed in the square, so its diameter is equal to the side length
of the square, which is s. The radius of the circle is thus r=s
2. The area of the
circle is Ac=πr2=πs
22=πs2
4.
Step 3: Determine the ratio of the areas.
Now we can express the ratio of the areas as:
Ac
As
=
πs2
4
s2=π
4
Therefore, the ratio Ac
Asis π
4in terms of s.
9
Question 12
Question
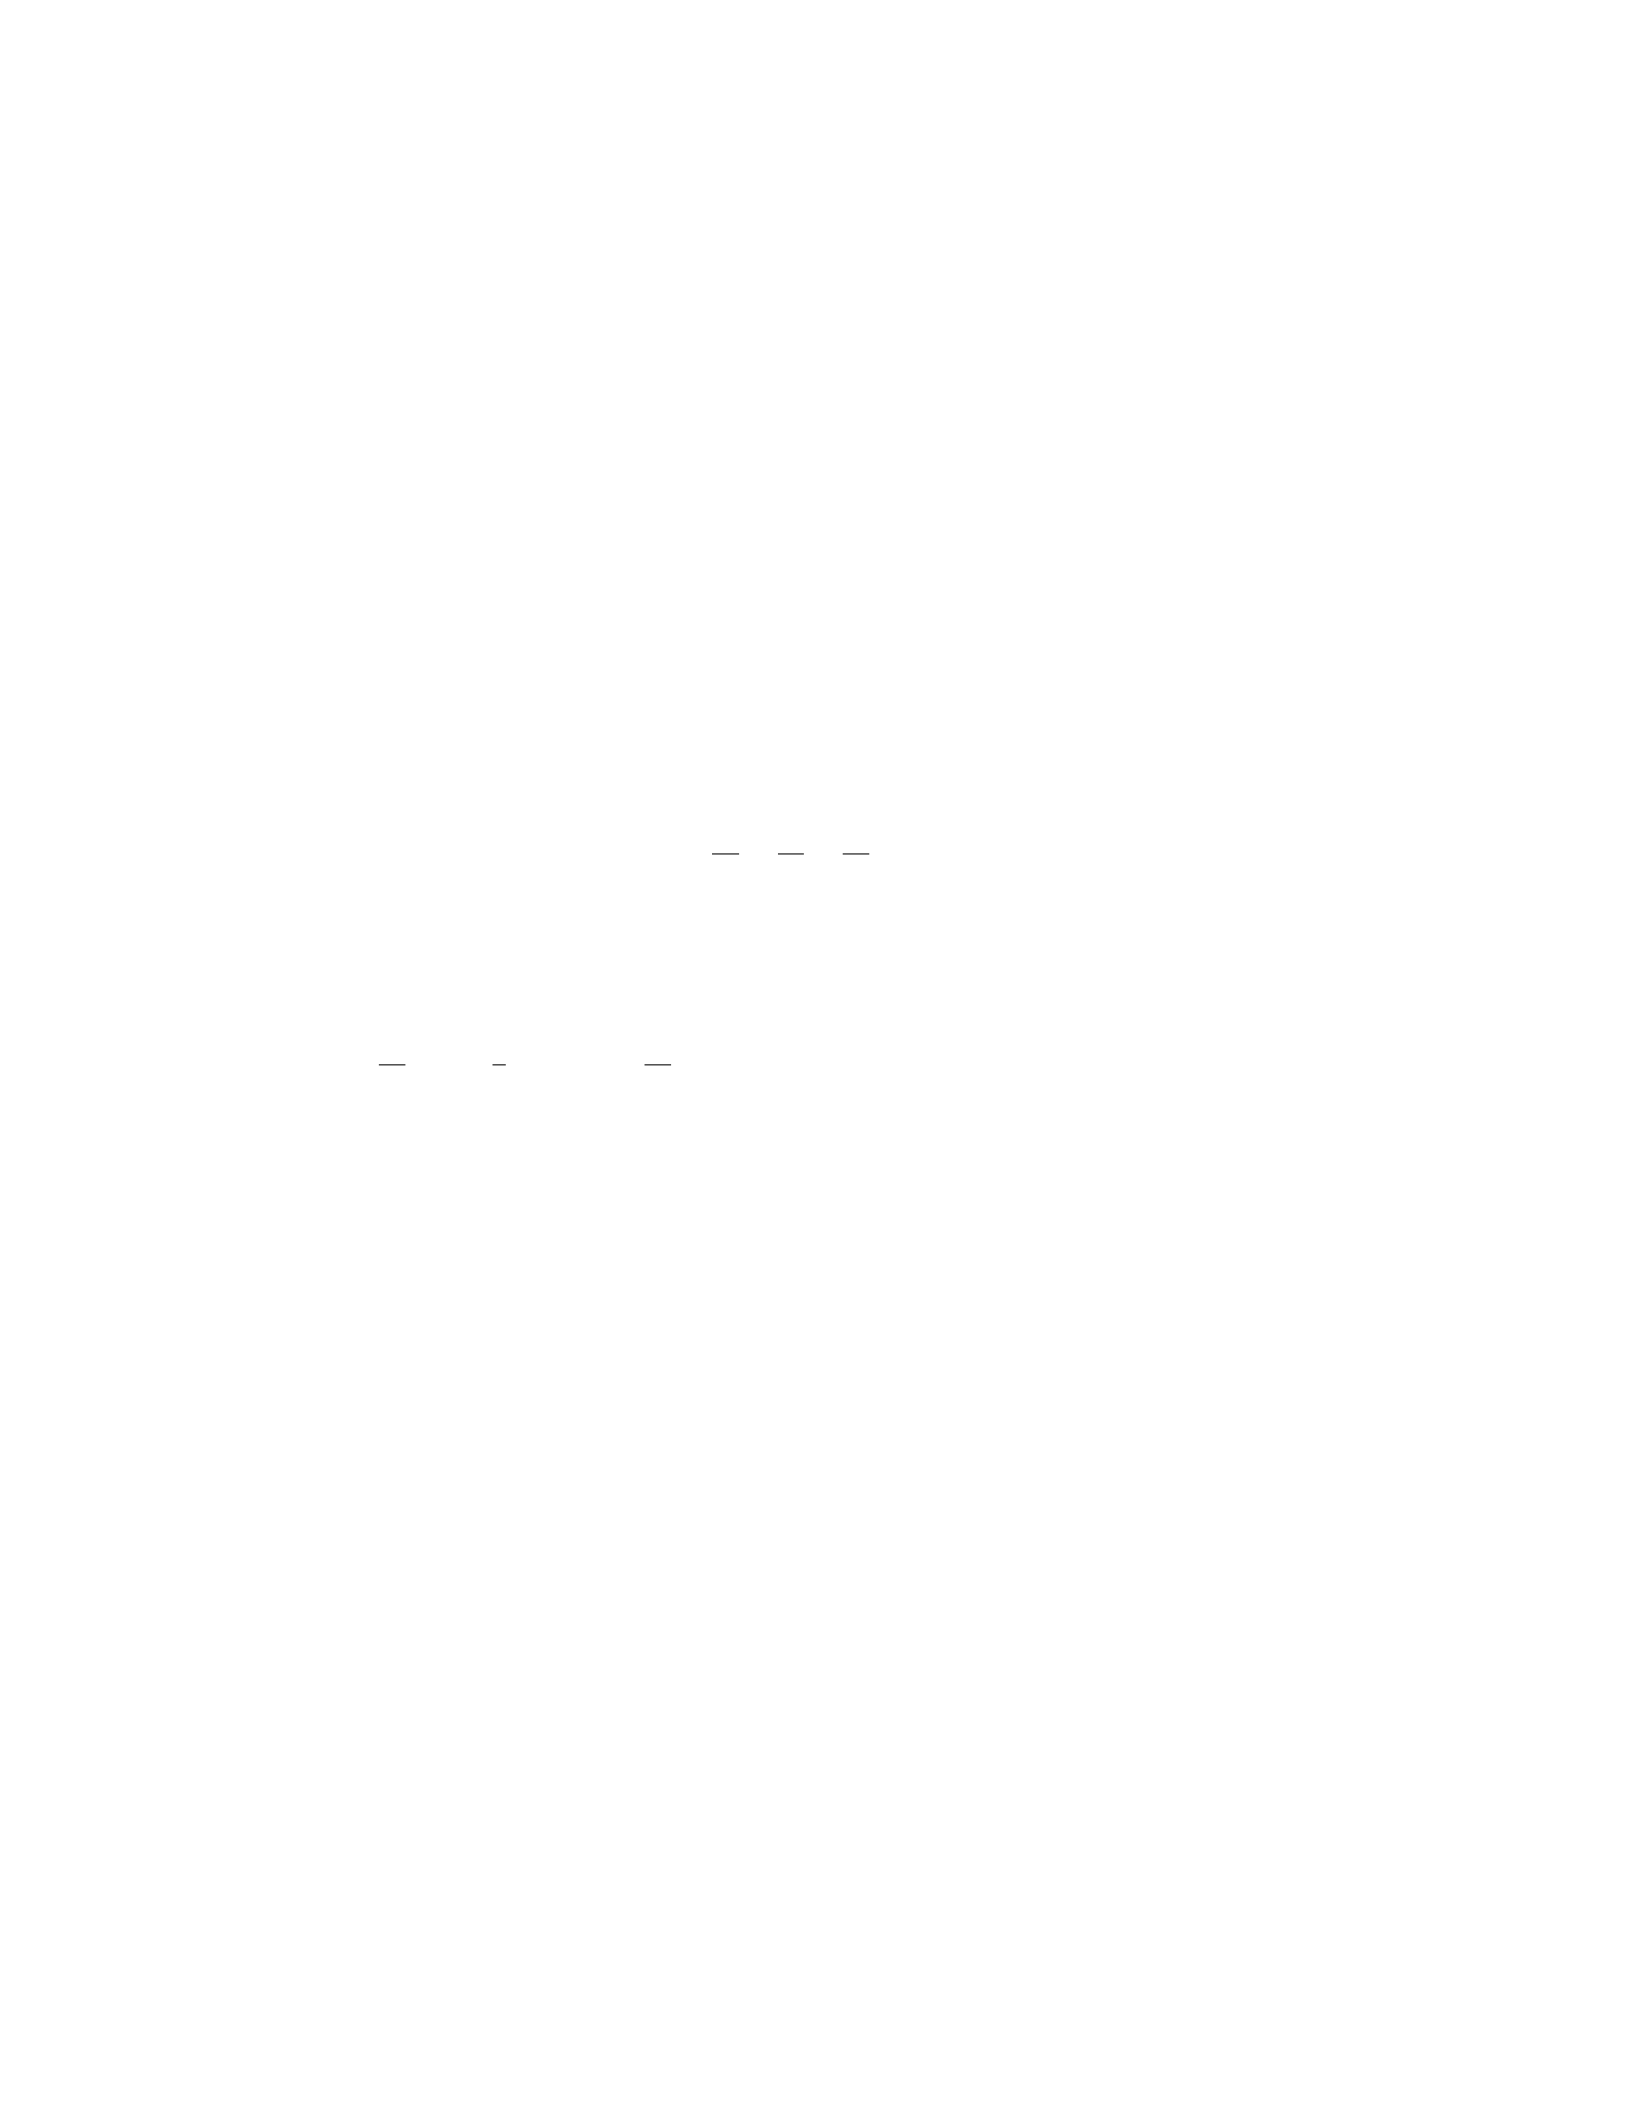
Consider the geometric shape defined by the equation x2+ 4y2+z2= 16.
Determine the type of shape represented by this equation and sketch its graph.
Identify any important features of the shape, such as its center, axes, and asymp-
totes.
Solution
Step 1: To determine the type of shape represented by the equation x2+ 4y2+
z2= 16, we can rewrite it in standard form. Since the coefficients of x2,y2, and
z2are positive, this suggests that the shape is an ellipsoid.
Step 2: We rewrite the equation by dividing each term by 16:
x2
16 +y2
4+z2
16 = 1
Step 3: Next, we identify the center of the ellipsoid. The center is at (h, k, l)
where h= 0, k= 0, and l= 0. Thus, the center of the ellipsoid is at the origin
(0,0,0).
Step 4: We find the semi-axes lengths of the ellipsoid. The semi-axes lengths
along the x-axis, a, along the y-axis, b, and along the z-axis, c, are given by
√16 = 4, √4 = 2, and √16 = 4 respectively.
Step 5: Now we sketch the graph of the ellipsoid. The ellipsoid is centered
at the origin with semi-axes lengths 4, 2, and 4 along the x-, y-, and z-axes,
respectively. The ellipsoid has no asymptotes and is symmetric about each axis.
Question 13
Question
Consider the following set of points in the coordinate plane:
S={(x, y)|x2+y2= 9, x ≥0, y ≥0}
Plot the set Sin the coordinate plane and analyze the geometric shape
formed by these points.
Solution
1. To plot the set S, we first note that the equation x2+y2= 9 represents a circle
with radius 3 centered at the origin. However, since we are only considering
points where both xand yare non-negative, we are only interested in the top-
right quarter of the circle.
2. We can now proceed to plot the set Sin the coordinate plane.
10

xy33
3. The geometric shape formed by the set Sis a quarter circle in the first
quadrant of the coordinate plane, with radius 3 and the x-axis and y-axis as its
boundaries.
4. This shape is often referred to as a quarter circle.
Question 14
Question
Consider the following piecewise-defined function:
f(x) = (x2if x < 0,
2x+ 1 if x≥0.
Plot the graph of the function f(x) and analyze the behavior of the func-
tion for both x < 0 and x≥0. Identify any critical points, intervals of in-
crease/decrease, local extrema, and concavity.
Solution
To plot the graph of the function f(x), we need to consider two cases: x < 0
and x≥0.
Case 1: x < 0 For x < 0, the function is given by f(x) = x2. This is a
simple parabolic graph which opens upwards. The critical point for this part of
the graph occurs at x= 0 where the minimum of the parabola is located.
Case 2: x≥0 For x≥0, the function is given by f(x)=2x+ 1. This is
a linear function with a slope of 2 and a y-intercept of 1. There are no critical
points for this linear function as it is a straight line.
Now, let’s plot the graphs for both pieces of the function on the same coor-
dinate system to get a complete picture of f(x).
xf(x)2; [domain = 0 : 4, samples = 100, color =red, ]2 ∗x+ 1;
From the graph, we can see that the function f(x) behaves differently for
x < 0 and x≥0: - For x < 0, f(x) is a parabola opening upwards with a
minimum at x= 0. - For x≥0, f(x) is a straight line with a positive slope.
Therefore, the function f(x) has a local minimum at x= 0 and is increasing
for x < 0 and x≥0. It is concave up for x < 0 and has no concavity for x≥0.
11

Question 15
Question
Consider the following system of equations:
(x2+y2= 4
y=x2
Plot and analyze the geometric shapes represented by these equations.
Solution
Step 1: To analyze the shapes represented by the equations, let’s first plot them
on the coordinate plane.
Step 2: The first equation x2+y2= 4 represents a circle with center at the
origin and radius 2.
Step 3: The second equation y=x2represents a parabola opening upwards
with vertex at the origin.
Step 4: Now, let’s plot both the circle and the parabola on the same coor-
dinate plane to analyze their intersection points.
Step 5: From the plot, we can see that the circle intersects the parabola at
two points: (−1,1) and (1,1).
Step 6: Therefore, the geometric shapes represented by the given system of
equations are a circle with center at the origin and radius 2, and a parabola
opening upwards with vertex at the origin. They intersect at the points (−1,1)
and (1,1).
Question 16
Question
Consider the region bounded by the curves y=x3and y=x2in the first
quadrant. Plot the region and find the area enclosed by these curves.
Solution
Step 1: To find the points of intersection between the curves y=x3and y=x2,
we set x3=x2and solve for x.
x3=x2
x3−x2= 0
x2(x−1) = 0
x= 0 or x= 1
12

Step 2: Next, we find the area enclosed by the curves by integrating the
difference x3−x2from 0 to 1.
Area = Z1
0
(x3−x2)dx
=x4
4−x3
31
0
=1
4−1
3−(0 −0)
=1
12
Therefore, the area enclosed by the curves y=x3and y=x2in the first
quadrant is 1
12 .
Question 17
Question
Plot and analyze the geometric shape defined by the equation x2+y2−6x+
4y−12 = 0.
Solution
Step 1: Complete the square for xand y.
We rearrange the terms in the equation to group xand yterms together:
(x2−6x)+(y2+ 4y) = 12
To complete the square for x, we add (6/2)2= 9 inside the parentheses:
(x2−6x+ 9) + (y2+ 4y) = 12 + 9
To complete the square for y, we add (4/2)2= 4 inside the parentheses:
(x2−6x+ 9) + (y2+ 4y+ 4) = 12 + 9 + 4
This simplifies to:
(x−3)2+ (y+ 2)2= 25
Step 2: Identify the center and radius.
Comparing the equation to the standard form of a circle (x−h)2+(y−k)2=
r2, we see that the center is at (3,−2) and the radius is 5.
Step 3: Plot the circle.
The circle has center (3,−2) and radius 5.
Step 4: Analyze the circle.
The circle has center (3,−2) and radius 5. It represents all points in the
plane that are equidistant from the center (3,−2).
13
Question 18
Question
Consider the following geometric shapes:
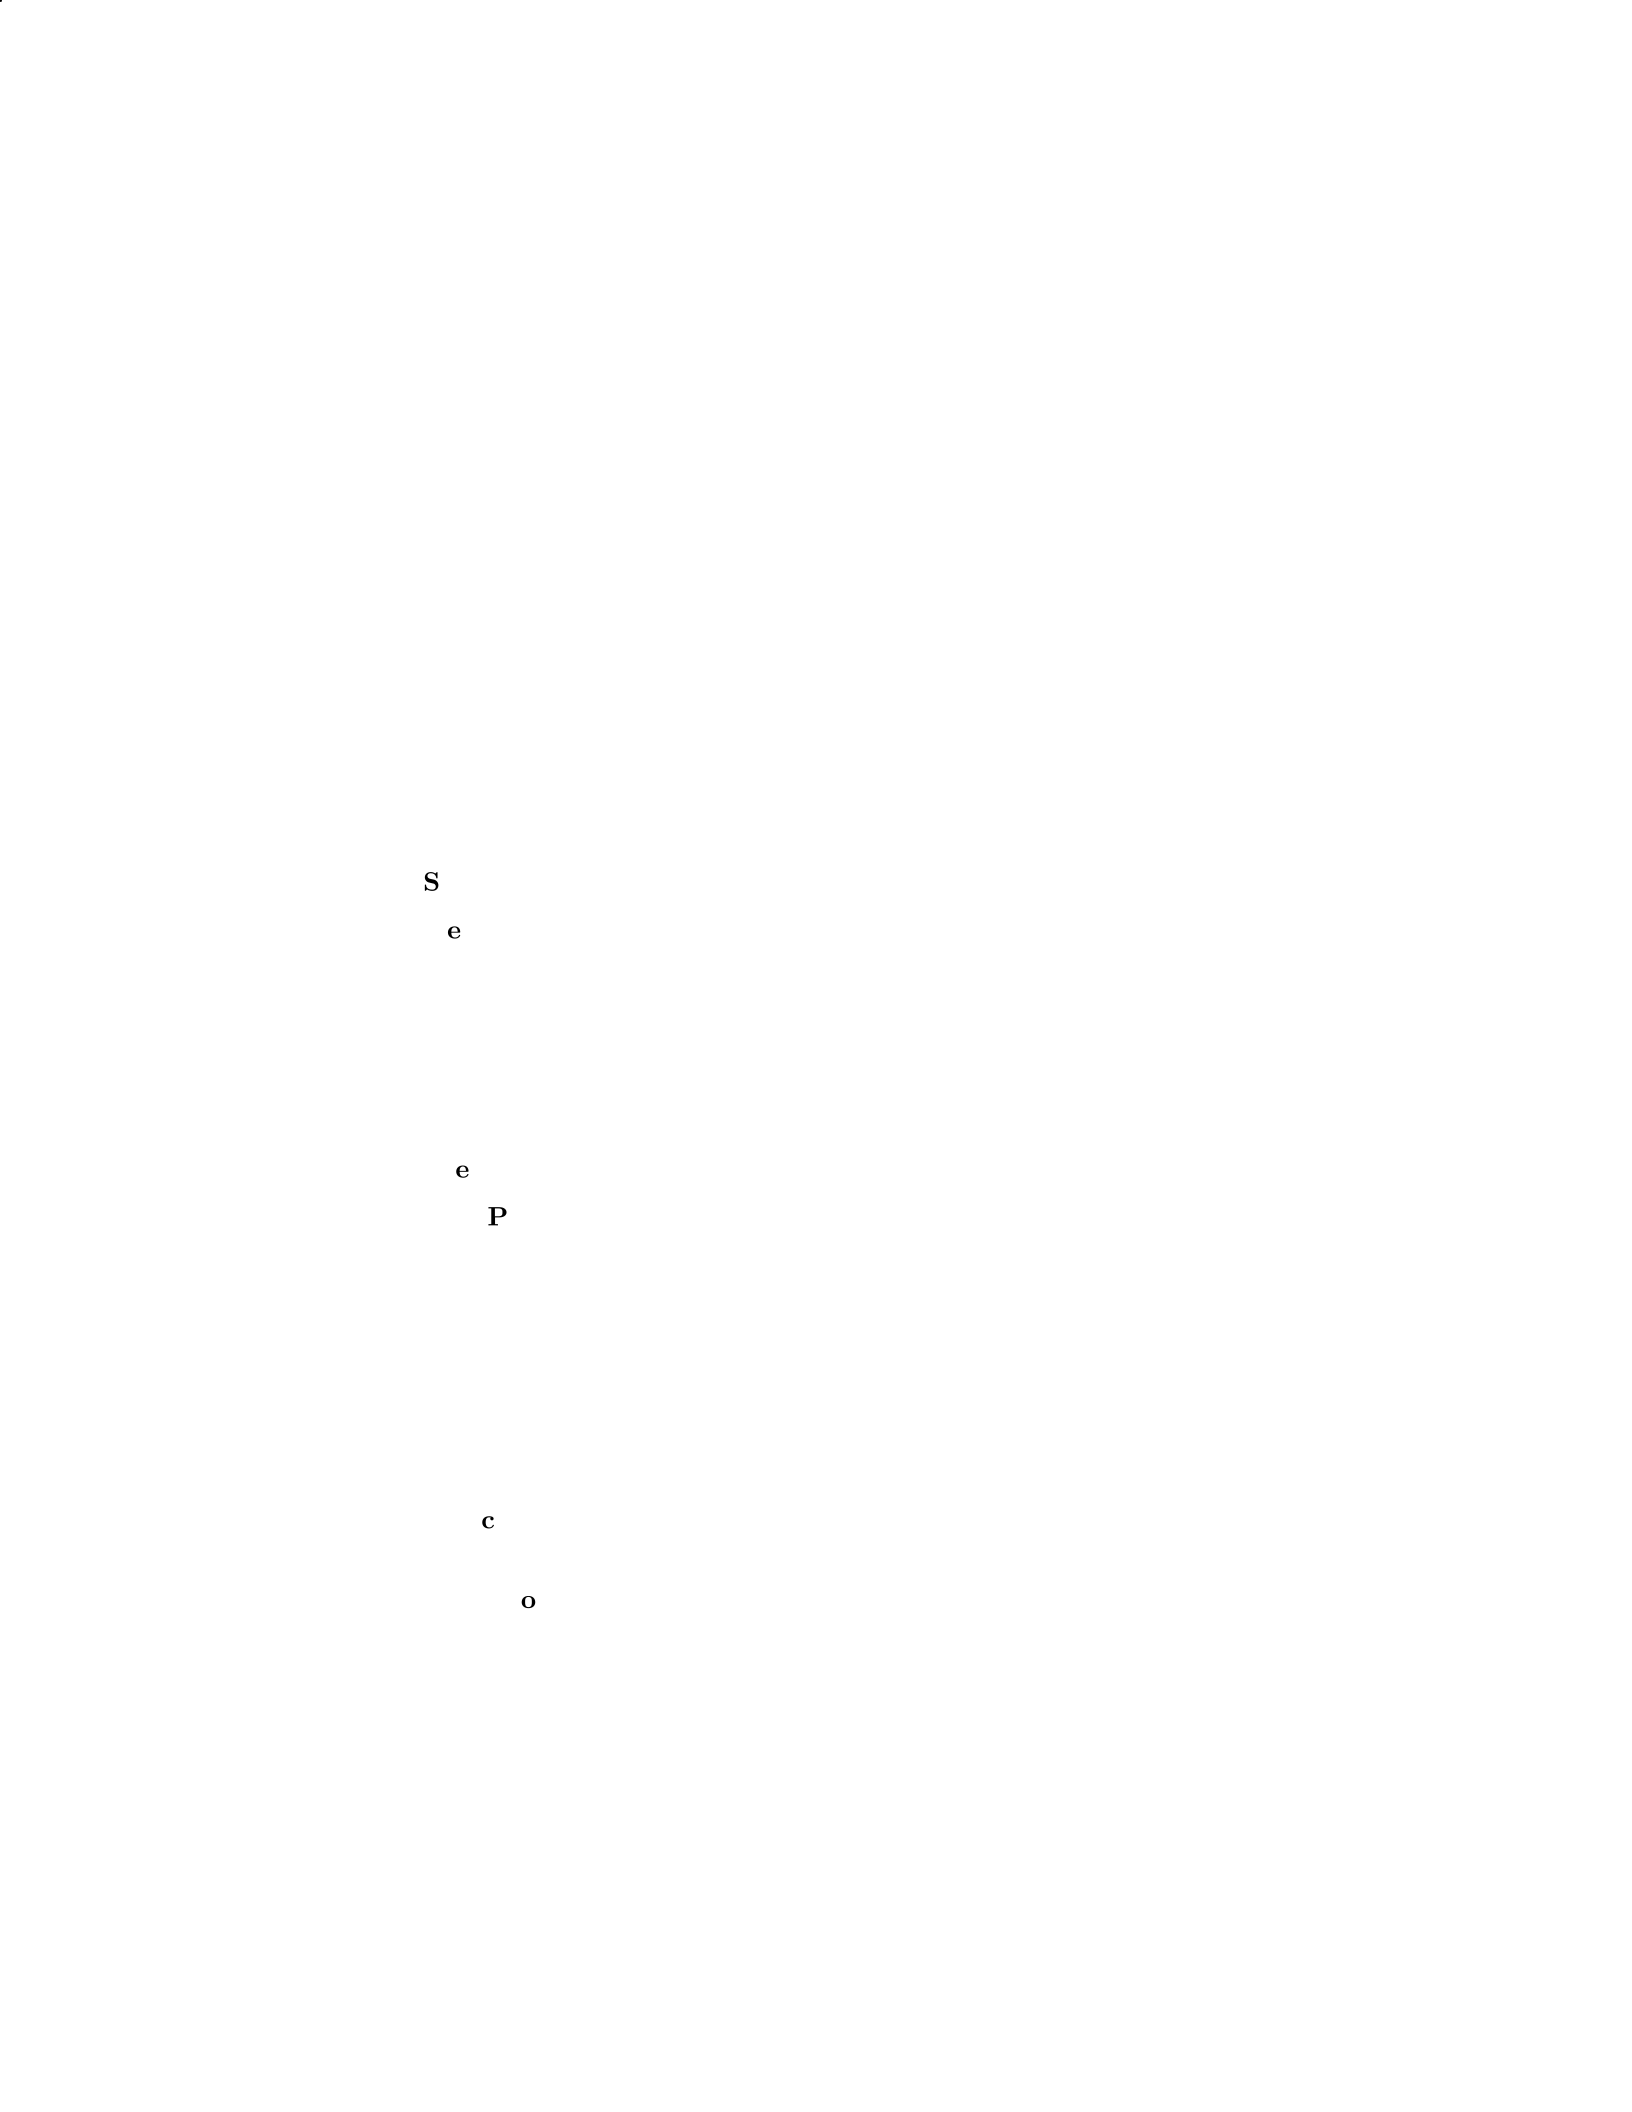
Shape A: A circle with radius 3 centered at the origin.
Shape B: A square with side length 6 centered at the point (2,2).
Shape C: An ellipse centered at the origin with semi-major axis length 4
along the x-axis and semi-minor axis length 2 along the y-axis.
For each shape, sketch the shape on the coordinate plane and analyze its
key properties (e.g., symmetry, intercepts, asymptotes).
Solution
To analyze each shape, we will consider the characteristics of circles, squares,
and ellipses.
Shape A: Circle with radius 3 centered at the origin
Sketch: This circle is centered at the origin and has a radius of 3.
Key Properties:
– Symmetry: The circle is symmetric with respect to both the x-axis
and the y-axis.
– Intercepts: The circle intersects the x-axis at (-3, 0) and (3, 0), and
the y-axis at (0, -3) and (0, 3).
Shape B: Square with side length 6 centered at the point (2, 2)
Sketch: This square is centered at the point (2, 2) and has side length 6.
Key Properties:
– Symmetry: The square is symmetric with respect to both the x-axis
and the y-axis.
– Intercepts: The square intersects the x-axis at (-1, 2) and (5, 2),
and the y-axis at (2, -1) and (2, 5).
Shape C: Ellipse centered at the origin with semi-major axis of
length 4 along the x-axis and semi-minor axis of length 2 along the
y-axis
Sketch: This ellipse is centered at the origin with semi-major axis length
4 along the x-axis and semi-minor axis length 2 along the y-axis.
Key Properties:
– Symmetry: The ellipse is symmetric with respect to both the x-axis
and the y-axis.
– Intercepts: The ellipse intersects the x-axis at (-4, 0) and (4, 0),
and the y-axis at (0, -2) and (0, 2).
– Asymptotes: There are no asymptotes for an ellipse.
14

Question 19
Question
Consider the following parametric equations:
x(t) = sin(t) + 2 cos(t), y(t) = sin(t)−2 cos(t)
Plot and analyze the geometric shape represented by these parametric equa-
tions.
Solution
To plot and analyze the geometric shape represented by the parametric equa-
tions, we need to eliminate the parameter and find the Cartesian equation of
the curve.
Step 1: Eliminate the parameter tTo eliminate the parameter t, we can
square both equations and add them together to get rid of the trigonometric
functions:
(x(t))2+ (y(t))2= (sin(t) + 2 cos(t))2+ (sin(t)−2 cos(t))2
x2+y2= sin2(t) + 4 sin(t) cos(t) + 4 cos2(t) + sin2(t)−4 sin(t) cos(t) + 4 cos2(t)
x2+y2= 2(sin2(t) + cos2(t)) + 8 cos2(t)
x2+y2= 2 + 8 cos2(t)
Step 2: Analyze the Cartesian equation The Cartesian equation we
found is x2+y2= 2 + 8 cos2(t). This is the equation of a circle centered at the
origin with radius p2 + 8(1) = √10.
Step 3: Plot the geometric shape The geometric shape represented by
the parametric equations is a circle centered at the origin with radius √10.
Therefore, the plot of the geometric shape is a circle centered at the origin
with radius √10.
Question 20
Question
Consider the geometric shape defined by the following equation:
4x2+ 9y2−16x+ 36y−36 = 0
Determine the type of shape the equation represents and plot the shape.
Analyze the characteristics of the shape including the center, major axis, minor
axis, foci, and eccentricity.
15
Solution
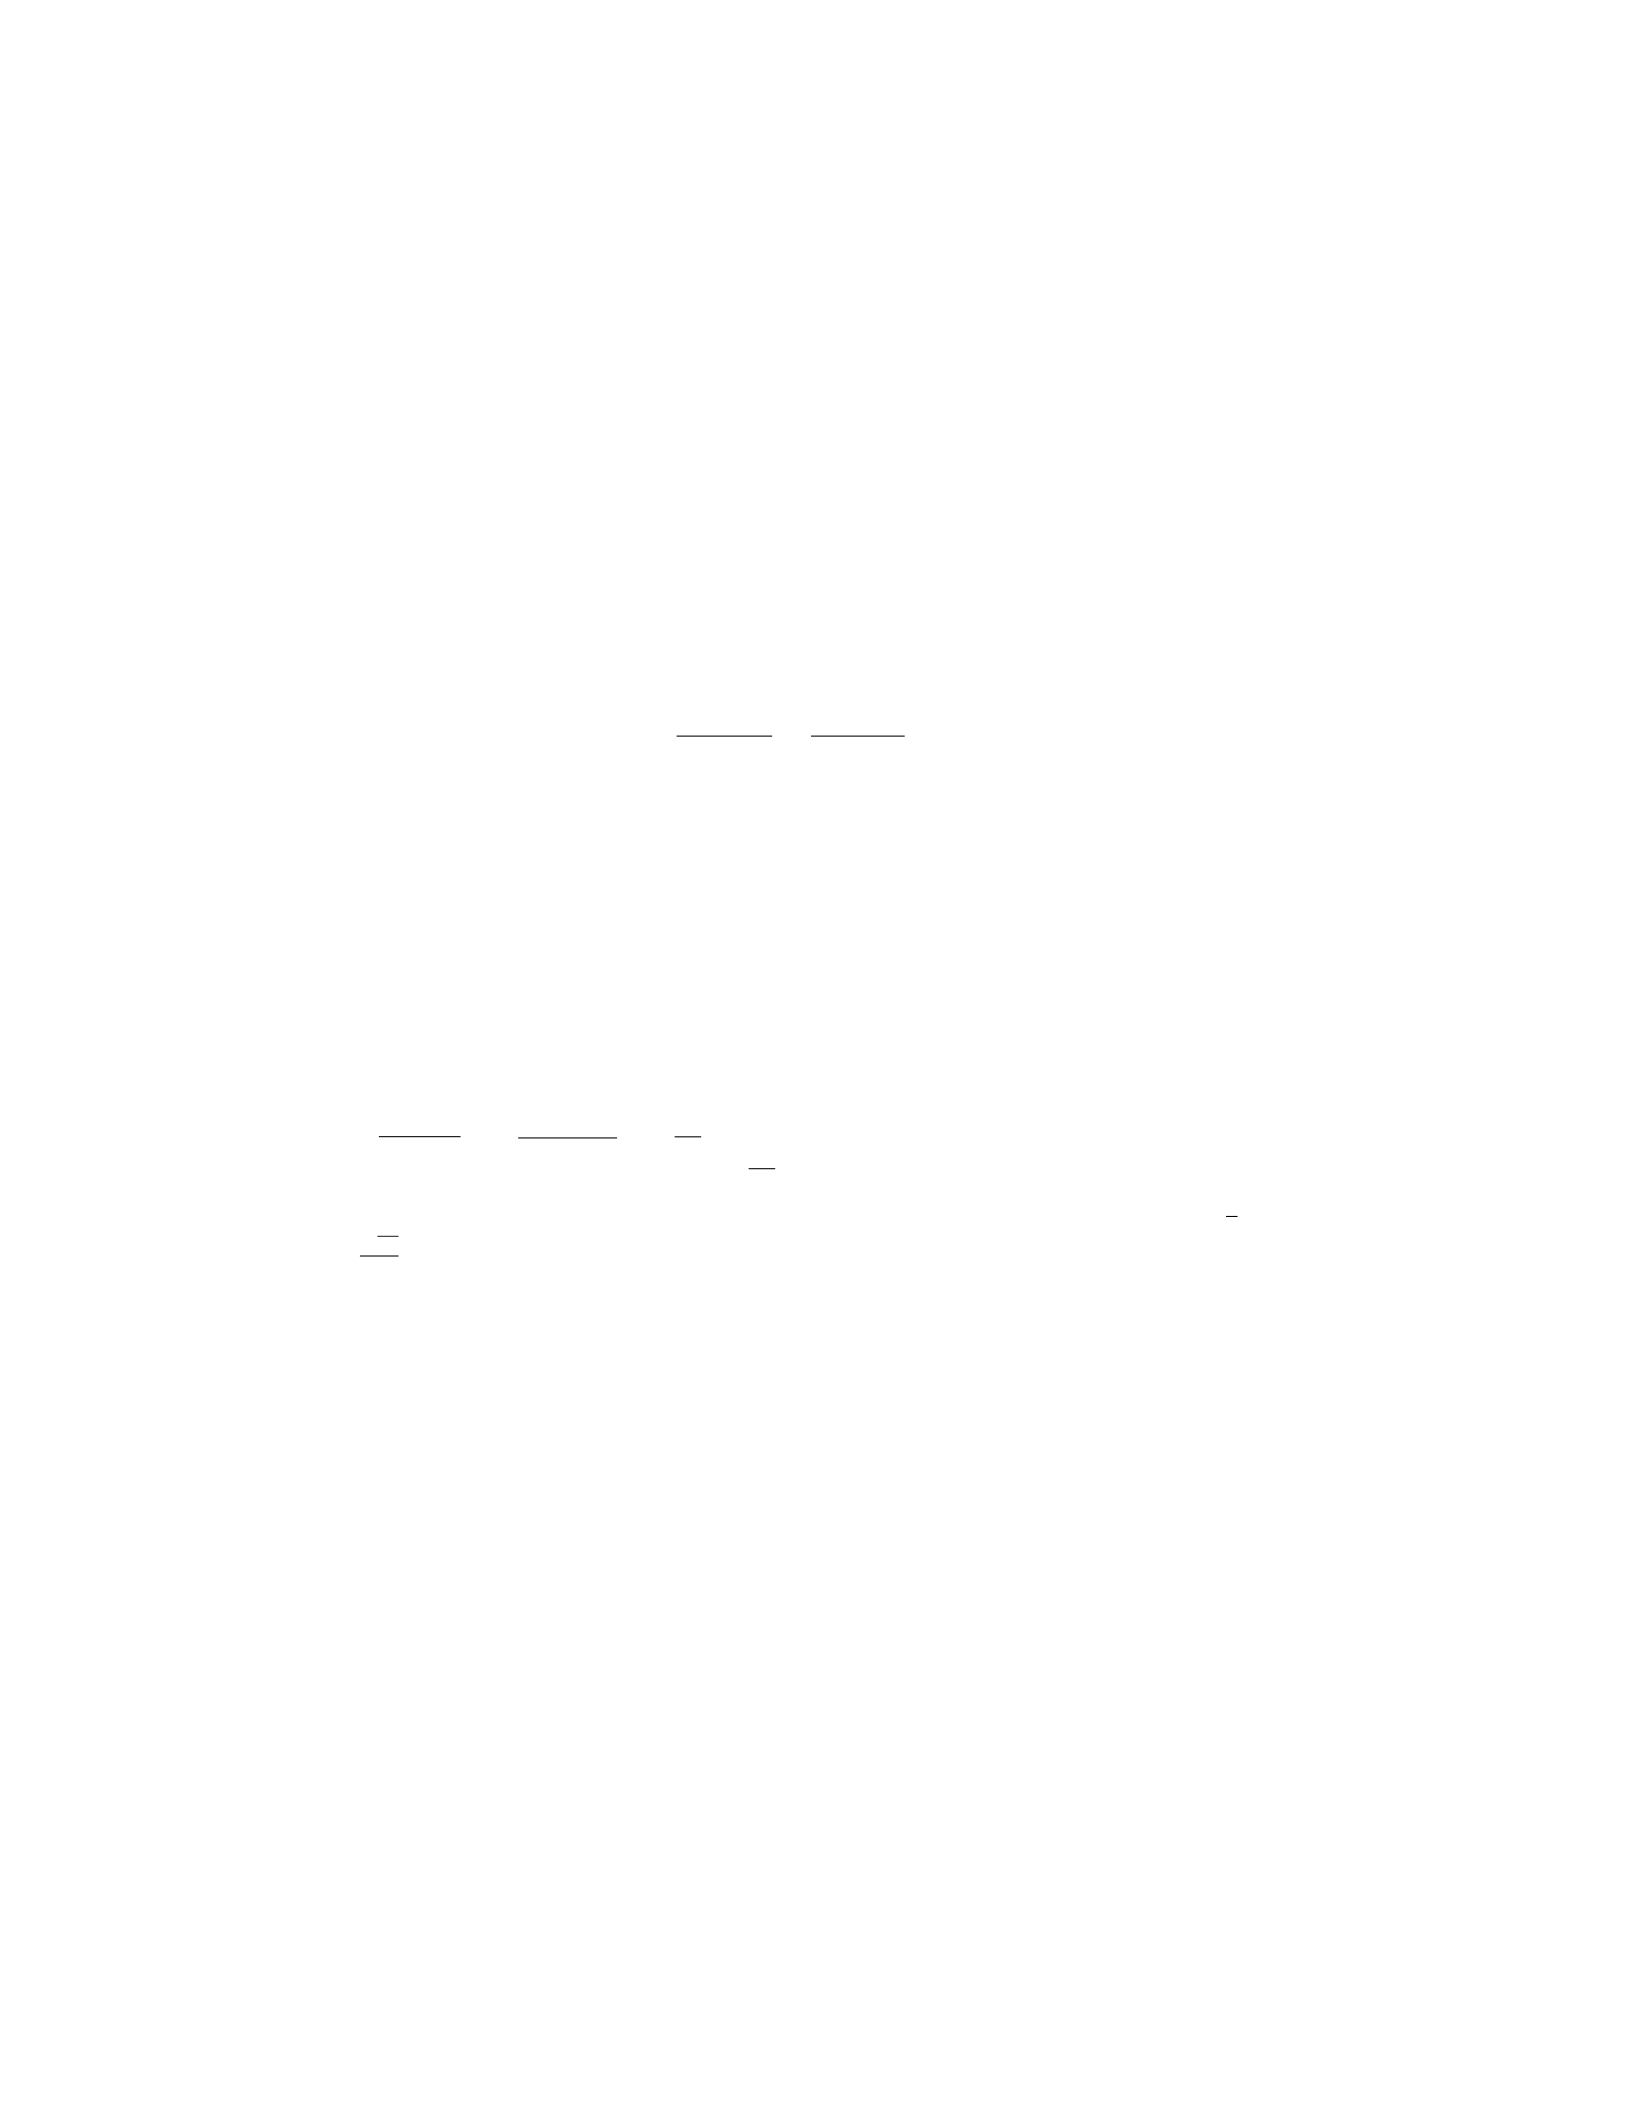
Step 1: Rearrange the equation to determine the type of shape.
4x2−16x+ 9y2+ 36y= 36
4(x2−4x) + 9(y2+ 4y) = 36
4(x2−4x+ 4) + 9(y2+ 4y+ 4) = 36 + 4(4) + 9(4)
4(x−2)2+ 9(y+ 2)2= 100
Comparing the equation to the standard form of the ellipse:
(x−h)2
a2+(y−k)2
b2= 1
We can see that this equation represents an ellipse.
Step 2: Identify the center and radii of the ellipse. The center of the ellipse
is (2, -2). The major axis has length 2a= 20 and the minor axis has length
2b= 18. Therefore, a= 10 and b= 9.
Step 3: Determine the major and minor axes. The major axis is along the
x-axis, which means the ellipse is wider horizontally. The endpoints of the major
axis are (2 ±10,−2) = (12,−2) and (−8,−2). The length of the major axis is
20.
The minor axis is along the y-axis. The endpoints of the minor axis are
(2,−2±9) = (2,7) and (2,−11). The length of the minor axis is 18.
Step 4: Find the foci. The distance from the center to the foci is c=
√a2−b2=√100 −81 = √19.
The foci are located at (2 ±√19,−2) ≈(6.36,−2) and (−2.36,−2).
Step 5: Calculate the eccentricity. The eccentricity is given by e=c
a=
√19
10 ≈0.44.
Thus, the given equation represents an ellipse centered at (2, -2) with a
major axis of length 20, a minor axis of length 18, foci at approximately (6.36,
-2) and (-2.36, -2), and an eccentricity of approximately 0.44.
Question 21
Question
Plot and analyze the geometric shape defined by the equation 4x2+ 9y2−8x+
36y−4 = 0.
Solution
Step 1: Rewrite the equation in standard form by completing the square for
both xand yterms.
16

Step 2: Begin with the xterms.
4x2−8x= 4(x2−2x)
= 4(x2−2x+ 1 −1)
= 4((x−1)2−1)
= 4(x−1)2−4
Step 3: Now work on the yterms.
9y2+ 36y= 9(y2+ 4y)
= 9(y2+ 4y+ 4 −4)
= 9((y+ 2)2−4)
= 9(y+ 2)2−36
Step 4: Substitute these results back into the original equation.
4(x−1)2−4 + 9(y+ 2)2−36 −4=0
4(x−1)2+ 9(y+ 2)2= 44
Step 5: Divide by 44 to get the standard form of the equation.
(x−1)2
√44
√42+(y+ 2)2
√44
√92= 1
(x−1)2
11 +(y+ 2)2
4= 1
Step 6: Compare the resulting equation with the standard form of the ellipse,
(x−h)2
a2+(y−k)2
b2= 1. This ellipse has a center at (1,−2), a horizontal axis of
length 2a= 2√11, and a vertical axis of length 2b= 2 ·2 = 4.
Step 7: Thus, the plot is an ellipse centered at (1,−2) with a horizontal axis
of length 2√11 and a vertical axis of length 4.
Question 22
Question
Consider the geometric shape defined by the following equations:
x= 2 cos(t), y = 3 sin(t), z =t
where 0 ≤t≤2π. Plot this shape in 3D space and analyze its properties.
17

Solution
To plot this shape and analyze its properties, we first need to parameterize the
given equations. Let P(t) = (2 cos(t),3 sin(t), t) for 0 ≤t≤2π.
Step 1: Plotting the Shape
We can plot this shape by varying the parameter tfrom 0 to 2π. This will
give us a curve in 3D space. Let’s plot this curve using a graphing software.
Step 2: Analyzing the Shape
From the plot, we observe that the shape defined by the given equations is
a helix. It spirals upwards along the z-axis as tincreases from 0 to 2π.
Step 3: Calculating Length of the Curve
To calculate the length of the curve, we use the formula for the arc length
of a curve in 3D space:
L=Zt2
t1sdx
dt 2
+dy
dt 2
+dz
dt 2
dt
Here, dx
dt =−2 sin(t), dy
dt = 3 cos(t), and dz
dt = 1.
Thus, the length of the curve P(t) from t= 0 to t= 2πis:
L=Z2π
0p(−2 sin(t))2+ (3 cos(t))2+ 12dt
After evaluating this integral, we can find the total length of the helix.
Question 23
Question
Consider the following parametric equations:
x(t) = 2 cos(t)
y(t) = 3 sin(t)
Determine the shape of the curve described by these equations and analyze its
properties.
Solution
Step 1: To find the shape of the curve, we can eliminate the parameter tby
expressing yin terms of x.
y(t) = 3 sin(t)
⇒sin(t) = y
3
Similarly,
x(t) = 2 cos(t)
18
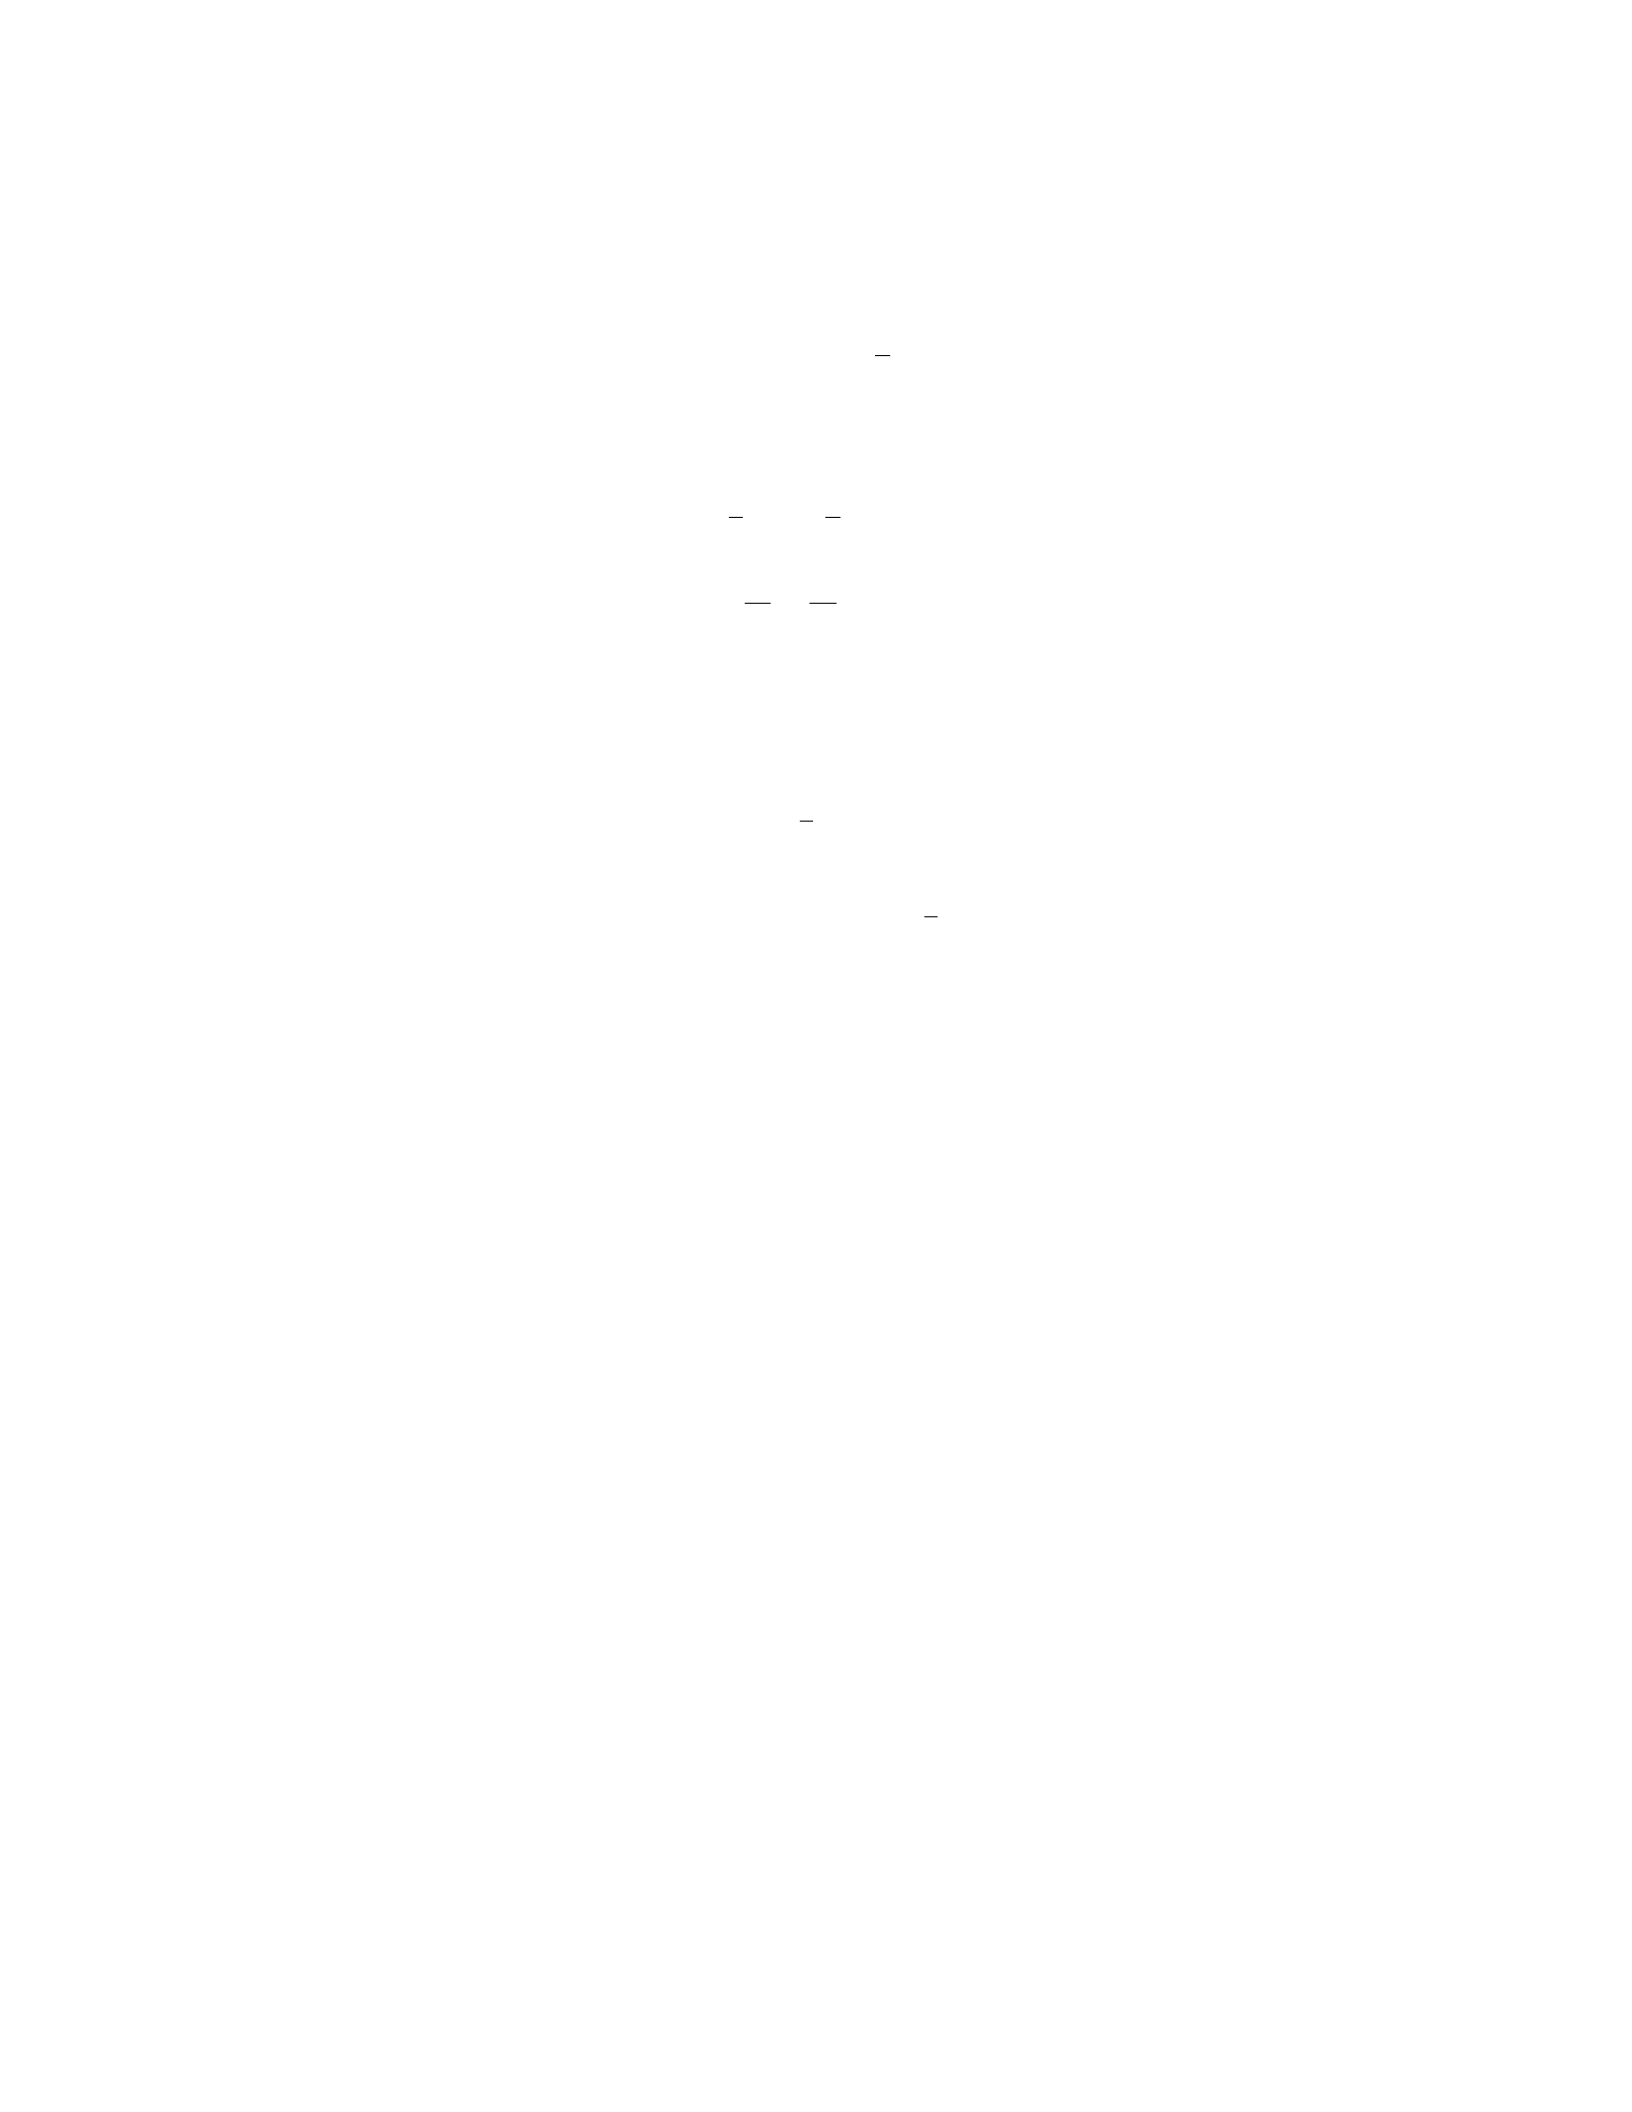
⇒cos(t) = x
2
Step 2: Since sin2(t) + cos2(t) = 1, we can substitute the expressions for
sin(t) and cos(t) into this equation.
y
32+x
22= 1
y2
9+x2
4= 1
4x2+ 9y2= 36
Step 3: The equation 4x2+ 9y2= 36 is the equation of an ellipse centered
at the origin with major axis along the y-axis and minor axis along the x-axis.
Step 4: The major axis has length 2a= 6 and the minor axis has length
2b= 4. Thus, the semi-major axis a= 3 and the semi-minor axis b= 2.
Step 5: The ellipse has foci (0,±√5).
Therefore, the curve described by the parametric equations x(t) = 2 cos(t)
and y(t) = 3 sin(t) is an ellipse centered at the origin with major axis along the
y-axis, minor axis along the x-axis, foci at (0,±√5), semi-major axis a= 3, and
semi-minor axis b= 2.
Question 24
Question
Consider the following geometric shape in the xy-plane:
16x2−24xy + 9y2+ 32x−36y+ 36 = 0
Determine the type of conic section represented by this equation, sketch the
shape, and identify its key features.
Solution
Step 1: Identify the Conic Section
To determine the type of conic section represented by the given equation, we
examine the coefficients of x2,xy, and y2. Since the coefficients of x2and y2
are both positive and the coefficient of xy is negative, the conic section is an
ellipse.
Step 2: Find the Center of the Ellipse
To find the center of the ellipse, we complete the square for both xand yterms.
16(x2+ 2x)−24xy + 9(y2−4y) = −36
16(x+ 1)2+ 9(y−2)2= 36
The center of the ellipse is (−1,2).
19
Step 3: Determine the Major and Minor Axes
The major axis of the ellipse corresponds to the larger of the 16 and 9 coefficients.
The minor axis corresponds to the smaller coefficient. So, the major axis is along
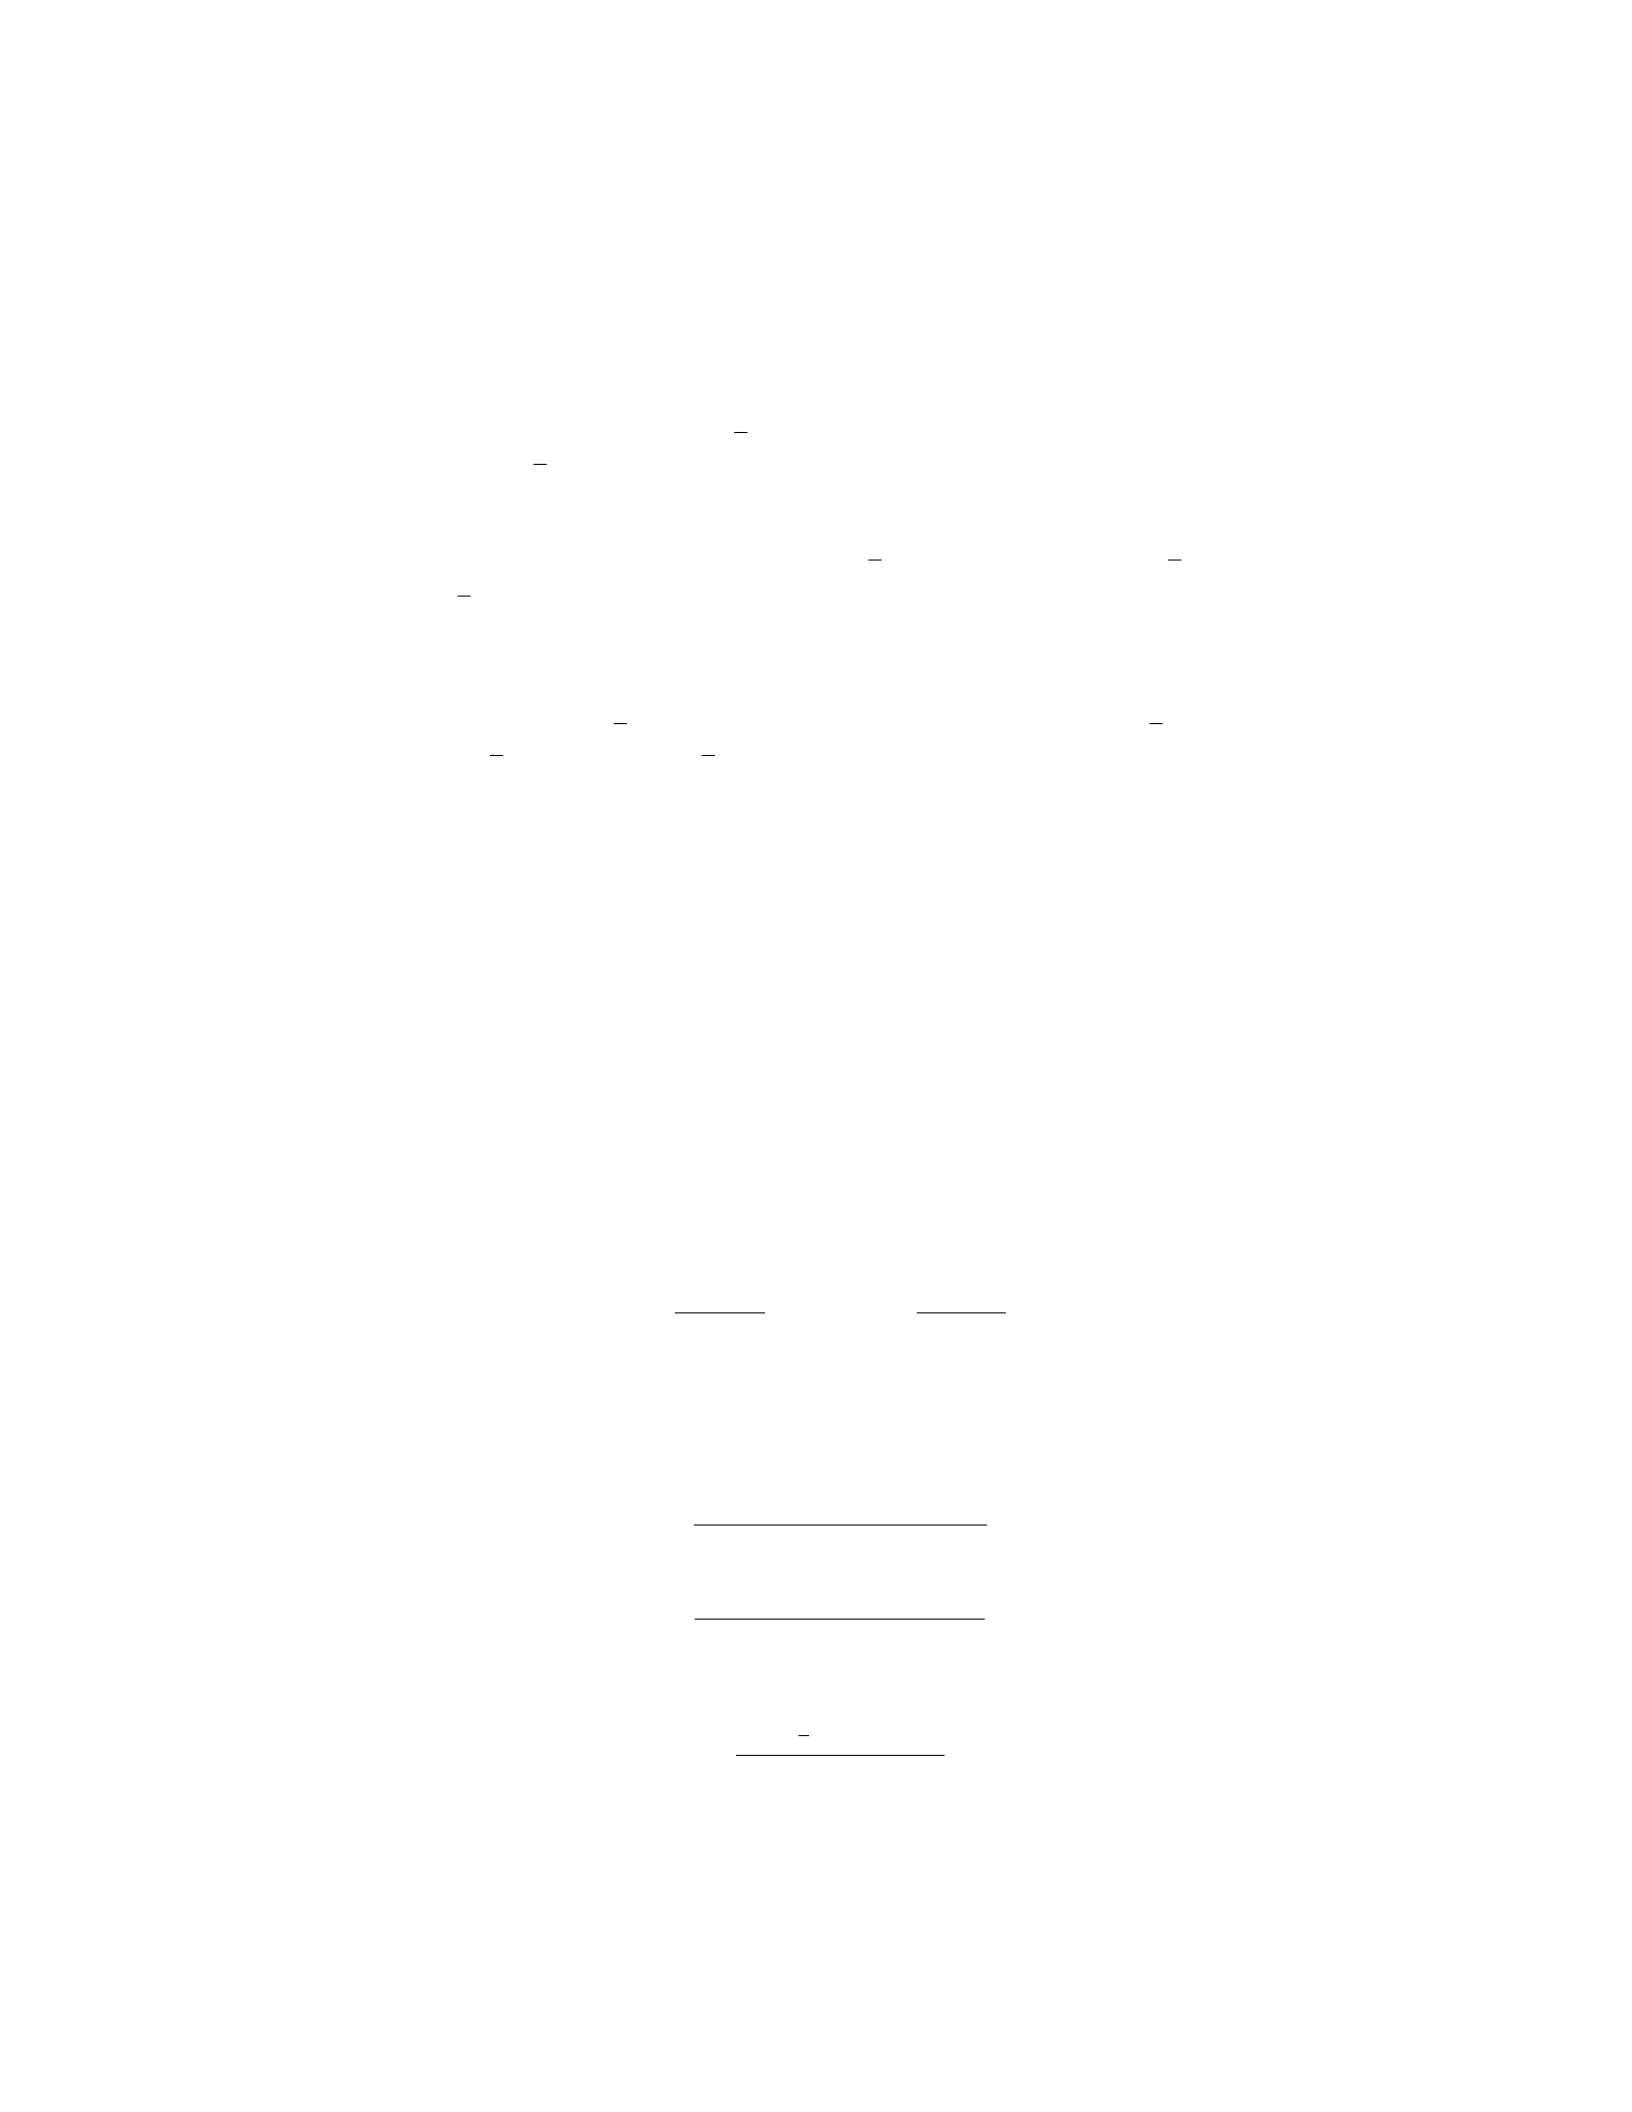
the x-axis with length 2a= 2√6 and the minor axis is along the y-axis with
length 2b= 2√4.
Step 4: Find the Foci of the Ellipse
The foci of an ellipse are located at a distance cfrom the center, where c2=
a2−b2. Here, c2= 6 −4 = 2, so c=√2. The foci are −1−√2,2and
−1 + √2,2.
Step 5: Plot and Analyze the Ellipse
With the center, major and minor axes, and foci identified, we can sketch the
ellipse in the xy-plane. The ellipse has center (−1,2), major axis along the
x-axis with length 2√6, minor axis along the y-axis with length 2√4, and foci
at −1−√2,2and −1 + √2,2.
Question 25
Question
Consider the graph of the region defined by x2+y2≤1. Calculate the area of
the region and find the centroid of the region.
Solution
Step 1: To find the area of the region, we will calculate the area of the circle
with radius 1.
Area = π·(radius)2=π·12=π
Step 2: Next, to find the centroid of the region, we will use the formulas:
¯x=Rx·dA
Area and ¯y=Ry·dA
Area
where dA =dx ·dy.
Step 3: For the given region, we will switch to polar coordinates, with x=
r·cos(θ) and y=r·sin(θ). The integral for centroid calculation then becomes:
¯x=R2π
0R1
0(r·cos(θ)) ·r dr dθ
π
¯y=R2π
0R1
0(r·sin(θ)) ·r dr dθ
π
Step 4: Evaluating the integrals, we get:
¯x=R2π
01
3·cos(θ)dθ
π
20
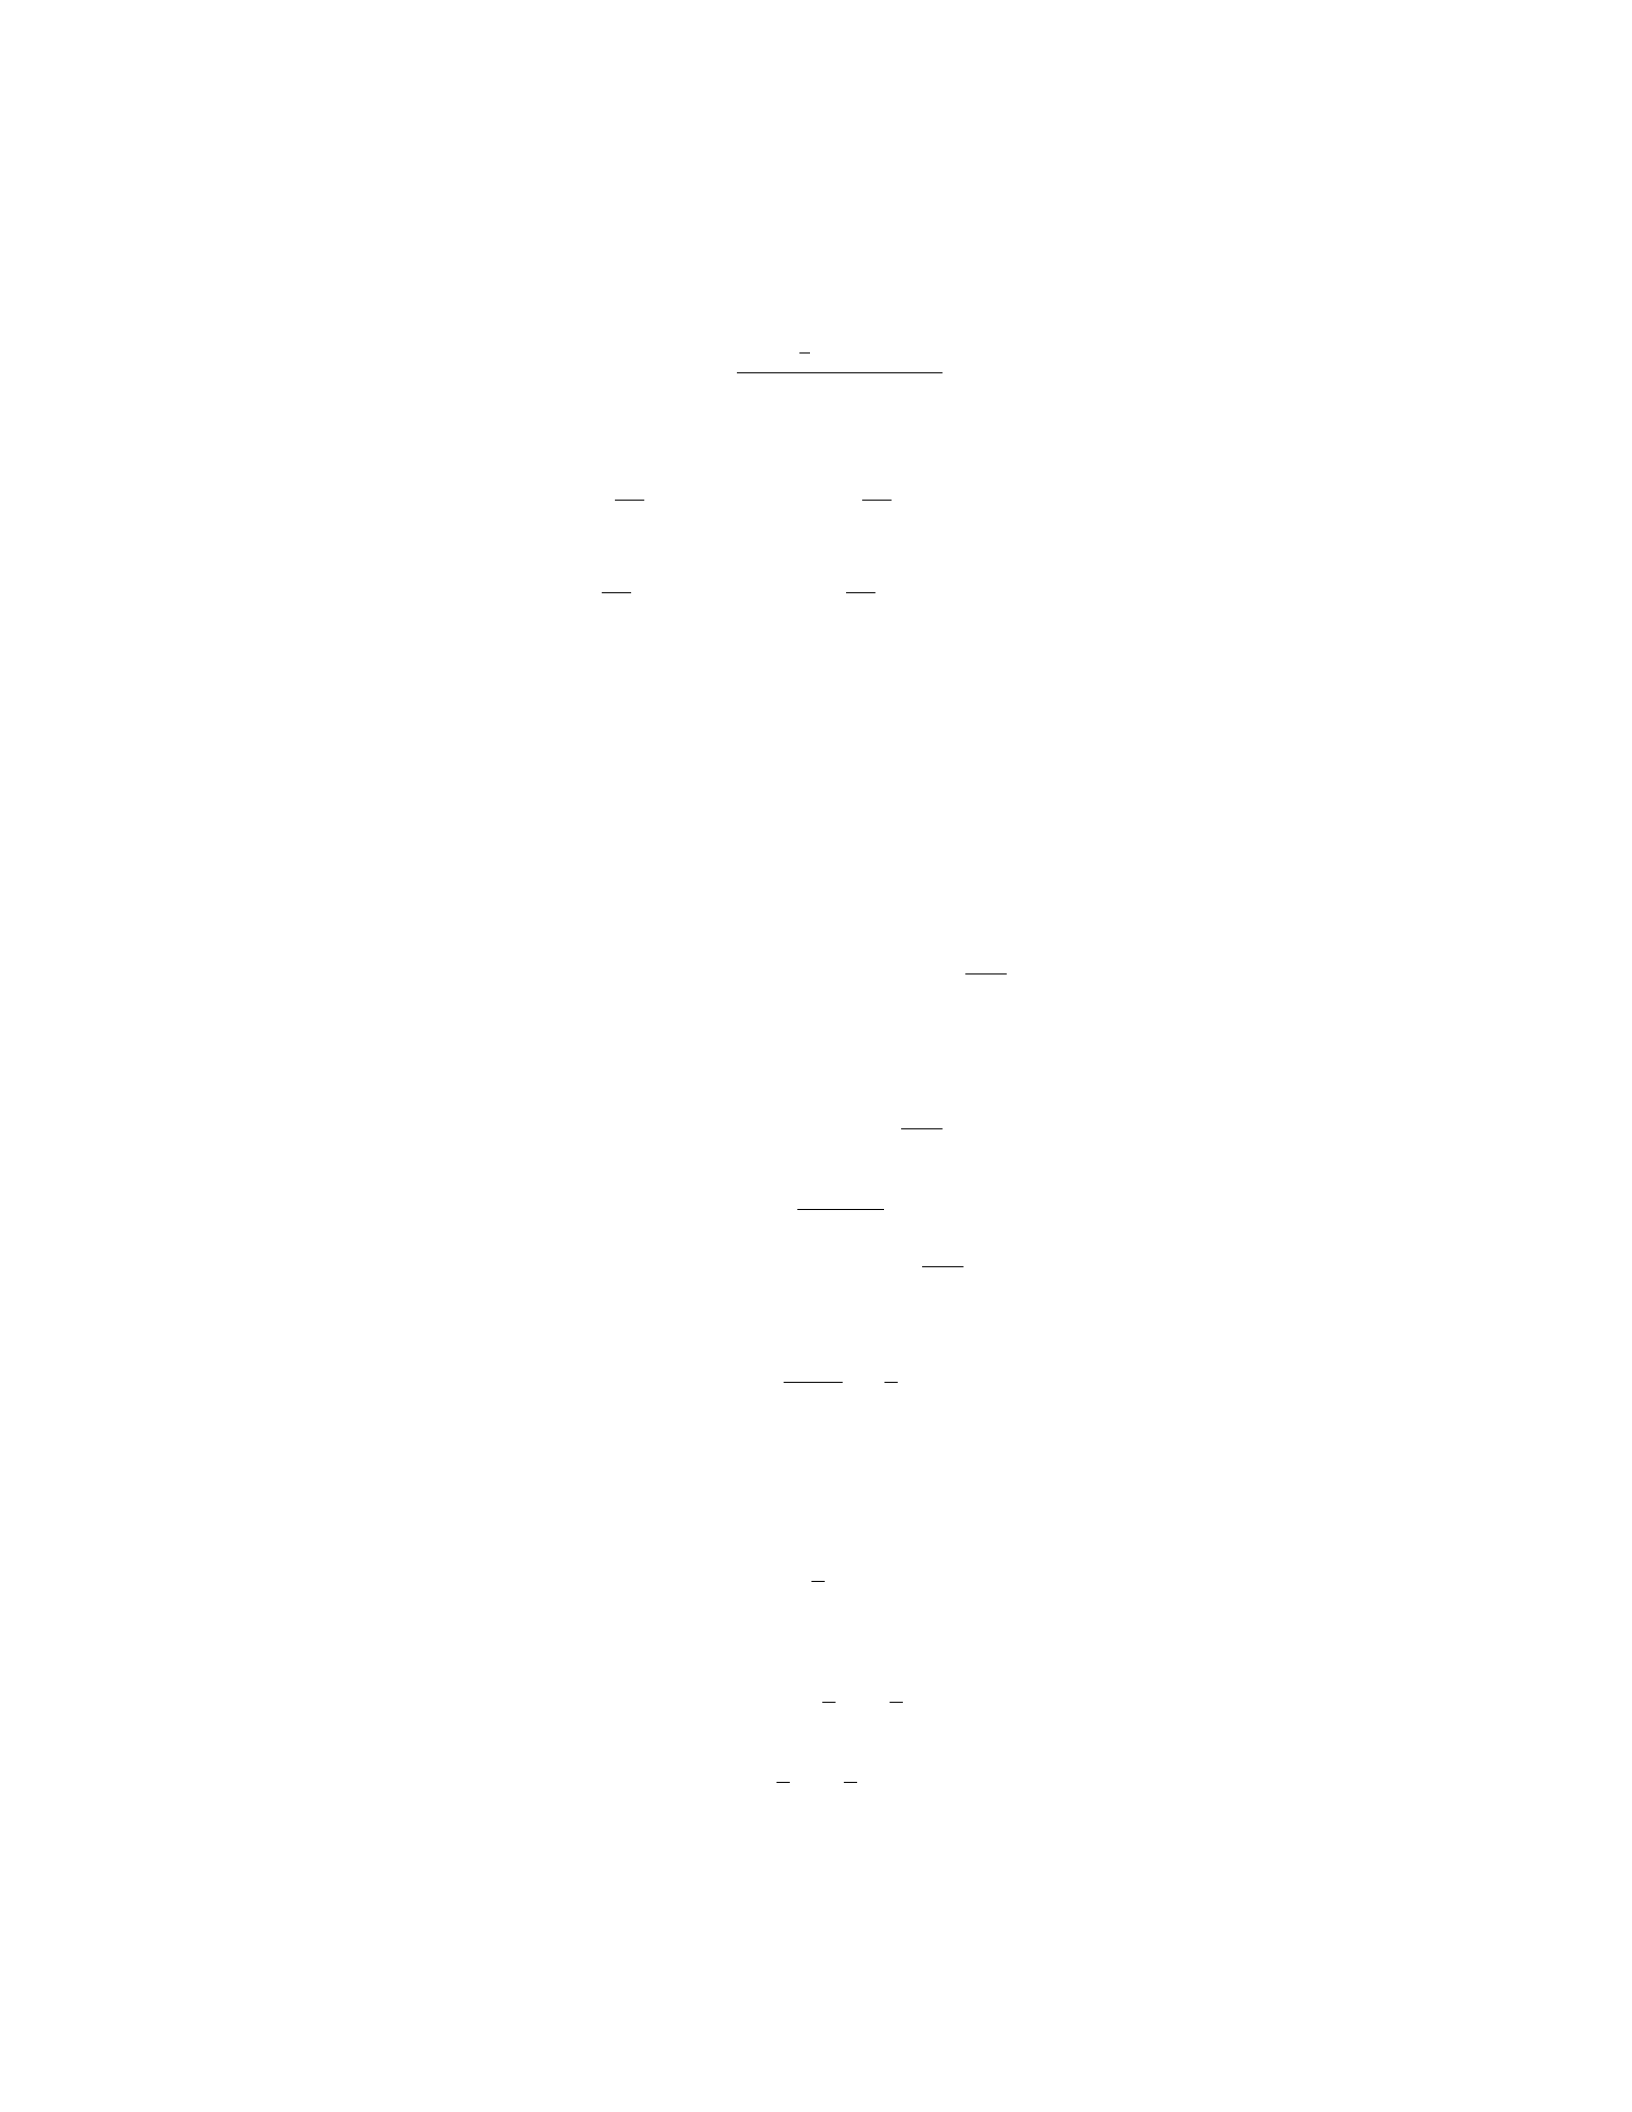
¯y=R2π
01
3·sin(θ)dθ
π
Step 5: Solving the integrals, we find:
¯x=1
3π·Z2π
0
cos(θ)dθ =1
3π·[sin(θ)]2π
0= 0
¯y=1
3π·Z2π
0
sin(θ)dθ =1
3π·[−cos(θ)]2π
0= 0
Step 6: Therefore, the centroid of the given region is (0,0).
Question 26
Question
Let Abe the point (2,3), and let Bbe the point (5,7). Determine the equations
of:
1. the line passing through Aand B,
2. the perpendicular bisector of the line segment AB.
Solution
To determine the equations of the lines passing through the points Aand B, we
first need to find the slope of the line segment AB using the formula:
m=y2−y1
x2−x1
.
Step 1: Find the slope of line segment AB.Given points A(2,3) and
B(5,7), the slope mof the line passing through Aand Bis:
m=7−3
5−2=4
3.
Step 2: Determine the equation of the line passing through Aand
B.Since the equation of a line with slope mpassing through point (x1, y1) is
given by y−y1=m(x−x1), the equation of the line passing through points A
and Bis:
y−3 = 4
3(x−2).
Expanding and simplifying:
y−3 = 4
3x−8
3
y=4
3x−8
3+ 3
21

y=4
3x−8
3+9
3
y=4
3x+1
3.
Therefore, the equation of the line passing through Aand Bis y=4
3x+1
3.
Step 3: Find the midpoint of line segment AB.To find the midpoint
of the line segment AB, we use the midpoint formula:
x1+x2
2,y1+y2
2.
For points A(2,3) and B(5,7), the midpoint Mof the line segment AB is:
2+5
2,3+7
2=7
2,10
2=7
2,5.
Step 4: Determine the slope of the perpendicular bisector. The
slope of a line perpendicular to a line with slope mis −1
m. Thus, the slope of
the perpendicular bisector of the line segment AB is:
−1
4
3
=−3
4.
Step 5: Find the equation of the perpendicular bisector. Since the
perpendicular bisector passes through the midpoint M7
2,5and has a slope of
−3
4, its equation is:
y−5 = −3
4x−7
2.
Expanding and simplifying:
y−5 = −3
4x+21
8
y=−3
4x+21
8+ 5
y=−3
4x+21
8+40
8
y=−3
4x+61
8.
Therefore, the equation of the perpendicular bisector of the line segment AB
is y=−3
4x+61
8.
Question 27
Question
Consider the set of points in R2defined by the equation 3x2+ 4xy + 3y2= 1.
(a) Sketch the graph of this equation. (b) Classify the shape of the graph
and explain your reasoning.
22
Solution
(a) To sketch the graph of the equation 3x2+ 4xy + 3y2= 1, let’s first rewrite
the equation in matrix form:
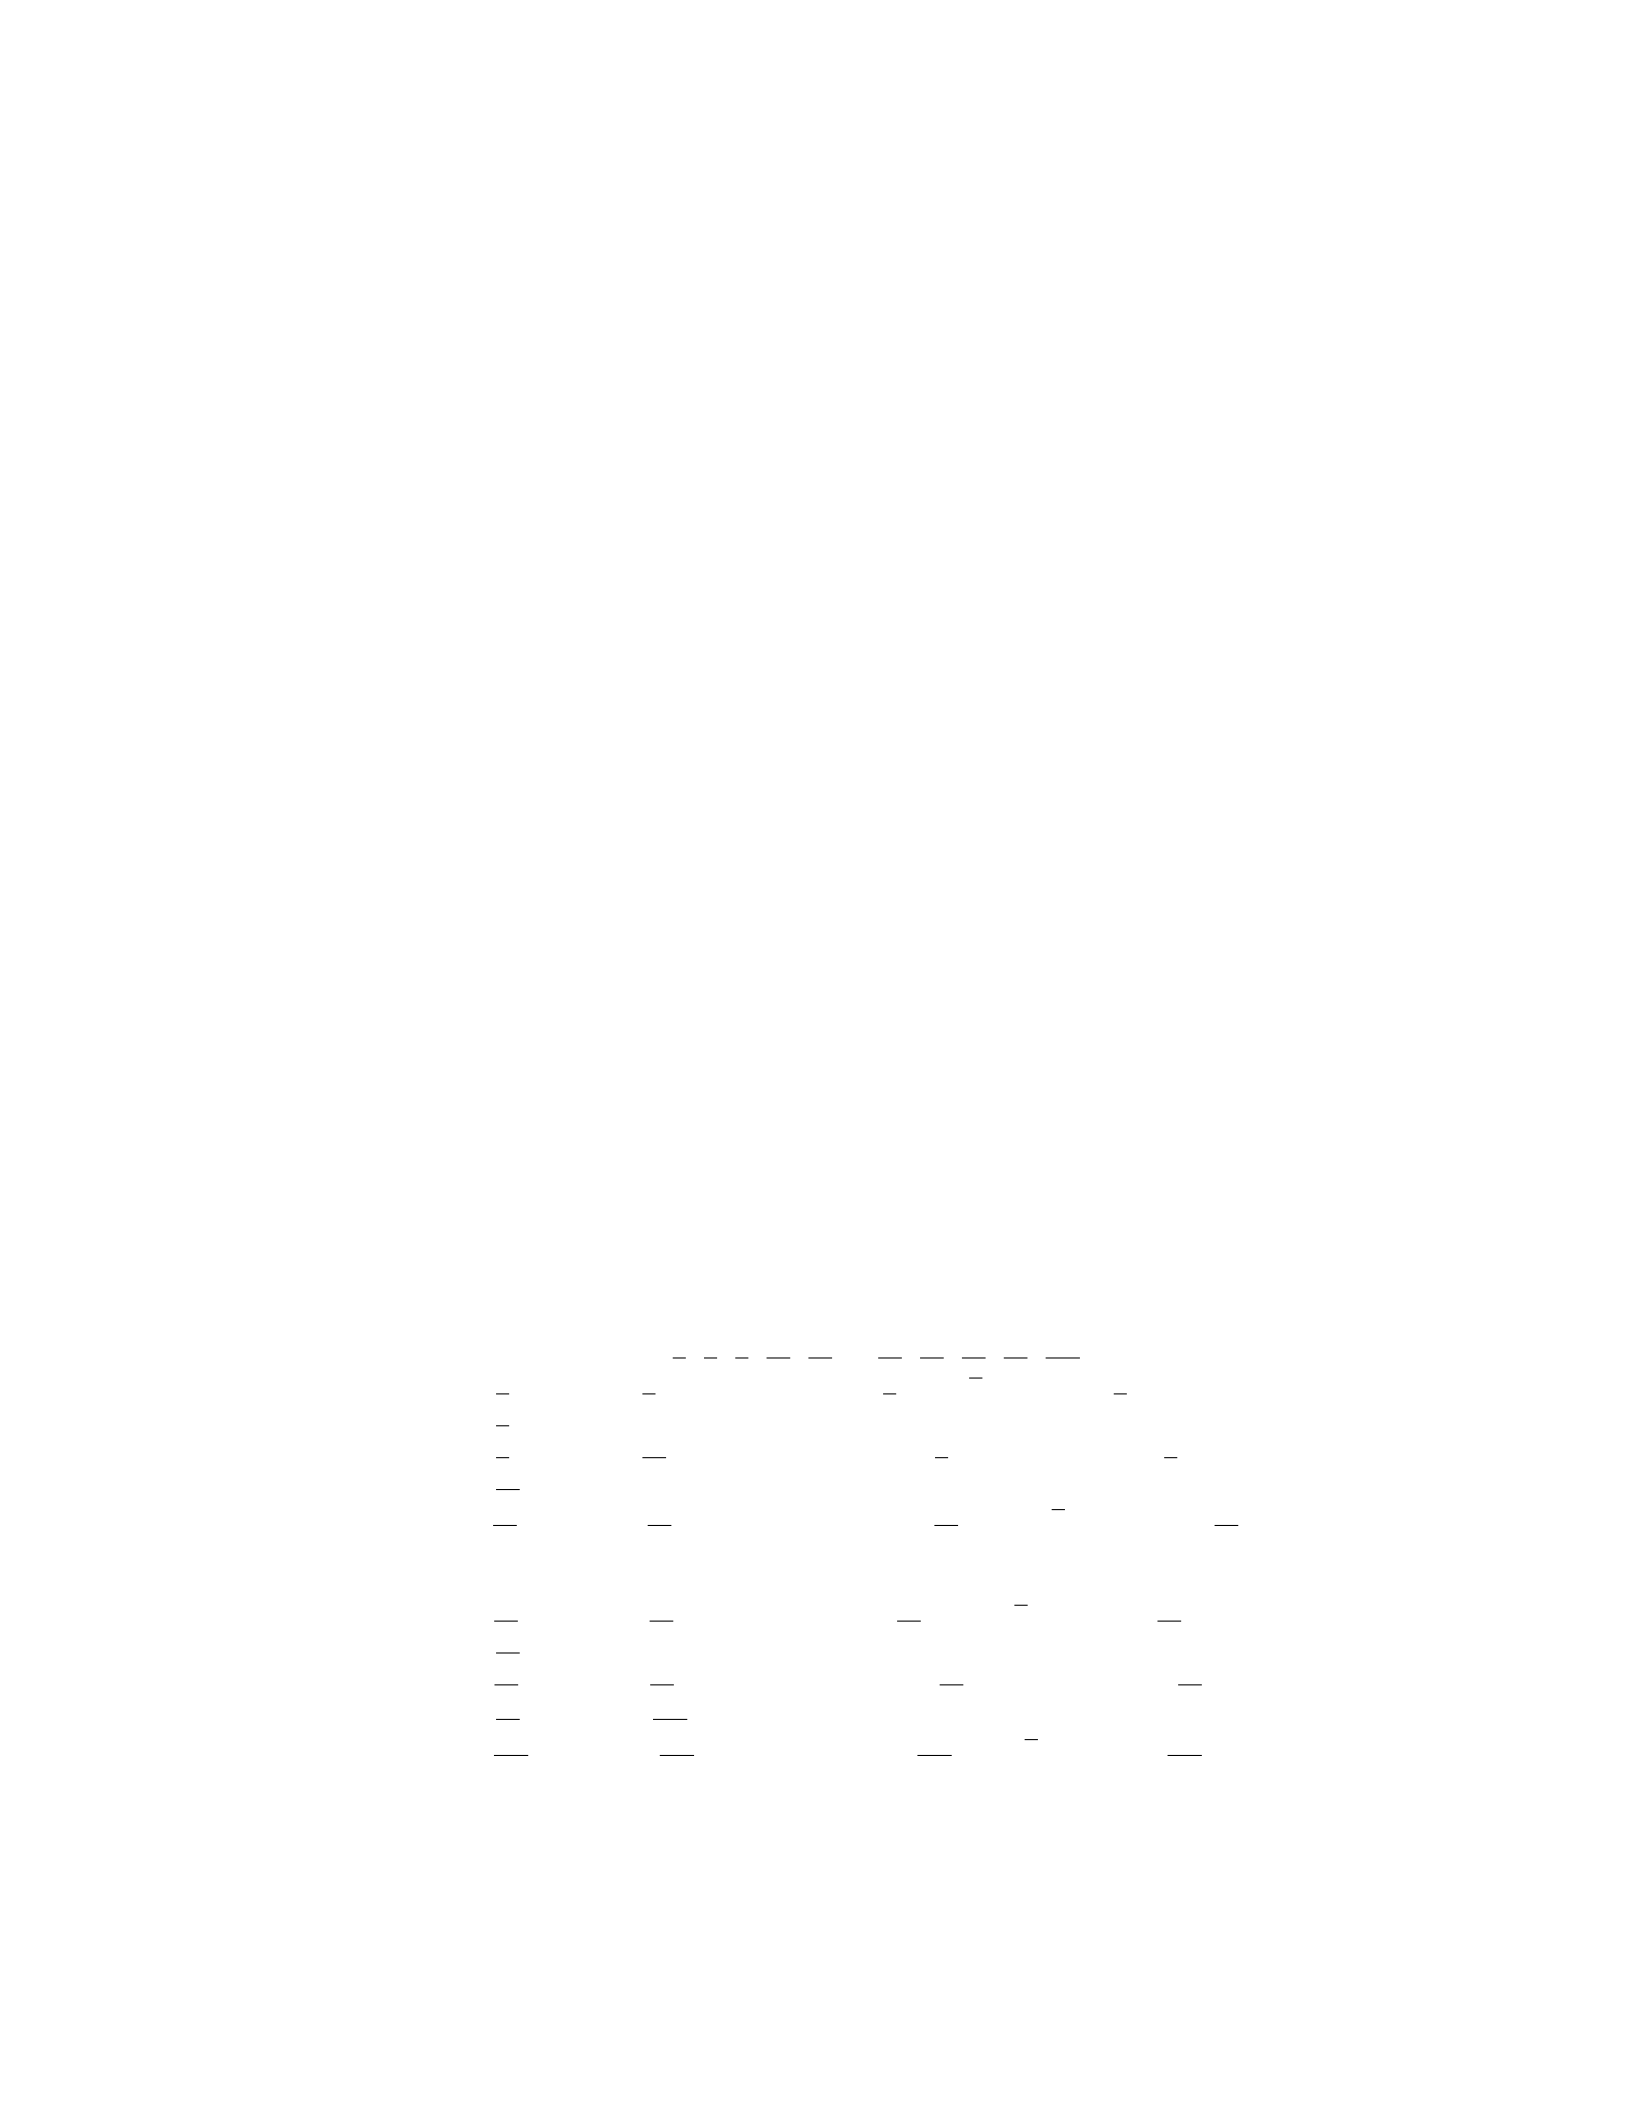
x y3 2
2 3x
y= 1
This is a quadratic equation in two variables, which represents a conic sec-
tion. To sketch the graph, we will analyze its level curves.
(b) To classify the shape of the graph, we will analyze the matrix 3 2
2 3.
The determinant of this matrix is 3 ×3−2×2 = 5, and the trace is 3 + 3 = 6.
Since the determinant is positive and the trace is greater than zero, we conclude
that the graph represents an ellipse.
Therefore, the graph of the equation 3x2+ 4xy + 3y2= 1 is an ellipse in R2.
Question 28
Question
Consider the curve defined by the polar equation r= 2 sin(3θ).
(a) Plot the graph of the curve.
(b) Determine the number of petals in the graph and provide a geometric
interpretation for this number.
Solution
(a) To plot the graph of the curve defined by the polar equation r= 2 sin(3θ),
we can first consider different values of θin the interval 0 ≤θ≤2πand compute
the corresponding values of r. Then we can convert the polar coordinates to
Cartesian coordinates using the formulas x=rcos(θ) and y=rsin(θ).
When θ= 0, r= 0, so the point is at the origin.
Let’s now consider θ=π
6,π
3,π
2,2π
3,5π
6, π, 7π
6,4π
3,3π
2,5π
3,11π
6,2π:
For θ=π
6,r= 2 sinπ
2= 2 ⇒x= 2 cosπ
6=√3, y= 2 sinπ
6= 1.
For θ=π
3,r= 2 sin(π) = 0 ⇒x= 0, y= 0.
For θ=π
2,r= 2 sin3π
2=−2⇒x=−2 cosπ
2= 0, y=−2 sinπ
2=−2.
For θ=2π
3,r= 2 sin(2π)=0⇒x= 0, y= 0.
For θ=5π
6,r= 2 sin3π
2=−2⇒x=−2 cos5π
6=−√3, y=−2 sin5π
6=
−1.
For θ=π,r= 2 sin(3π)=0⇒x= 0, y= 0.
For θ=7π
6,r= 2 sin5π
2= 2 ⇒x= 2 cos7π
6=−√3, y= 2 sin7π
6=−1.
For θ=4π
3,r= 2 sin(3π)=0⇒x= 0, y= 0.
For θ=3π
2,r= 2 sin9π
2=−2⇒x=−2 cos3π
2= 0, y=−2 sin3π
2= 2.
For θ=5π
3,r= 2 sin15π
2= 0 ⇒x= 0, y= 0.
For θ=11π
6,r= 2 sin33π
6= 2 ⇒x= 2 cos11π
6=√3, y= 2 sin11π
6= 1.
Finally, for θ= 2π,r= 2 sin(6π)=0⇒
23

Question 29
Question
Consider the following geometric shape in the xy-plane: - Circle centered at
(2,3) with radius 4. - Line passing through points (5,−1) and (1,5).
Plot the circle and the line on the same set of axes and find the points of
intersection, if any.
Solution
To plot the circle and the line on the same set of axes, we first need to find their
equations.
Step 1: Find the equation of the circle The equation of a circle with
center (h, k) and radius ris given by:
(x−h)2+ (y−k)2=r2
In this case, the center of the circle is (2,3) and the radius is 4, so the
equation of the circle is:
(x−2)2+ (y−3)2= 16
Step 2: Find the equation of the line The equation of a line passing
through two points (x1, y1) and (x2, y2) can be found using the point-slope form
given by:
y−y1=y2−y1
x2−x1·(x−x1)
Using the points (5,−1) and (1,5), we have:
y−(−1) = 5−(−1)
1−5·(x−5)
y+ 1 = 6
−4·(x−5)
y+ 1 = −3
2(x−5)
y=−3
2x+13
2
Step 3: Plot the circle and the line Now, we can plot the circle with
equation (x−2)2+ (y−3)2= 16 and the line y=−3
2x+13
2on the same set of
axes.
Step 4: Find the points of intersection To find the points of intersection,
we need to solve the system of equations formed by the circle and the line.
Substituting y=−3
2x+13
2into the equation of the circle:
(x−2)2+−3
2x+13
2−32
= 16
24

Solving this equation will give us the x-coordinates of the intersection points.
Substituting these x-values back into y=−3
2x+13
2will give us the corresponding
y-coordinates.
Question 30
Question
Consider the following geometric shapes: a circle centered at the origin with
radius 2, a parabola given by the equation y=x2−4x+ 3, and a line passing
through the points (0,1) and (2,5). Plot and analyze these shapes. Determine
the points of intersection, if any, among the shapes.
Solution
To plot and analyze the given geometric shapes, we will follow these steps:
Step 1:Plot the circle, parabola, and line on the same coordinate system.
The circle with center at the origin and radius 2 is given by the equation
x2+y2= 4.
The parabola y=x2−4x+ 3 opens upwards, and the line passing through
(0,1) and (2,5) has a slope of 5−1
2−0= 2 and the equation y= 2x+ 1.
We use a graphing tool to plot these shapes.
Step 2:Analyze the shapes and determine any points of intersection.
From the graph, we see that the circle intersects the parabola at two points:
A(1,0) and B(3,2).
The line also intersects the parabola at the point C(1,0).
Hence, the points of intersection among the shapes are A(1,0), B(3,2), and
C(1,0).
25

