


MATH 125 - FINITE MATHEMATICS
- Plot and analyze geometric shapes
Question Bank - Set 1
Liberty University
Question 1
Question
Consider the following parametric equations:
x(t) = cos(t)
y(t) = sin(t)
where 0 ≤t≤2π.
Plot and analyze the geometric shape described by these parametric equa-
tions.
Solution
Step 1: Plotting the parametric curve by varying t.
Substitute tvalues from 0 to 2πin the parametric equations x(t) and y(t)
to generate points on the curve.
Step 2: Plotting the curve.
Use the generated points to plot the curve in the xy-plane.
Step 3: Analyzing the curve.
The parametric equations x(t) = cos(t) and y(t) = sin(t) represent the unit
circle centered at the origin. As tvaries from 0 to 2π, the curve traces out the
complete unit circle.
Step 4: Conclusion.
Therefore, the geometric shape described by the parametric equations x(t) =
cos(t) and y(t) = sin(t) is the unit circle centered at the origin.

Question 2
Question
Consider the following parametric equations for a curve in the xy-plane:
x(t) = t3−3t, y(t) = t2−2
Determine and plot the geometric shape traced out by the curve as tvaries over
all real numbers.
Solution
Step 1: To determine the geometric shape traced out by the curve, we first
eliminate the parameter tby expressing tin terms of xand yusing the equations
x(t) = t3−3tand y(t) = t2−2.
Step 2: From the equation x(t) = t3−3t, we can express tin terms of xas
follows:
t=3
qx+px2+ 3
Step 3: Substituting this expression for tinto the equation y(t) = t2−2, we
get:
y=3
qx+px2+ 32
−2
Step 4: Simplifying this equation, we find:
y=x2/3+ 31/6x−1/3−2
Step 5: Therefore, the geometric shape traced out by the curve is given by
the equation y=x2/3+ 31/6x−1/3−2. This is an example of a curve known as
asemicubical parabola.
Step 6: By plotting the equation y=x2/3+ 31/6x−1/3−2, we can visualize
the geometric shape traced out by the curve.
Step 7: The plot of the semicubical parabola indicates a curve that behaves
like a parabola near the origin but shows distinct characteristics compared to a
regular parabola. The curve is symmetric about the y-axis and approaches the
x-axis but never intersects it.
Therefore, the geometric shape traced out by the curve is a semicubical
parabola.
Question 3
Question
Consider the curve defined by the parametric equations:
x(t) = 2 cos(t), y(t) = 3 sin(t),0≤t≤2π
Sketch the curve and analyze its geometric shape.
2

Solution
Step 1: To sketch the curve, we first need to parametrically plot points by
substituting various values of tfrom the given interval [0,2π] into the parametric
equations x(t) and y(t).
Step 2: Let’s start by calculating points for t= 0 and t=π/2.
For t= 0:
x(0) = 2 cos(0) = 2
y(0) = 3 sin(0) = 0
So the point for t= 0 is (2,0).
For t=π
2:
xπ
2= 2 cos π
2= 0
yπ
2= 3 sin π
2= 3
So the point for t=π
2is (0,3).
Step 3: Continue calculating points for t=πand t=3π
2until t= 2π.
Step 4: Plotting all the calculated points and connecting them will give us
the sketch of the curve.
Step 5: By analyzing the curve, we notice that it forms an ellipse centered
at the origin with semi-major axis of length 3 along the y-axis and semi-minor
axis of length 2 along the x-axis. Thus, the geometric shape of the curve is an
ellipse.
Question 4
Question
Consider the following parametric equations:
x(t) = 2 cos(t)
y(t) = 3 sin(t)
Sketch and analyze the geometric shape represented by these parametric
equations.
Solution
Step 1: To sketch the geometric shape represented by the parametric equations,
we first note that x(t) = 2 cos(t) and y(t) = 3 sin(t) represent the xand y
coordinates of a point on the plane as tvaries.
Step 2: We can eliminate the parameter tfrom the equations by squaring
and adding them together:
x2(t) = 4 cos2(t)
y2(t) = 9 sin2(t)
3

Step 3: Adding the equations gives us:
x2(t) + y2(t) = 4 cos2(t) + 9 sin2(t)
Step 4: Using the trigonometric identity cos2(t) + sin2(t) = 1, we have:
x2(t) + y2(t) = 4(1 −sin2(t)) + 9 sin2(t)
x2(t) + y2(t) = 4 + 9 sin2(t)−4 sin2(t)
x2(t) + y2(t) = 4 + 5 sin2(t)
Step 5: Since sin2(t)≤1 for all t, we have x2+y2≤9. This is the equation
of an ellipse centered at the origin with semi-major axis of length 3 along the
y-axis and semi-minor axis of length 2 along the x-axis.
Step 6: Therefore, the geometric shape represented by the parametric equa-
tions is an ellipse centered at the origin.
Question 5
Question
Consider the geometric shape defined by the equation x2+y2+z2= 1.
1. Plot the 3D shape defined by the equation.
2. Determine whether the shape is a sphere or a cylinder, and justify your
answer.
3. Find the radius and center of the sphere (if it is a sphere).
Solution
1. To plot the 3D shape defined by the equation x2+y2+z2= 1, we can rewrite
the equation in spherical coordinates as r= 1 with 0 ≤θ≤2πand 0 ≤ϕ≤π.
This represents a unit sphere centered at the origin.
2. The shape defined by x2+y2+z2= 1 is a sphere. This is because the
equation represents the set of all points in 3D space that are a distance of 1
from the origin.
3. To find the radius and center of the sphere, we can rewrite the equation
of the sphere in the general form: (x−a)2+ (y−b)2+ (z−c)2=r2, where
(a, b, c) is the center of the sphere and ris the radius. Comparing with the given
equation x2+y2+z2= 1, we have a=b=c= 0 and r=√1 = 1.
Therefore, the sphere is centered at the origin (0,0,0) and has a radius of 1
unit.
4

Question 6
Question
Consider the circle with equation x2+y2−6x+ 4y−12 = 0.
1. Plot the circle on a Cartesian plane.
2. Find the center and radius of the circle.
3. Determine whether the point P(3,−2) lies inside, on, or outside the circle.
Solution
1. To plot the circle with equation x2+y2−6x+ 4y−12 = 0, we first rewrite
the equation in standard form by completing the square for both xand yterms:
(x2−6x)+(y2+ 4y) = 12
(x2−6x+ 9) + (y2+ 4y+ 4) = 12 + 9 + 4
(x−3)2+ (y+ 2)2= 25
This equation represents a circle with center (3,−2) and radius √25 = 5.
Now, we can plot the circle on a Cartesian plane.
2. The center of the circle is at (3,−2) and the radius is 5 units.
3. To determine the location of point P(3,−2), we substitute x= 3 and
y=−2 into the equation of the circle:
((3) −3)2+ ((−2) + 2)2= 0
Since the point P(3,−2) satisfies the equation of the circle, it lies on the
circle.
Question 7
Question
Consider the following geometric shapes: - Circle C1with center (−3,4) and
radius 5 - Ellipse E1with major axis along the line y= 2 and minor axis of
length 8 - Parabola P1with vertex at the origin opening to the right and focus
at (2,0) - Hyperbola H1with center at (1,−3), transverse axis along the line
x= 1, and conjugate axis of length 6
Plot the four geometric shapes on the same set of axes and analyze their key
features.
5

Solution
Step 1: Circle C1with center (−3,4) and radius 5 The equation of this circle is
(x+ 3)2+ (y−4)2= 25. The center is (−3,4) and the radius is 5. This means
the circle is centered at (−3,4) and has a radius of 5 units.
Step 2: Ellipse E1with major axis along the line y= 2 and minor axis of
length 8 The standard equation of an ellipse centered at (h, k) with major axis
along the x-axis and minor axis along the y-axis is (x−h)2
a2+(y−k)2
b2= 1. Since
the major axis is along y= 2, we have h= 0 and k= 2. Also, a= 4 and b= 2.
Thus, the equation of this ellipse is x2
16 +(y−2)2
4= 1.
Step 3: Parabola P1with vertex at the origin opening to the right and focus
at (2,0) The standard equation of a parabola with vertex at (h, k) opening to
the right is (x−h)2= 4p(y−k). Since the focus is at (2,0), we have h= 0 and
k= 0. Also, p= 2. Thus, the equation of this parabola is x2= 8y.
Step 4: Hyperbola H1with center at (1,−3), transverse axis along the line
x= 1, and conjugate axis of length 6 The standard equation of a hyperbola
centered at (h, k) with transverse axis along the x-axis is (x−h)2
a2−(y−k)2
b2= 1.
Since the center is at (1,−3) and the transverse axis is along x= 1, we have
h= 1 and k=−3. Also, a= 3 and b= 2. Thus, the equation of this hyperbola
is (x−1)2
9−(y+3)2
4= 1.
Now, plot the circle, ellipse, parabola, and hyperbola on the same set of axes.
Analyze each shape’s key features, such as center, vertices, foci, asymptotes (if
any), etc.
Question 8
Question
Consider the following parametric equations:
(x= 2 cos(t)
y= 3 sin(t)
Find the Cartesian equation of the curve defined by these parametric equations
and sketch the curve.
Solution
Step 1: To find the Cartesian equation of the curve defined by the parametric
equations, we eliminate the parameter tby eliminating cos(t) and sin(t).
Step 2: Square both equations:
x2= (2 cos(t))2= 4 cos2(t)
y2= (3 sin(t))2= 9 sin2(t)
6

Step 3: Use the Pythagorean identity cos2(t) + sin2(t) = 1 to eliminate
cos2(t) and sin2(t):
x2+y2= 4 cos2(t)+9 sin2(t) = 4(1−sin2(t))+9 sin2(t) = 4+9 sin2(t)−4 sin2(t) = 4+5 sin2(t)
Step 4: Therefore, the Cartesian equation of the curve is x2+y2= 4 +
5 sin2(t).
Step 5: The equation x2+y2= 4 + 5 sin2(t) represents an ellipse with a
major axis along the y-axis and a minor axis along the x-axis. To sketch the
curve, note that the major axis has length 3 and the minor axis has length 2.
Step 6: Sketch the ellipse with center at the origin, major axis along the
y-axis (vertical ellipse), major axis length 3, and minor axis length 2.
Step 7: Thus, the curve defined by the parametric equations is the ellipse
x2+y2= 4 + 5 sin2(t).
Question 9
Question
Consider the geometric shape defined by the following equation in polar coor-
dinates: r= 5 sin(2θ). Plot the shape and analyze its key properties such as
symmetry, concavity, and intersections with the axis.
Solution
To plot and analyze the given geometric shape, we will follow these steps:
Step 1: Calculate θ-intercepts
Setting r= 0, we find the θ-intercepts by solving 5 sin(2θ) = 0. This gives
us sin(2θ) = 0 =⇒2θ=nπ, where nis an integer.
Therefore, the θ-intercepts occur at θ=nπ
2for integer values of n.
Step 2: Determine Symmetry
The equation r= 5 sin(2θ) is symmetric about the origin. This can be seen
by noting that sin(2θ) is an odd function, resulting in symmetric points across
the origin.
Step 3: Analyze Concavity
To analyze the concavity of the shape, we consider the second derivative of
rwith respect to θ:
d2r
dθ2= 20 cos(2θ)
The concavity changes at points where cos(2θ) = 0, i.e., when 2θ=π
2+nπ
or 2θ=3π
2+nπ, for integer values of n.
Step 4: Plot the Shape
By plotting the points corresponding to different values of θranging from
0 to 2π, we can visualize the geometric shape obtained from the equation r=
5 sin(2θ).
7

Question 10
Question
Consider a circle with radius 3 centered at the point (2,4) in the Cartesian plane.
Find the equation of the circle and sketch it. Then, find the area enclosed by
the circle.
Solution
Step 1: Finding the Equation of the Circle
The general equation of a circle with center at (h, k) and radius ris given by:
(x−h)2+ (y−k)2=r2
In this case, the center of the circle is at (2,4) and the radius is 3. So, the
equation of the circle is:
(x−2)2+ (y−4)2= 32
(x−2)2+ (y−4)2= 9
Step 2: Sketching the Circle
To sketch the circle, we can plot the center at (2,4) and draw a circle with radius
3 around this center.
Step 3: Finding the Area Enclosed by the Circle
The area of a circle is given by the formula:
A=πr2
Plugging in the radius r= 3, we get:
A=π(3)2
A= 9π
Therefore, the area enclosed by the circle is 9πsquare units.
Question 11
Question
Consider the geometric shape formed by the intersection of the following two
cylinders:
Cylinder 1: x2+y2= 4
Cylinder 2: (x−1)2+z2= 1
Find the equation of the intersection curve and sketch the resulting shape.
8
Solution
Step 1: Let’s start by finding the intersection curve of the two cylinders.
Step 2: From Cylinder 1: x2+y2= 4, we can rewrite it as y=±√4−x2.
Step 3: Substitute yin Cylinder 2: (x−1)2+z2= 1, to get (x−1)2+z2=
1−x2.
Step 4: Expand and simplify the equation to get x2−2x+1+z2= 1 −x2.
Step 5: Rearrange the terms to get 2x2−2x+z2= 0.
Step 6: The intersection curve is defined by the surface of this equation:
2x2−2x+z2= 0.
Step 7: Now, let’s sketch the resulting shape. The intersection curve will
look like an ellipse in the xz plane with its major axis along the x-axis due to
the radii of the cylinders being perpendicular.
Thus, the equation of the intersection curve is 2x2−2x+z2= 0 and the
resulting shape is an ellipse in the xz plane.
Question 12
Question
Consider the following geometric shapes:
Circle C with center at (1,2) and radius 3
Ellipse E with major axis along the x-axis, center at (5,3), minor axis
length 4, and major axis length 8
Parabola P with focus at (-2,4) and directrix y=0
For each shape, plot the shape and analyze its key properties, such as the
equation, center/foci/vertices, axis of symmetry, and any additional relevant
information.
Solution
To analyze each geometric shape, we will start by plotting each shape and then
determine their key properties.
Circle C:
Equation: (x−1)2+ (y−2)2= 32
Center: (1,2)
Radius: 3
Ellipse E:
Equation: (x−5)2
82+(y−3)2
42= 1
9

Center: (5,3)
Major axis length: 8, Minor axis length: 4
Parabola P:
Equation: (x+ 2)2= 4p(y−4) (where pis the distance from the vertex
to the focus/directrix)
Focus: (-2,4)
Directrix: y= 0
Now, let’s plot each shape and analyze their key properties.
Question 13
Question
Consider the following geometric figure: A square with side length 6 units and
a circle inscribed inside. Find the area of the shaded region (the region between
the square and the circle).
Solution
Step 1: First, we need to find the area of the square. The area of a square is
given by the formula Asquare =s2, where sis the length of a side. Substitute
s= 6 into the formula:
Asquare = 62= 36 sq units
Step 2: Next, let’s find the radius of the inscribed circle. The radius of a
circle inscribed in a square is half the length of the side of the square. So, the
radius of the circle is r=s
2. Substitute s= 6 into the formula:
r=6
2= 3 units
Step 3: Calculate the area of the circle using the formula Acircle =πr2.
Substitute r= 3 into the formula:
Acircle =π×32= 9πsq units
Step 4: Finally, find the area of the shaded region which is the difference
between the area of the square and the area of the circle.
Ashaded region =Asquare −Acircle = 36 −9π≈6.28 sq units
Therefore, the area of the shaded region is approximately 6.28 square units.
10

Question 14
Question
Consider the following parametric equations in the xy-plane:
x(t) = 3 cos(t), y(t) = 2 sin(t),0≤t≤2π
Sketch the curve traced by the parametric equations. Clearly label any
key points and indicate the direction in which the curve is traced. Determine
whether the curve is open or closed.
Solution
Step 1: To sketch the curve traced by the parametric equations, we first rec-
ognize that x(t) and y(t) are the parametric equations of an ellipse centered at
the origin with major axis along the x-axis and minor axis along the y-axis.
Step 2: We note that when t= 0, the point on the curve is at (3,0), and as
tincreases, the curve moves in counter-clockwise direction.
Step 3: When t=π
2, the point on the curve is at (0,2). When t=π, the
point is at (−3,0). When t=3π
2, the point is at (0,−2). Finally, when t= 2π,
the point is back at the starting point (3,0).
Step 4: Therefore, the curve traced by the parametric equations is a closed
curve, specifically an ellipse with major axis of length 6 units and minor axis of
length 4 units, centered at the origin.
Question 15
Question
Let Abe the set of points (x, y) in the plane such that x2+y2≤4 and x+y≥0.
Find and sketch the geometric shape represented by A.
Solution
Step 1: We start by analyzing the inequalities provided:
The inequality x2+y2≤4 represents a closed disk of radius 2 centered at
the origin (0,0). This is because for any point (x, y) in the disk, x2+y2
will be less than or equal to 4.
The inequality x+y≥0 represents the region above the line y=−xin
the plane, including the line itself. This line has a slope of −1 passing
through the origin.
Step 2: To find the set of points that satisfy both inequalities, we need to
consider their intersection. The region that satisfies both inequalities is the
intersection of the disk and the region above the line y=−x.
11

Step 3: Sketch the disk and the line y=−x, and shade the region that satis-
fies both inequalities. The shaded region will be the geometric shape represented
by A, which is the upper half of the disk:
Therefore, the geometric shape represented by Ais the upper half of the
disk of radius 2 centered at the origin.
Question 16
Question
Consider the function f(x) = x4−4x3. Determine the critical points and classify
each as a local minimum, local maximum, or neither. Sketch the graph of f(x),
clearly showing any critical points.
Solution
Step 1: Find the derivative of the function f(x).
f′(x)=4x3−12x2
Step 2: Set f′(x) = 0 to find the critical points.
4x3−12x2= 0
4x2(x−3) = 0
x= 0 or x= 3
So, the critical points are x= 0 and x= 3.
Step 3: Determine the nature of these critical points by analyzing the sign
of f′(x) in the intervals created by the critical points.
For x < 0, pick x=−1:
f′(−1) = 4(−1)3−12(−1)2=−16
Since f′(−1) <0, f(x) is decreasing to the left of x= 0.
For 0 <x<3, pick x= 1:
f′(1) = 4(1)3−12(1)2=−8
Since f′(1) <0, f(x) is decreasing between x= 0 and x= 3.
For x > 3, pick x= 4:
f′(4) = 4(4)3−12(4)2= 64
Since f′(4) >0, f(x) is increasing to the right of x= 3.
Step 4: Classify the critical points. - At x= 0, f(x) changes from decreasing
to increasing, so it is a local minimum. - At x= 3, f(x) changes from increasing
to decreasing, so it is a local maximum.
Step 5: Sketch the graph of f(x). The graph will have a local minimum at
x= 0 and a local maximum at x= 3.
12

Question 17
Question
Consider the following parametric equations:
x(t) = 2 cos(t), y(t) = sin(t),0≤t≤2π
Plot the curve defined by these parametric equations and analyze its geo-
metric properties.
Solution
To plot the curve defined by the parametric equations x(t) = 2 cos(t) and y(t) =
sin(t), we first need to eliminate the parameter t.
Step 1: Eliminate the parameter tWe can eliminate tby expressing
cos(t) and sin(t) in terms of xand y:
cos(t) = x
2,sin(t) = y
Step 2: Plot the curve Substitute cos(t) and sin(t) with x
2and yin the
parametric equations to get:
x= 2 x
2=x, y =y
This is just the equation of a straight line passing through the origin with a
slope of 1.
Step 3: Analyze the geometric properties The curve defined by the
parametric equations is a straight line passing through the origin with a slope
of 1. It intersects both the x-axis and y-axis at the origin. The line has a length
of √2 units.
Question 18
Question
Consider the geometric shape given by the equation 3x2+3y2−18x+12y+30 = 0.
1. Plot the geometric shape represented by the equation and determine its
type.
2. Calculate the center and radius of the circle (if applicable) and any other
relevant information about the shape.
13

Solution
1. To plot the geometric shape represented by the equation 3x2+ 3y2−18x+
12y+30 = 0, we first need to rewrite the equation in standard form. Completing
the squares for xand ygives us:
3(x2−6x) + 3(y2+ 4y) = −30
3(x2−6x+ 9) + 3(y2+ 4y+ 4) = 3
3(x−3)2+ 3(y+ 2)2= 3
Dividing by 3 gives us (x−3)2+ (y+ 2)2= 1. This is the equation of a circle
centered at (3,−2) with a radius of 1.
2. The center of the circle is (3,−2) and the radius is 1. The circle is centered
at (3,−2) with a radius of 1. Since both the coefficients of x2and y2are the
same and the signs are both positive, we have a circle.
Question 19
Question
Let Abe the set of points in the plane defined by x2+y2≤16 and y≥x. Plot
the set Ain the xy-plane, and analyze the geometric shape formed by the set
A.
Solution
Step 1: To plot the set A, we first need to determine the boundary of the set
by finding the intersection of the equations x2+y2= 16 and y=x.
Step 2: Solving the system of equations, we substitute y=xinto x2+y2=
16:
x2+x2= 16
2x2= 16
x2= 8
x=±2√2
Step 3: Therefore, the points of intersection are (−2√2,−2√2), (2√2,2√2).
Since y≥x, the sector of the circle x2+y2≤16 in the first quadrant enclosed
by the line y=xis the set A.
Step 4: Now we plot the circle x2+y2= 16 and the line y=x, and shade
the region defined by A.
Step 5: The set Ais a sector of a circle with radius 4, centered at the origin,
within the first quadrant and enclosed by the line y=x.
Therefore, the geometric shape formed by the set Ais a sector of a circle
with radius 4, enclosed by the line y=xin the first quadrant.
14
Question 20
Question
Consider the following parametric equations for a curve in 3D space:
x(t) = 2 sin(t), y(t) = 3 cos(t), z(t) = t
Plot the curve in 3D space, and analyze its geometric properties.
Solution
Step 1: To plot the curve in 3D space, we need to consider different values of
the parameter t. Let’s plot the curve for tranging from 0 to 2π.
Step 2: The parametric equations provide the coordinates of points on the
curve as tvaries. We can use a computer software or graphing calculator to plot
the curve.
Step 3: Analyzing the curve, we see that it lies in the xy-plane (z= 0) when
t= 0. As tincreases, the curve spirals upwards around the z-axis.
Step 4: The curve appears to be a helix wrapping around the z-axis as it
spirals upwards. The radius of the helix increases as tincreases, indicating a
larger diameter.
Step 5: The curve does not intersect itself and is continuous, demonstrating
a smooth helical shape.
Step 6: In conclusion, the curve traced by the parametric equations x(t) =
2 sin(t), y(t) = 3 cos(t), z(t) = tis a helix that spirals upwards around the
z-axis, with a continuous and non-self-intersecting shape.
Question 21
Question
Consider the following parametric equations for a curve in the xy-plane:
x= cos(t), y = sin(t),−π≤t≤π.
Plot the curve and analyze its geometric shape.
Solution
Step 1: To plot the curve, we can create a table of values by choosing values of
tin the interval [−π, π].
t x = cos(t)y= sin(t)
−π−1 0
−π
20−1
0 1 0
π
20 1
π−1 0
15
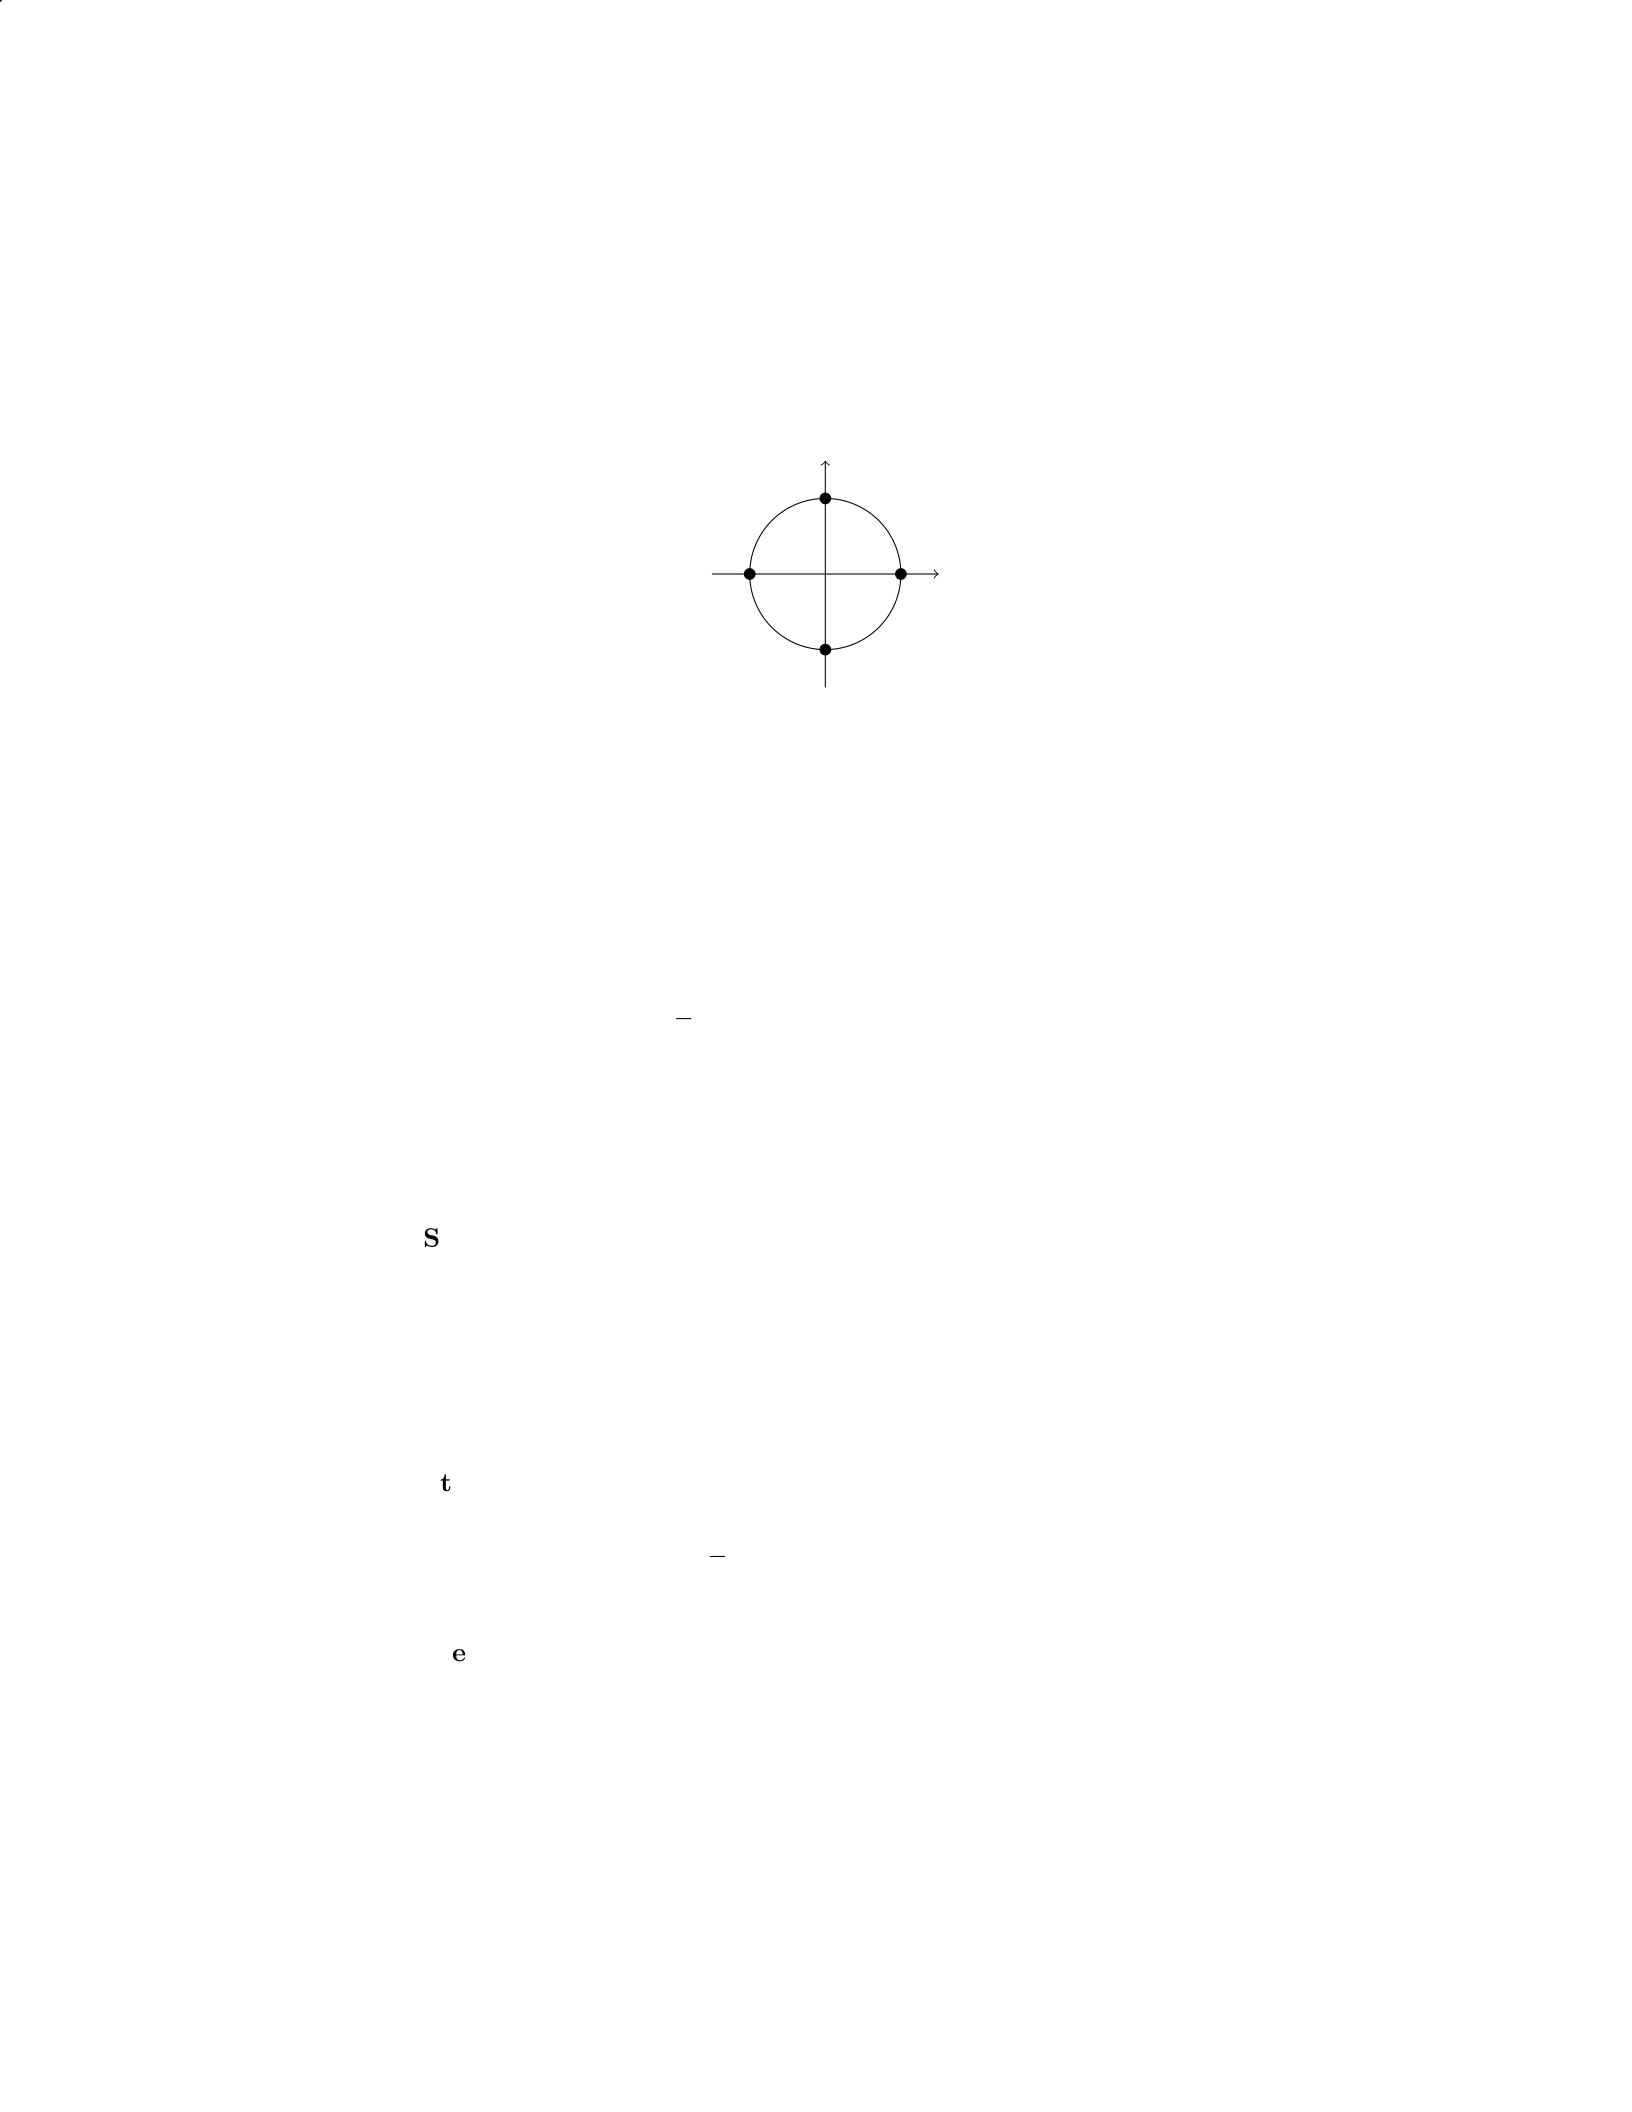
Step 2: Plotting these points on the xy-plane, we can see that the curve
forms a circle with radius 1 centered at the origin.
x
y
(1,0)
(0,1)
(−1,0)
(0,−1)
Step 3: The geometric shape of the curve is a circle with radius 1 centered
at the origin.
Question 22
Question
Plot the geometric shapes defined by the following equations and determine
their properties:
1. x2+y2= 4 2. y=√x3. y=ex
Solution
1. For the equation x2+y2= 4, we recognize that this represents a circle
centered at the origin with radius 2.
Step 1: To plot the circle, we can first find the intercepts by setting x= 0
and y= 0:
–When x= 0, we get y2= 4 =⇒y=±2. So we have intercepts at
(0,2) and (0,−2).
–When y= 0, we get x2= 4 =⇒x=±2. So we have intercepts at
(2,0) and (−2,0).
Step 2: Now, we can plot these points on a coordinate plane and draw a
curve passing through them to represent the circle.
2. For the equation y=√x, this represents half of the parabola y2=xin
the first quadrant.
Step 1: To plot the parabola, we can choose some values of xand compute
the corresponding values of y:
–Let x= 0,1,4 to get y= 0,1,2 respectively.
16
Step 2: Plugging these points into the equation, we plot (0,0), (1,1), and
(4,2).
3. For the equation y=ex, this represents an exponential growth curve
shifting up from the x-axis.
Step 1: To plot the curve, we can choose some values of xto compute
the corresponding values of y:
–Let x=−1,0,1 to get y=1
e,1, e respectively.
Step 2: Plotting (0,1) on the curve, we observe that the curve increases
rapidly as xincreases.
Question 23
Question
Consider the region in the plane bounded by the curve y=x3and the lines
y= 0, x= 1, and x= 2.
a) Find the area of the region bounded by the curve and the lines.
b) Find the volume of the solid generated by revolving this region around
the x-axis.
Solution
a) To find the area of the region bounded by the curve y=x3and the lines
y= 0, x= 1, and x= 2, we need to integrate the difference between the curve
and the x-axis over the given interval.
Step 1: Set up the integral for the area:
Area = Z2
1
(x3−0) dx
Step 2: Integrate the function:
Area = Z2
1
x3dx =x4
42
1
=24
4−14
4=16
4−1
4= 4 −1
4=15
4
Therefore, the area of the region bounded by the curve and the lines is 15
4
square units.
b) To find the volume of the solid generated by revolving this region around
the x-axis, we use the disk method.
Step 1: Set up the integral for the volume:
Volume = πZ2
1
(x3)2dx
17

Step 2: Integrate the function:
Volume = πZ2
1
x6dx =πx7
72
1
=π27
7−17
7=π128
7−1
7=127π
7
Therefore, the volume of the solid generated by revolving this region around
the x-axis is 127π
7cubic units.
Question 24
Question
Consider the following geometric shapes in the xy-plane:
Shape A: A circle with center (−3,4) and radius 5
Shape B: A square with vertices at (0,0), (0,6), (6,6), (6,0)
Shape C: An ellipse with center at the origin, major axis along the x-axis of
length 8, and minor axis along the y-axis of length 4
Find the equations of these shapes in standard form and analyze their prop-
erties.
Solution
Step 1: Equations of the Shapes
For Shape A (circle): The equation of a circle is given by (x−h)2+ (y−
k)2=r2, where (h, k) is the center and ris the radius. Substituting the given
information, we have (x+ 3)2+ (y−4)2= 52. Expanding and simplifying, we
get x2+ 6x+y2−8y−12 = 0.
For Shape B (square): Since the opposite sides of a square are parallel and
of equal length, and the diagonals are perpendicular bisectors of each other, the
equation of the square can be determined. The sides of the square are parallel
to the x-axis and y-axis, so we have 0 ≤x≤6 and 0 ≤y≤6. Therefore, the
equation of the square is 0 ≤x≤6 and 0 ≤y≤6.
For Shape C (ellipse): The equation of an ellipse centered at the origin with
major axis 2aalong the x-axis and minor axis 2balong the y-axis is x2
a2+y2
b2=
1. Substituting a= 4 and b= 2, we have x2
42+y2
22= 1, which simplifies to
x2
16 +y2
4= 1.
Step 2: Analysis of the Shapes
- Shape A is a circle centered at (−3,4) with radius 5. It intersects the
x-axis at (−8,0) and 2,0, and the y-axis at (−3,9) and (−3,−1). - Shape B
is a square with vertices at (0,0), (0,6), (6,6), (6,0), and sides parallel to the
coordinate axes. - Shape C is an ellipse centered at the origin, with major axis
of length 8 along the x-axis and minor axis of length 4 along the y-axis.
These geometric shapes exhibit different properties due to their equations
and dimensions.
18

Question 25
Question
Consider the following equation in polar coordinates: r= 2 sin(3θ).
1. Plot the curve represented by the equation.
2. Analyze the curve and determine if it is symmetric with respect to any
line or point.
3. Identify any points of intersection with the coordinate axes.
Solution
1. To plot the curve represented by the equation r= 2 sin(3θ), we can first
analyze the graph of r= sin(θ), which is a cardioid. The given equation,
r= 2 sin(3θ), indicates that the amplitude of the sine function has been doubled
and its period has been divided by 3. This results in 3 petals for the curve.
2. The curve is symmetric with respect to the line θ=πas ris not affected
by the replacement of θwith π−θ.
3. To find the points of intersection with the coordinate axes, we need to
set r= 0. Solving 0 = 2 sin(3θ) gives us θ= 0,π
3,2π
3, π, 4π
3,5π
3. Thus, the curve
intersects the coordinate axes at the polar angles θ= 0,π
3,2π
3,4π
3,5π
3.
Therefore, the curve represented by the equation r= 2 sin(3θ) is a symmetric
curve with 3 petals and intersects the coordinate axes at θ= 0,π
3,2π
3,4π
3,5π
3.
Question 26
Question
Consider the following geometric shapes:
Shape A: A circle centered at the origin with radius 2.
Shape B: A parabola given by the equation y=x2.
Shape C: A straight line passing through the points (−3,−2) and (1,4).
For each shape, plot it on the coordinate plane and then analyze its proper-
ties such as symmetry, intercepts, concavity, and any other relevant character-
istics.
Solution
To tackle this problem, we will analyze each geometric shape separately.
Shape A: Circle centered at the origin with radius 2
1. Step 1: Plot the circle with its center at the origin and radius of 2.
2. Step 2: The equation of a circle centered at the origin with radius ris
x2+y2=r2. Substituting r= 2 into the equation gives x2+y2= 4.
19

3. Step 3: The circle intersects the x-axis at (2,0) and (−2,0), and the
y-axis at (0,2) and (0,−2).
4. Step 4: The circle has symmetry with respect to both the x-axis and
y-axis.
Shape B: Parabola y=x2
1. Step 1: Plot the parabola y=x2.
2. Step 2: The parabola opens upwards and its vertex is at the origin.
3. Step 3: The parabola intersects the y-axis at (0,0).
4. Step 4: The parabola does not intersect the x-axis.
Shape C: Straight line passing through (−3,−2) and (1,4)
1. Step 1: Find the equation of the straight line passing through (−3,−2)
and (1,4).
2. Step 2: The equation of a straight line passing through two points (x1, y1)
and (x2, y2) is given by
y−y1=y2−y1
x2−x1
(x−x1).
Substituting (−3,−2) and (1,4) into the equation gives the line y=x+ 1.
3. Step 3: Plot the straight line y=x+ 1 passing through (−3,−2) and
(1,4).
4. Step 4: The line intersects the y-axis at (0,1) and does not intersect the
x-axis.
By analyzing the properties of each shape as described above, we have gained
insights into their symmetry, intercepts, concavity, and other key characteristics.
Question 27
Question
Consider the following parametric equations:
x(t) = 2 cos(t), y(t) = 3 sin(t), z(t) = 4 cos(t)
for 0 ≤t≤2π.
Plot the curve represented by these parametric equations in 3D space. Then,
analyze the curve in terms of symmetry, intersections with coordinate axes, and
direction of motion.
20

Solution
To plot the curve represented by the parametric equations in 3D space, we need
to visualize the (x, y, z) coordinates as tvaries from 0 to 2π. Let’s analyze the
curve step by step.
Step 1: Plot the Curve We first plot the curve represented by the para-
metric equations:
x(t) = 2 cos(t), y(t) = 3 sin(t), z(t) = 4 cos(t)
for 0 ≤t≤2π.
Step 2: Analyze Symmetry Let’s analyze the symmetry of the curve: -
The curve will be symmetric with respect to the x-zplane because changing t
to −treflects the curve about the x-zplane. - The curve will not be symmetric
with respect to the y-zplane.
Step 3: Intersections with Coordinate Axes To find the intersections
with the coordinate axes, we substitute x= 0, y= 0, and z= 0 into the
parametric equations and solve for t: - The curve intersects the x-axis when
t=π/2,3π/2. - The curve intersects the y-axis when t= 0, π. - The curve does
not intersect the z-axis.
Step 4: Direction of Motion The direction of motion of the curve can
be determined by examining the signs of dx
dt ,dy
dt , and dz
dt . - dx
dt =−2 sin(t),
dy
dt = 3 cos(t), dz
dt =−4 sin(t). - Since dx
dt and dz
dt are both negative when
0≤t≤2π, the curve moves in the clockwise direction when viewed from the
positive y-axis.
This completes our analysis of the curve represented by the given parametric
equations in 3D space.
Question 28
Question
Let Abe a square with side length 4 centered at the origin. Let Bbe a circle
with radius 3 centered at the point (5,0). Find the area of the region enclosed
by Aand B.
Solution
Step 1: First, let’s find the intersection points of the square Aand the circle B.
The equation of circle Bis (x−5)2+y2= 32. Since the center of the square
Ais at the origin, we only need to consider the first quadrant. The boundary
of the square is given by y=x,y=−x,x= 2, and x=−2.
Solving the system (x−5)2+x2= 32along with y=x,y=−x,x= 2, and
x=−2, we find the intersection points to be (1,1) and (−1,−1).
Step 2: We can now find the area enclosed by these two shapes. The area
enclosed by Ais simply the area of the square, which is 42= 16 square units.
21

The area enclosed by Bis the area of the circle subtracted by the area of the
quarter-circle cut off by the square.
The total area enclosed by Aand Bis the area of the square minus the area
of the quarter-circle:
16 −1
4π32= 16 −9
4π= 16 −9π
4square units.
Therefore, the area of the region enclosed by Aand Bis 16 −9π
4square
units.
Question 29
Question
Consider the following geometric shape described by the inequalities:
x≥0, y ≥0,3x+ 4y≤12, x + 2y≤5.
Plot the region defined by these inequalities and find its area.
Solution
Step 1: Plot the lines defined by the equalities 3x+ 4y= 12 and x+ 2y= 5.
Step 2: Find the intersection points of the lines with the axes. Step 3: Shade
the region defined by the inequalities and calculate its area.
Step 1:
To plot the lines 3x+4y= 12 and x+2y= 5, we rewrite them in slope-intercept
form:
For 3x+ 4y= 12,
4y=−3x+ 12
y=−3
4x+ 3.
For x+ 2y= 5,
2y=−x+ 5
y=−1
2x+5
2.
Step 2:
To find the intersection points with the axes, we set x= 0 and y= 0 in the
equations:
For y=−3
4x+ 3,
x= 0, y = 3,giving point (0,3),
y= 0, x = 4,giving point (4,0).
22

For y=−1
2x+5
2,
x= 0, y =5
2,giving point (0,5
2),
y= 0, x = 5,giving point (5,0).
Step 3:
Shade the region defined by the system of inequalities as shown in the plot
below.
geometric_shape.png
The shaded region represents the feasible region defined by the inequalities.
The area of this region can be calculated by finding the area of the triangle
formed by the intersection points: (0, 3), (4, 0), and (5, 0).
Using the formula for the area of a triangle 1
2bh, where bis the base and h
is the height, we have:
Area = 1
2(4)(3) = 6.
Thus, the area of the region defined by the inequalities is 6 units2.
Question 30
Question
Consider the following parametric equations:
x= 2 cos(t)
y= 3 sin(t)
Plot the geometric shape formed by these parametric equations and analyze
its properties.
Solution
Step 1: To plot the geometric shape formed by the parametric equations x=
2 cos(t) and y= 3 sin(t), let’s first eliminate the parameter tto find the Cartesian
equation of the curve. We can use the trigonometric identity: cos2(t)+sin2(t) =
1
Step 2: Using the given parametric equations, we can rewrite them in terms
of cos(t) and sin(t):
x2= 22cos2(t)
y2= 32sin2(t)
23

Question 2
Question
Consider the following parametric equations for a curve in the xy-plane:
x(t) = t3−3t, y(t) = t2−2
Determine and plot the geometric shape traced out by the curve as tvaries over
all real numbers.
Solution
Step 1: To determine the geometric shape traced out by the curve, we first
eliminate the parameter tby expressing tin terms of xand yusing the equations
x(t) = t3−3tand y(t) = t2−2.
Step 2: From the equation x(t) = t3−3t, we can express tin terms of xas
follows:
t=3
qx+px2+ 3
Step 3: Substituting this expression for tinto the equation y(t) = t2−2, we
get:
y=3
qx+px2+ 32
−2
Step 4: Simplifying this equation, we find:
y=x2/3+ 31/6x−1/3−2
Step 5: Therefore, the geometric shape traced out by the curve is given by
the equation y=x2/3+ 31/6x−1/3−2. This is an example of a curve known as
asemicubical parabola.
Step 6: By plotting the equation y=x2/3+ 31/6x−1/3−2, we can visualize
the geometric shape traced out by the curve.
Step 7: The plot of the semicubical parabola indicates a curve that behaves
like a parabola near the origin but shows distinct characteristics compared to a
regular parabola. The curve is symmetric about the y-axis and approaches the
x-axis but never intersects it.
Therefore, the geometric shape traced out by the curve is a semicubical
parabola.
Question 3
Question
Consider the curve defined by the parametric equations:
x(t) = 2 cos(t), y(t) = 3 sin(t),0≤t≤2π
Sketch the curve and analyze its geometric shape.
2

Solution
Step 1: To sketch the curve, we first need to parametrically plot points by
substituting various values of tfrom the given interval [0,2π] into the parametric
equations x(t) and y(t).
Step 2: Let’s start by calculating points for t= 0 and t=π/2.
For t= 0:
x(0) = 2 cos(0) = 2
y(0) = 3 sin(0) = 0
So the point for t= 0 is (2,0).
For t=π
2:
xπ
2= 2 cos π
2= 0
yπ
2= 3 sin π
2= 3
So the point for t=π
2is (0,3).
Step 3: Continue calculating points for t=πand t=3π
2until t= 2π.
Step 4: Plotting all the calculated points and connecting them will give us
the sketch of the curve.
Step 5: By analyzing the curve, we notice that it forms an ellipse centered
at the origin with semi-major axis of length 3 along the y-axis and semi-minor
axis of length 2 along the x-axis. Thus, the geometric shape of the curve is an
ellipse.
Question 4
Question
Consider the following parametric equations:
x(t) = 2 cos(t)
y(t) = 3 sin(t)
Sketch and analyze the geometric shape represented by these parametric
equations.
Solution
Step 1: To sketch the geometric shape represented by the parametric equations,
we first note that x(t) = 2 cos(t) and y(t) = 3 sin(t) represent the xand y
coordinates of a point on the plane as tvaries.
Step 2: We can eliminate the parameter tfrom the equations by squaring
and adding them together:
x2(t) = 4 cos2(t)
y2(t) = 9 sin2(t)
3

Step 3: Adding the equations gives us:
x2(t) + y2(t) = 4 cos2(t) + 9 sin2(t)
Step 4: Using the trigonometric identity cos2(t) + sin2(t) = 1, we have:
x2(t) + y2(t) = 4(1 −sin2(t)) + 9 sin2(t)
x2(t) + y2(t) = 4 + 9 sin2(t)−4 sin2(t)
x2(t) + y2(t) = 4 + 5 sin2(t)
Step 5: Since sin2(t)≤1 for all t, we have x2+y2≤9. This is the equation
of an ellipse centered at the origin with semi-major axis of length 3 along the
y-axis and semi-minor axis of length 2 along the x-axis.
Step 6: Therefore, the geometric shape represented by the parametric equa-
tions is an ellipse centered at the origin.
Question 5
Question
Consider the geometric shape defined by the equation x2+y2+z2= 1.
1. Plot the 3D shape defined by the equation.
2. Determine whether the shape is a sphere or a cylinder, and justify your
answer.
3. Find the radius and center of the sphere (if it is a sphere).
Solution
1. To plot the 3D shape defined by the equation x2+y2+z2= 1, we can rewrite
the equation in spherical coordinates as r= 1 with 0 ≤θ≤2πand 0 ≤ϕ≤π.
This represents a unit sphere centered at the origin.
2. The shape defined by x2+y2+z2= 1 is a sphere. This is because the
equation represents the set of all points in 3D space that are a distance of 1
from the origin.
3. To find the radius and center of the sphere, we can rewrite the equation
of the sphere in the general form: (x−a)2+ (y−b)2+ (z−c)2=r2, where
(a, b, c) is the center of the sphere and ris the radius. Comparing with the given
equation x2+y2+z2= 1, we have a=b=c= 0 and r=√1 = 1.
Therefore, the sphere is centered at the origin (0,0,0) and has a radius of 1
unit.
4

Question 6
Question
Consider the circle with equation x2+y2−6x+ 4y−12 = 0.
1. Plot the circle on a Cartesian plane.
2. Find the center and radius of the circle.
3. Determine whether the point P(3,−2) lies inside, on, or outside the circle.
Solution
1. To plot the circle with equation x2+y2−6x+ 4y−12 = 0, we first rewrite
the equation in standard form by completing the square for both xand yterms:
(x2−6x)+(y2+ 4y) = 12
(x2−6x+ 9) + (y2+ 4y+ 4) = 12 + 9 + 4
(x−3)2+ (y+ 2)2= 25
This equation represents a circle with center (3,−2) and radius √25 = 5.
Now, we can plot the circle on a Cartesian plane.
2. The center of the circle is at (3,−2) and the radius is 5 units.
3. To determine the location of point P(3,−2), we substitute x= 3 and
y=−2 into the equation of the circle:
((3) −3)2+ ((−2) + 2)2= 0
Since the point P(3,−2) satisfies the equation of the circle, it lies on the
circle.
Question 7
Question
Consider the following geometric shapes: - Circle C1with center (−3,4) and
radius 5 - Ellipse E1with major axis along the line y= 2 and minor axis of
length 8 - Parabola P1with vertex at the origin opening to the right and focus
at (2,0) - Hyperbola H1with center at (1,−3), transverse axis along the line
x= 1, and conjugate axis of length 6
Plot the four geometric shapes on the same set of axes and analyze their key
features.
5

Solution
Step 1: Circle C1with center (−3,4) and radius 5 The equation of this circle is
(x+ 3)2+ (y−4)2= 25. The center is (−3,4) and the radius is 5. This means
the circle is centered at (−3,4) and has a radius of 5 units.
Step 2: Ellipse E1with major axis along the line y= 2 and minor axis of
length 8 The standard equation of an ellipse centered at (h, k) with major axis
along the x-axis and minor axis along the y-axis is (x−h)2
a2+(y−k)2
b2= 1. Since
the major axis is along y= 2, we have h= 0 and k= 2. Also, a= 4 and b= 2.
Thus, the equation of this ellipse is x2
16 +(y−2)2
4= 1.
Step 3: Parabola P1with vertex at the origin opening to the right and focus
at (2,0) The standard equation of a parabola with vertex at (h, k) opening to
the right is (x−h)2= 4p(y−k). Since the focus is at (2,0), we have h= 0 and
k= 0. Also, p= 2. Thus, the equation of this parabola is x2= 8y.
Step 4: Hyperbola H1with center at (1,−3), transverse axis along the line
x= 1, and conjugate axis of length 6 The standard equation of a hyperbola
centered at (h, k) with transverse axis along the x-axis is (x−h)2
a2−(y−k)2
b2= 1.
Since the center is at (1,−3) and the transverse axis is along x= 1, we have
h= 1 and k=−3. Also, a= 3 and b= 2. Thus, the equation of this hyperbola
is (x−1)2
9−(y+3)2
4= 1.
Now, plot the circle, ellipse, parabola, and hyperbola on the same set of axes.
Analyze each shape’s key features, such as center, vertices, foci, asymptotes (if
any), etc.
Question 8
Question
Consider the following parametric equations:
(x= 2 cos(t)
y= 3 sin(t)
Find the Cartesian equation of the curve defined by these parametric equations
and sketch the curve.
Solution
Step 1: To find the Cartesian equation of the curve defined by the parametric
equations, we eliminate the parameter tby eliminating cos(t) and sin(t).
Step 2: Square both equations:
x2= (2 cos(t))2= 4 cos2(t)
y2= (3 sin(t))2= 9 sin2(t)
6

Step 3: Use the Pythagorean identity cos2(t) + sin2(t) = 1 to eliminate
cos2(t) and sin2(t):
x2+y2= 4 cos2(t)+9 sin2(t) = 4(1−sin2(t))+9 sin2(t) = 4+9 sin2(t)−4 sin2(t) = 4+5 sin2(t)
Step 4: Therefore, the Cartesian equation of the curve is x2+y2= 4 +
5 sin2(t).
Step 5: The equation x2+y2= 4 + 5 sin2(t) represents an ellipse with a
major axis along the y-axis and a minor axis along the x-axis. To sketch the
curve, note that the major axis has length 3 and the minor axis has length 2.
Step 6: Sketch the ellipse with center at the origin, major axis along the
y-axis (vertical ellipse), major axis length 3, and minor axis length 2.
Step 7: Thus, the curve defined by the parametric equations is the ellipse
x2+y2= 4 + 5 sin2(t).
Question 9
Question
Consider the geometric shape defined by the following equation in polar coor-
dinates: r= 5 sin(2θ). Plot the shape and analyze its key properties such as
symmetry, concavity, and intersections with the axis.
Solution
To plot and analyze the given geometric shape, we will follow these steps:
Step 1: Calculate θ-intercepts
Setting r= 0, we find the θ-intercepts by solving 5 sin(2θ) = 0. This gives
us sin(2θ) = 0 =⇒2θ=nπ, where nis an integer.
Therefore, the θ-intercepts occur at θ=nπ
2for integer values of n.
Step 2: Determine Symmetry
The equation r= 5 sin(2θ) is symmetric about the origin. This can be seen
by noting that sin(2θ) is an odd function, resulting in symmetric points across
the origin.
Step 3: Analyze Concavity
To analyze the concavity of the shape, we consider the second derivative of
rwith respect to θ:
d2r
dθ2= 20 cos(2θ)
The concavity changes at points where cos(2θ) = 0, i.e., when 2θ=π
2+nπ
or 2θ=3π
2+nπ, for integer values of n.
Step 4: Plot the Shape
By plotting the points corresponding to different values of θranging from
0 to 2π, we can visualize the geometric shape obtained from the equation r=
5 sin(2θ).
7

Question 10
Question
Consider a circle with radius 3 centered at the point (2,4) in the Cartesian plane.
Find the equation of the circle and sketch it. Then, find the area enclosed by
the circle.
Solution
Step 1: Finding the Equation of the Circle
The general equation of a circle with center at (h, k) and radius ris given by:
(x−h)2+ (y−k)2=r2
In this case, the center of the circle is at (2,4) and the radius is 3. So, the
equation of the circle is:
(x−2)2+ (y−4)2= 32
(x−2)2+ (y−4)2= 9
Step 2: Sketching the Circle
To sketch the circle, we can plot the center at (2,4) and draw a circle with radius
3 around this center.
Step 3: Finding the Area Enclosed by the Circle
The area of a circle is given by the formula:
A=πr2
Plugging in the radius r= 3, we get:
A=π(3)2
A= 9π
Therefore, the area enclosed by the circle is 9πsquare units.
Question 11
Question
Consider the geometric shape formed by the intersection of the following two
cylinders:
Cylinder 1: x2+y2= 4
Cylinder 2: (x−1)2+z2= 1
Find the equation of the intersection curve and sketch the resulting shape.
8
Solution
Step 1: Let’s start by finding the intersection curve of the two cylinders.
Step 2: From Cylinder 1: x2+y2= 4, we can rewrite it as y=±√4−x2.
Step 3: Substitute yin Cylinder 2: (x−1)2+z2= 1, to get (x−1)2+z2=
1−x2.
Step 4: Expand and simplify the equation to get x2−2x+1+z2= 1 −x2.
Step 5: Rearrange the terms to get 2x2−2x+z2= 0.
Step 6: The intersection curve is defined by the surface of this equation:
2x2−2x+z2= 0.
Step 7: Now, let’s sketch the resulting shape. The intersection curve will
look like an ellipse in the xz plane with its major axis along the x-axis due to
the radii of the cylinders being perpendicular.
Thus, the equation of the intersection curve is 2x2−2x+z2= 0 and the
resulting shape is an ellipse in the xz plane.
Question 12
Question
Consider the following geometric shapes:
Circle C with center at (1,2) and radius 3
Ellipse E with major axis along the x-axis, center at (5,3), minor axis
length 4, and major axis length 8
Parabola P with focus at (-2,4) and directrix y=0
For each shape, plot the shape and analyze its key properties, such as the
equation, center/foci/vertices, axis of symmetry, and any additional relevant
information.
Solution
To analyze each geometric shape, we will start by plotting each shape and then
determine their key properties.
Circle C:
Equation: (x−1)2+ (y−2)2= 32
Center: (1,2)
Radius: 3
Ellipse E:
Equation: (x−5)2
82+(y−3)2
42= 1
9

Center: (5,3)
Major axis length: 8, Minor axis length: 4
Parabola P:
Equation: (x+ 2)2= 4p(y−4) (where pis the distance from the vertex
to the focus/directrix)
Focus: (-2,4)
Directrix: y= 0
Now, let’s plot each shape and analyze their key properties.
Question 13
Question
Consider the following geometric figure: A square with side length 6 units and
a circle inscribed inside. Find the area of the shaded region (the region between
the square and the circle).
Solution
Step 1: First, we need to find the area of the square. The area of a square is
given by the formula Asquare =s2, where sis the length of a side. Substitute
s= 6 into the formula:
Asquare = 62= 36 sq units
Step 2: Next, let’s find the radius of the inscribed circle. The radius of a
circle inscribed in a square is half the length of the side of the square. So, the
radius of the circle is r=s
2. Substitute s= 6 into the formula:
r=6
2= 3 units
Step 3: Calculate the area of the circle using the formula Acircle =πr2.
Substitute r= 3 into the formula:
Acircle =π×32= 9πsq units
Step 4: Finally, find the area of the shaded region which is the difference
between the area of the square and the area of the circle.
Ashaded region =Asquare −Acircle = 36 −9π≈6.28 sq units
Therefore, the area of the shaded region is approximately 6.28 square units.
10

Question 14
Question
Consider the following parametric equations in the xy-plane:
x(t) = 3 cos(t), y(t) = 2 sin(t),0≤t≤2π
Sketch the curve traced by the parametric equations. Clearly label any
key points and indicate the direction in which the curve is traced. Determine
whether the curve is open or closed.
Solution
Step 1: To sketch the curve traced by the parametric equations, we first rec-
ognize that x(t) and y(t) are the parametric equations of an ellipse centered at
the origin with major axis along the x-axis and minor axis along the y-axis.
Step 2: We note that when t= 0, the point on the curve is at (3,0), and as
tincreases, the curve moves in counter-clockwise direction.
Step 3: When t=π
2, the point on the curve is at (0,2). When t=π, the
point is at (−3,0). When t=3π
2, the point is at (0,−2). Finally, when t= 2π,
the point is back at the starting point (3,0).
Step 4: Therefore, the curve traced by the parametric equations is a closed
curve, specifically an ellipse with major axis of length 6 units and minor axis of
length 4 units, centered at the origin.
Question 15
Question
Let Abe the set of points (x, y) in the plane such that x2+y2≤4 and x+y≥0.
Find and sketch the geometric shape represented by A.
Solution
Step 1: We start by analyzing the inequalities provided:
The inequality x2+y2≤4 represents a closed disk of radius 2 centered at
the origin (0,0). This is because for any point (x, y) in the disk, x2+y2
will be less than or equal to 4.
The inequality x+y≥0 represents the region above the line y=−xin
the plane, including the line itself. This line has a slope of −1 passing
through the origin.
Step 2: To find the set of points that satisfy both inequalities, we need to
consider their intersection. The region that satisfies both inequalities is the
intersection of the disk and the region above the line y=−x.
11

Step 3: Sketch the disk and the line y=−x, and shade the region that satis-
fies both inequalities. The shaded region will be the geometric shape represented
by A, which is the upper half of the disk:
Therefore, the geometric shape represented by Ais the upper half of the
disk of radius 2 centered at the origin.
Question 16
Question
Consider the function f(x) = x4−4x3. Determine the critical points and classify
each as a local minimum, local maximum, or neither. Sketch the graph of f(x),
clearly showing any critical points.
Solution
Step 1: Find the derivative of the function f(x).
f′(x)=4x3−12x2
Step 2: Set f′(x) = 0 to find the critical points.
4x3−12x2= 0
4x2(x−3) = 0
x= 0 or x= 3
So, the critical points are x= 0 and x= 3.
Step 3: Determine the nature of these critical points by analyzing the sign
of f′(x) in the intervals created by the critical points.
For x < 0, pick x=−1:
f′(−1) = 4(−1)3−12(−1)2=−16
Since f′(−1) <0, f(x) is decreasing to the left of x= 0.
For 0 <x<3, pick x= 1:
f′(1) = 4(1)3−12(1)2=−8
Since f′(1) <0, f(x) is decreasing between x= 0 and x= 3.
For x > 3, pick x= 4:
f′(4) = 4(4)3−12(4)2= 64
Since f′(4) >0, f(x) is increasing to the right of x= 3.
Step 4: Classify the critical points. - At x= 0, f(x) changes from decreasing
to increasing, so it is a local minimum. - At x= 3, f(x) changes from increasing
to decreasing, so it is a local maximum.
Step 5: Sketch the graph of f(x). The graph will have a local minimum at
x= 0 and a local maximum at x= 3.
12

Question 17
Question
Consider the following parametric equations:
x(t) = 2 cos(t), y(t) = sin(t),0≤t≤2π
Plot the curve defined by these parametric equations and analyze its geo-
metric properties.
Solution
To plot the curve defined by the parametric equations x(t) = 2 cos(t) and y(t) =
sin(t), we first need to eliminate the parameter t.
Step 1: Eliminate the parameter tWe can eliminate tby expressing
cos(t) and sin(t) in terms of xand y:
cos(t) = x
2,sin(t) = y
Step 2: Plot the curve Substitute cos(t) and sin(t) with x
2and yin the
parametric equations to get:
x= 2 x
2=x, y =y
This is just the equation of a straight line passing through the origin with a
slope of 1.
Step 3: Analyze the geometric properties The curve defined by the
parametric equations is a straight line passing through the origin with a slope
of 1. It intersects both the x-axis and y-axis at the origin. The line has a length
of √2 units.
Question 18
Question
Consider the geometric shape given by the equation 3x2+3y2−18x+12y+30 = 0.
1. Plot the geometric shape represented by the equation and determine its
type.
2. Calculate the center and radius of the circle (if applicable) and any other
relevant information about the shape.
13

Solution
1. To plot the geometric shape represented by the equation 3x2+ 3y2−18x+
12y+30 = 0, we first need to rewrite the equation in standard form. Completing
the squares for xand ygives us:
3(x2−6x) + 3(y2+ 4y) = −30
3(x2−6x+ 9) + 3(y2+ 4y+ 4) = 3
3(x−3)2+ 3(y+ 2)2= 3
Dividing by 3 gives us (x−3)2+ (y+ 2)2= 1. This is the equation of a circle
centered at (3,−2) with a radius of 1.
2. The center of the circle is (3,−2) and the radius is 1. The circle is centered
at (3,−2) with a radius of 1. Since both the coefficients of x2and y2are the
same and the signs are both positive, we have a circle.
Question 19
Question
Let Abe the set of points in the plane defined by x2+y2≤16 and y≥x. Plot
the set Ain the xy-plane, and analyze the geometric shape formed by the set
A.
Solution
Step 1: To plot the set A, we first need to determine the boundary of the set
by finding the intersection of the equations x2+y2= 16 and y=x.
Step 2: Solving the system of equations, we substitute y=xinto x2+y2=
16:
x2+x2= 16
2x2= 16
x2= 8
x=±2√2
Step 3: Therefore, the points of intersection are (−2√2,−2√2), (2√2,2√2).
Since y≥x, the sector of the circle x2+y2≤16 in the first quadrant enclosed
by the line y=xis the set A.
Step 4: Now we plot the circle x2+y2= 16 and the line y=x, and shade
the region defined by A.
Step 5: The set Ais a sector of a circle with radius 4, centered at the origin,
within the first quadrant and enclosed by the line y=x.
Therefore, the geometric shape formed by the set Ais a sector of a circle
with radius 4, enclosed by the line y=xin the first quadrant.
14
Question 20
Question
Consider the following parametric equations for a curve in 3D space:
x(t) = 2 sin(t), y(t) = 3 cos(t), z(t) = t
Plot the curve in 3D space, and analyze its geometric properties.
Solution
Step 1: To plot the curve in 3D space, we need to consider different values of
the parameter t. Let’s plot the curve for tranging from 0 to 2π.
Step 2: The parametric equations provide the coordinates of points on the
curve as tvaries. We can use a computer software or graphing calculator to plot
the curve.
Step 3: Analyzing the curve, we see that it lies in the xy-plane (z= 0) when
t= 0. As tincreases, the curve spirals upwards around the z-axis.
Step 4: The curve appears to be a helix wrapping around the z-axis as it
spirals upwards. The radius of the helix increases as tincreases, indicating a
larger diameter.
Step 5: The curve does not intersect itself and is continuous, demonstrating
a smooth helical shape.
Step 6: In conclusion, the curve traced by the parametric equations x(t) =
2 sin(t), y(t) = 3 cos(t), z(t) = tis a helix that spirals upwards around the
z-axis, with a continuous and non-self-intersecting shape.
Question 21
Question
Consider the following parametric equations for a curve in the xy-plane:
x= cos(t), y = sin(t),−π≤t≤π.
Plot the curve and analyze its geometric shape.
Solution
Step 1: To plot the curve, we can create a table of values by choosing values of
tin the interval [−π, π].
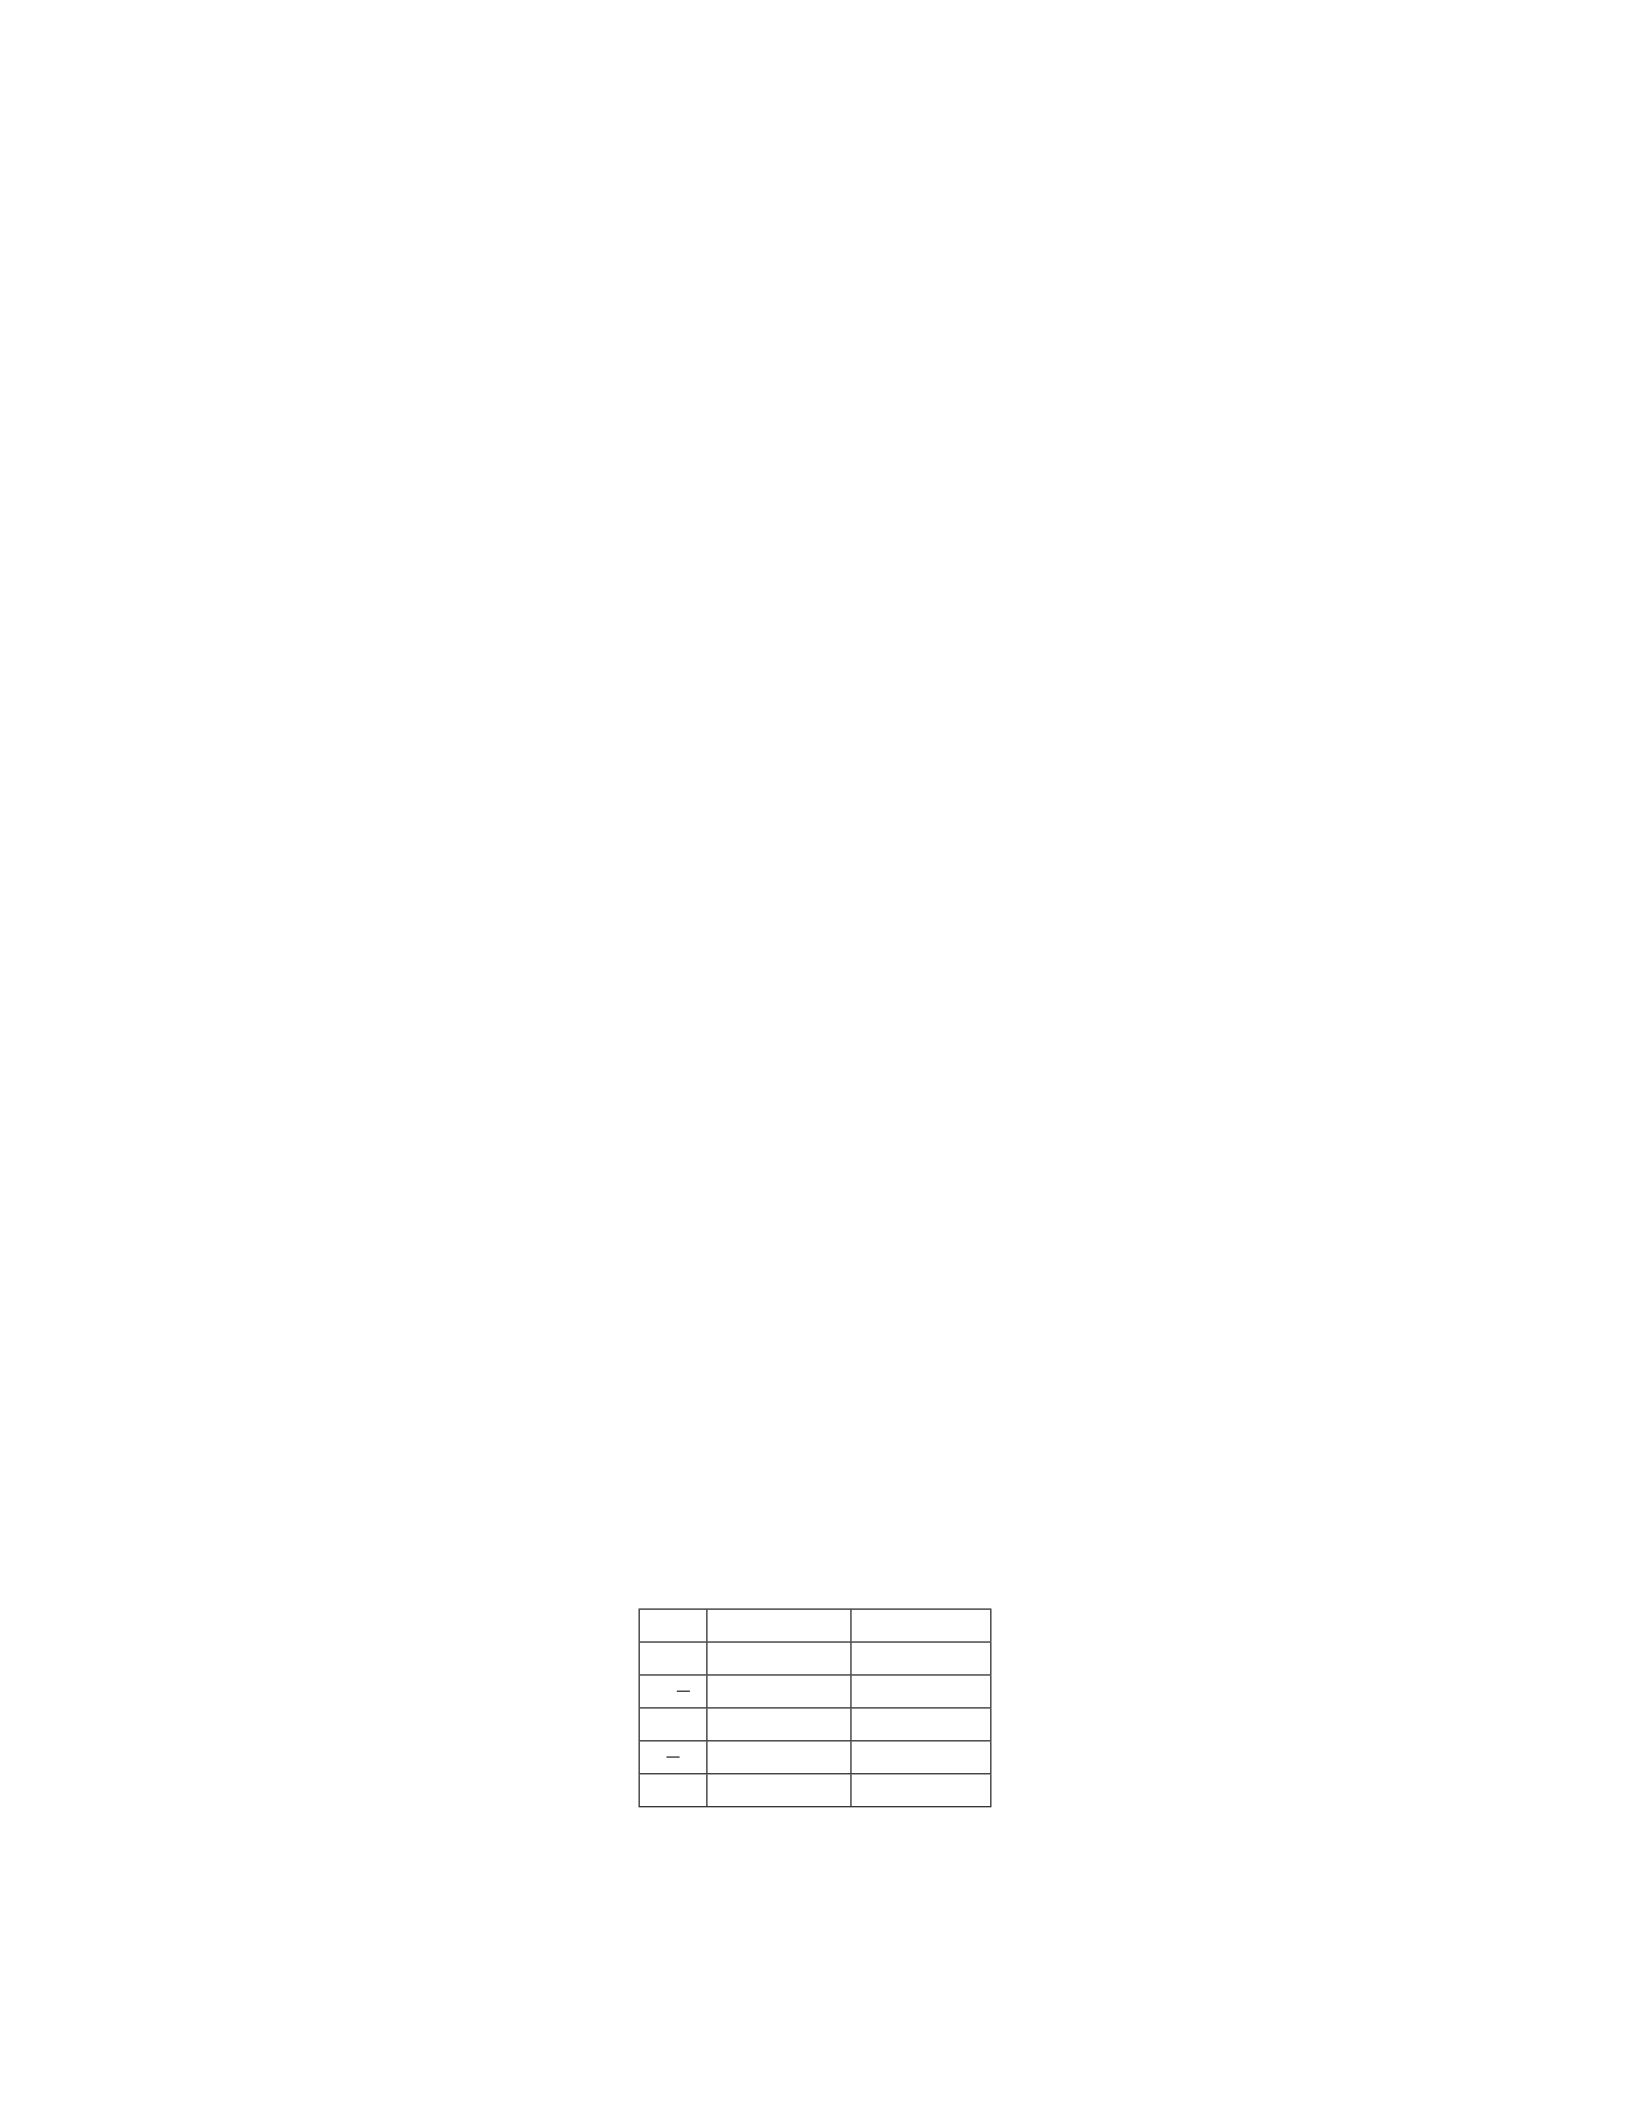
t x = cos(t)y= sin(t)
−π−1 0
−π
20−1
0 1 0
π
20 1
π−1 0
15
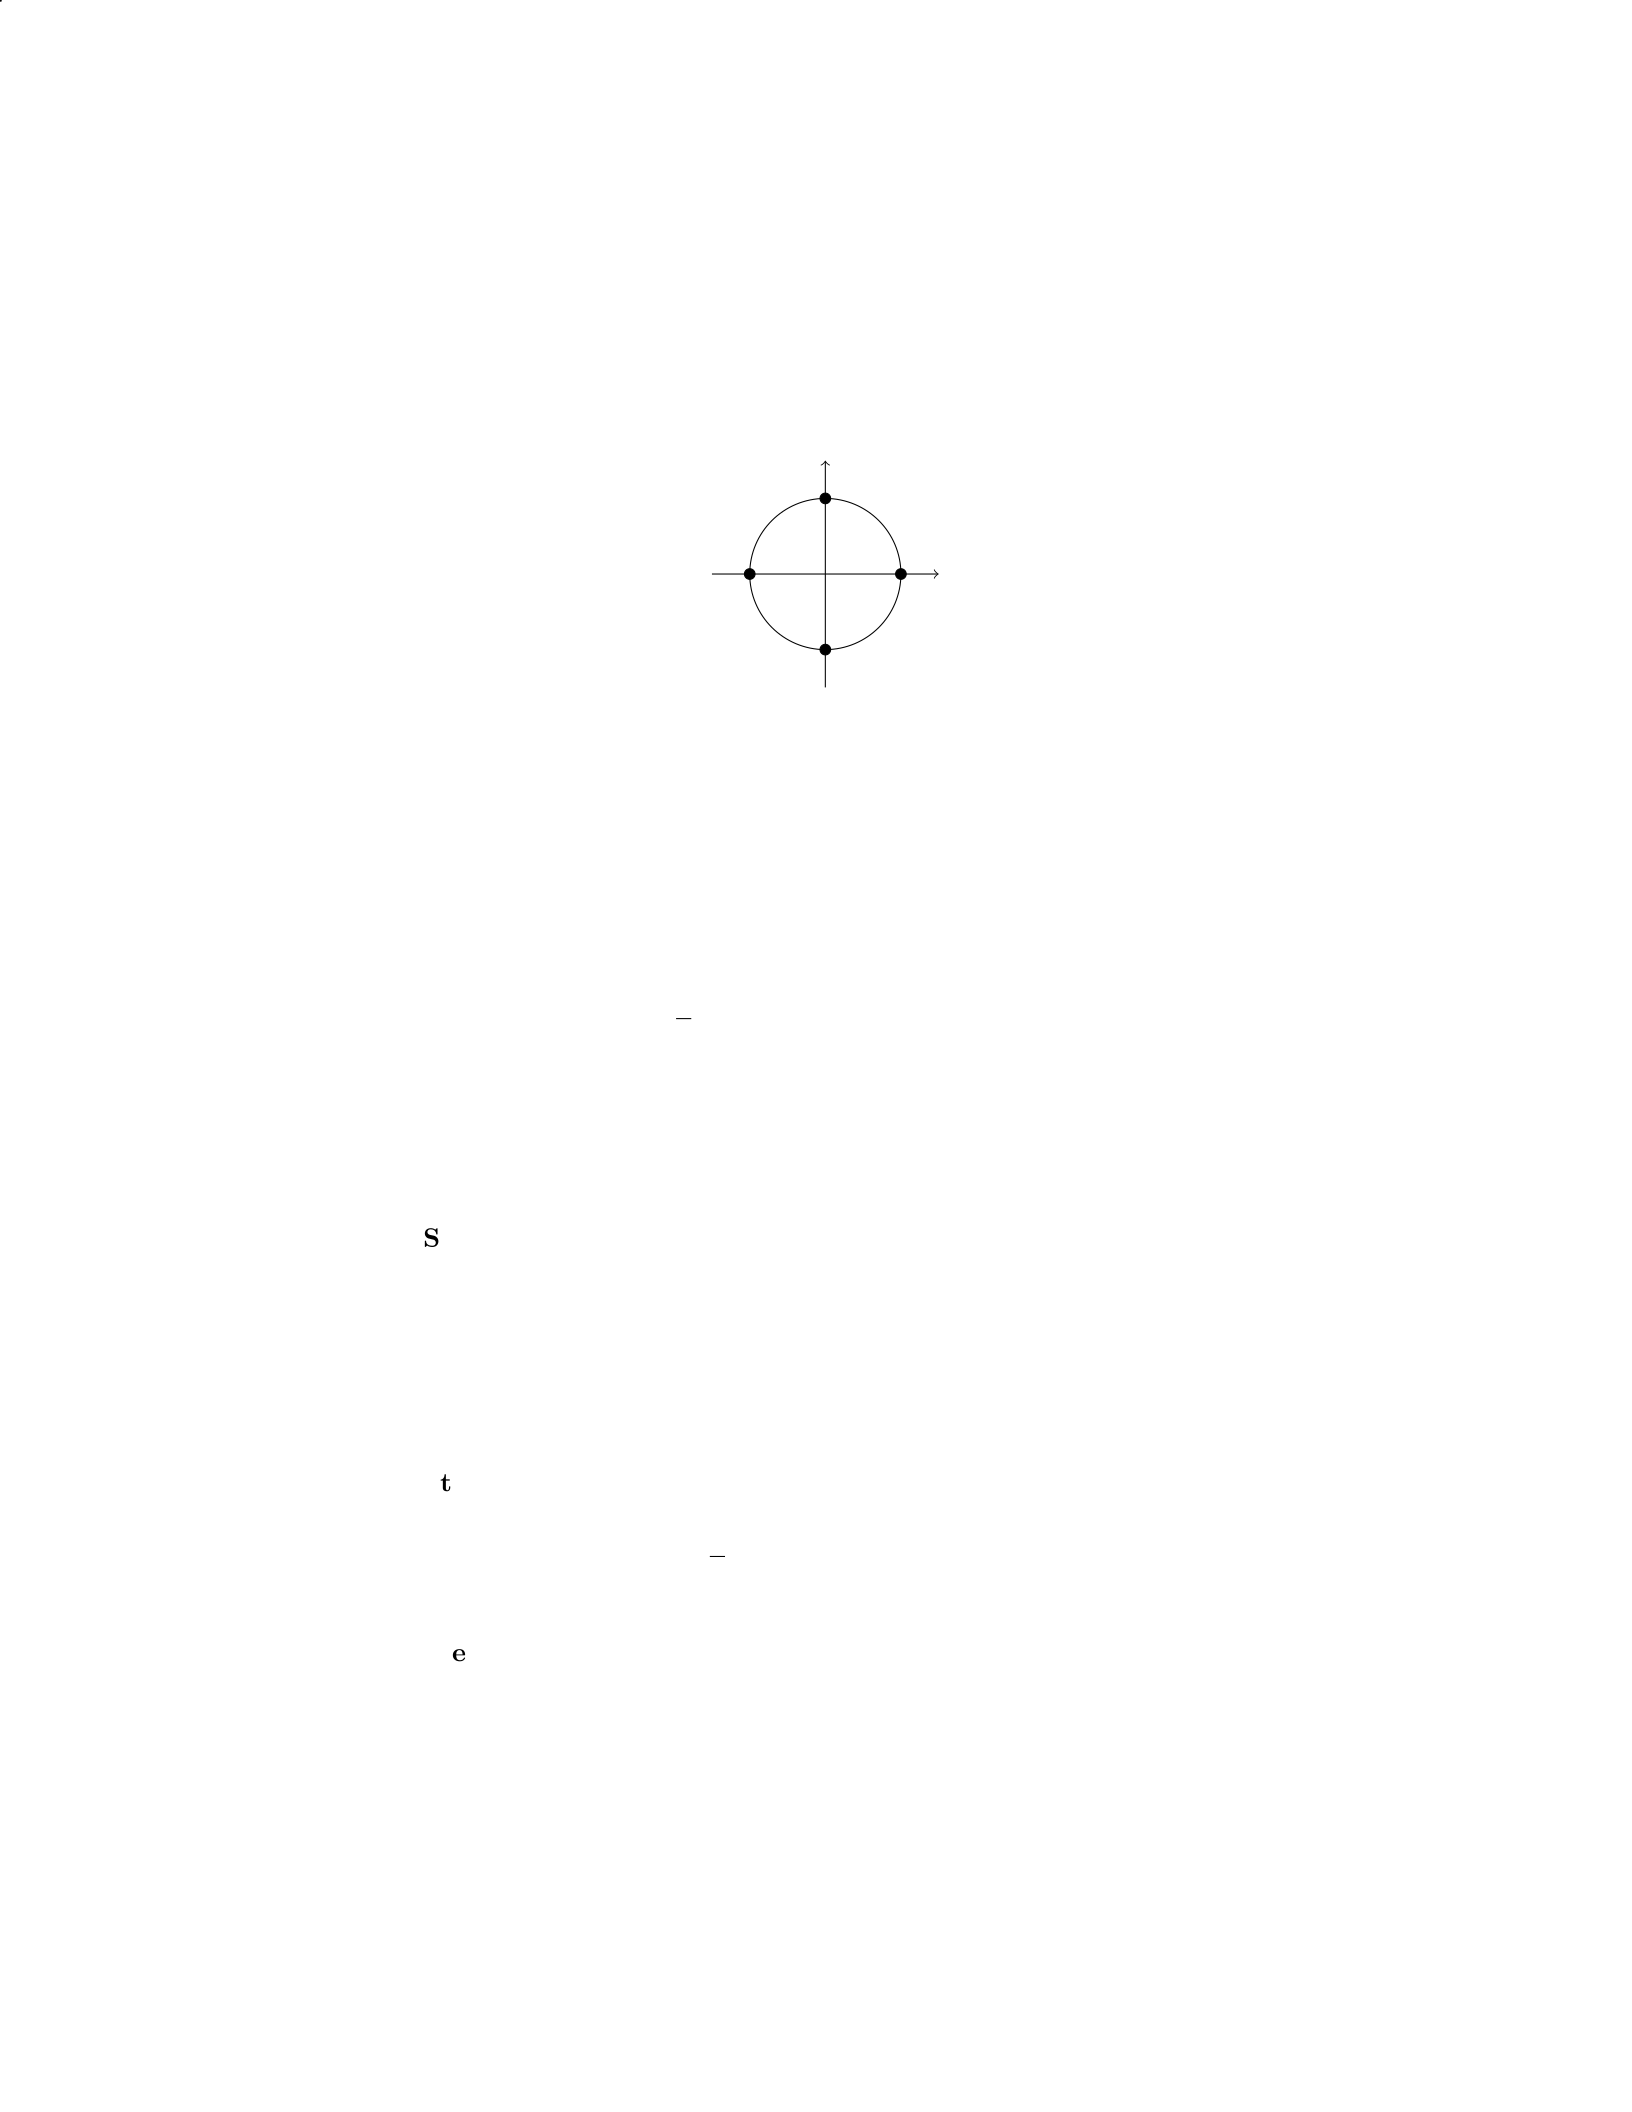
Step 2: Plotting these points on the xy-plane, we can see that the curve
forms a circle with radius 1 centered at the origin.
x
y
(1,0)
(0,1)
(−1,0)
(0,−1)
Step 3: The geometric shape of the curve is a circle with radius 1 centered
at the origin.
Question 22
Question
Plot the geometric shapes defined by the following equations and determine
their properties:
1. x2+y2= 4 2. y=√x3. y=ex
Solution
1. For the equation x2+y2= 4, we recognize that this represents a circle
centered at the origin with radius 2.
Step 1: To plot the circle, we can first find the intercepts by setting x= 0
and y= 0:
–When x= 0, we get y2= 4 =⇒y=±2. So we have intercepts at
(0,2) and (0,−2).
–When y= 0, we get x2= 4 =⇒x=±2. So we have intercepts at
(2,0) and (−2,0).
Step 2: Now, we can plot these points on a coordinate plane and draw a
curve passing through them to represent the circle.
2. For the equation y=√x, this represents half of the parabola y2=xin
the first quadrant.
Step 1: To plot the parabola, we can choose some values of xand compute
the corresponding values of y:
–Let x= 0,1,4 to get y= 0,1,2 respectively.
16
Step 2: Plugging these points into the equation, we plot (0,0), (1,1), and
(4,2).
3. For the equation y=ex, this represents an exponential growth curve
shifting up from the x-axis.
Step 1: To plot the curve, we can choose some values of xto compute
the corresponding values of y:
–Let x=−1,0,1 to get y=1
e,1, e respectively.
Step 2: Plotting (0,1) on the curve, we observe that the curve increases
rapidly as xincreases.
Question 23
Question
Consider the region in the plane bounded by the curve y=x3and the lines
y= 0, x= 1, and x= 2.
a) Find the area of the region bounded by the curve and the lines.
b) Find the volume of the solid generated by revolving this region around
the x-axis.
Solution
a) To find the area of the region bounded by the curve y=x3and the lines
y= 0, x= 1, and x= 2, we need to integrate the difference between the curve
and the x-axis over the given interval.
Step 1: Set up the integral for the area:
Area = Z2
1
(x3−0) dx
Step 2: Integrate the function:
Area = Z2
1
x3dx =x4
42
1
=24
4−14
4=16
4−1
4= 4 −1
4=15
4
Therefore, the area of the region bounded by the curve and the lines is 15
4
square units.
b) To find the volume of the solid generated by revolving this region around
the x-axis, we use the disk method.
Step 1: Set up the integral for the volume:
Volume = πZ2
1
(x3)2dx
17

Step 2: Integrate the function:
Volume = πZ2
1
x6dx =πx7
72
1
=π27
7−17
7=π128
7−1
7=127π
7
Therefore, the volume of the solid generated by revolving this region around
the x-axis is 127π
7cubic units.
Question 24
Question
Consider the following geometric shapes in the xy-plane:
Shape A: A circle with center (−3,4) and radius 5
Shape B: A square with vertices at (0,0), (0,6), (6,6), (6,0)
Shape C: An ellipse with center at the origin, major axis along the x-axis of
length 8, and minor axis along the y-axis of length 4
Find the equations of these shapes in standard form and analyze their prop-
erties.
Solution
Step 1: Equations of the Shapes
For Shape A (circle): The equation of a circle is given by (x−h)2+ (y−
k)2=r2, where (h, k) is the center and ris the radius. Substituting the given
information, we have (x+ 3)2+ (y−4)2= 52. Expanding and simplifying, we
get x2+ 6x+y2−8y−12 = 0.
For Shape B (square): Since the opposite sides of a square are parallel and
of equal length, and the diagonals are perpendicular bisectors of each other, the
equation of the square can be determined. The sides of the square are parallel
to the x-axis and y-axis, so we have 0 ≤x≤6 and 0 ≤y≤6. Therefore, the
equation of the square is 0 ≤x≤6 and 0 ≤y≤6.
For Shape C (ellipse): The equation of an ellipse centered at the origin with
major axis 2aalong the x-axis and minor axis 2balong the y-axis is x2
a2+y2
b2=
1. Substituting a= 4 and b= 2, we have x2
42+y2
22= 1, which simplifies to
x2
16 +y2
4= 1.
Step 2: Analysis of the Shapes
- Shape A is a circle centered at (−3,4) with radius 5. It intersects the
x-axis at (−8,0) and 2,0, and the y-axis at (−3,9) and (−3,−1). - Shape B
is a square with vertices at (0,0), (0,6), (6,6), (6,0), and sides parallel to the
coordinate axes. - Shape C is an ellipse centered at the origin, with major axis
of length 8 along the x-axis and minor axis of length 4 along the y-axis.
These geometric shapes exhibit different properties due to their equations
and dimensions.
18

Question 25
Question
Consider the following equation in polar coordinates: r= 2 sin(3θ).
1. Plot the curve represented by the equation.
2. Analyze the curve and determine if it is symmetric with respect to any
line or point.
3. Identify any points of intersection with the coordinate axes.
Solution
1. To plot the curve represented by the equation r= 2 sin(3θ), we can first
analyze the graph of r= sin(θ), which is a cardioid. The given equation,
r= 2 sin(3θ), indicates that the amplitude of the sine function has been doubled
and its period has been divided by 3. This results in 3 petals for the curve.
2. The curve is symmetric with respect to the line θ=πas ris not affected
by the replacement of θwith π−θ.
3. To find the points of intersection with the coordinate axes, we need to
set r= 0. Solving 0 = 2 sin(3θ) gives us θ= 0,π
3,2π
3, π, 4π
3,5π
3. Thus, the curve
intersects the coordinate axes at the polar angles θ= 0,π
3,2π
3,4π
3,5π
3.
Therefore, the curve represented by the equation r= 2 sin(3θ) is a symmetric
curve with 3 petals and intersects the coordinate axes at θ= 0,π
3,2π
3,4π
3,5π
3.
Question 26
Question
Consider the following geometric shapes:
Shape A: A circle centered at the origin with radius 2.
Shape B: A parabola given by the equation y=x2.
Shape C: A straight line passing through the points (−3,−2) and (1,4).
For each shape, plot it on the coordinate plane and then analyze its proper-
ties such as symmetry, intercepts, concavity, and any other relevant character-
istics.
Solution
To tackle this problem, we will analyze each geometric shape separately.
Shape A: Circle centered at the origin with radius 2
1. Step 1: Plot the circle with its center at the origin and radius of 2.
2. Step 2: The equation of a circle centered at the origin with radius ris
x2+y2=r2. Substituting r= 2 into the equation gives x2+y2= 4.
19

3. Step 3: The circle intersects the x-axis at (2,0) and (−2,0), and the
y-axis at (0,2) and (0,−2).
4. Step 4: The circle has symmetry with respect to both the x-axis and
y-axis.
Shape B: Parabola y=x2
1. Step 1: Plot the parabola y=x2.
2. Step 2: The parabola opens upwards and its vertex is at the origin.
3. Step 3: The parabola intersects the y-axis at (0,0).
4. Step 4: The parabola does not intersect the x-axis.
Shape C: Straight line passing through (−3,−2) and (1,4)
1. Step 1: Find the equation of the straight line passing through (−3,−2)
and (1,4).
2. Step 2: The equation of a straight line passing through two points (x1, y1)
and (x2, y2) is given by
y−y1=y2−y1
x2−x1
(x−x1).
Substituting (−3,−2) and (1,4) into the equation gives the line y=x+ 1.
3. Step 3: Plot the straight line y=x+ 1 passing through (−3,−2) and
(1,4).
4. Step 4: The line intersects the y-axis at (0,1) and does not intersect the
x-axis.
By analyzing the properties of each shape as described above, we have gained
insights into their symmetry, intercepts, concavity, and other key characteristics.
Question 27
Question
Consider the following parametric equations:
x(t) = 2 cos(t), y(t) = 3 sin(t), z(t) = 4 cos(t)
for 0 ≤t≤2π.
Plot the curve represented by these parametric equations in 3D space. Then,
analyze the curve in terms of symmetry, intersections with coordinate axes, and
direction of motion.
20

Solution
To plot the curve represented by the parametric equations in 3D space, we need
to visualize the (x, y, z) coordinates as tvaries from 0 to 2π. Let’s analyze the
curve step by step.
Step 1: Plot the Curve We first plot the curve represented by the para-
metric equations:
x(t) = 2 cos(t), y(t) = 3 sin(t), z(t) = 4 cos(t)
for 0 ≤t≤2π.
Step 2: Analyze Symmetry Let’s analyze the symmetry of the curve: -
The curve will be symmetric with respect to the x-zplane because changing t
to −treflects the curve about the x-zplane. - The curve will not be symmetric
with respect to the y-zplane.
Step 3: Intersections with Coordinate Axes To find the intersections
with the coordinate axes, we substitute x= 0, y= 0, and z= 0 into the
parametric equations and solve for t: - The curve intersects the x-axis when
t=π/2,3π/2. - The curve intersects the y-axis when t= 0, π. - The curve does
not intersect the z-axis.
Step 4: Direction of Motion The direction of motion of the curve can
be determined by examining the signs of dx
dt ,dy
dt , and dz
dt . - dx
dt =−2 sin(t),
dy
dt = 3 cos(t), dz
dt =−4 sin(t). - Since dx
dt and dz
dt are both negative when
0≤t≤2π, the curve moves in the clockwise direction when viewed from the
positive y-axis.
This completes our analysis of the curve represented by the given parametric
equations in 3D space.
Question 28
Question
Let Abe a square with side length 4 centered at the origin. Let Bbe a circle
with radius 3 centered at the point (5,0). Find the area of the region enclosed
by Aand B.
Solution
Step 1: First, let’s find the intersection points of the square Aand the circle B.
The equation of circle Bis (x−5)2+y2= 32. Since the center of the square
Ais at the origin, we only need to consider the first quadrant. The boundary
of the square is given by y=x,y=−x,x= 2, and x=−2.
Solving the system (x−5)2+x2= 32along with y=x,y=−x,x= 2, and
x=−2, we find the intersection points to be (1,1) and (−1,−1).
Step 2: We can now find the area enclosed by these two shapes. The area
enclosed by Ais simply the area of the square, which is 42= 16 square units.
21

The area enclosed by Bis the area of the circle subtracted by the area of the
quarter-circle cut off by the square.
The total area enclosed by Aand Bis the area of the square minus the area
of the quarter-circle:
16 −1
4π32= 16 −9
4π= 16 −9π
4square units.
Therefore, the area of the region enclosed by Aand Bis 16 −9π
4square
units.
Question 29
Question
Consider the following geometric shape described by the inequalities:
x≥0, y ≥0,3x+ 4y≤12, x + 2y≤5.
Plot the region defined by these inequalities and find its area.
Solution
Step 1: Plot the lines defined by the equalities 3x+ 4y= 12 and x+ 2y= 5.
Step 2: Find the intersection points of the lines with the axes. Step 3: Shade
the region defined by the inequalities and calculate its area.
Step 1:
To plot the lines 3x+4y= 12 and x+2y= 5, we rewrite them in slope-intercept
form:
For 3x+ 4y= 12,
4y=−3x+ 12
y=−3
4x+ 3.
For x+ 2y= 5,
2y=−x+ 5
y=−1
2x+5
2.
Step 2:
To find the intersection points with the axes, we set x= 0 and y= 0 in the
equations:
For y=−3
4x+ 3,
x= 0, y = 3,giving point (0,3),
y= 0, x = 4,giving point (4,0).
22

For y=−1
2x+5
2,
x= 0, y =5
2,giving point (0,5
2),
y= 0, x = 5,giving point (5,0).
Step 3:
Shade the region defined by the system of inequalities as shown in the plot
below.
geometric_shape.png
The shaded region represents the feasible region defined by the inequalities.
The area of this region can be calculated by finding the area of the triangle
formed by the intersection points: (0, 3), (4, 0), and (5, 0).
Using the formula for the area of a triangle 1
2bh, where bis the base and h
is the height, we have:
Area = 1
2(4)(3) = 6.
Thus, the area of the region defined by the inequalities is 6 units2.
Question 30
Question
Consider the following parametric equations:
x= 2 cos(t)
y= 3 sin(t)
Plot the geometric shape formed by these parametric equations and analyze
its properties.
Solution
Step 1: To plot the geometric shape formed by the parametric equations x=
2 cos(t) and y= 3 sin(t), let’s first eliminate the parameter tto find the Cartesian
equation of the curve. We can use the trigonometric identity: cos2(t)+sin2(t) =
1
Step 2: Using the given parametric equations, we can rewrite them in terms
of cos(t) and sin(t):
x2= 22cos2(t)
y2= 32sin2(t)
23

Step 3: Now, we add the equations x2= 4 cos2(t) and y2= 9 sin2(t):
x2+y2= 4 cos2(t) + 9 sin2(t) = 4(1 −sin2(t)) + 9 sin2(t)
x2+y2= 4 −4 sin2(t) + 9 sin2(t)
x2+y2= 4 + 5 sin2(t)
Step 4: Since 0 ≤sin2(t)≤1, we can conclude that the Cartesian equation
of the curve is:
x2+y2= 4 + 5 sin2(t)
Step 5: The equation x2+y2= 4 + 5 sin2(t) represents an ellipse centered
at the origin. The major axis is along the y-axis with length 2 ·3 = 6 and the
minor axis is along the x-axis with length 2 ·2 = 4.
Step 6: Therefore, the geometric shape formed by the parametric equations
is an ellipse centered at the origin with a major axis of 6 units and a minor axis
of 4 units.
24

