



EXSC 520
CASE STUDY: ANALYSIS OF VARIANCE WITH REPEATED MEASURES
I. Analysis of Variance with Repeated Measures
Research question: “is there a statistically significant difference in the core body
temperature at minutes: 0, 15, and 30 while exercising in a hot environment?”
Assumptions Testing
1. Data level of measurement- what is the level of measurement for the data used in this
case study?
The Core Body Temperature variable had a level of measurement.
2. Would the amount of skewness and kurtosis in these affect the analysis? How do you
know? Give numerical values to support your conclusion.
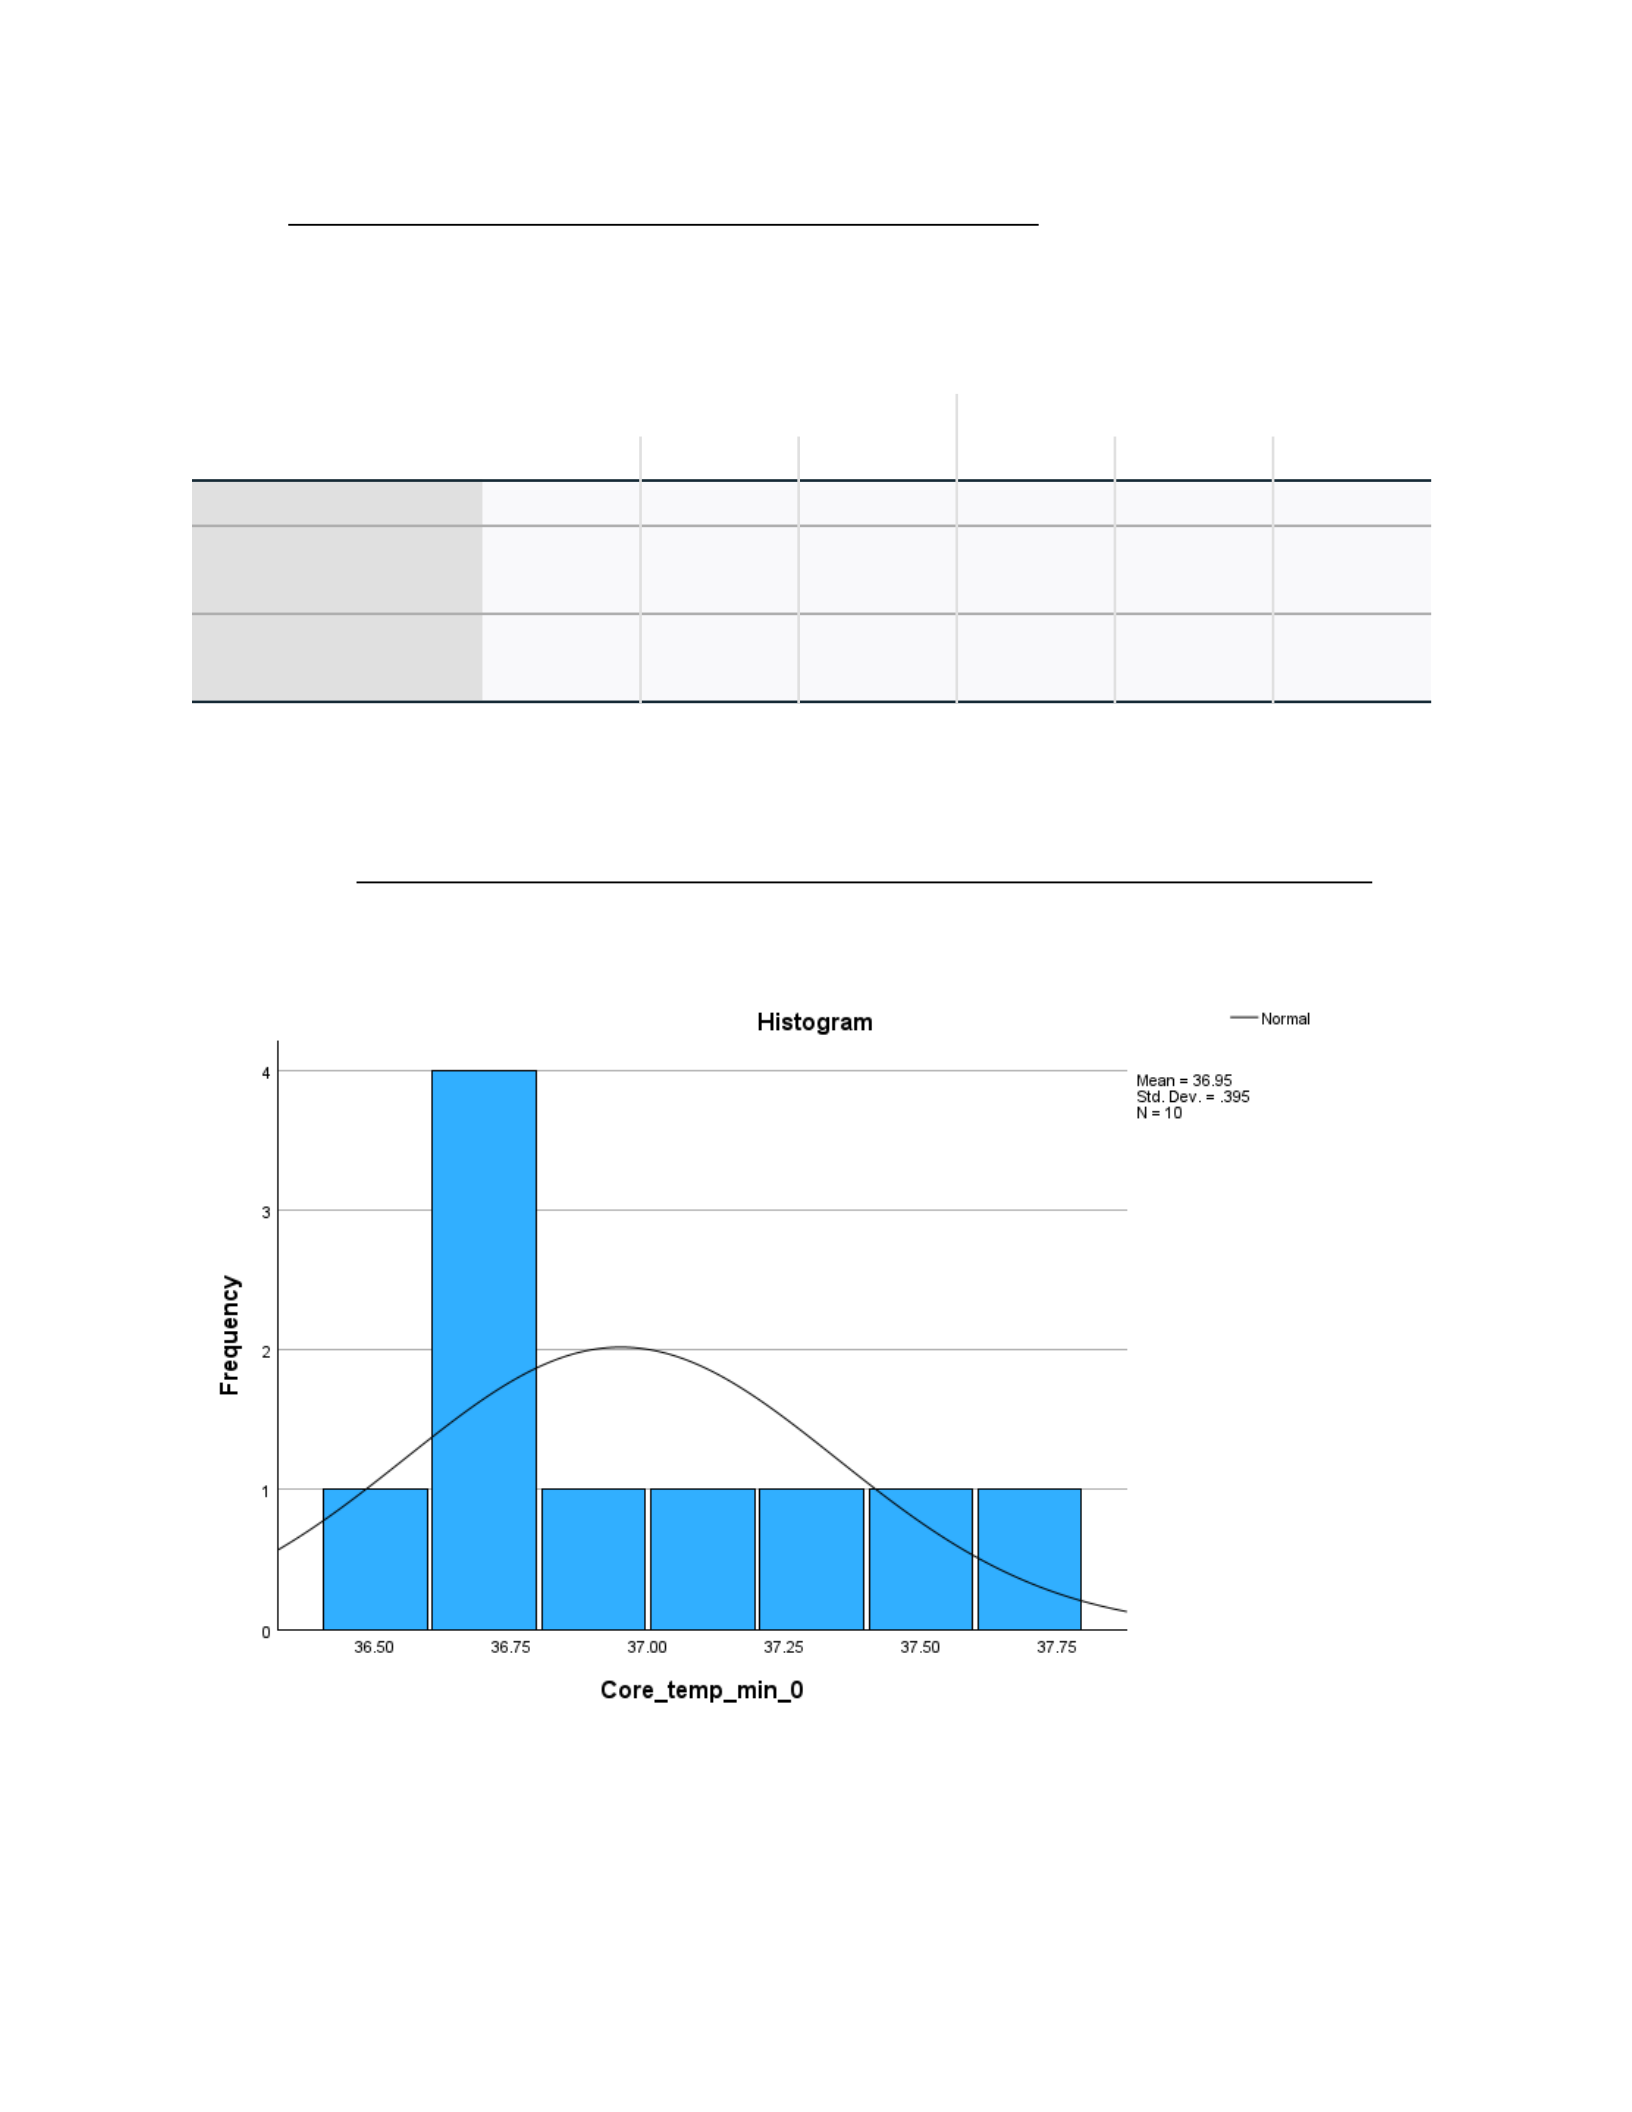
According to Table 1, the Core Body Temp at 0 minutes had no skewness or
kurtosis, with values of 0.993 and 0.878, which fall between -1.96 and 1.96. Core
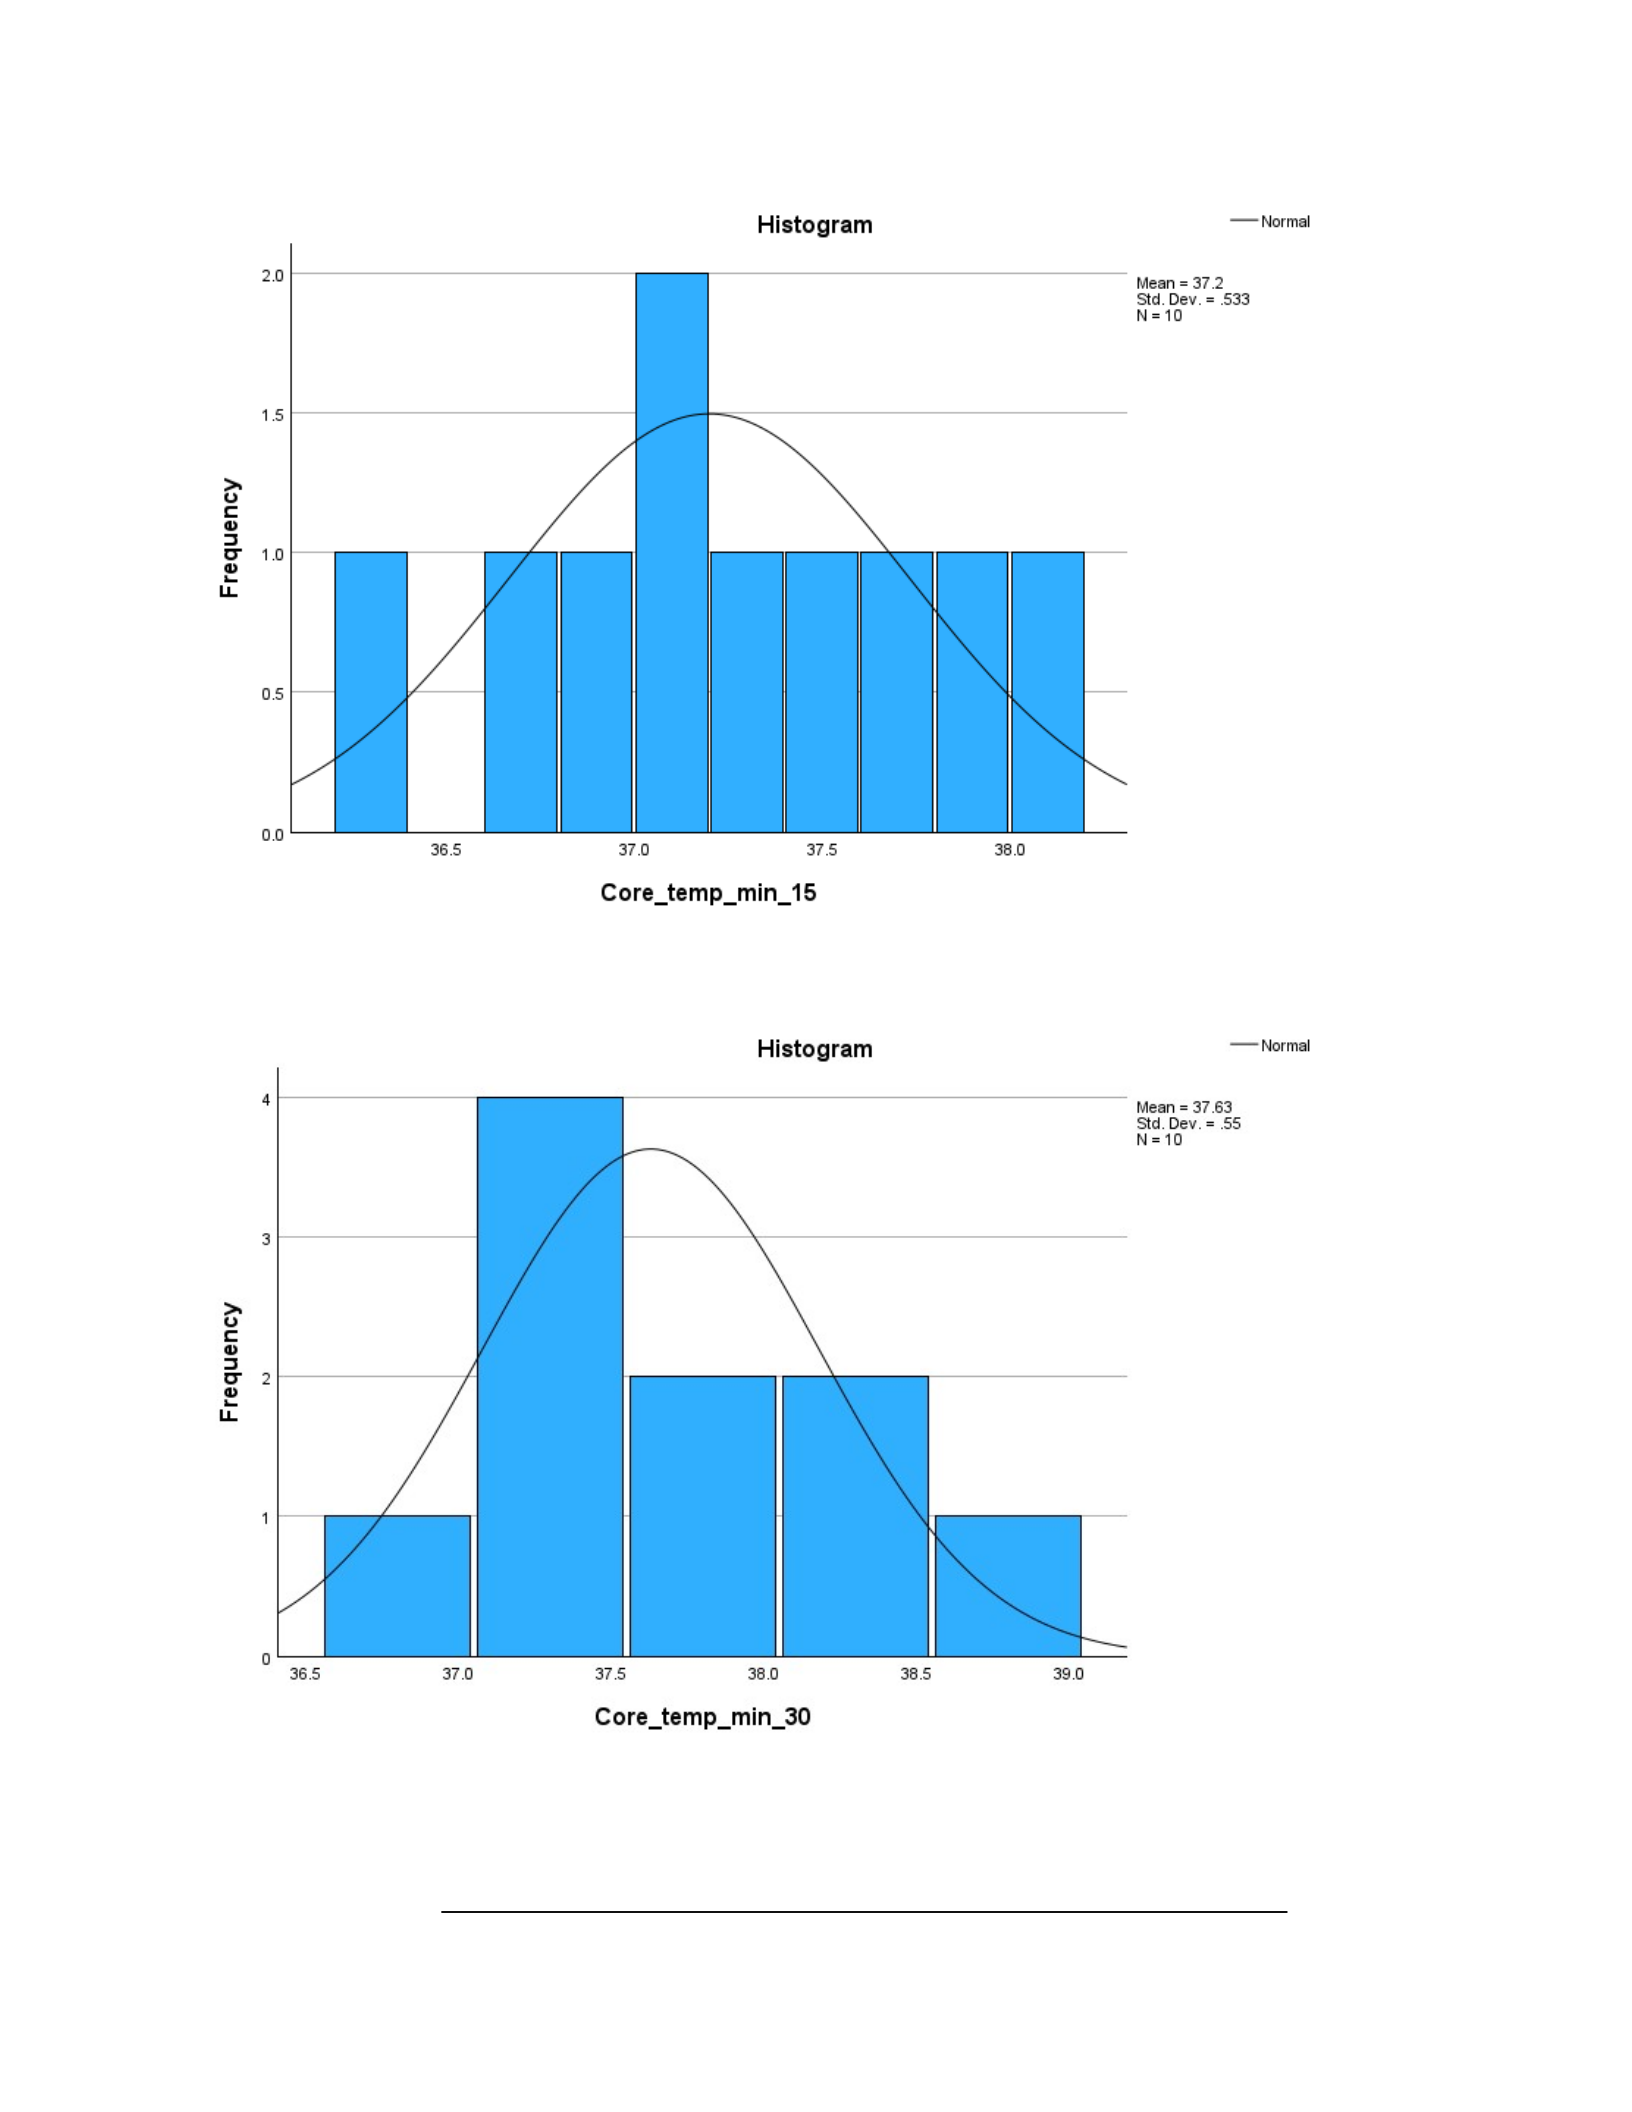
Body Temp at 15 minutes had no skewness or kurtosis, and their values were
0.087 and 0.525, and also fell between -1.96 and 1.96. Last Core Body Temp at
30 minutes had no skewness or kurtosis with values of 0.36 and 0.417, which are
both between -1.96 and 1.96.
Table 1. PASTE TABLE with skewness and kurtosis BELOW
Descriptives
Statistic Std. Error
Core_temp_min_0 Mean 36.950 .1249
95% Confidence Interval
for Mean
Lower
Bound
36.667
Upper
Bound
37.233
5% Trimmed Mean 36.939
Median 36.750
Variance .156
Std. Deviation .3951
Minimum 36.5
Maximum 37.6
Page 1 of 14

EXSC 520
Range 1.1
Interquartile Range .7
Skewness .682 .687
Kurtosis -1.171 1.334
Core_temp_min_1
5
Mean 37.200 .1687
95% Confidence Interval
for Mean
Lower
Bound
36.818
Upper
Bound
37.582
5% Trimmed Mean 37.206
Median 37.150
Variance .284
Std. Deviation .5333
Minimum 36.3
Maximum 38.0
Range 1.7
Interquartile Range 1.0
Skewness -.060 .687
Kurtosis -.700 1.334
Core_temp_min_3
0
Mean 37.630 .1739
95% Confidence Interval
for Mean
Lower
Bound
37.237
Upper
Bound
38.023
5% Trimmed Mean 37.622
Median 37.650
Variance .302
Std. Deviation .5498
Minimum 36.8
Maximum 38.6
Range 1.8
Interquartile Range .9
Skewness .244 .687
Kurtosis -.556 1.334
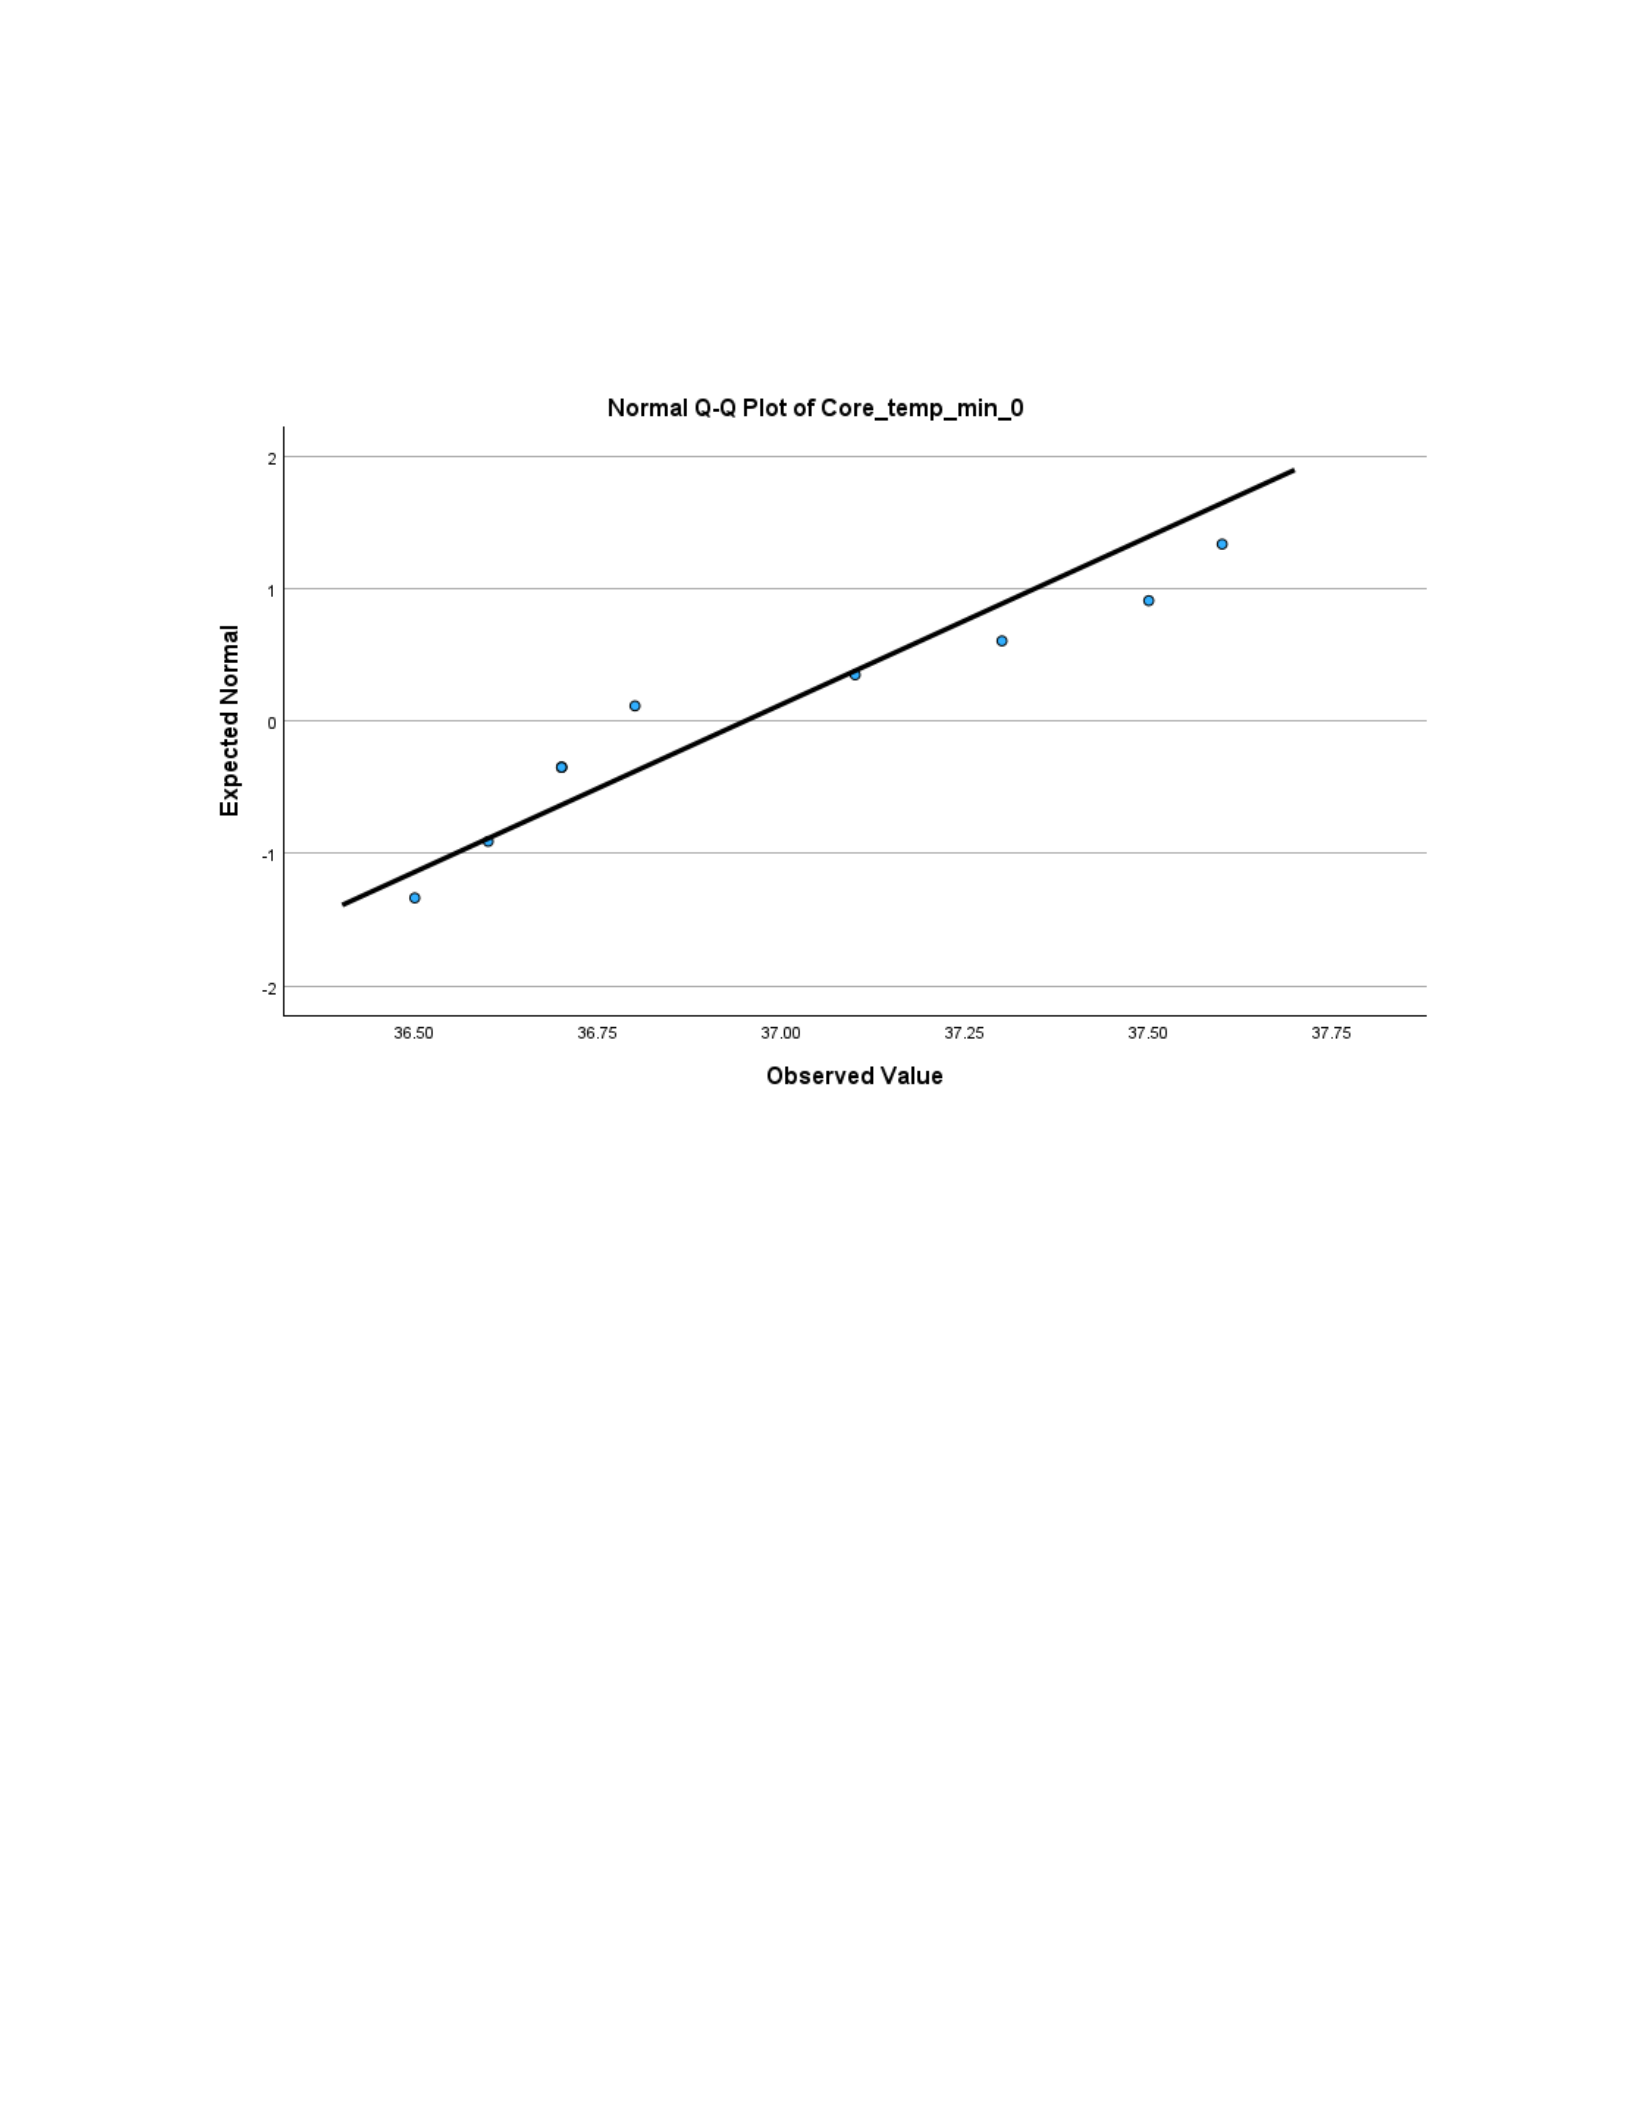
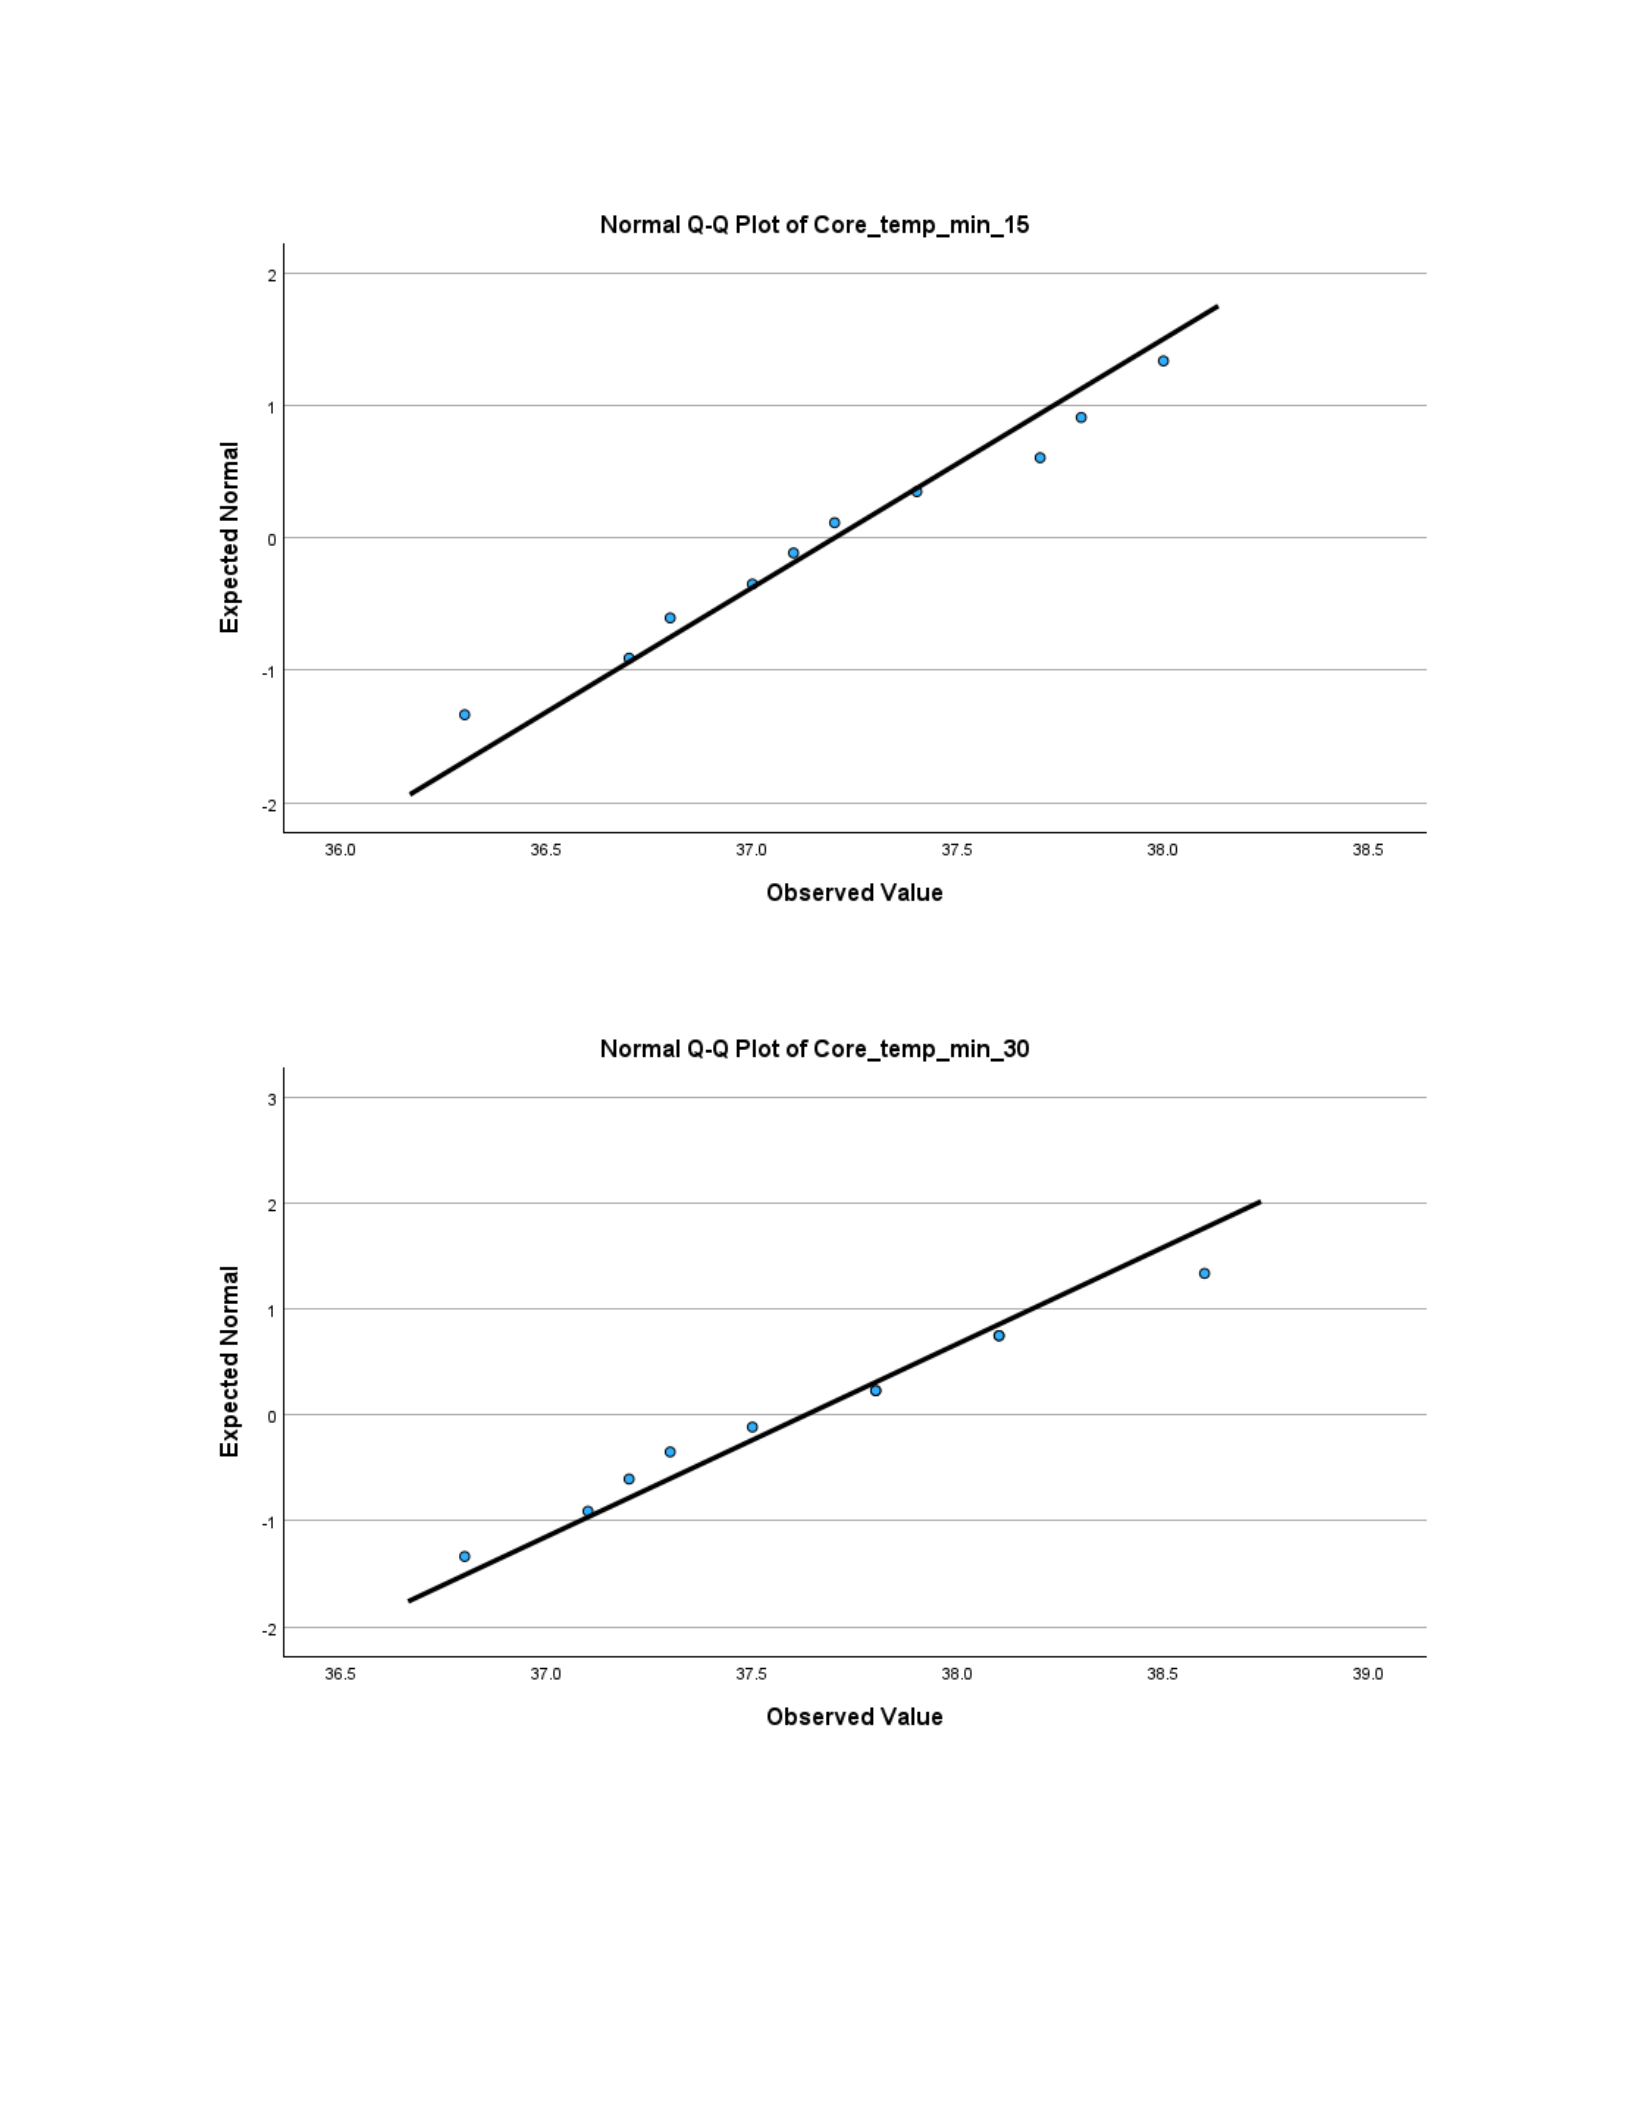
3. Was the assumption of normality met, and how do you know?
All three variables met the assumption of normality with p > 0.05, according to Table 2.
Core Body Temp at 0 minutes, 0.115, at 15 minutes, 0.960, and at 30 minutes, 0.926.
Page 2 of 14
EXSC 520
Table 2. PASTE Tests of NORMALITY table BELOW
Tests of Normality
Kolmogorov-SmirnovaShapiro-Wilk
Statistic df Sig. Statistic df Sig.
Core_temp_min_0 .248 10 .082 .875 10 .115
Core_temp_min_1
5
.126 10 .200*.979 10 .960
Core_temp_min_3
0
.126 10 .200*.974 10 .926
*. This is a lower bound of the true significance.
a. Lilliefors Significance Correction
Figure 1. PASTE Histogram with normal curve for each variable BELOW
Page 3 of 14
EXSC 520
Figure 2. PASTE Normal Q-Q Plot for each variable BELOW
Page 4 of 14
EXSC 520
Page 5 of 14
EXSC 520
4. Were there any outliers; how do you know?
Page 6 of 14
EXSC 520
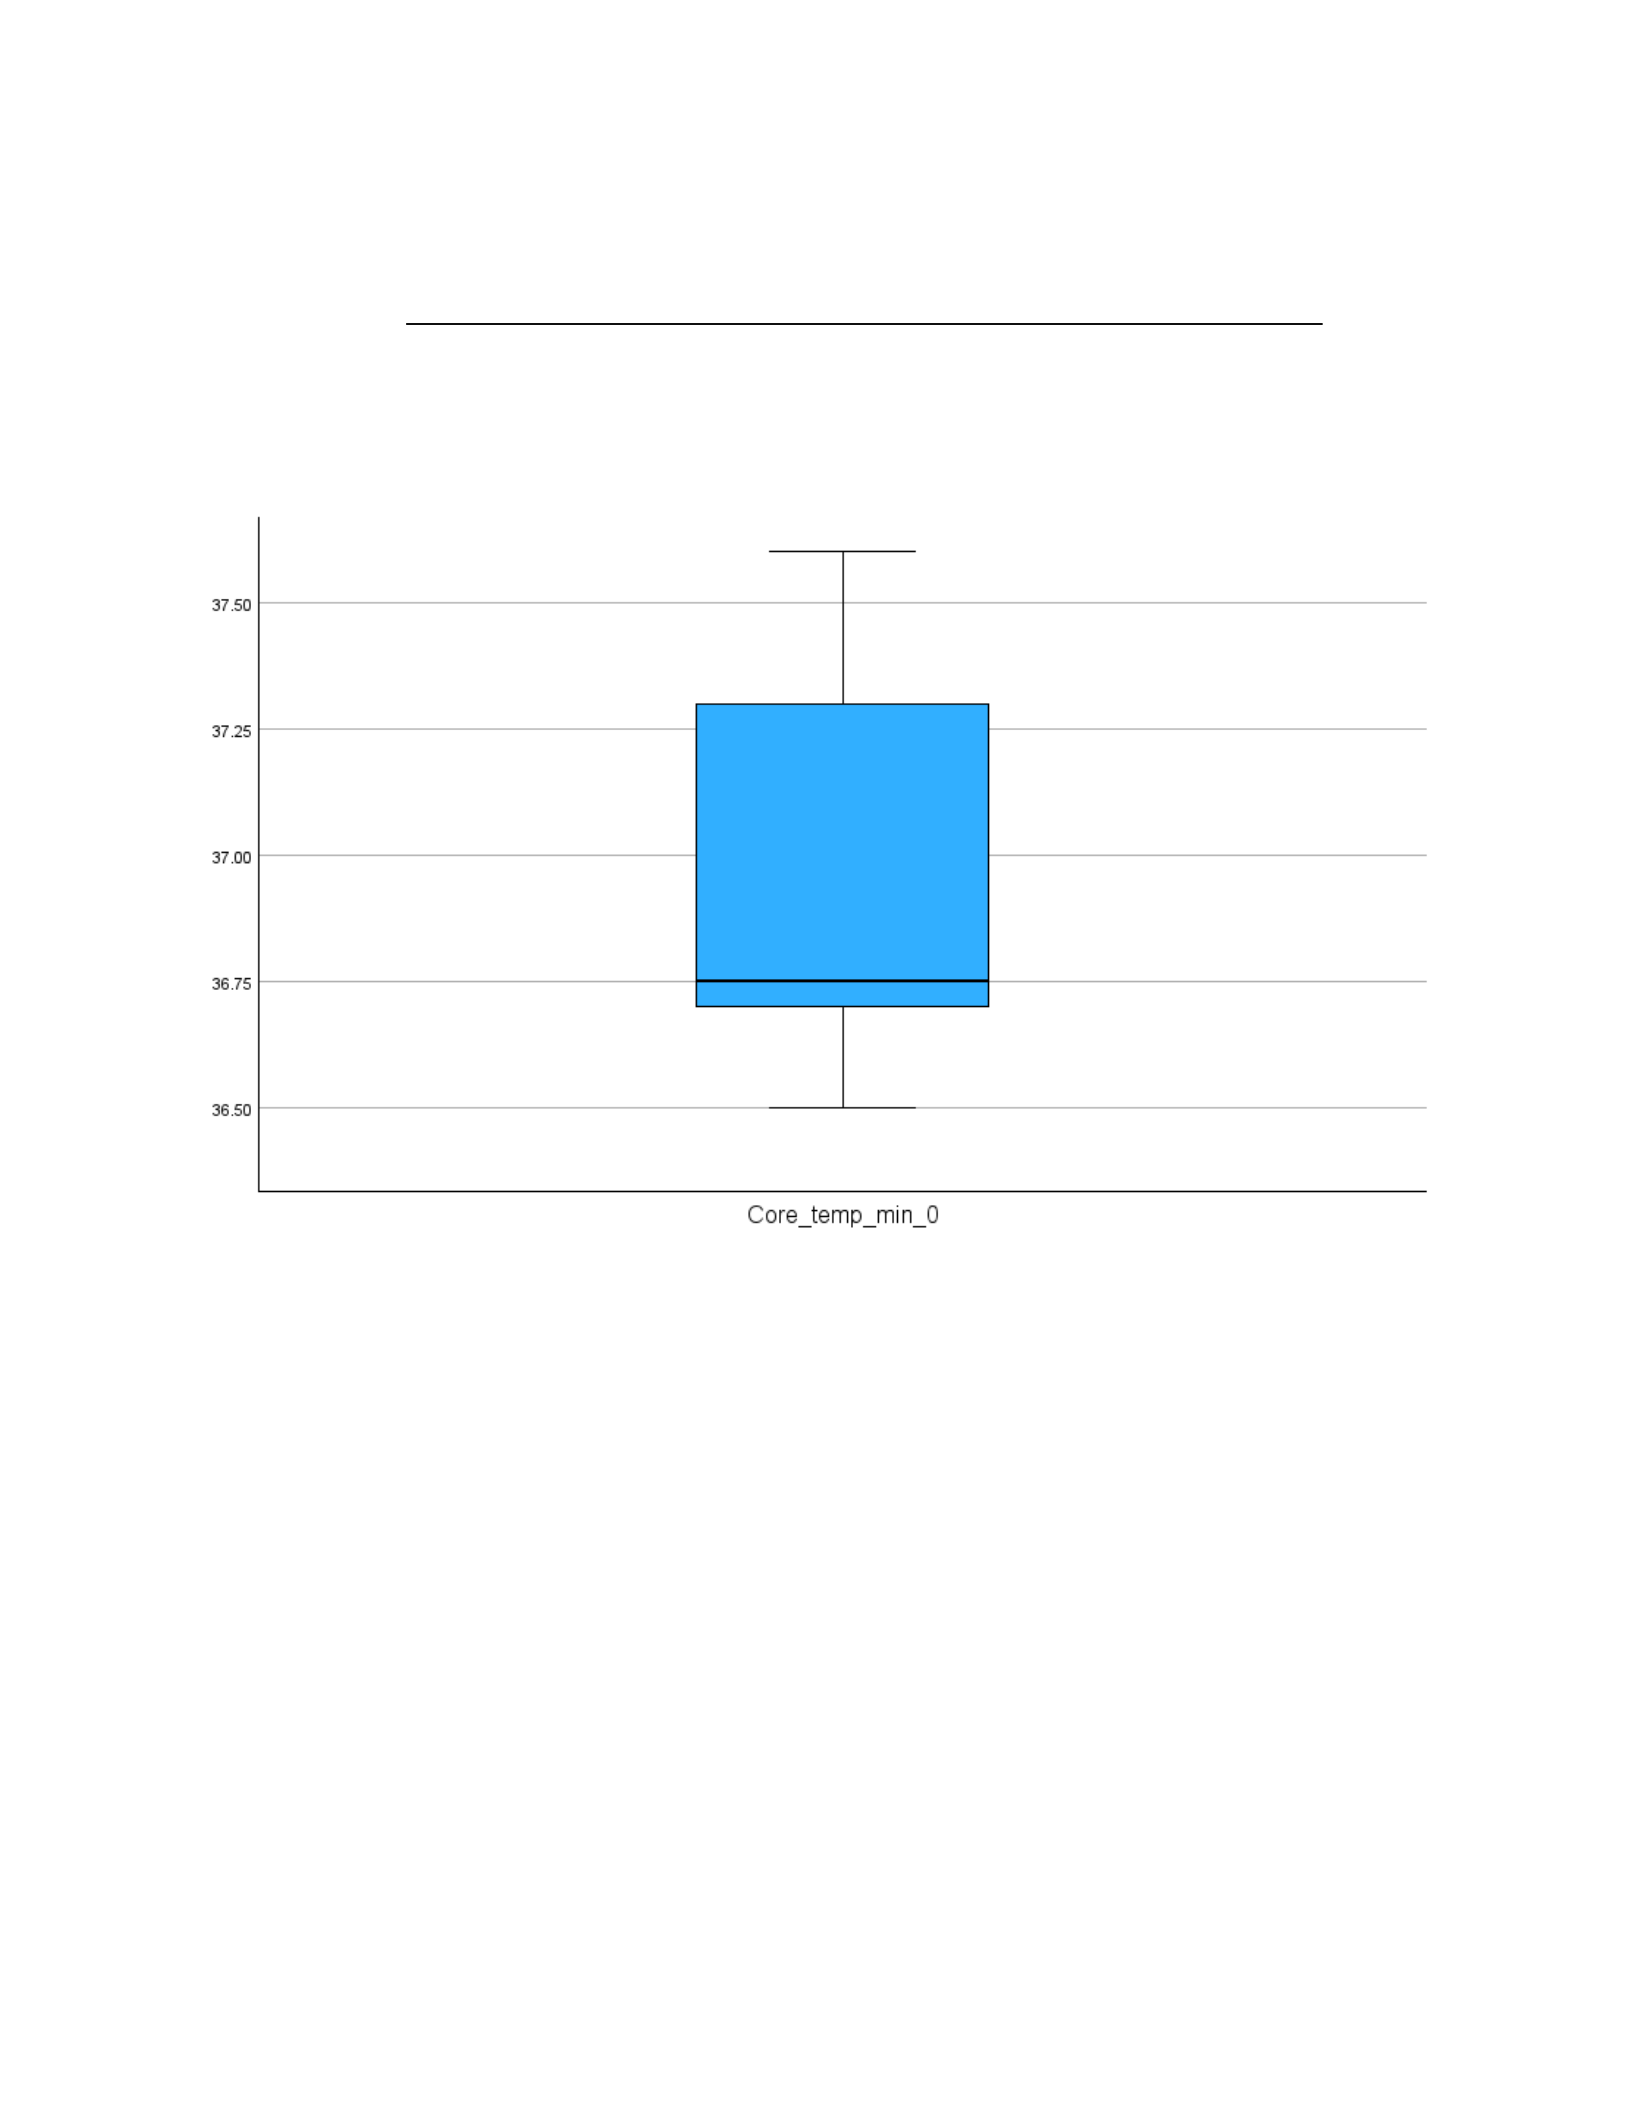
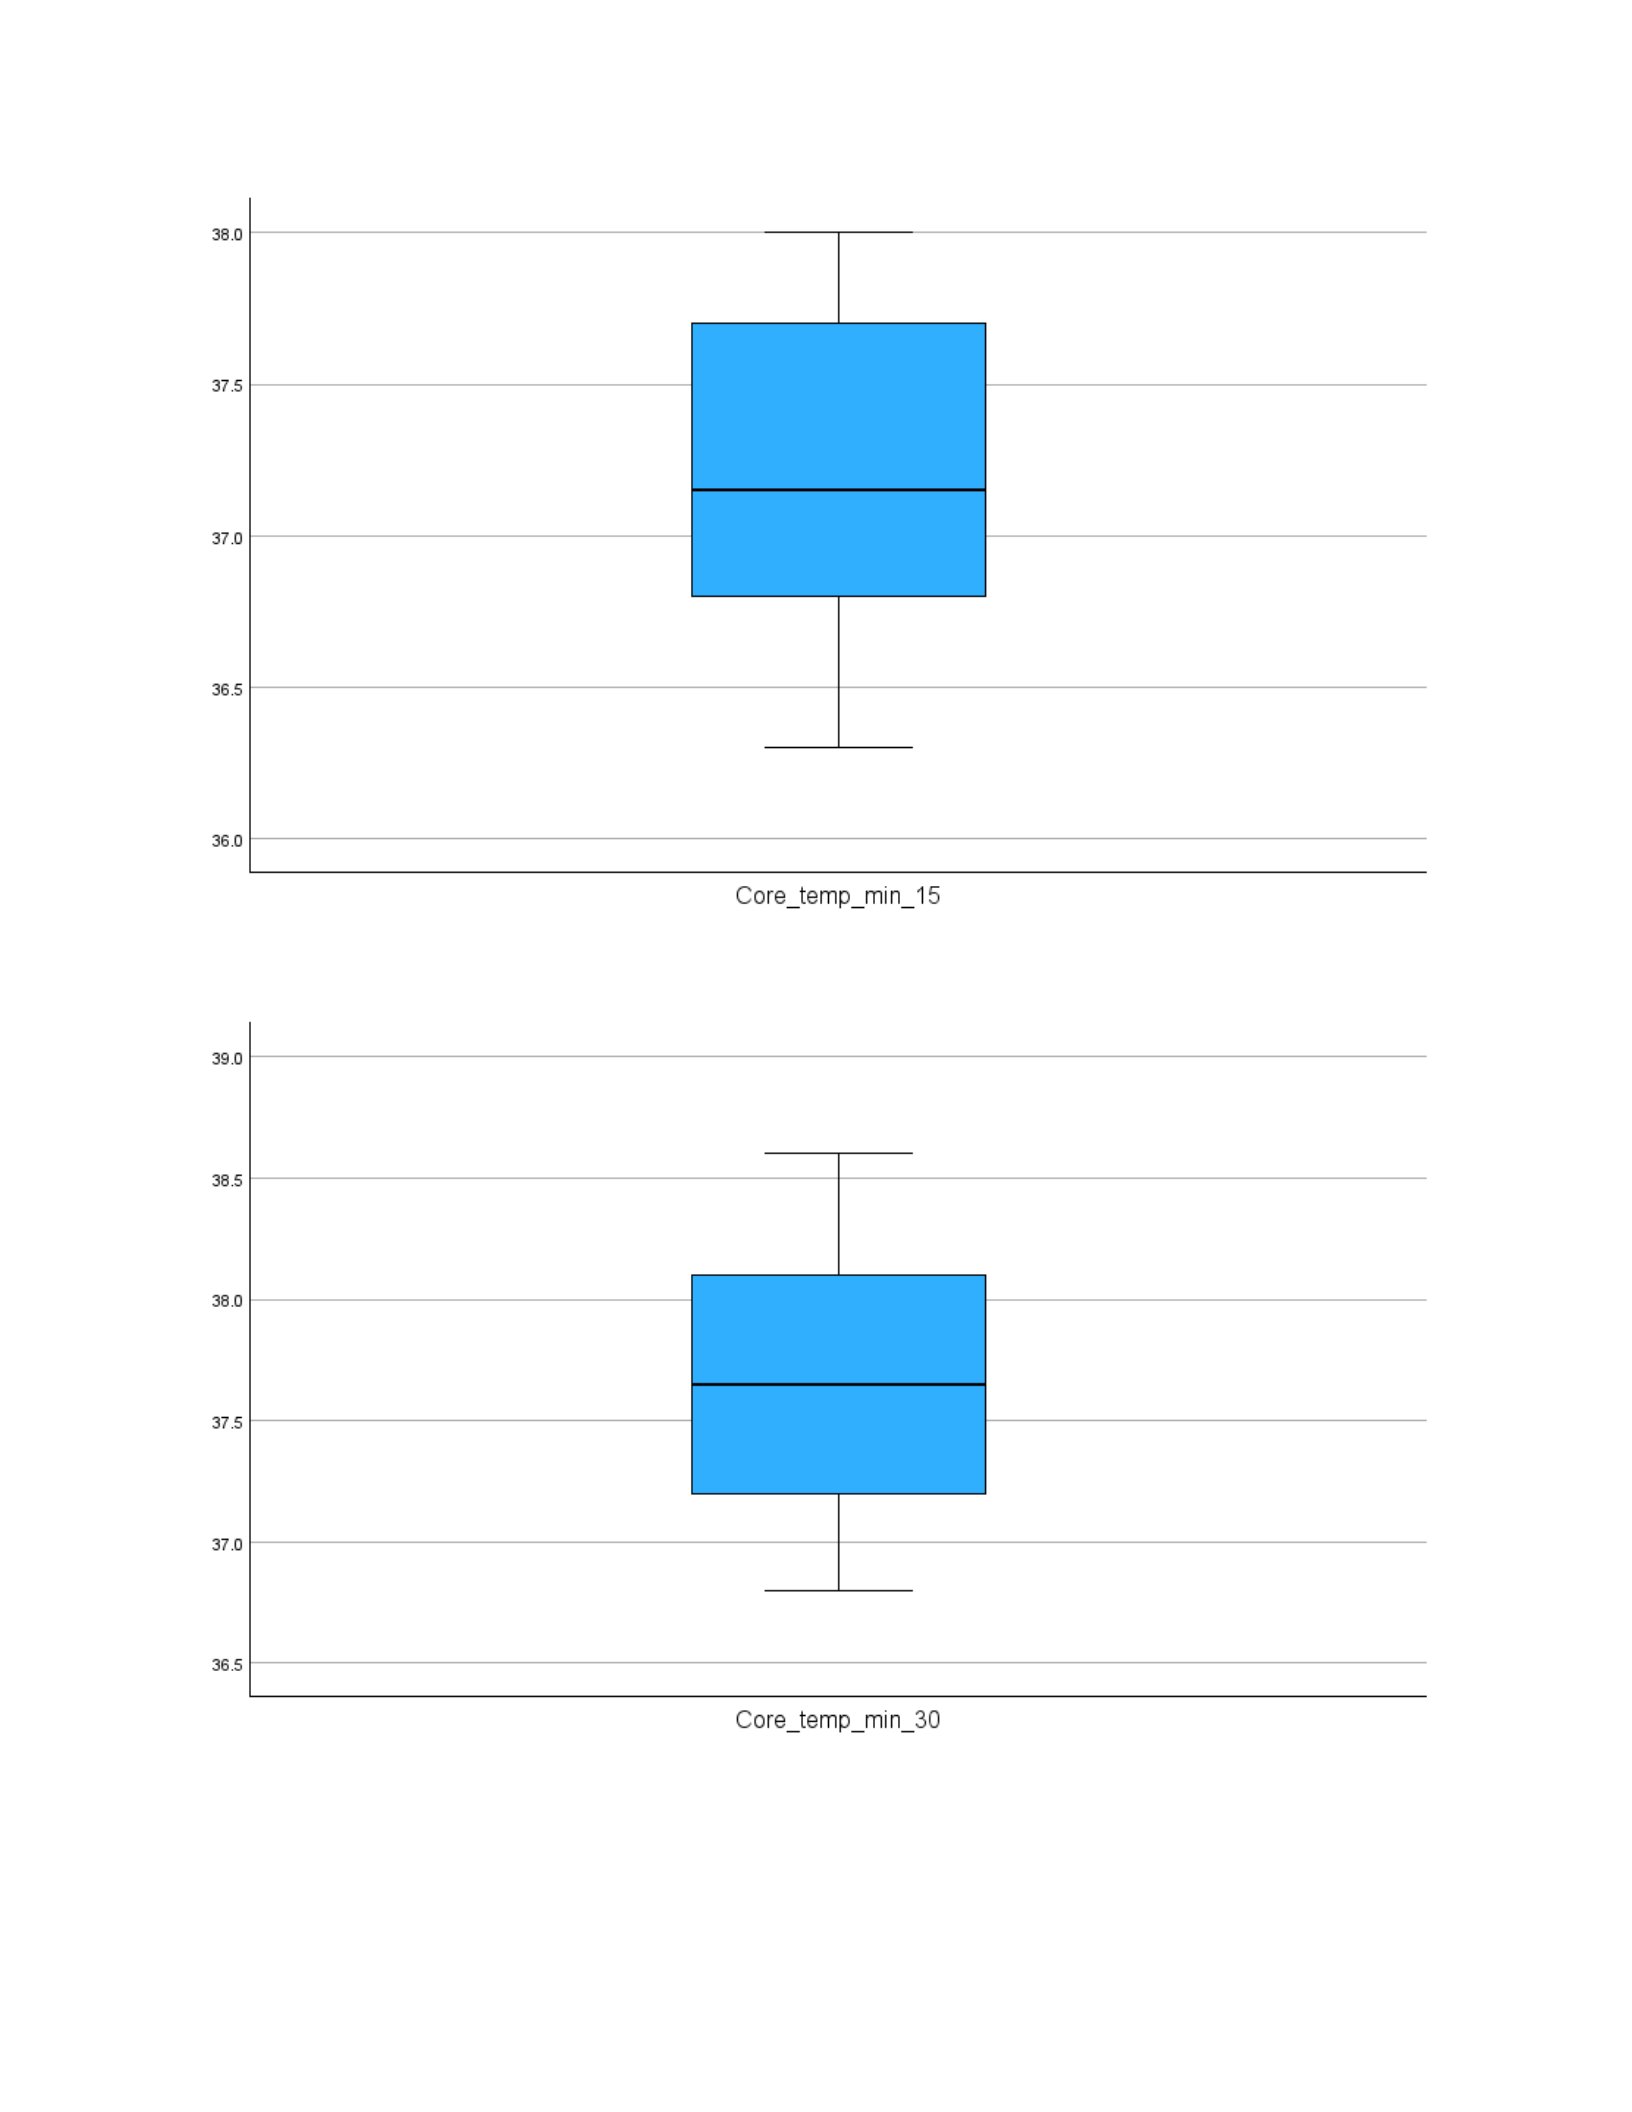
According to Table 3, there were zero outliers reflected in the Box-and-Whispers
Plots.
Table 3. PASTE Box-and-Whiskers Plot for each variable BELOW
Page 7 of 14
EXSC 520
Page 8 of 14

EXSC 520
Statistical Analysis
Table 4. PASTE Within-Subjects Factors table BELOW
Within-Subjects
Factors
Measure:
MEASURE_1
Minut
e
Dependent
Variable
1Core_temp_
min_0
2Core_temp_
min_15
3Core_temp_
min_30
Table 5. PASTE Descriptives table BELOW
Descriptive Statistics
Mean
Std.
Deviation N
Core_temp_min
_0
36.950 .3951 10
Core_temp_min
_15
37.200 .5333 10
Core_temp_min
_30
37.630 .5498 10
Page 9 of 14

EXSC 520
Table 6. PASTE Mauchly’s Test of Sphericity table BELOW
Mauchly's Test of Sphericitya
Measure: MEASURE_1
Within Subjects Effect Mauchly's W
Approx. Chi-
Square df Sig.
Greenhouse-
Geisser
Minute .435 6.651 2 .036 .639
Tests the null hypothesis that the error covariance matrix of the orthonormalized transformed dependent variables is proportional to an identity matrix.
a. Design: Intercept
Within Subjects Design: Minute
b. May be used to adjust the degrees of freedom for the averaged tests of significance. Corrected tests are displayed in the Tests of Within-Subjects
Effects table.
Table 7. PASTE Test of Within-Subjects Effects table BELOW
Page 10 of 14

EXSC 520
Tests of Within-Subjects Effects
Measure: MEASURE_1
Source
Type III
Sum of
Squares df
Mean
Square F Sig.
Partial Eta
Squared
Noncent.
Parameter
Observed
Minute Sphericity
Assumed
2.366 2 1.183 42.531 <.001 .825 85.063
Greenhouse-
Geisser
2.366 1.278 1.851 42.531 <.001 .825 54.368
Huynh-Feldt 2.366 1.396 1.694 42.531 <.001 .825 59.393
Lower-bound 2.366 1.000 2.366 42.531 <.001 .825 42.531
Error(Mi
nute)
Sphericity
Assumed
.501 18 .028
Greenhouse-
Geisser
.501 11.505 .044
Huynh-Feldt .501 12.568 .040
Lower-bound .501 9.000 .056
a. Computed using alpha = .05
Table 8. PASTE Tests of Between-Subjects Effects table BELOW
Tests of Between-Subjects Effects
Measure: MEASURE_1
Transformed Variable: Average
Source
Type III Sum
of Squares df
Mean
Square F Sig.
Partial Eta
Squared
Noncent.
Parameter
Observed
Powera
Interce
pt
41649.228 1 41649.228 60601.91
6
<.001 1.000 60601.916 1.000
Error 6.185 9 .687
a. Computed using alpha = .05
Page 11 of 14

EXSC 520
Table 9. PASTE Pairwise Comparisons table BELOW
Pairwise Comparisons
Measure: MEASURE_1
(I)
Minute
(J)
Minute
Mean
Difference
(I-J)
Std.
Error Sig.b
95% Confidence Interval
for Differenceb
Lower
Bound
Upper
Bound
1 2 -.250*.081 .038 -.486 -.014
3-.680*.093 <.001 -.952 -.408
2 1 .250*.081 .038 .014 .486
3-.430*.040 <.001 -.546 -.314
3 1 .680*.093 <.001 .408 .952
2.430*.040 <.001 .314 .546
Based on estimated marginal means
*. The mean difference is significant at the .05 level.
b. Adjustment for multiple comparisons: Bonferroni.
Page 12 of 14

EXSC 520
Figure 3. PASTE Profile Plots figure BELOW
Page 13 of 14

EXSC 520
Write-up- Use these questions as a guide to write an abstract (paragraph). Use past
tense.
The write-up must include the following items:
1. What is the research question?
2. What is the mean and standard deviation for core body temperature at minute: 0, 15, and
30?
3. Was Mauchly’s test of Sphericity met? How do you know?
4. Was the ANOVA statistically significant? (Hint: look at Sig value in Between-Subjects
Effects table)
5. List all (if any) significant multiple comparisons
6. What do the statistical findings of these data suggest about the research question?
7. What are your thoughts on the finding of this analysis, and what are the
practical application(s) of this finding? Elaborate on what the study means,
why, how you know, and relate the findings to exercise physiology knowledge.
Use references if needed.
(Hint- does this study “make sense?” What could influence results?)
The research question for this case study is, “Is there a statistically significant difference
in the core body temperature at minutes 0, 15, and 30 while exercising in a hot environment?”
First variable at 0 minutes, the mean was 36.95, and the standard deviation was 0.40. The
second variable at 15 minutes, the mean was 37.20, and the standard deviation was 0.54. The
final variable at 30 minutes, the mean was 37.64, and the standard deviation was 0.53.
Mauchly’s test of Sphericity was met because the p-value was 0.037, and the Greenhouse-
Geisser p-value for within-subjects effects was <0.001. As for the ANOVA, it was statistically
significant with a p-value of <0.001. As for substantial comparisons, Core Body Temp at 0
minutes was statistically significantly different than Core Body Temp at 15 minutes at p = 0.037.
Also, Core Body Temp at 0 minutes was statistically significantly different than Core Body Temp
at 30 minutes at p <0.001. Lastly, Core Body Temp was statistically significantly different than
Core Body Temp at 30 minutes at p <0.001. When the participants were exercising in a hot
environment, there was a significant difference in their Core Body Temperature at all three time
periods. These findings make sense because, from an exercise physiology perspective, the Core
Body temperature rises from just exercising based on the intensity over time, regardless of the
hot environment. This data aligns with these findings because the longer the participant
exercises in a hot environment, the higher their Core Body Temperature will increase as well.
Page 14 of 14

