



1
ENGR 370 Test 2
This Test is worth 150 points (30 points for each question). All answers need to be done by hand and
some may also need input from JMP (the question will specify this). If you are doing the calculation
by hand but you want to use Excel you must include all of the calculations (otherwise just write
everything by hand in the exam). All answers must be in this Word file. I will not accept two files.
Please circle the answer. Illegible answers will not be graded.
NAME: Yazan Abbasi
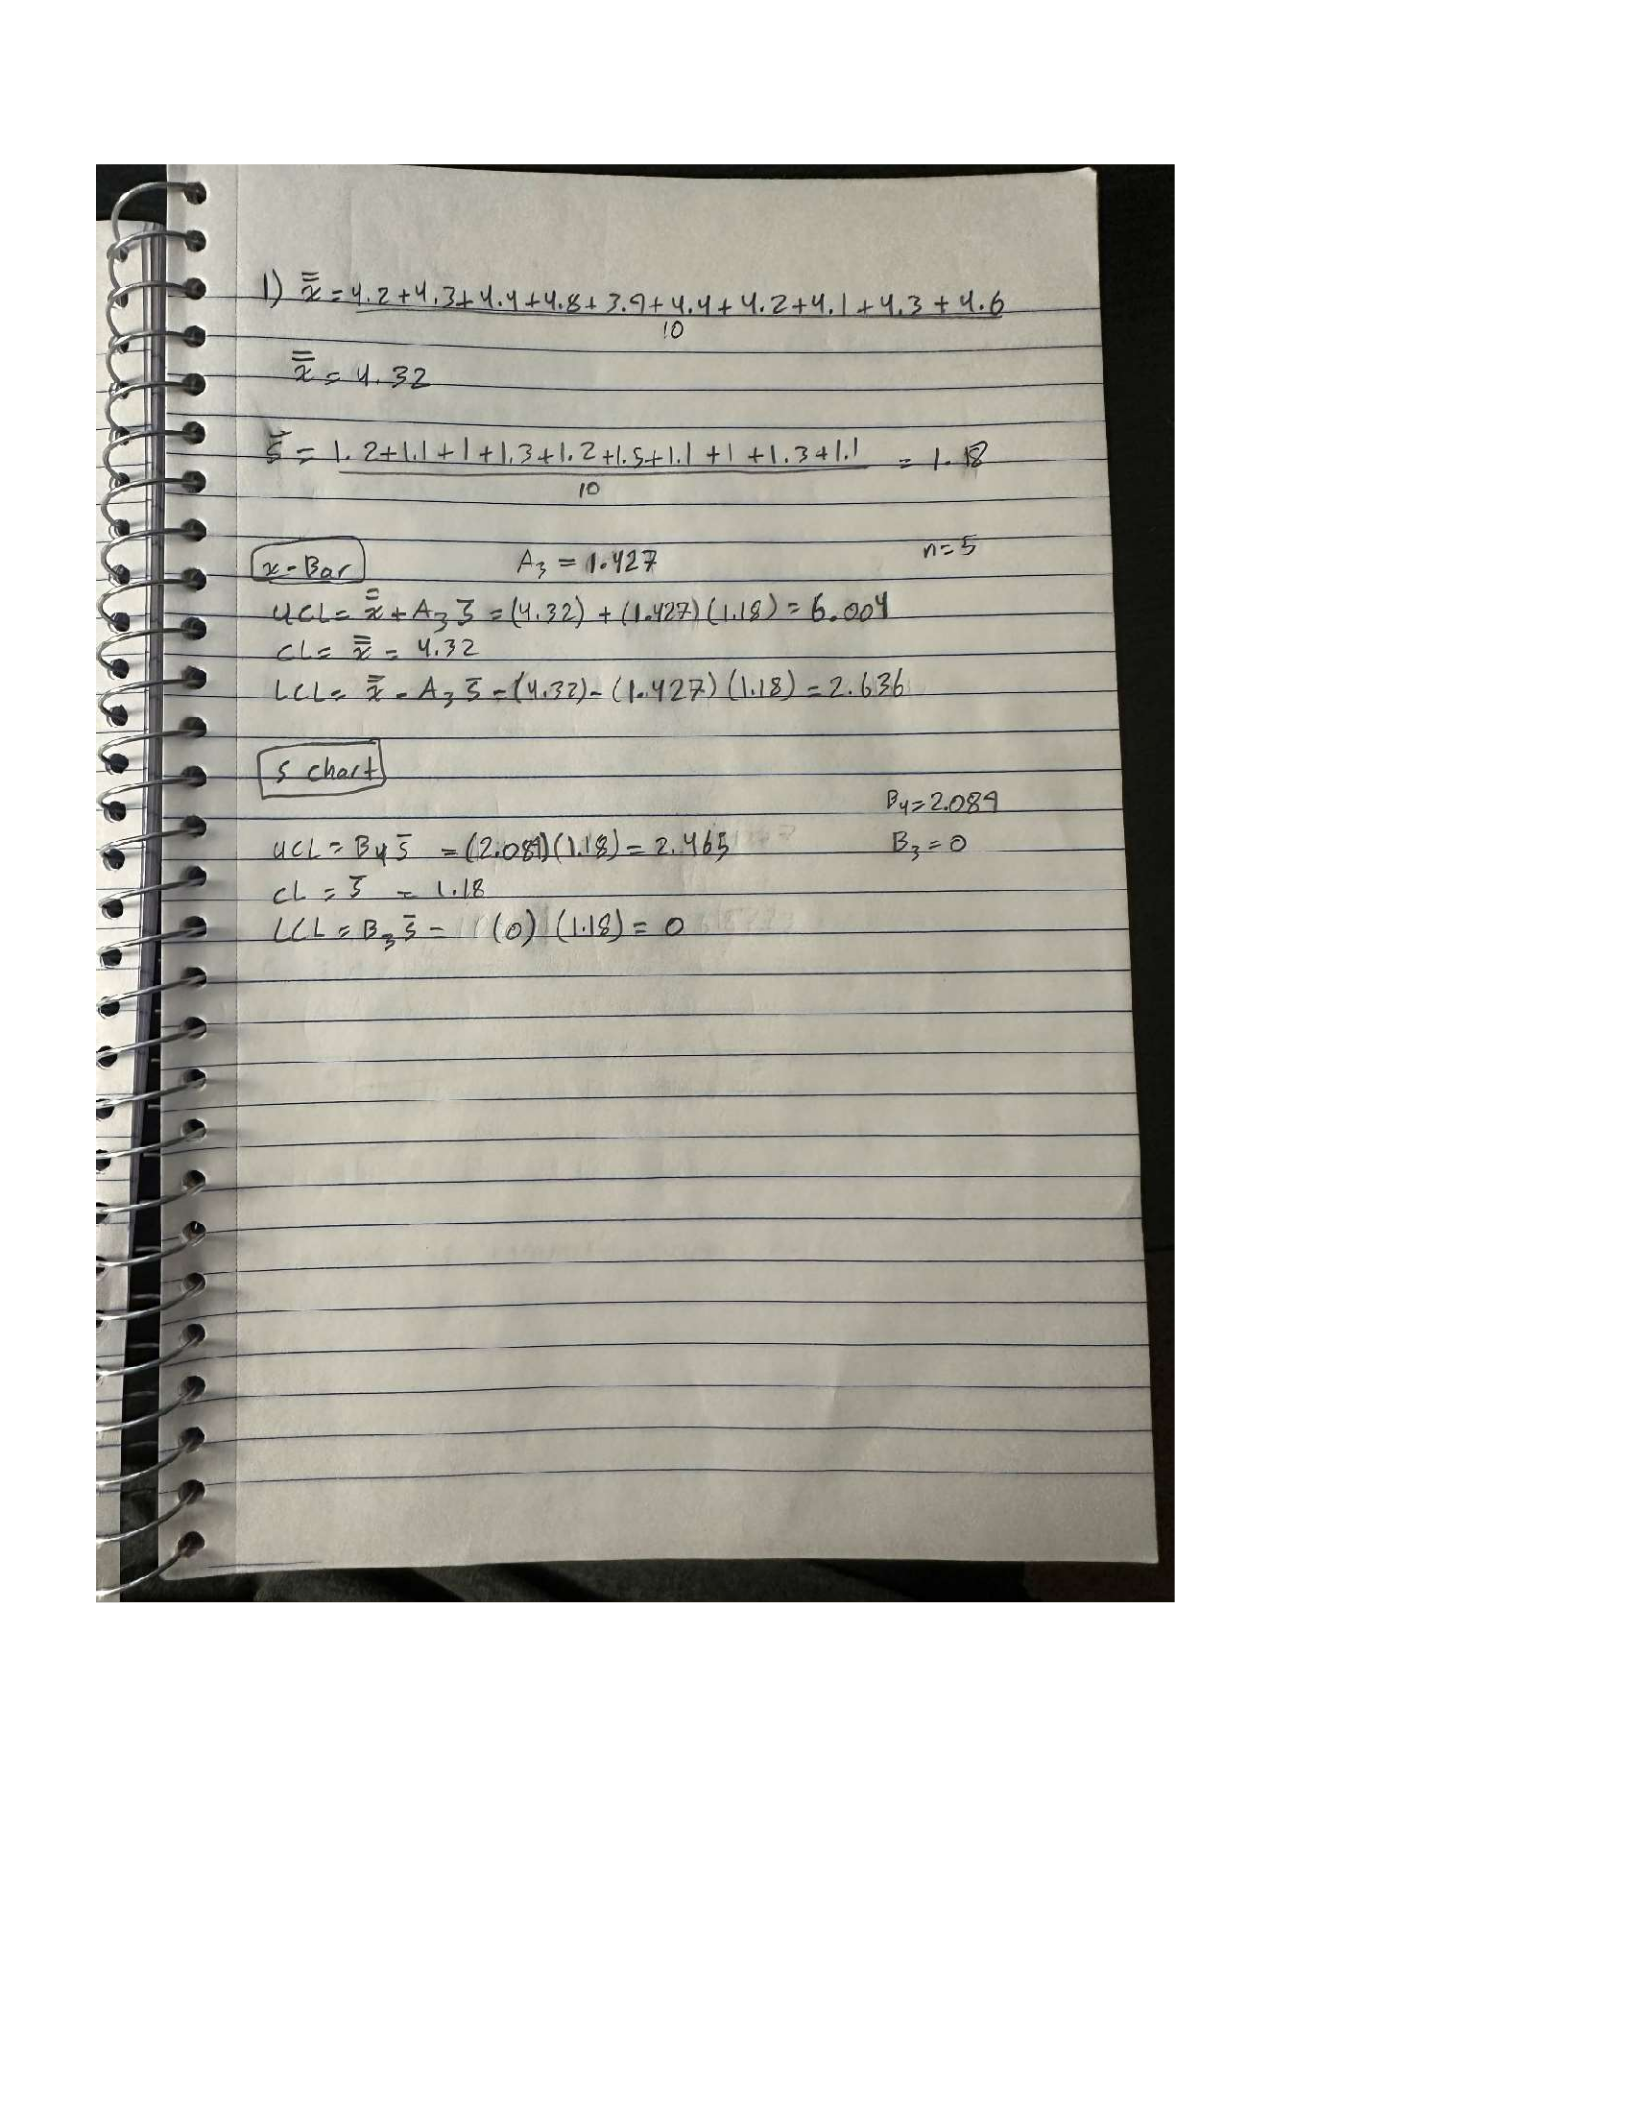
1. You have just started working at a company that manufactures computer components. You
supervisor gave you the following data and asked you to create X-bar and S control charts. Assume
that the data are normally distributed. Data are in mm. Each sample contains 5 data points. Given
the data answer the following questions:
sample x-bar S
1
4.2
1.2
2
4.3
1.1
3
4.4
1
4
4.8
1.3
5
3.9
1.2
6
4.4
1.5
7
4.2
1.1
8
4.1
1
9
4.3
1.3
10
4.6
1.1
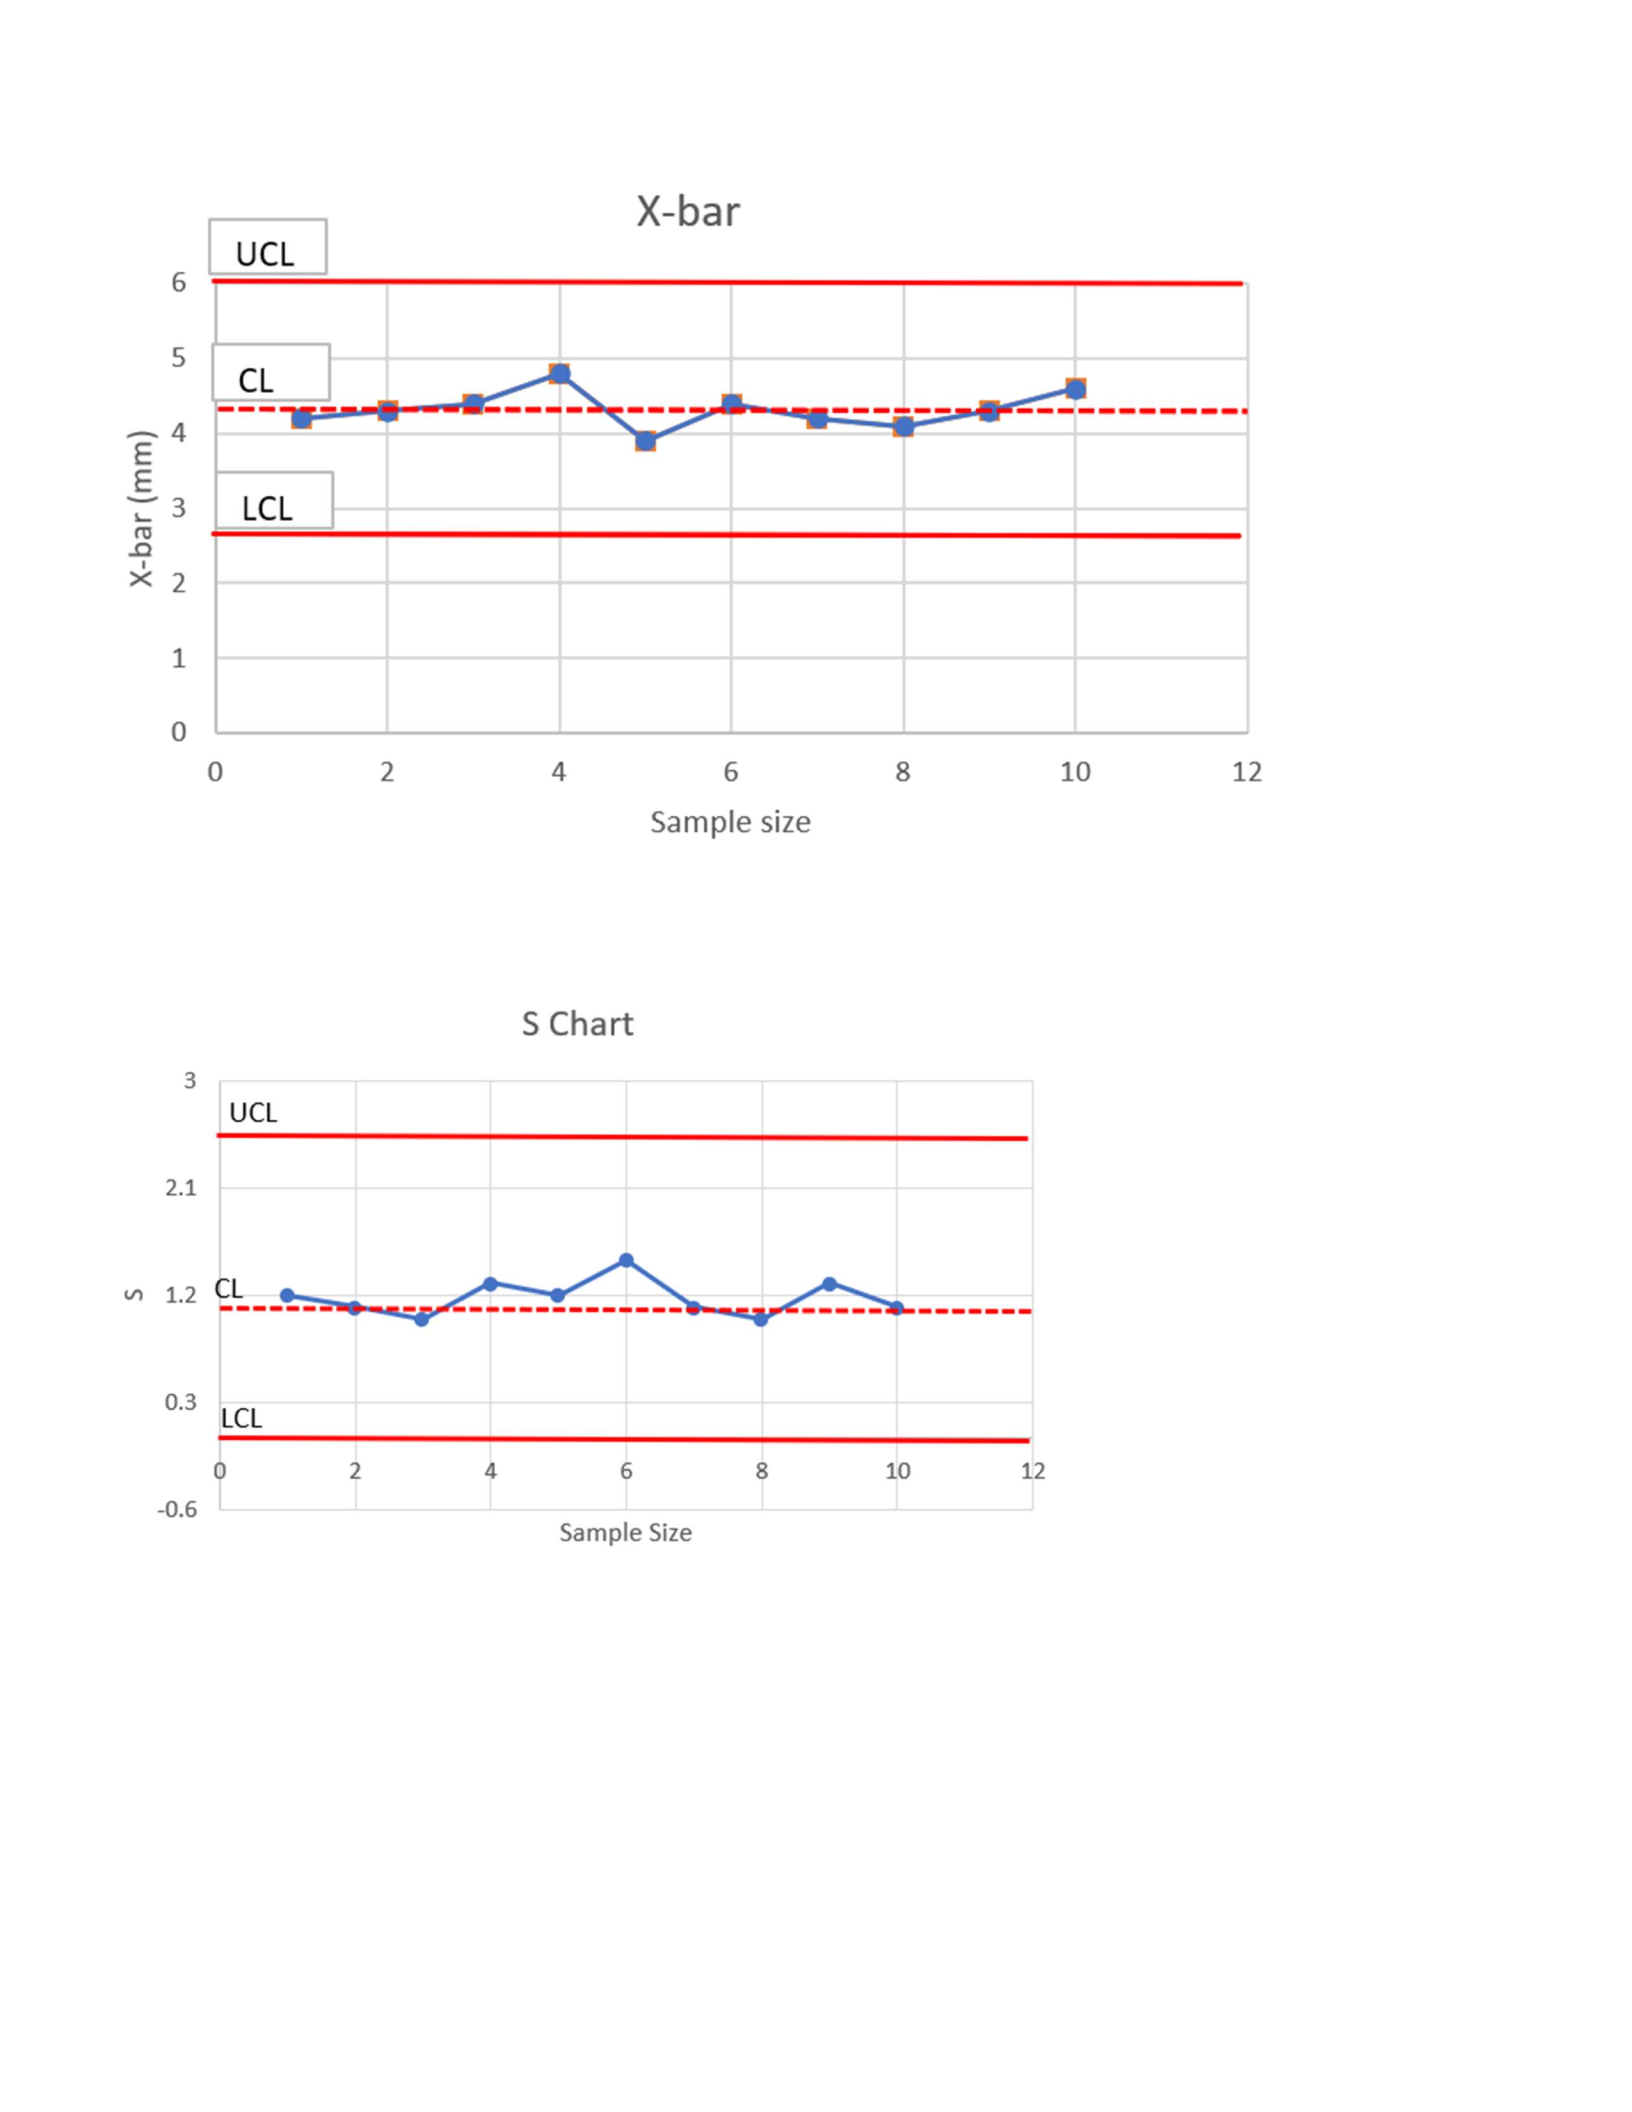
a) Create the control charts for X-Bar and S. Is the data in control?
2
3
It is in control

4
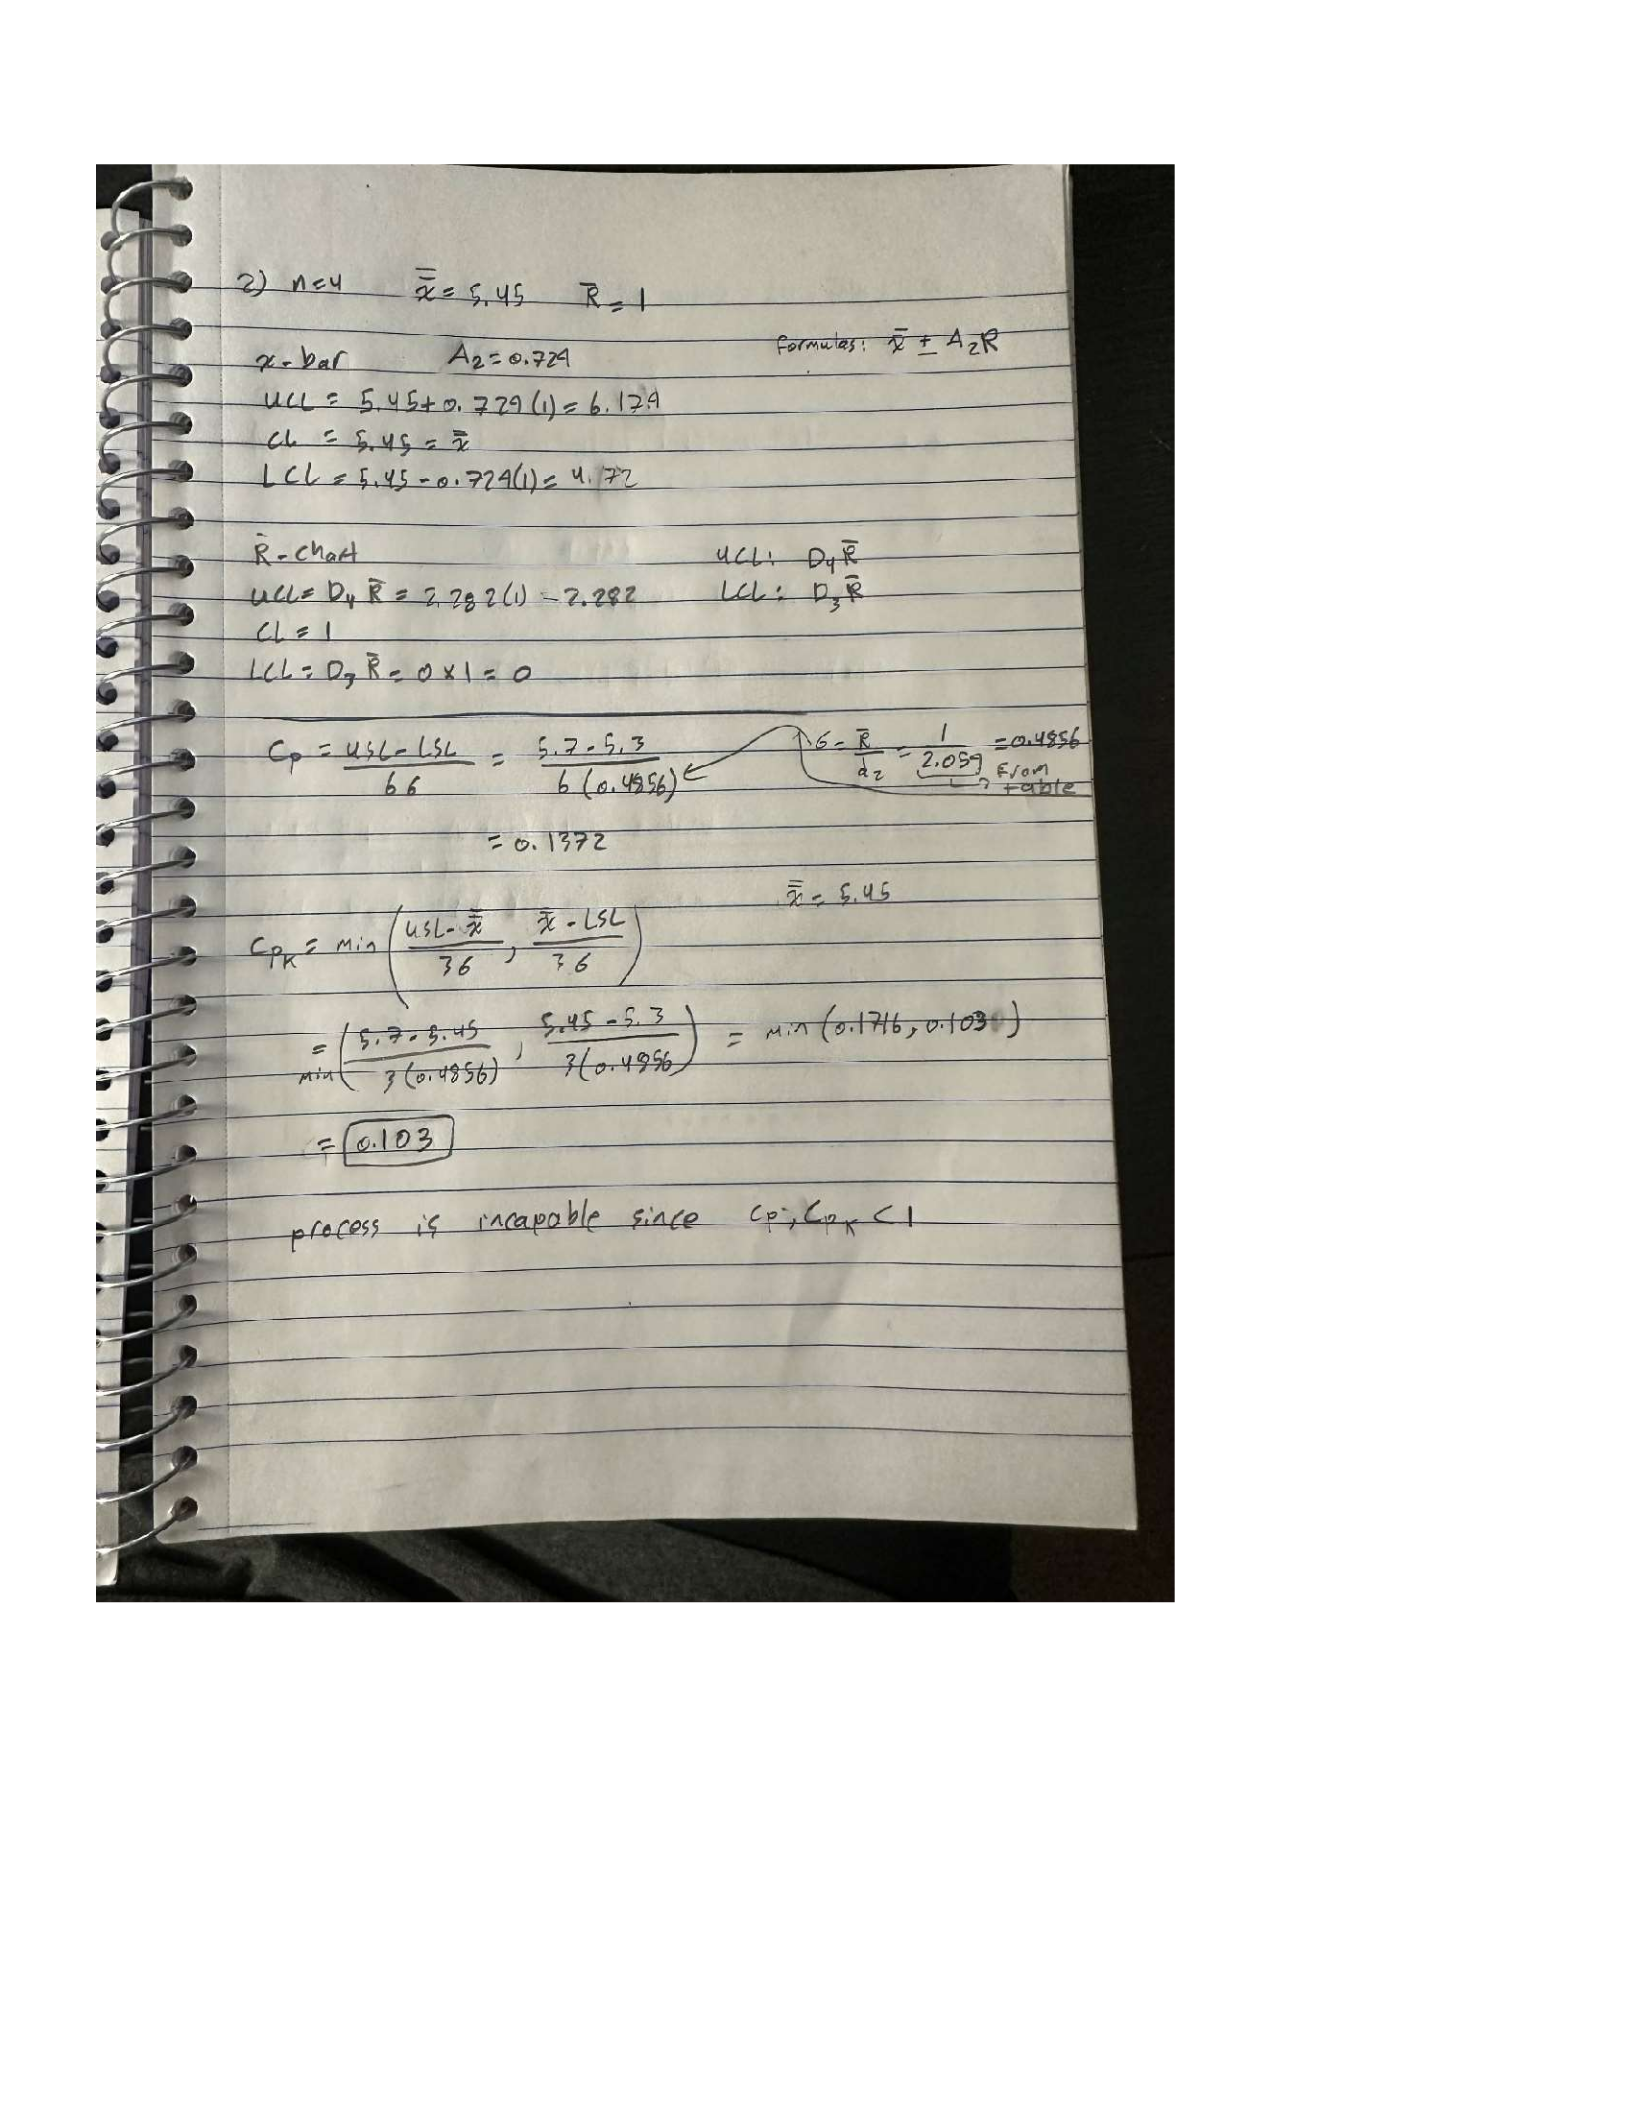
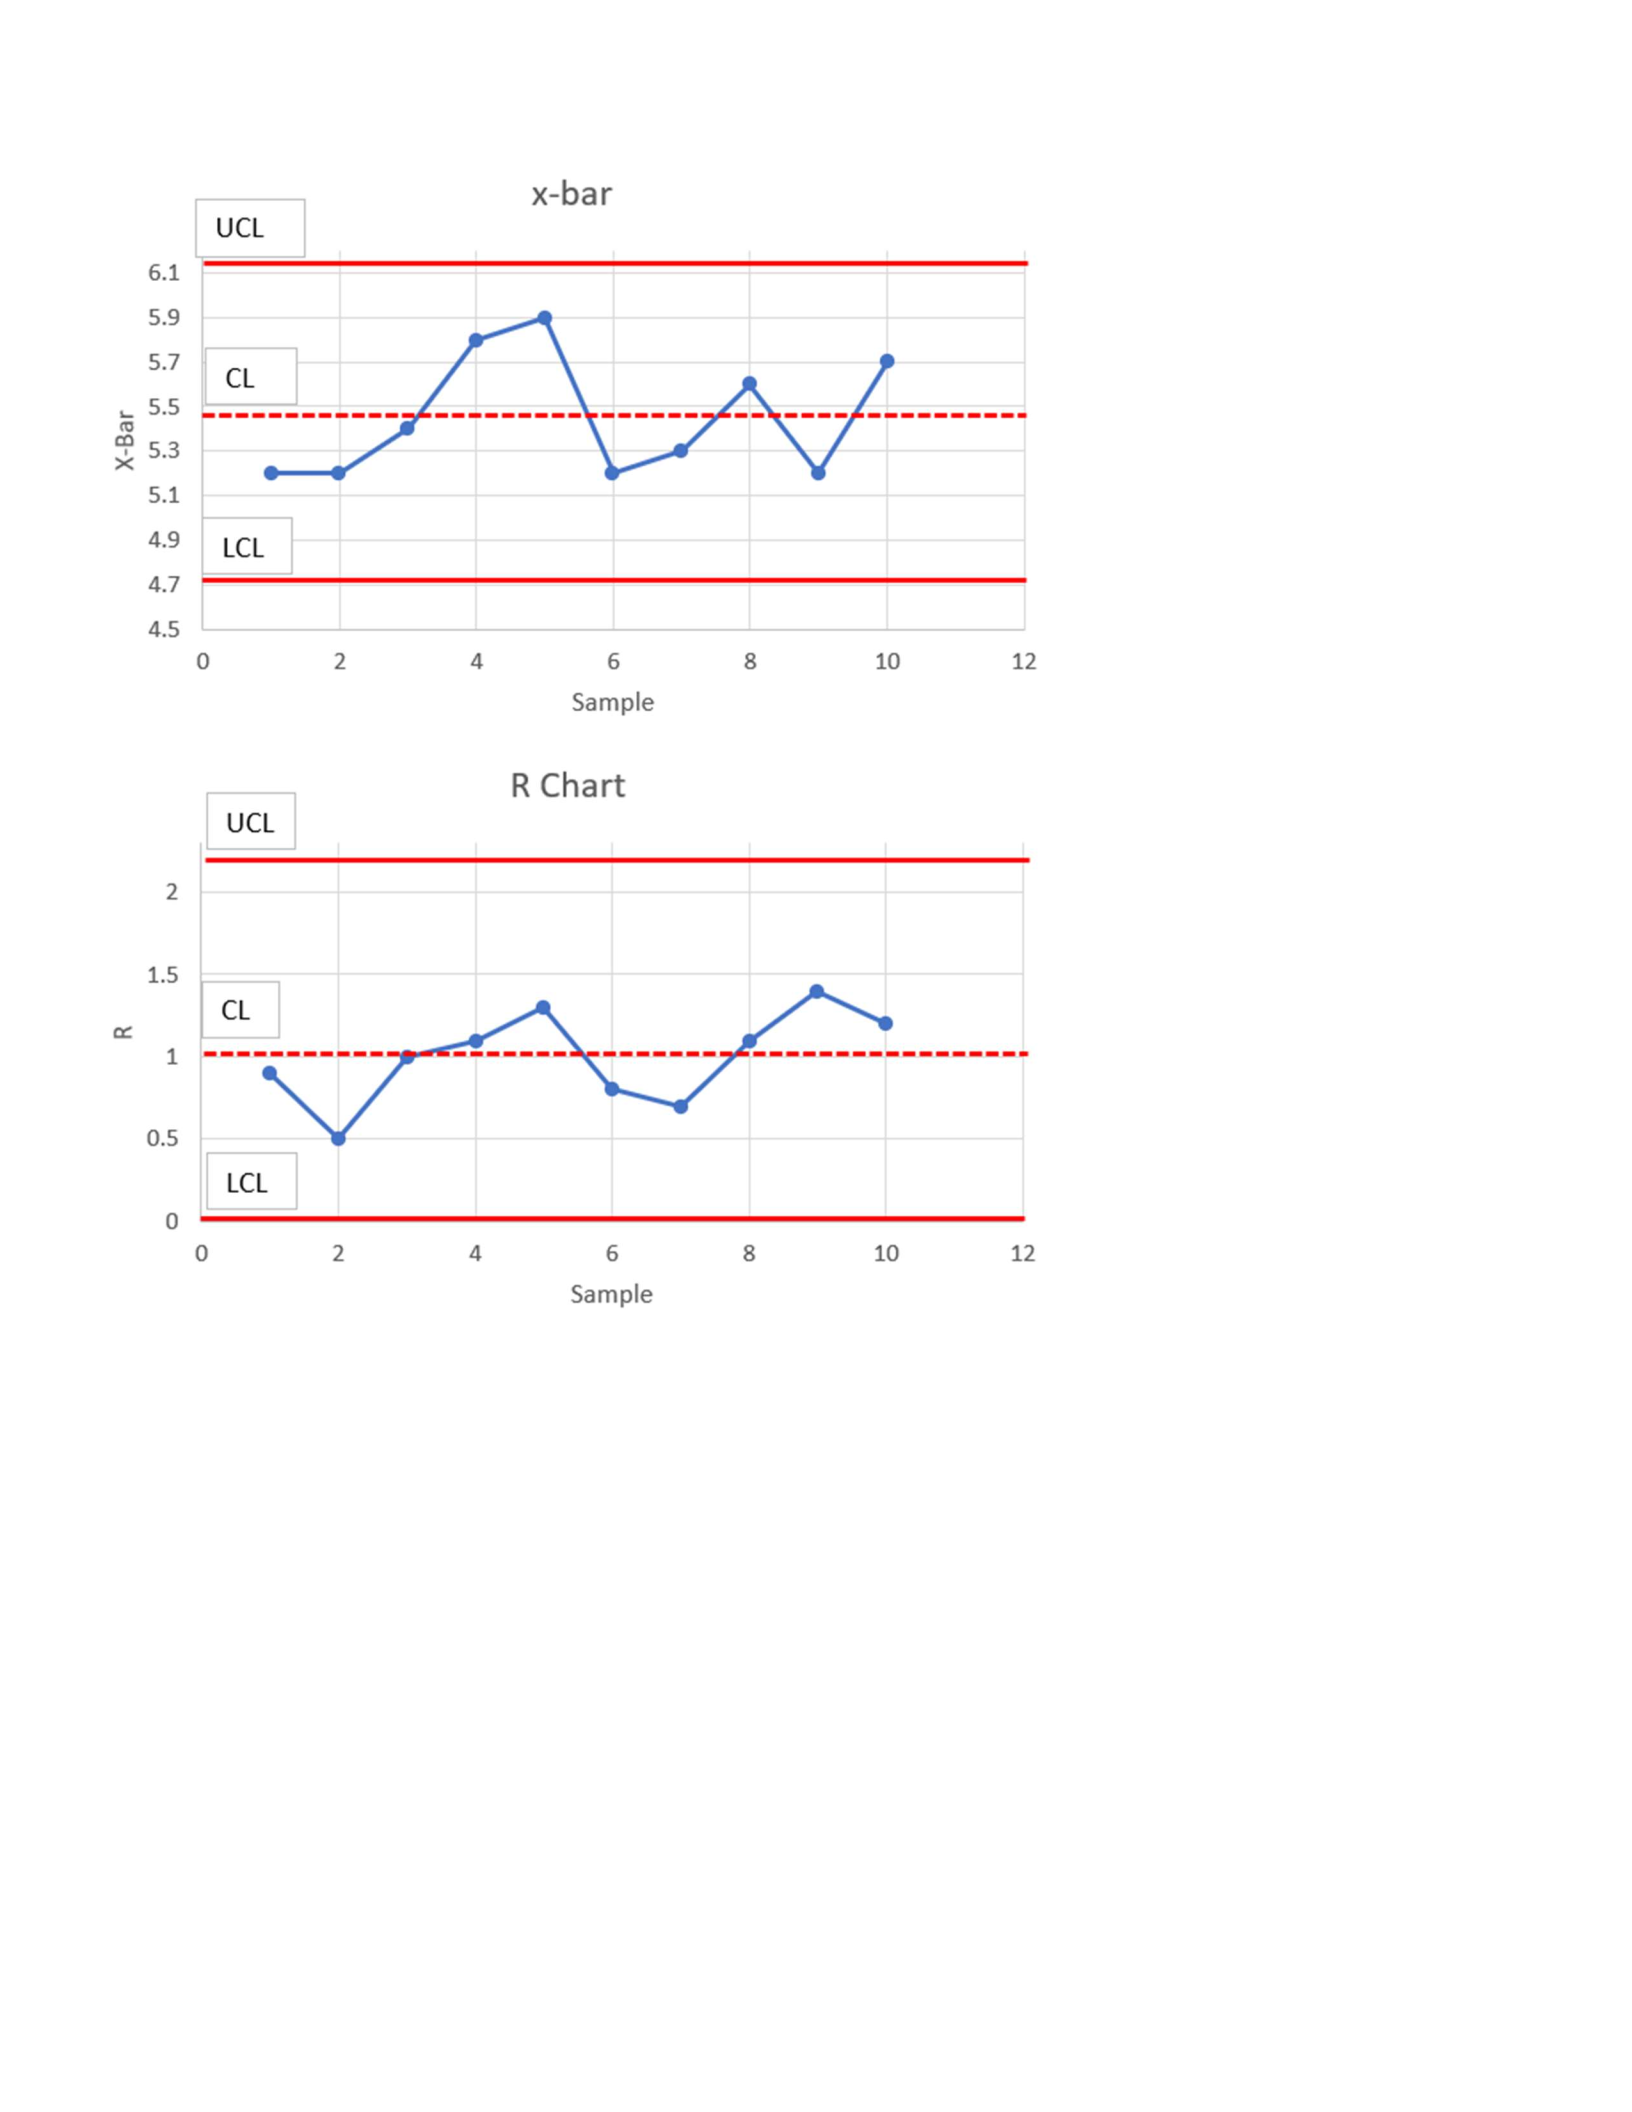
2. For the following data create X-bar and R charts. The sample size is 4. Is the data in control? If
the specs are set at LSL=5.3 and USL=5.7, is this process capable? Calculate both Cp and Cpk.
sample x-bar R
1
5.2
0.9
2
5.2
0.5
3
5.4
1
4
5.8
1.1
5
5.9
1.3
6
5.2
0.8
7
5.3
0.7
8
5.6
1.1
9
5.2
1.4
10
5.7
1.2
5
6
In control

7
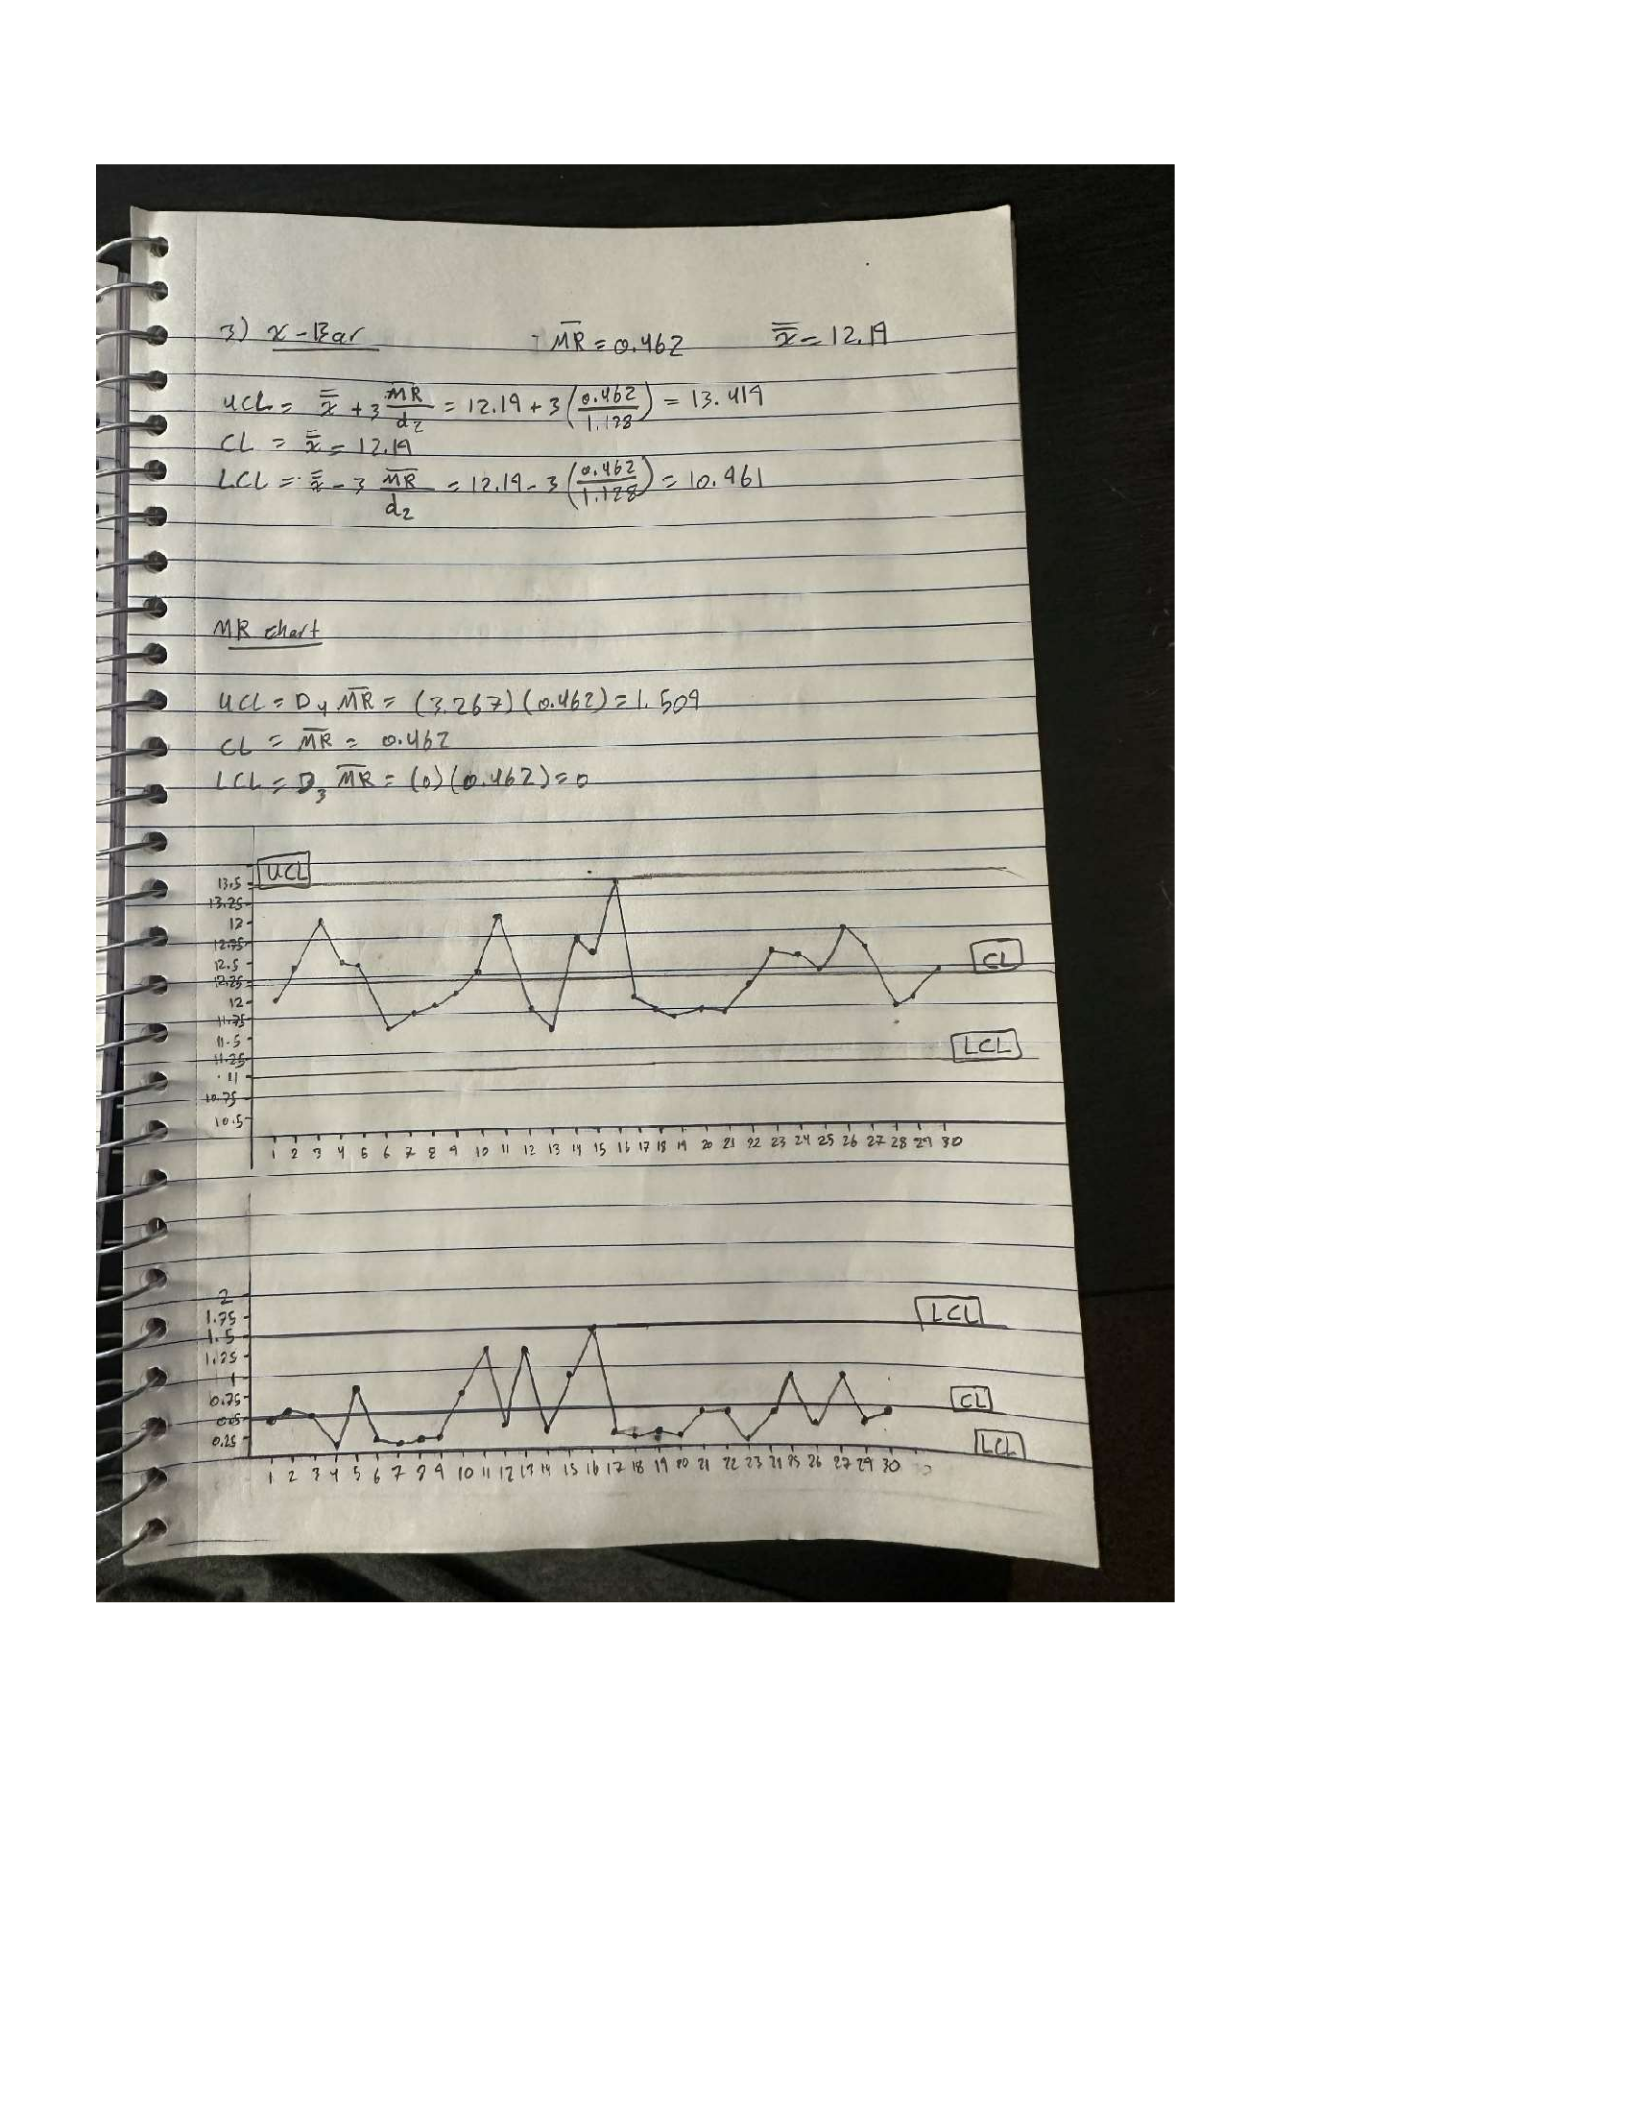
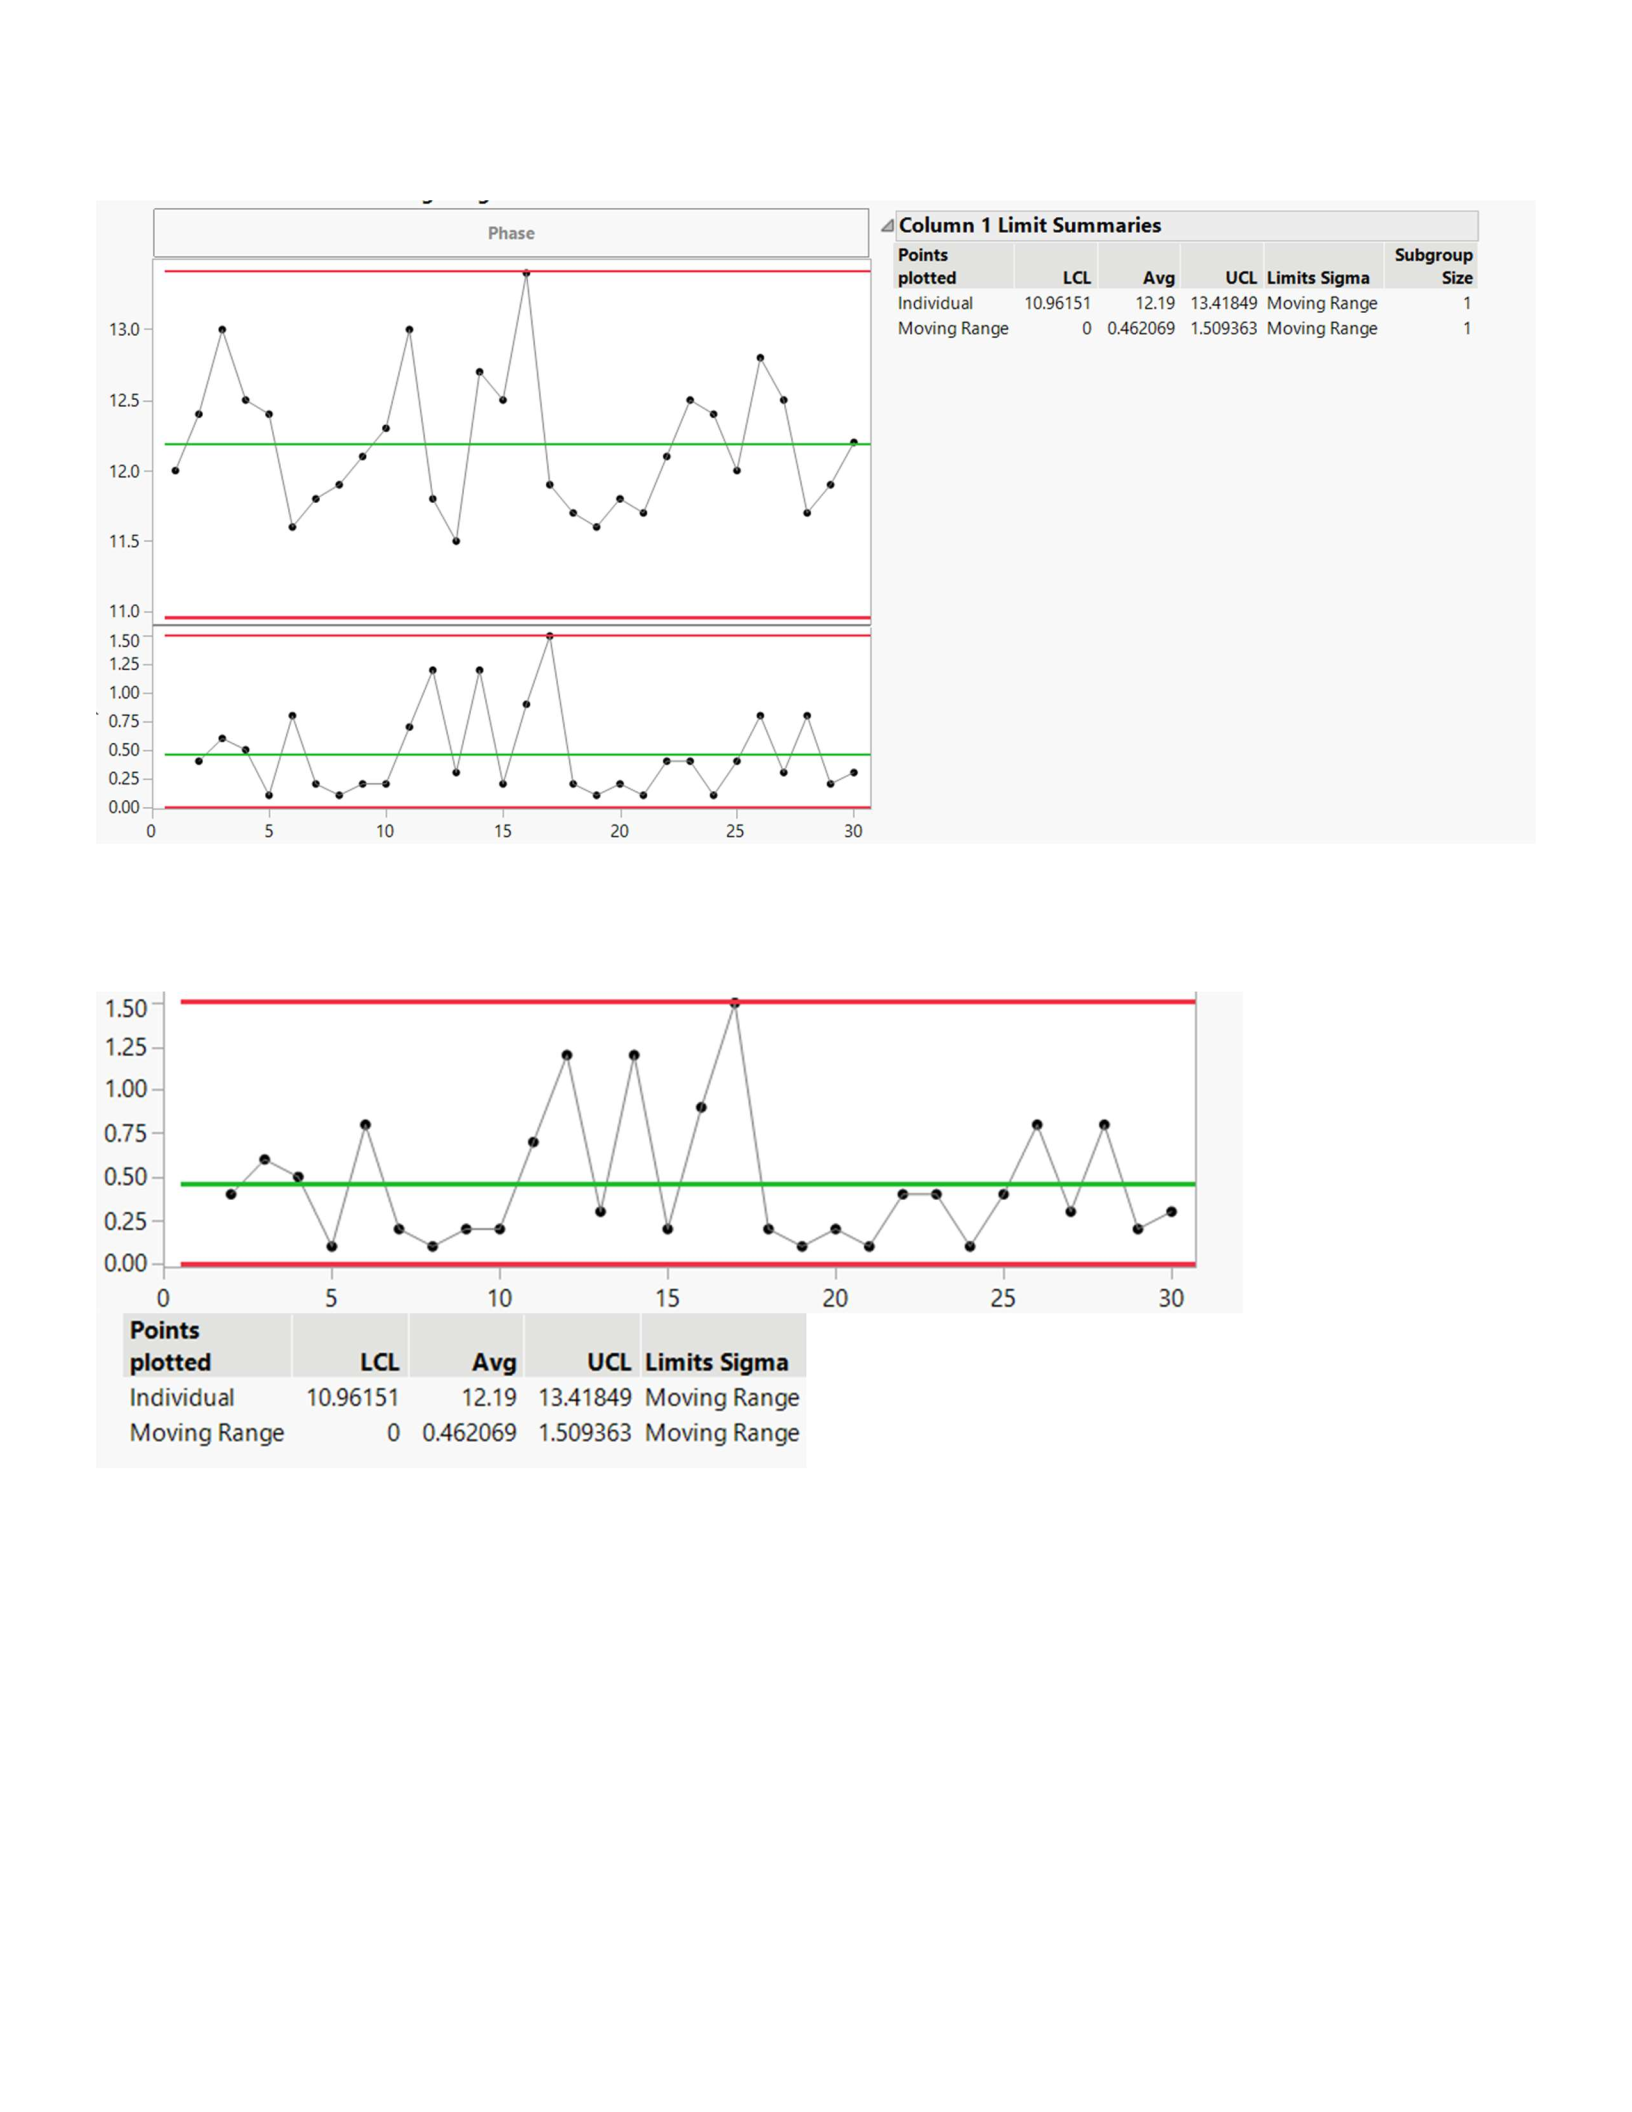
3. For the following data, please construct and X-Bar and MR chart (do this by hand and also in
JMP).
12
12.4
13
12.5
12.4
11.6
11.8
11.9
12.1
12.3
13
11.8
11.5
12.7
12.5
13.4
11.9
11.7
11.6
11.8
11.7
12.1
12.5
12.4
12
12.8
12.5
11.7
11.9
12.2
8
9
X- BAR Chart
MR CHART
10
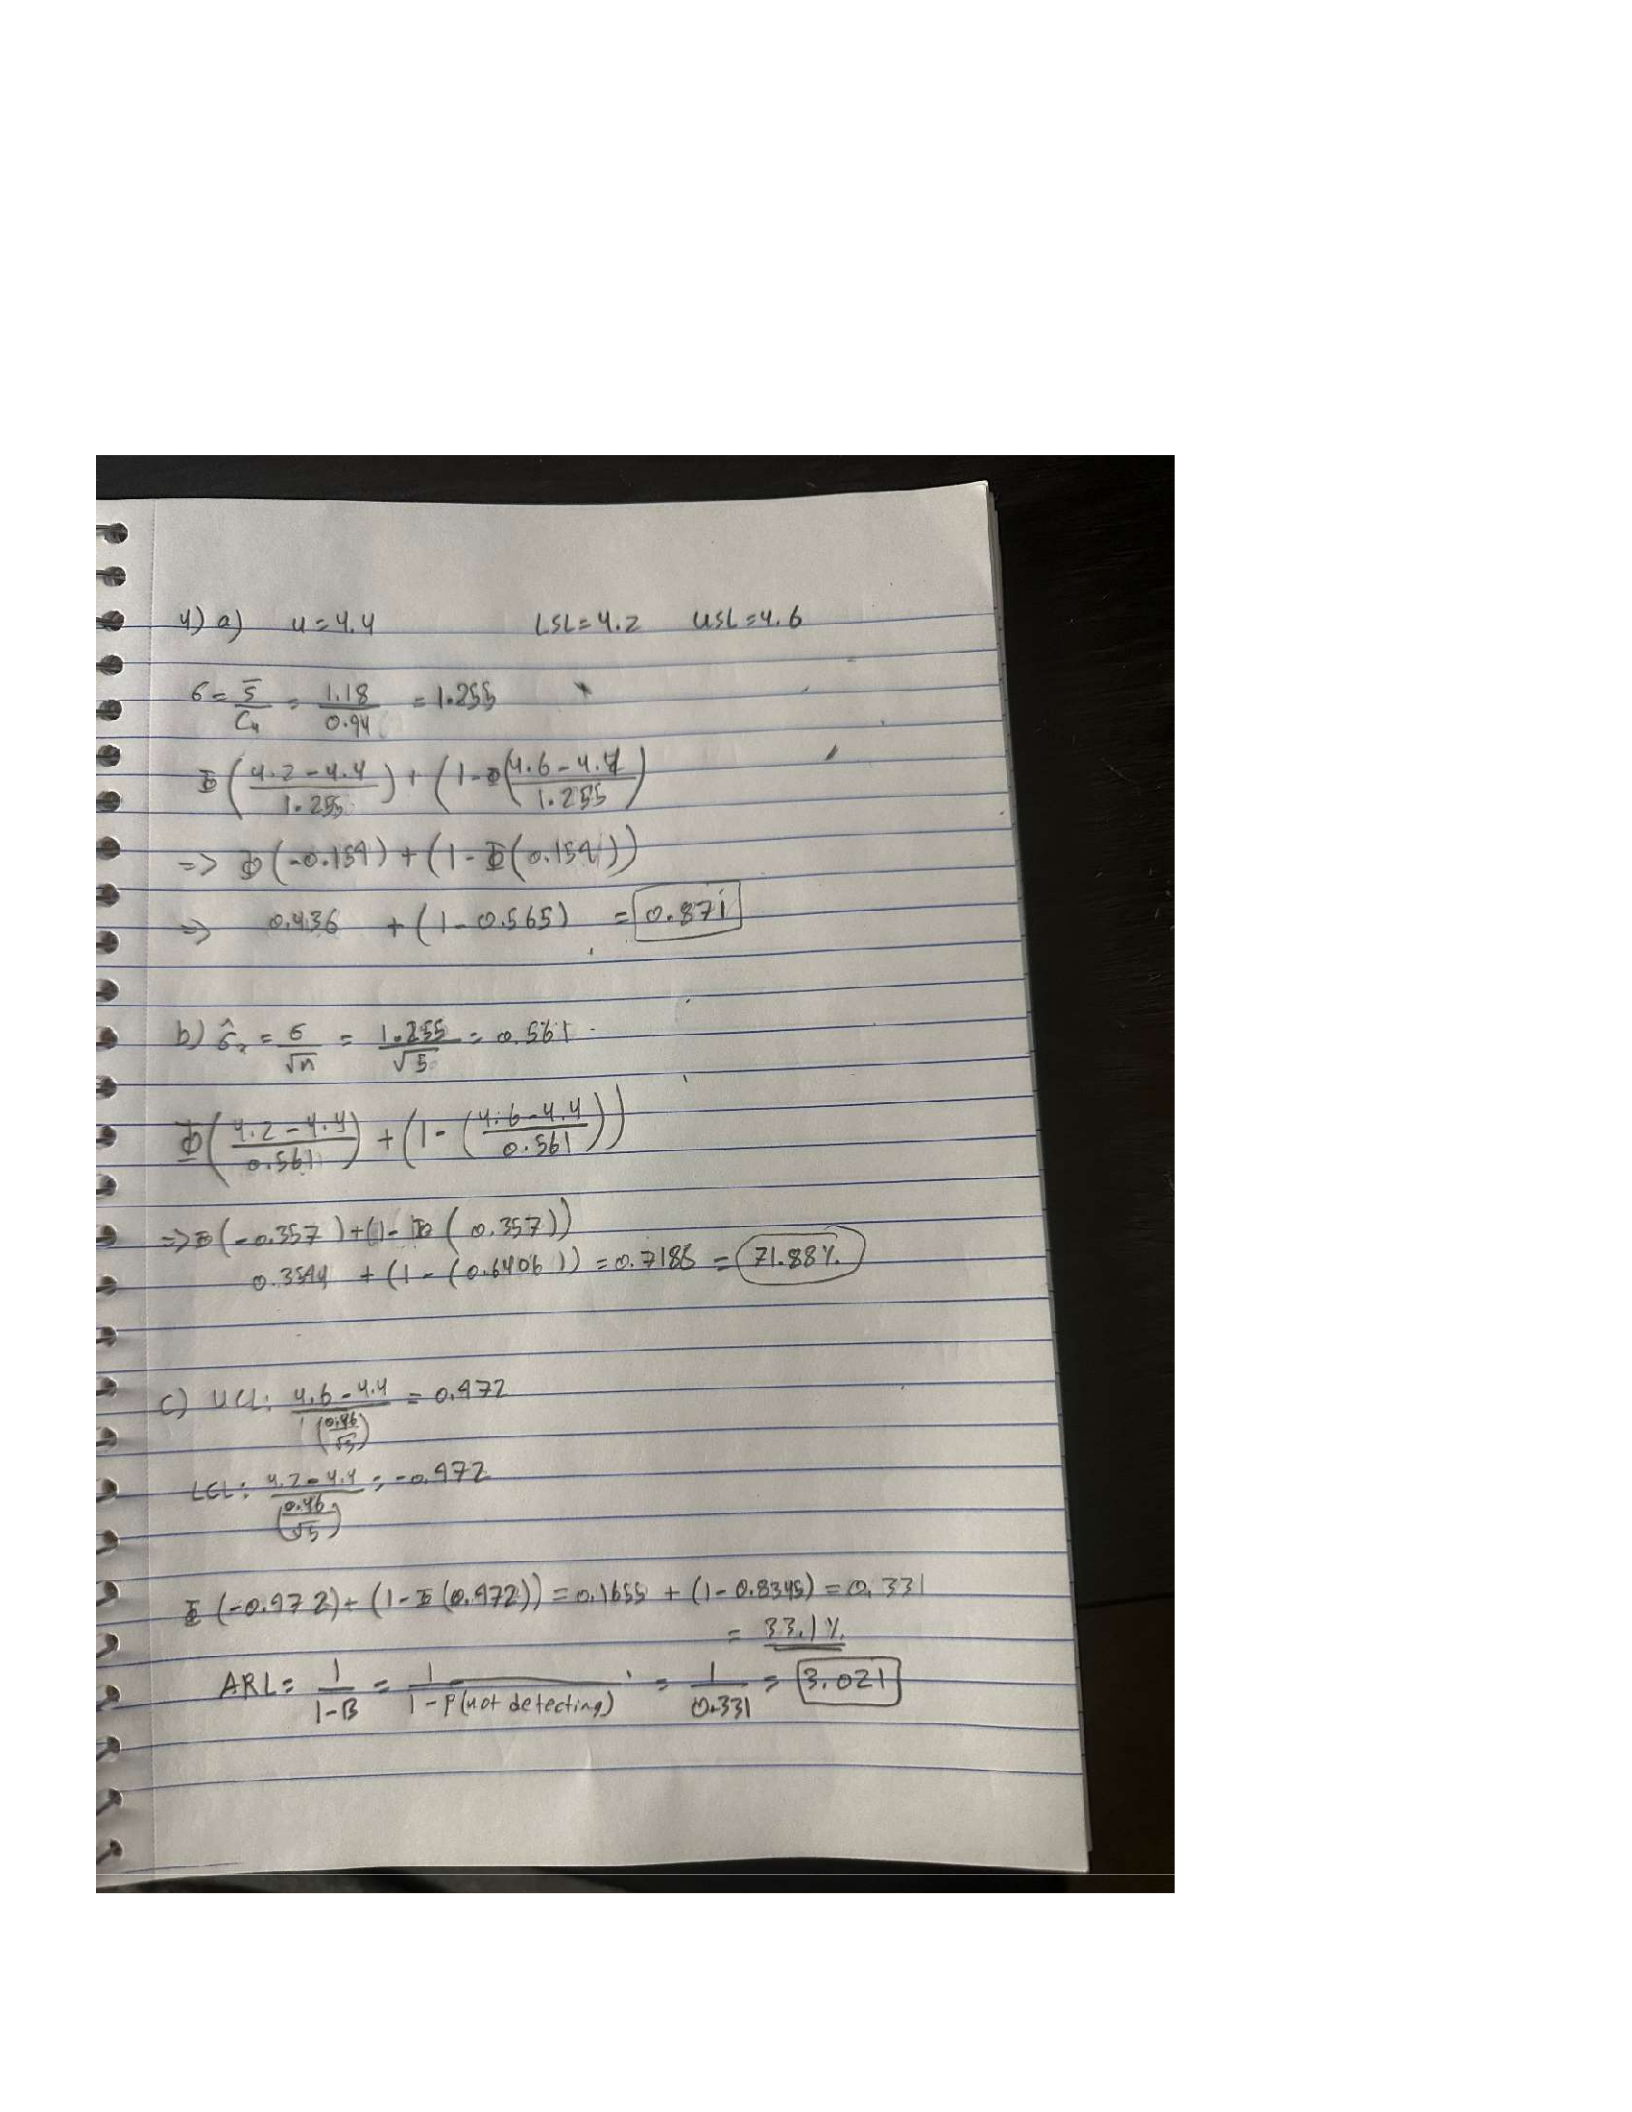
4. For the data in Question 1, if the specs are LSL=4.2 and USL is 4.6, what is the fraction non-
conforming?
b) For the x-bar chart, find the probability of a type I error, assuming that sigma is constant (this is
outside the control limits).
c) Suppose you find that the Probability of detecting a shift is .46. What is the average run length
until you would detect a shift?

