


1
ENGE 312-001 2020 DSP Exam 2
Name: Total 150 points
Maximum
Achieved
Problem 1
Problem 2
Problem 3
Problem 4
Problem 5
30
25
35
30
30
Total
150
1.
Please write the answer on separate papers with all the relevant works you need to show for
full credit.
2.
It is your responsibility to present the procedures leading to the answers and the final answers
clearly and neatly so that the grader can follow the flows of reasoning without any difficulty. If
the grader cannot read your work, you will get no credit for the work.
3.
The work and answers presented by you for this exam should be your own. If it is found that a
student copied other student’s solutions, those involved students will get F automatically.
4.
When you have completed the examination, sign the pledge below.
I have neither given nor received any aid form any person other than the course instructor while
working on this examination.
2
1.
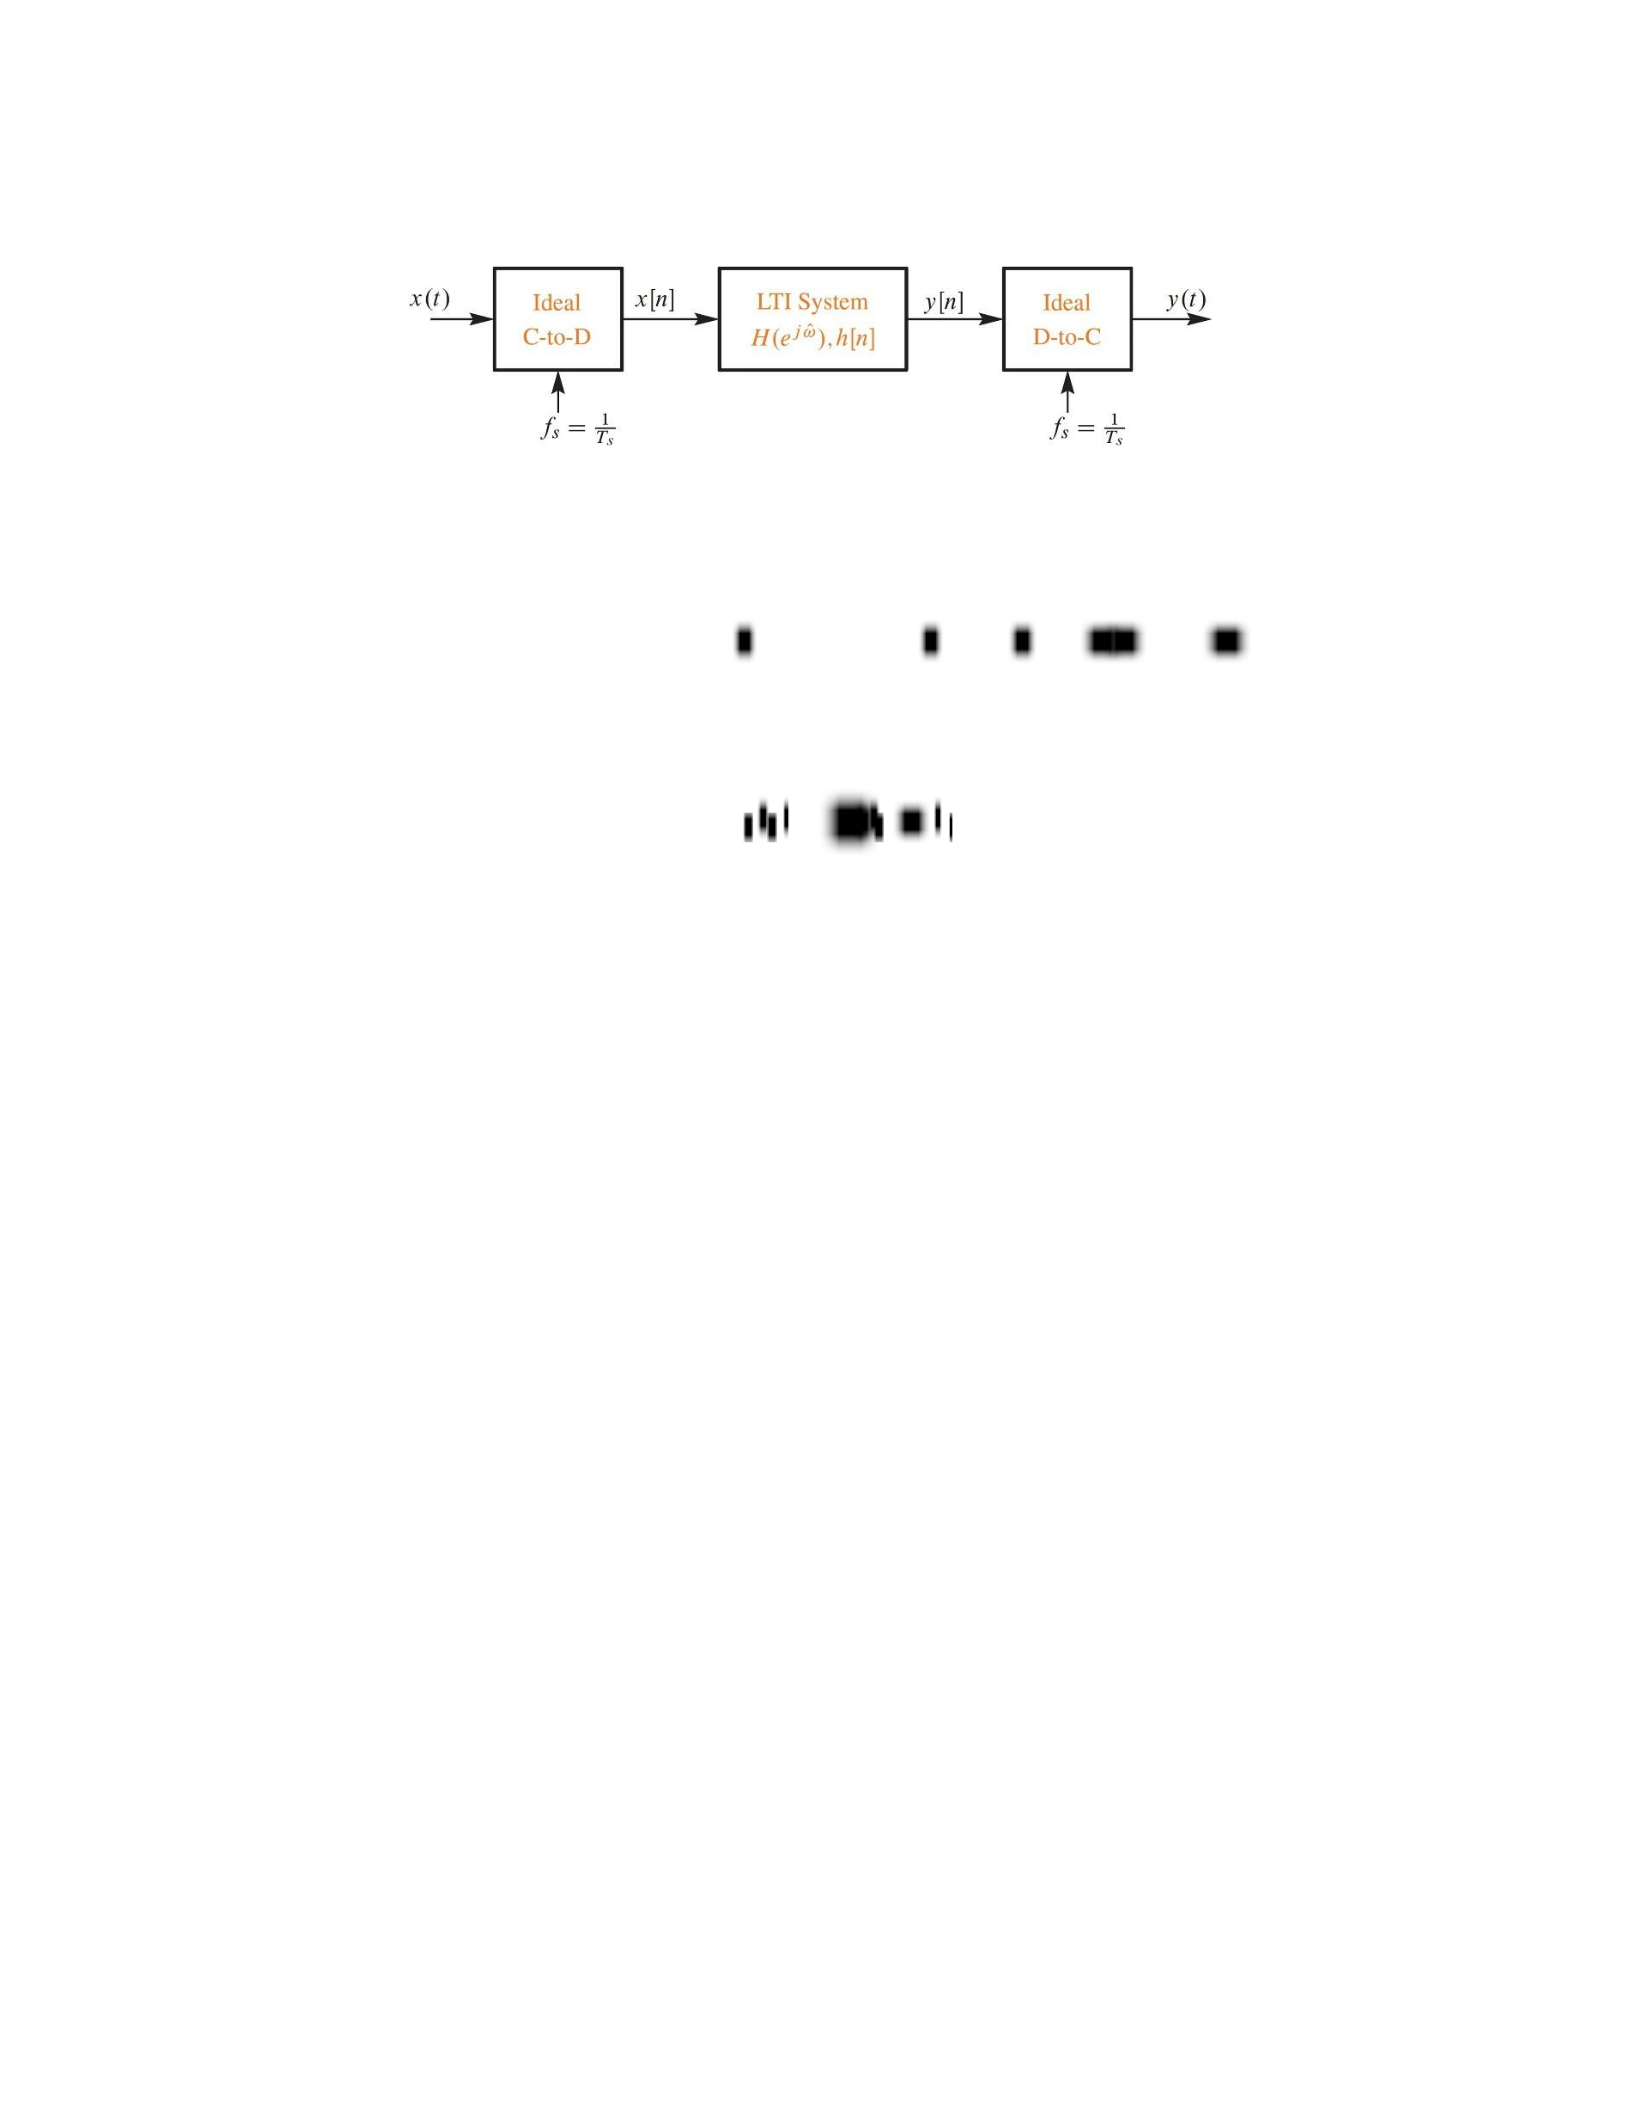
[30 points] A system for filtering continuous-time signals is shown in the figure below.
Figure 1: ADC & DAC with a Digital FIR Filter
The input to the C-to-D converter in this system is
x
(
t
)
=
7
+
8 cos
(
1000
t
)
+
9 cos
(
1600
t
+
0.7
)
f
or
<
t
<
The impulse response of the FIR LTI system is
4
h
n
=
n
k
k
=
0
If
𝑓𝑓
𝑠
=
4000
samples/sec,
find
the
following:
1)
[15 points] Obtain a closed-form expression for the frequency response of the FIR LTI
system.
2)
[15 points] Determine the expression for the output 𝑦(𝑡) for the input signal 𝑥(𝑡) = 7 +
8𝑐𝑜𝑠(1000𝜋𝑡) + 9𝑐𝑜𝑠(1600𝜋𝑡 + 0.7𝜋) for −∞ < 𝑡 < ∞.

3
2.
[25 points] ] <Sampling>
Figure 2: ADC with an FIR Filter
Consider a simple analog signal 𝑥(𝑡) = 𝑐𝑜𝑠(2𝜋800𝑡). The FIR lowpass filter has a passband
extending from 0 to 400 Hz (Do not forget the FIR filter is a digital system. You should be able to
relate analog frequency to digital frequency), a passband gain of unity, a transition bandwidth of
20 Hz, and a stopband attenuation 60 dB.
1)
[10 points] Draw the spectral magnitude of 𝑥[𝑛] showing all spectral components in the
range
of
−2
𝑓𝑓
𝑠
to
2
𝑓𝑓
𝑠
.
2)
[10 points] Draw the spectral magnitude of 𝑦[𝑛] showing all spectral components in the
range
of
−2
𝑓𝑓
𝑠
to
2
𝑓𝑓
𝑠
.
3)
[5 points] Determine the time-domain peak amplitude of the sinusoidal y[n] output.

4
x n
3.
[35 points] Reverberation, a kind of echo, is a popular audio effect applied to guitar music. In the
world of continuous-time signals, reverberation is implemented with an analog delay line as
shown in Figure 3 (a). Analog reverberation units, however, have no convenient way to control
the amount of time delay, and unfortunately, their hardware is physically large. Making use of
digital signal processing on the other hand, the process of reverberation seems easy to implement
using a delay line network like that shown Figure 3 (b). For the digital reverberation process to be
usable, however, it must have a constant gain, where
Gain
=
y
n
=
cons
t
an
t
over the full operating frequency range of the system. That is, we want our reverberator to have
a flat frequency magnitude response. By “Gain” we mean the steady-state gain after the delay
line is filled with input samples.
1)
[10 points] Assume we have the Figure (b) delay line with N=8 delay elements. What is
the N=8 digital reverberator’s h[n] time-domain impulse response?
2)
[15
points]
What
is
the
equation
for
the
digital
reverberator’s
�
H
�
𝑒
𝑗𝑗𝜔
�
�
frequency
magnitude response?
3)
[10
points]
Plot
the
�
H
�
𝑒
𝑗𝑗
𝜔
�
�
frequency
magnitude
response
from
what
you
found
in
2)
vs
digital frequency ω using MATLAB. Put title ‘The Frequency Magnitude Response of a
Digital
Reverberator,’
‘Frequency
ω
[radians/sample]’
on
x-axis,
and
�
H
�
𝑒
𝑗𝑗𝜔
�
�
on
y-axis
of
your plot. Using MATLAB publish function. You have to include your MATLAB code and
the plot.
Figure 3 (a) Analog Reverberator
Figure 3 (b) Digital Reverberator

5
4.
[30 points] ] Design an FIR filter satisfying the following specification using windowing method
(use all the windows that satisfy the given specification; if there are two windows that satisfy
the given specification, design the filter using the two windows, meaning you have two designed
filters):
Write a MATLAB code to design the filter. Attach the MATLAB code you wrote along with the
magnitude and phase response of the frequency response function(s) of the designed filter (filters)
showing the validity of the filter/filters (use publish function in MATLAB). Although you designed
a digital filter, show the frequency response vs Hz plots for your figure.
Passband edge frequency: 2 kHz
Transition width: 0.8 kHz
Stopband attenuation > 60 dB
Sampling frequency: 10 kHz

6
5.
[30 points] Design an FIR filter satisfying the following specification using PM algorithm (optimal
filter design):
Write a MATLAB code to design the filter. Attach the MATLAB code you wrote along with the
magnitude and phase response of the frequency response function(s) of the designed filter (filters)
showing the validity of the filter/filters (use publish function in MATLAB). Although you designed
.a digital filter, show the frequency response vs Hz plots for your figure.
Passband: 200 – 300 Hz
Transition width: 45 Hz
Passband ripple: 0.1 dB
Stopband attenuation > 60 dB
Sampling frequency: 1 kHz

