


Running head: SPSS GROUP 2 WRITE-UP 1
GROUP 2 WRITE-UP: SPSS Worksheet 3
by
Lawrence M. Johnson
Liberty University
Partial Fulfillment
Of the Requirements for EDUC 812
Liberty University
2019

SPSS GROUP 2 WRITE-UP 2
Findings
Research Question
The research question for this study was:
RQ1: Is there a difference in the amount of time father play with their children with no
disability, a physical disability, or an intellectual disability?
RQ2: Is there a difference in the amount of time father play with their children male or
female children?
RQ3: Is there a significant interaction between children with different disabilities, the
gender of the child, and the amount of time a father plays with their children?
Null Hypothesis
This study is a two-way ANOVA looks, therefore, three null hypotheses were examined.
H01: There is no significant difference among the amount of time fathers play with their
children with no disability, a physical disability, or an intellectual disability.
H02: There is no significant difference between the amounts of time fathers play with
their male or female children.
H03: There is no significant interaction among the amount of time fathers play with their
male or female children with no disability, a physical disability, or an intellectual disability.
Descriptive Statistics
Data was obtained by a Two-Way ANOVA for the dependent variable play-time for
fathers who have male and female children who are typically developing or who have a physical
or intellectual disability. The data indicated that male that are typically developing mean value
for the amount of time a father plays with the child was 7.30 and the standard deviation was
1.829. Male children with a physical disability showed a mean time of play value of 3.00 with a
standard deviation of 1.563, and male children with a mental disability displayed a mean time of
play value of 3.22 and a standard deviation of 1.716. Female children who are typically

SPSS GROUP 2 WRITE-UP 3
developing showed a mean time for play of 6.80 and a standard deviation of 2.201. Females with
a physical disability showed a mean time of play with fathers of 3.40 and a standard deviation of
1.897, and females with a mental disability mean for play was 4.00 with a standard deviation of
1.612. The data including the number of participant, the mean, Standard deviation, and the
Standard Deviation Mean of each group can be found in Table 1.
Table1.
Descriptive Statistics
Group Gender M SD N
Typically Developing Male 7.30 1.829 10
Female 6.80 2.201 10
Total 7.05 1.986 20
Physical Disability
Male 3.00 1.563 10
Female 3.40 1.897 10
Total 3.20 1.704 20
Mental Retardation
Male 3.22 1.716 9
Female 4.00 1.612 11
Total 3.65 1.663 20
Total
Male 4.55 2.613 29
Female 4.71 2.369 31
Total 4.63 2.470 60
Results
Data screening
Data screening was conducted the dependent variable of play-time with a father between
the independent variable of disability (typically developing, physical disability, intellectual
disability), and the independent variable of gender (male, female). The preliminary data
screening was used to analyze for data errors and inconsistencies. No significant data errors or
inconsistencies were indentified; therefore, the use of a nonparametric test was not warranted.
SPSS GROUP 2 WRITE-UP 4
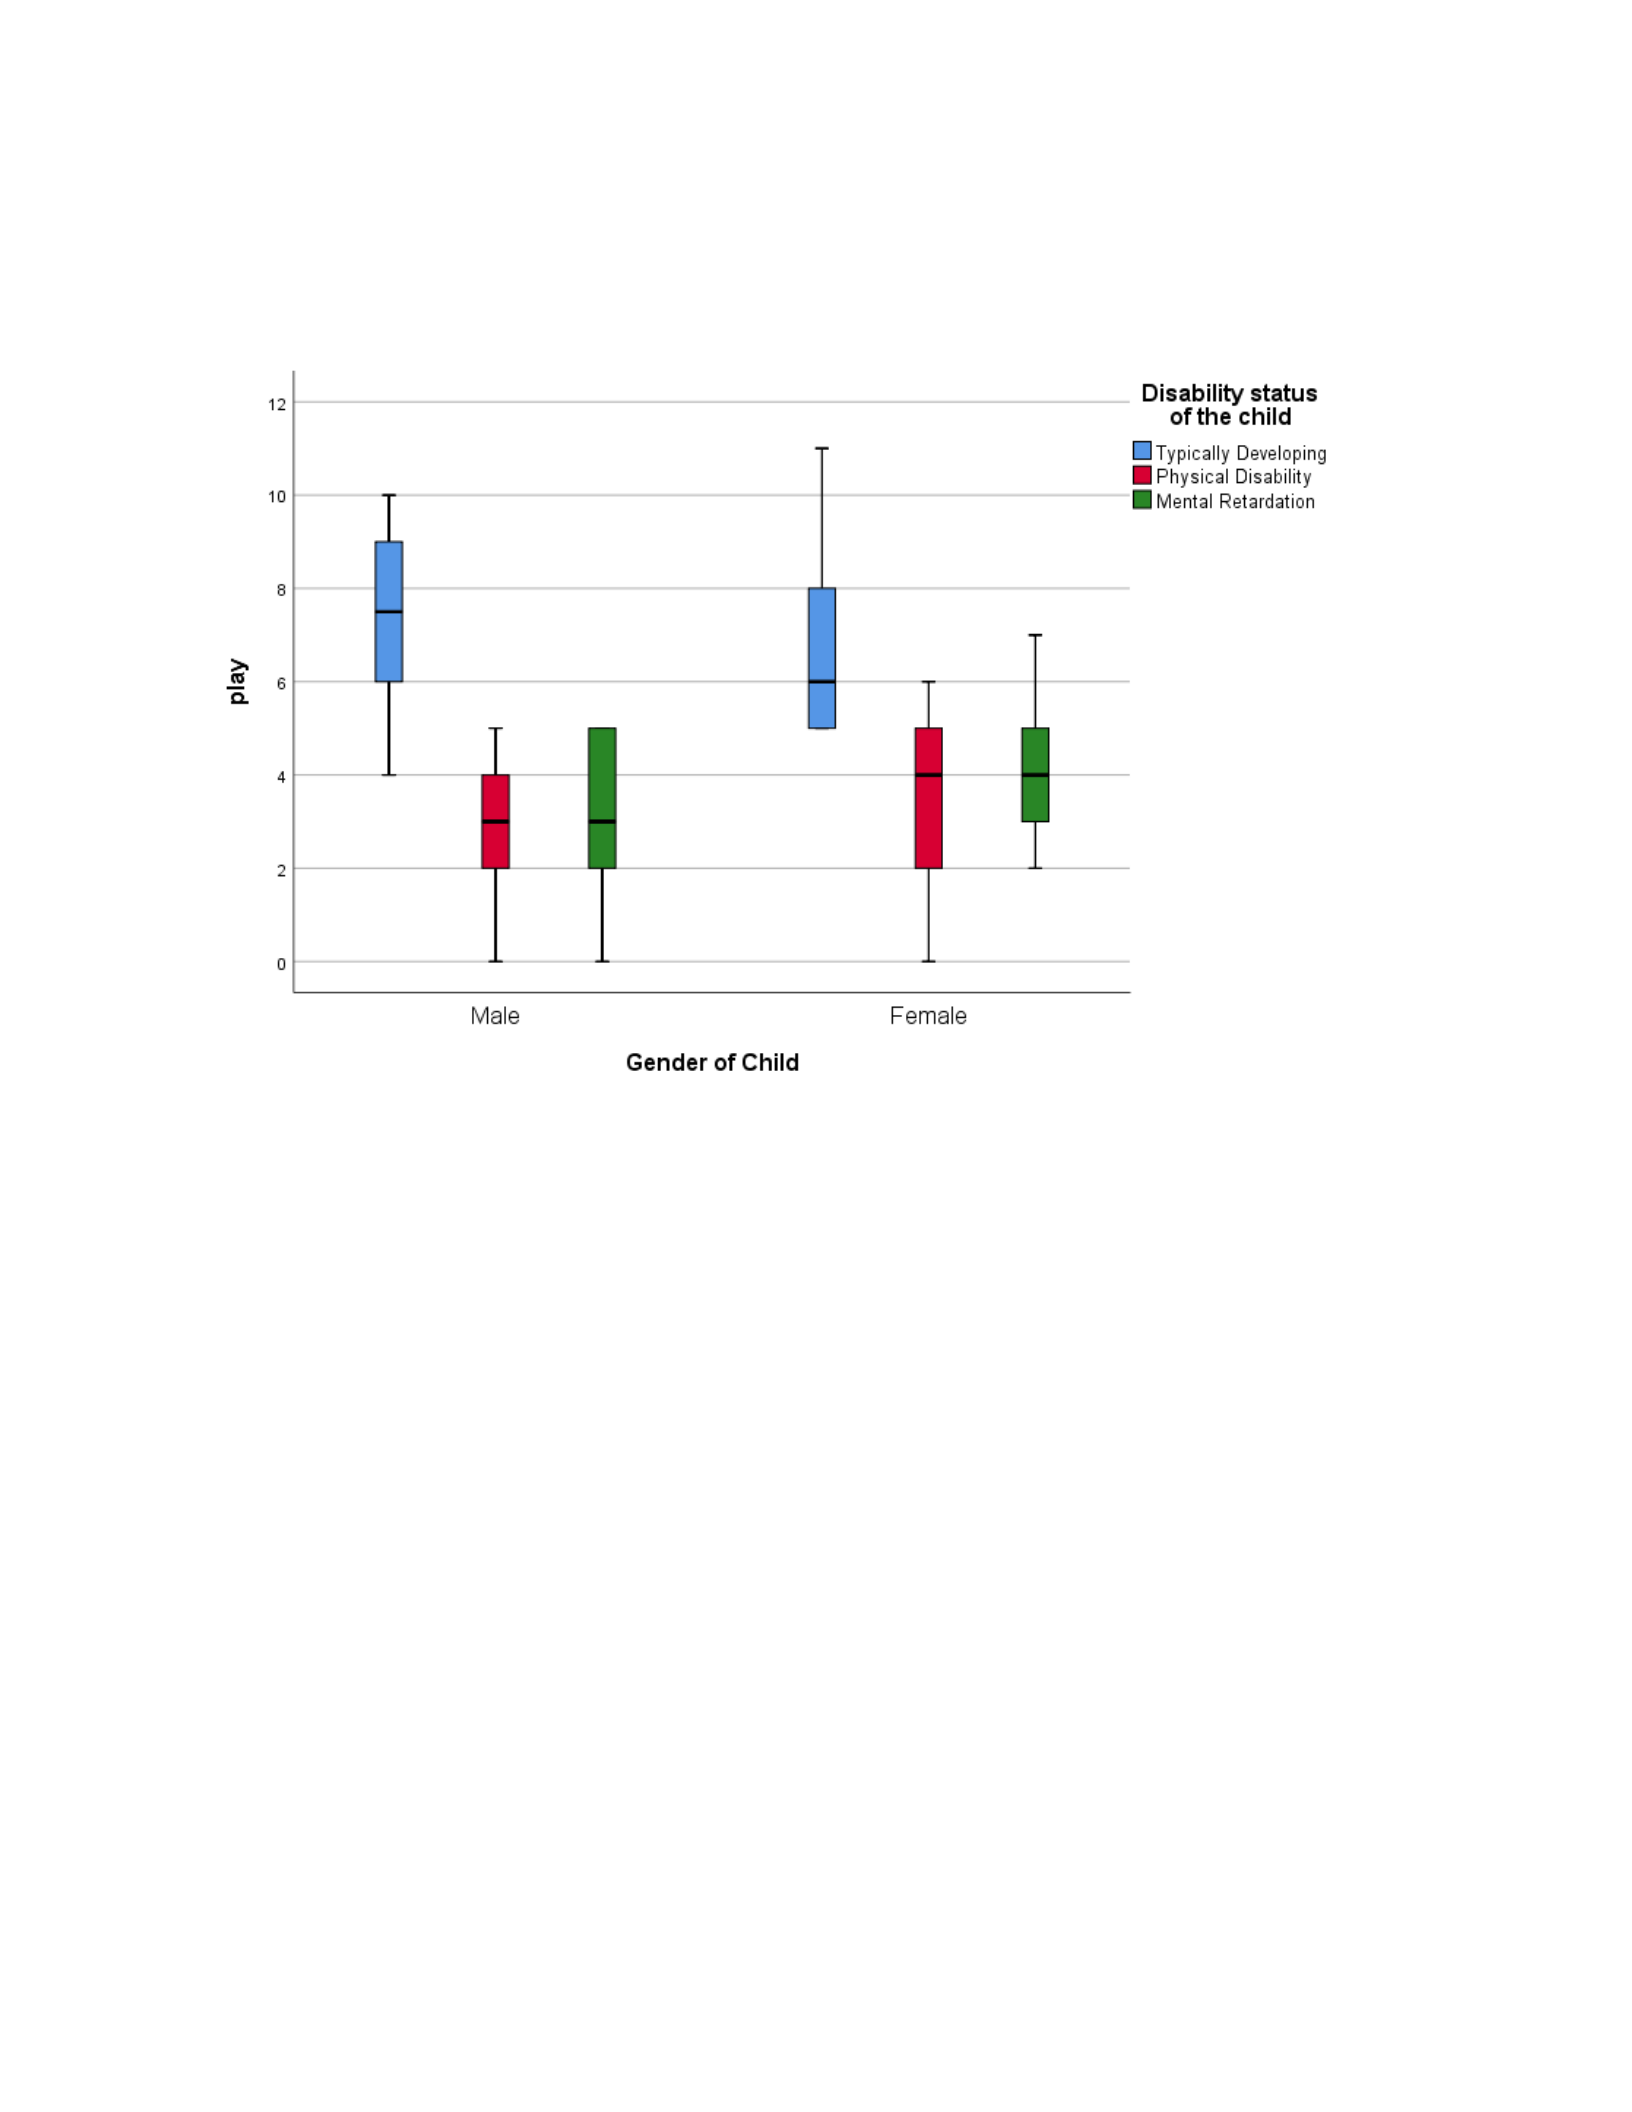
The Box and Whiskers Plots were use to indentify outliers an each dependent variable, and no
outliers were indentified. See Figure 1 Box and Whiskers Plot
Figure 1. Box and Whiskers Plot for the Distribution of Extroversion Among Hair Colors.
Assumptions
A two-way ANOVA was used to test the null hypotheses. The ANOVA required that the
assumption of normality and homogeneity are met. The Kolmogorov-Smirnov test was use to
examine normality due to the total sample size being more than 50 participants (N=60) (Warner,
2013). The p-value exceeds the standard p > .05; therefore, normality is assumed and therefore
met. See Table 2, 3, and 4 for Kolmogorov-Smirnov test.
SPSS GROUP 2 WRITE-UP 5
Table 2.
Test of Normality: Typically Developing
Tests of Normalitya
l
Gender of Child
Kolmogorov-SmirnovbShapiro-Wilk
Statistic df Sig. Statistic df Sig.
play Male .161 10 .200*.954 10 .713
Female .242 10 .100 .819 10 .025
*. This is a lower bound of the true significance.
a. Disability status of the child = Typically Developing
b. Lilliefors Significance Correction
Table 3.
Test of Normality: Physical Disability
Tests of Normalitya
Gender of Child
Kolmogorov-SmirnovbShapiro-Wilk
Statistic df Sig. Statistic df Sig.
play Male .161 10 .200*.933 10 .475
Female .224 10 .168 .942 10 .573
*. This is a lower bound of the true significance.
a. Disability status of the child = Physical Disability
b. Lilliefors Significance Correction
SPSS GROUP 2 WRITE-UP 6
Table 4.
Test of Normality: Mental Retardation
Tests of Normalitya
Gender of Child
Kolmogorov-SmirnovbShapiro-Wilk
Statistic df Sig. Statistic df Sig.
play Male .183 9 .200*.901 9 .255
Female .187 11 .200*.937 11 .480
*. This is a lower bound of the true significance.
a. Disability status of the child = Mental Retardation
b. Lilliefors Significance Correction
The assumption of homogeneity of variance was conducted using the Levene's test; F =
0.427, p = 0.828, this indicated no signification violations so the assumption of homogeneity was
met. See Table 5 for Levene's Test.
Table 5.
Levens's Test of Equality of Error Variance
Fdf1df2 Significance
0.427 5 54 0.828
Results of Null Hypothesis One
The researcher conducted the test between subject's effects (3x2 factorial ANOVA), to
test the null hypothesis; the amount of play-time between typically developing, physical
disability, and intellectual disability and their fathers. The researcher failed to reject the null
hypothesis at a 95% confidence level, F (2, 54), p = 0.001, and
η2=.0 501 .
The researcher
found the partial eta-squared to be 0.501, which correlates to a medium effective size. The

SPSS GROUP 2 WRITE-UP 7
significant value in the ANOVA test was determined to be greater than 0.05, therefore, no post
hoc analysis was conducted. See Table 6 Test Between-Subjects Effects
Table 6.
Test of Between-Subjects Effects
Source Type III
Sum of
Squares
df Mean
Square
F Sig. Partial Eta
Squared
Corrected
Model
182.
278a
5 36.456 11.081 0.000 0.506
Intercept 1276.571 1 1276.571 388.025 0.000 0.878
Disable 178.579 2 89.289 27.140 0.000 0.501
Gender 0.763 1 0.763 0.232 0.632 0.004
Disable*gender 4.294 2 2.147 0.653 0.525 0.024
Error 177.656 54 3.290
Total 1648.000 60
Corrected
Total
359.933 59
To detect where there were signification difference, the researcher conduct post hoc test.
The result of the test showed the significant were in the groups Typically Developing Physical
Disability (p = 0.001) Typically Developing Intellectual Disability (p = 0.001), Physical
Disability Typically Developing (p = 0.001) and Intellectual Disability Typically Developing (p
= 0.001). See Table 7 for Multiple Comparisons.

SPSS GROUP 2 WRITE-UP 8
Table 7
Multiple Comparisons
Multiple Comparisons
Dependent Variable: play
(I) Disability status of
the child
(J) Disability status of
the child
Mean
Difference
(I-J)
Std.
Error Sig.
95% Confidence Interval
Lower
Bound
Upper
Bound
Tukey
HSD
Typically Developing Physical Disability 3.85*.566 .000 2.49 5.21
Mental Retardation 3.40*.566 .000 2.04 4.76
Physical Disability Typically Developing -3.85*.566 .000 -5.21 -2.49
Mental Retardation -.45 .566 .708 -1.81 .91
Mental Retardation Typically Developing -3.40*.566 .000 -4.76 -2.04
Physical Disability .45 .566 .708 -.91 1.81
Dunnett
C
Typically Developing Physical Disability 3.85*.585 2.36 5.34
Mental Retardation 3.40*.579 1.93 4.87
Physical Disability Typically Developing -3.85*.585 -5.34 -2.36
Mental Retardation -.45 .532 -1.80 .90
Mental Retardation Typically Developing -3.40*.579 -4.87 -1.93
Physical Disability .45 .532 -.90 1.80
Based on observed means.
The error term is Mean Square(Error) = 3.205.
*. The mean difference is significant at the .05 level.
Results of Null Hypothesis Two
To test the second null hypothesis a 3 x 2 factorial ANOVA was also used. The test
indentified no significant differences between the father's play time with their male or female
children, F (1, 54) = 0.232, p = 0.632, η2 = 0.501. The researcher found the partial eta-squared to
be 0.004, which correlates to a small effective size. The researcher failed to reject null hypothesis
two at
α=0.05
. No post hoc testing was needed (see table 5).

SPSS GROUP 2 WRITE-UP 9
Results of Null Hypothesis three
To test the second null hypothesis a 3 x 2 factorial ANOVA was also used. The test
indentified no significant difference between the father's play times with their male or female
with no disability, a physical disability, or intellectual disability, F (2, 54) = 0.653, p = 0.525, η2
=0.024. The researcher found the partial eta-squared to be 0.024, which correlates to a small
effective size. We fail to reject the null hypothesis three at
α=0.05
. Therefore no post hoc
testing was needed (see Table 5)

SPSS GROUP 2 WRITE-UP 10
References
SPPS Incorporates. SPSS Grad. Pack (Stand.) Software (25).
Warner, R. M. (2013) Applied statistics: From bivariate through multivariate techniques (2nd
ed.). Thousand Oaks, CA: Sage Publications.

