Running head: GROUP #2 WRITE-UP #6 1
GROUP #2 WRITE-UP #6: MULTIPLE REGRESSION
by
Liberty University
Partial Fulfillment
Of the Requirements for EDUC 812
Liberty University
2019
GROUP #2 WRITE-UP #6 2
FINDINGS
Research Question
The research question for this study was:
RQ1: Is there a significant predictive relationship between the criterion variable (Stats
Exam Scores) and the linear combination of predictor variables (Math test, English test, English
GPA, Math GPA, and Other GPA) for college students?
Null Hypothesis
The null hypothesis for this study is:
H01: There will be no significant predictive relationship between the criterion variable
(Stats Exam Scores) and the linear combination of predictor variables (Math test, English test,
English GPA, Math GPA, and Other GPA) for college students.
Descriptive Statistics
Data was obtained for the dependent variable (Stats Exam Scores) and the independent
variables (Math test, English test, English GPA, Math GPA, and Other GPA). The descriptive
statistic for the sample size N=100 can be found in Table 1.
Table 1:
Descriptive Statistics
Descriptive Statistics
N Minimum Maximum Mean Std. Deviation
Math aptitude test score 100 310 650 460.60 77.366
English aptitude test score 100 310 650 478.20 71.653
High school English GPA 100 2.08 3.73 2.8183 .27633
High school math GPA 100 2.12 3.97 2.7763 .30234
GPA in other high school classes 100 2.01 3.70 3.0236 .22220
Average percentage correct on
statistics exams 100 23 97 60.11 19.788
GROUP #2 WRITE-UP #6 3
Valid N (listwise) 100
Results
Data Screening
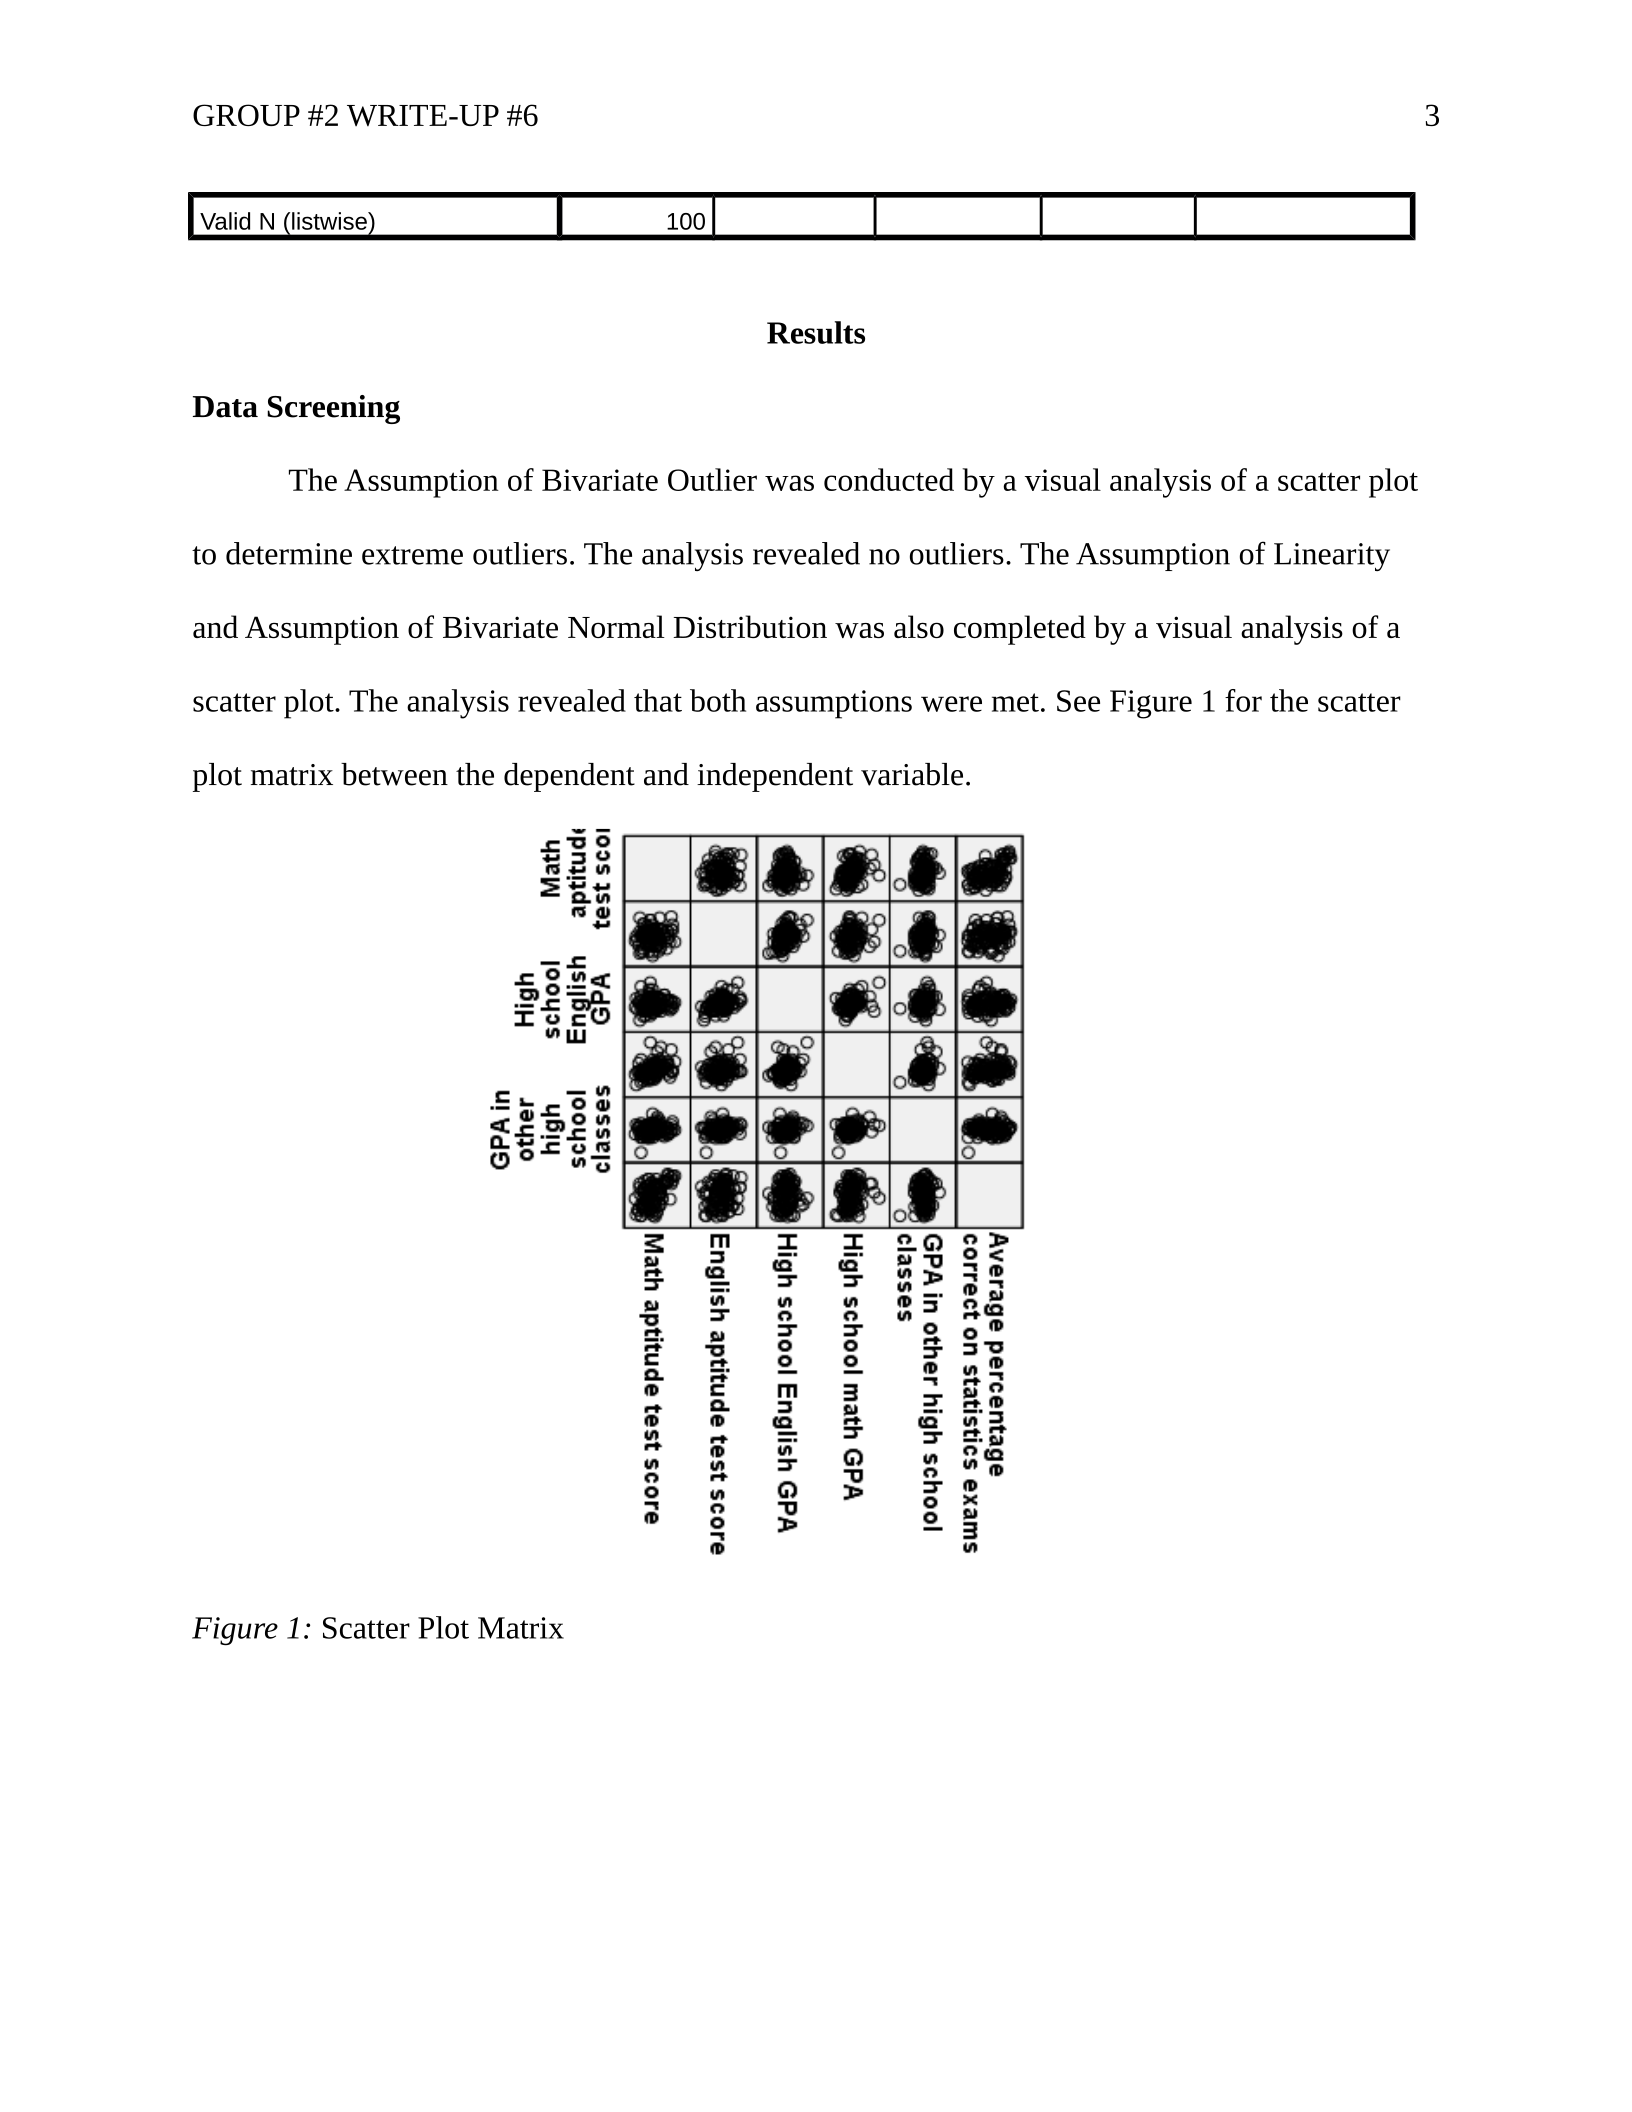
The Assumption of Bivariate Outlier was conducted by a visual analysis of a scatter plot
to determine extreme outliers. The analysis revealed no outliers. The Assumption of Linearity
and Assumption of Bivariate Normal Distribution was also completed by a visual analysis of a
scatter plot. The analysis revealed that both assumptions were met. See Figure 1 for the scatter
plot matrix between the dependent and independent variable.
Figure 1: Scatter Plot Matrix
GROUP #2 WRITE-UP #6 4
Assumptions
A multiple linear regression analysis was used to test the null hypothesis, which
examined the relationship between the dependent (Stats Exam Scores) and independent variables
(Math test, English test, English GPA, Math GPA, and Other GPA). The Regression model
analysis required that several of the assumptions should be met. The Assumption of Linearity and
the Assumption of Bivariate Normal Distribution were both met.
The next assumption that was analyzed was the Assumption of non-Multicollinearity
among the Predictor Variables which assumes that the independent variables (Math test, English
test, English GPA, Math GPA, and Other GPA) are not related between themselves. The Variance
Inflation Factor (VIF) was used to examine this assumption. The analysis indicted no value
larger than five; therefore, the result indicated no violation. See Table 2 and 3 below for
Collinearity Statistics.
Table 2:
Collinearity Statistics
Coefficientsa
Model
Unstandardized
Coefficients
Standardized
Coefficients
t Sig.
Collinearity
Statistics
B Std. Error Beta Tolerance VIF
1 (Constant) 6.745 27.691 .244 .808
Math aptitude test
score .116 .025 .453 4.726 .000 .847 1.181
English aptitude test
score .049 .027 .179 1.816 .073 .801 1.249
High school English
GPA -3.365 7.446 -.047 -.452 .652 .719 1.391
High school math GPA 5.478 6.865 .084 .798 .427 .707 1.415
GPA in other high
school classes -9.702 8.500 -.109 -1.141 .257 .854 1.172
a. Dependent Variable: Average percentage correct on statistics exams
GROUP #2 WRITE-UP #6 5
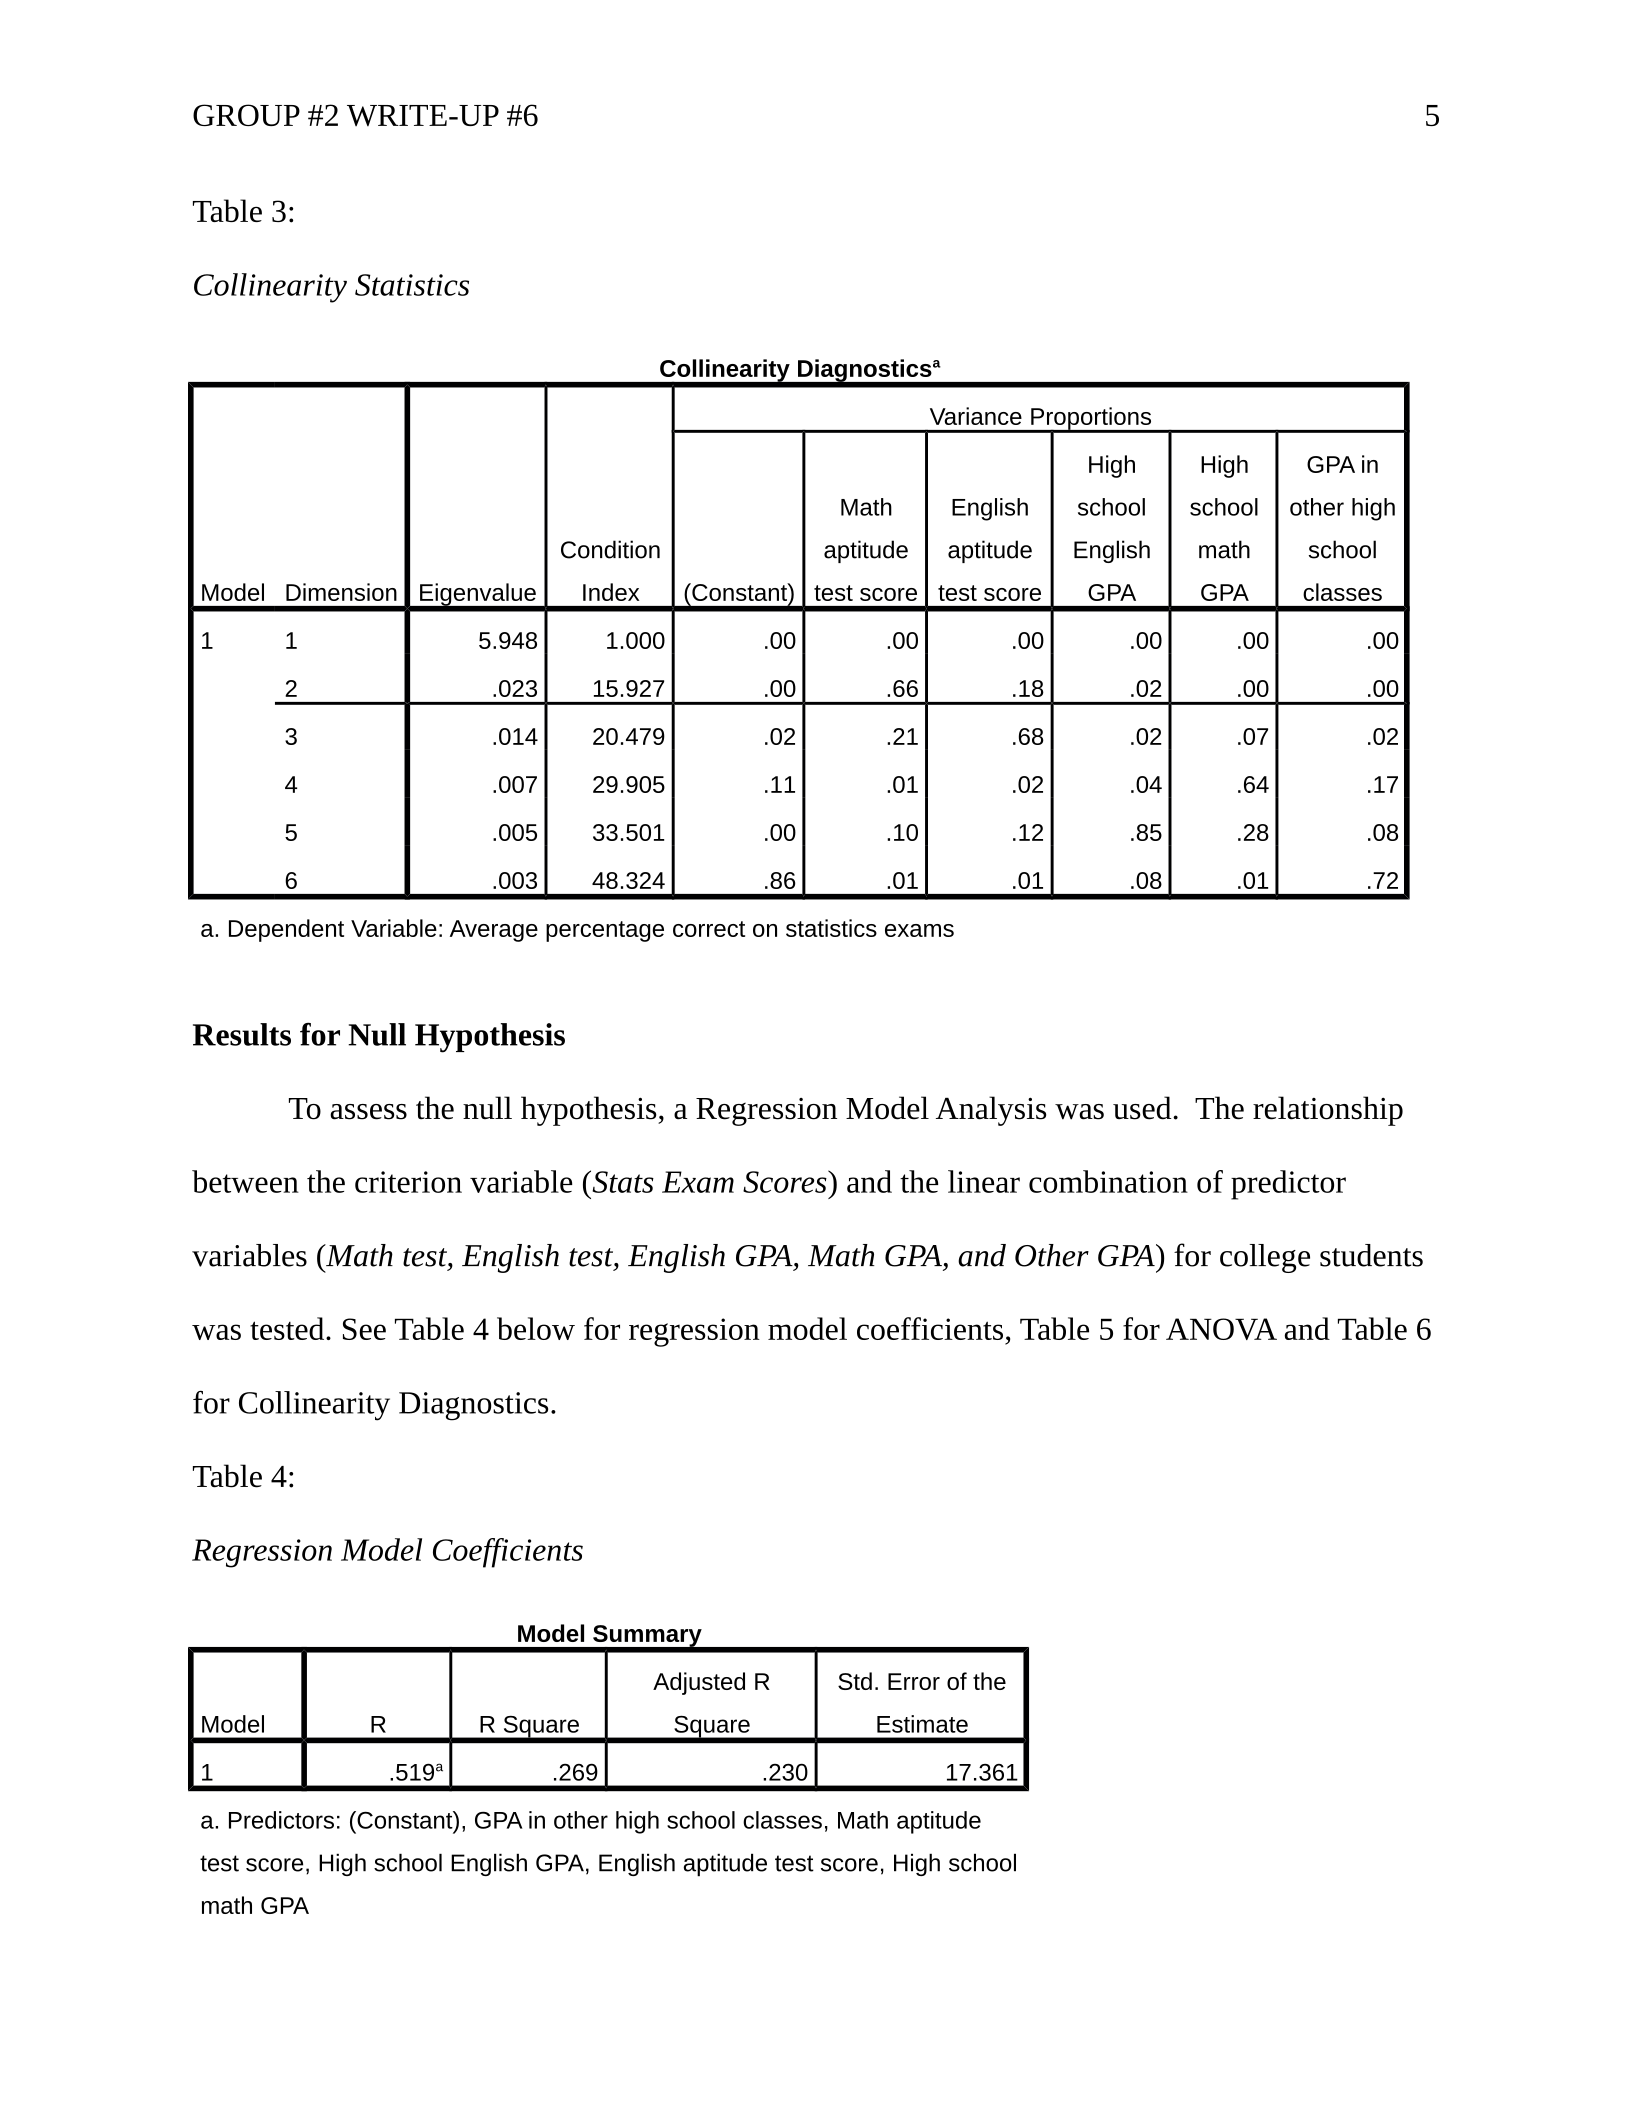
Table 3:
Collinearity Statistics
Collinearity Diagnosticsa
Model Dimension Eigenvalue
Condition
Index
Variance Proportions
(Constant)
Math
aptitude
test score
English
aptitude
test score
High
school
English
GPA
High
school
math
GPA
GPA in
other high
school
classes
1 1 5.948 1.000 .00 .00 .00 .00 .00 .00
2 .023 15.927 .00 .66 .18 .02 .00 .00
3 .014 20.479 .02 .21 .68 .02 .07 .02
4 .007 29.905 .11 .01 .02 .04 .64 .17
5 .005 33.501 .00 .10 .12 .85 .28 .08
6 .003 48.324 .86 .01 .01 .08 .01 .72
a. Dependent Variable: Average percentage correct on statistics exams
Results for Null Hypothesis
To assess the null hypothesis, a Regression Model Analysis was used. The relationship
between the criterion variable (Stats Exam Scores) and the linear combination of predictor
variables (Math test, English test, English GPA, Math GPA, and Other GPA) for college students
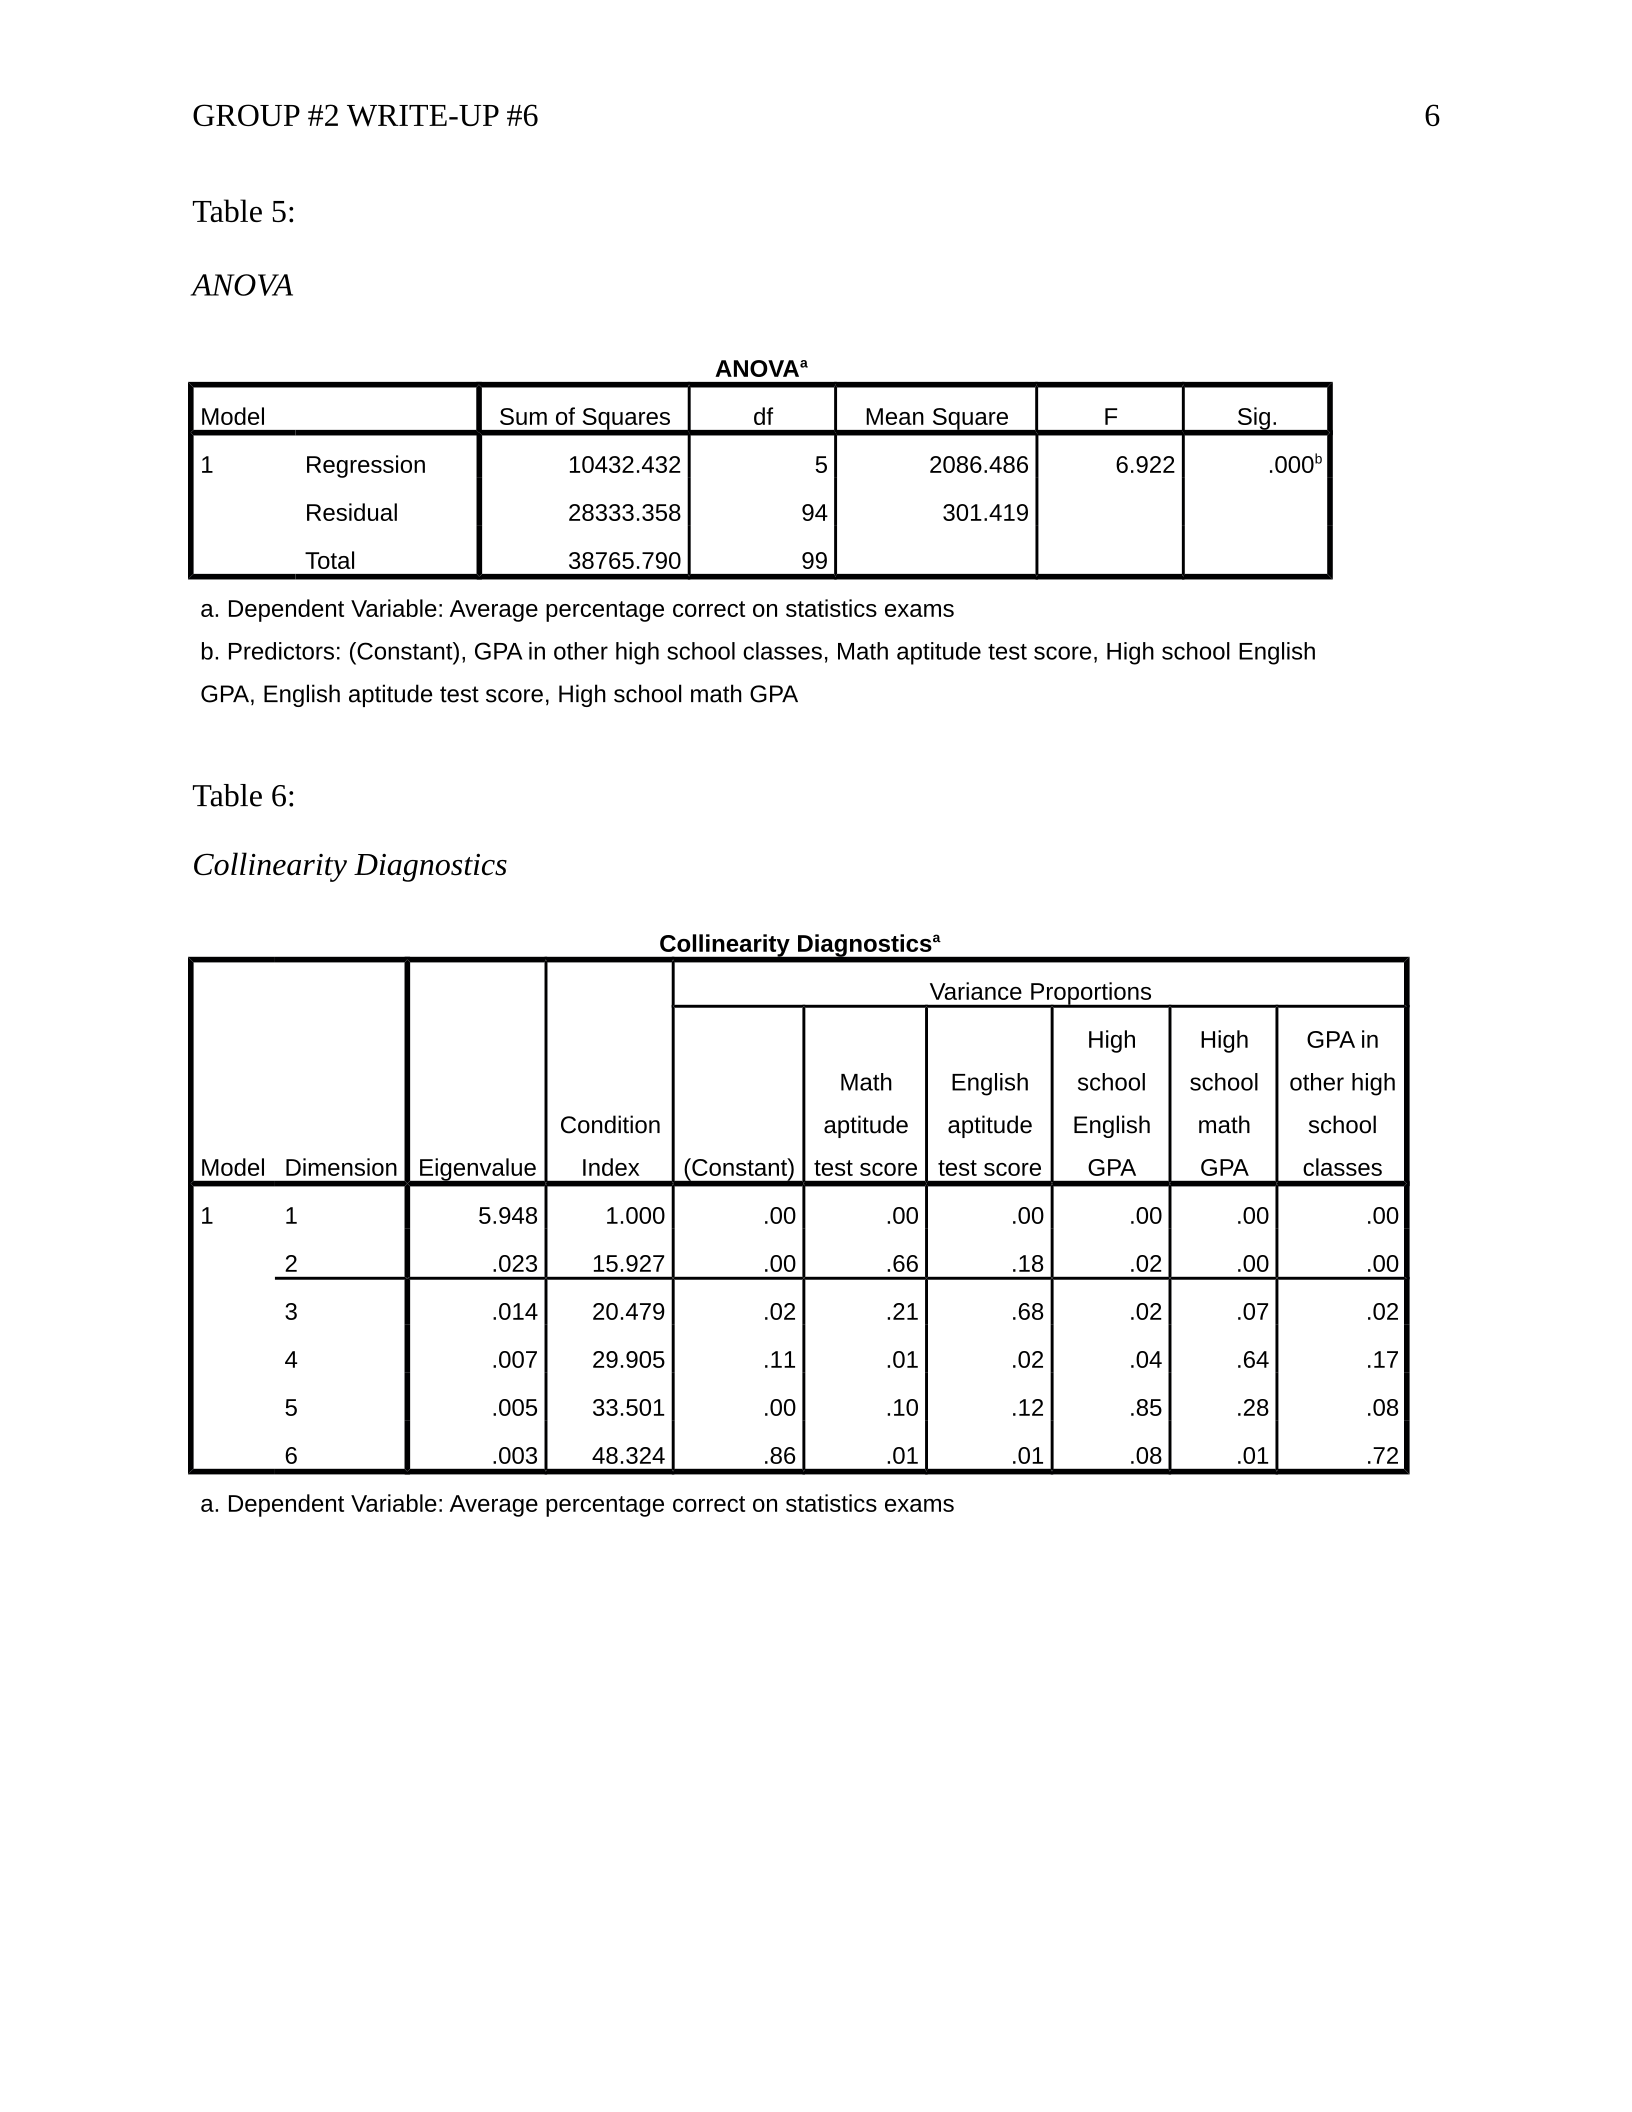
was tested. See Table 4 below for regression model coefficients, Table 5 for ANOVA and Table 6
for Collinearity Diagnostics.
Table 4:
Regression Model Coefficients
Model Summary
Model R R Square
Adjusted R
Square
Std. Error of the
Estimate
1 .519a.269 .230 17.361
a. Predictors: (Constant), GPA in other high school classes, Math aptitude
test score, High school English GPA, English aptitude test score, High school
math GPA
GROUP #2 WRITE-UP #6 6
Table 5:
ANOVA
ANOVAa
Model Sum of Squares df Mean Square F Sig.
1 Regression 10432.432 5 2086.486 6.922 .000b
Residual 28333.358 94 301.419
Total 38765.790 99
a. Dependent Variable: Average percentage correct on statistics exams
b. Predictors: (Constant), GPA in other high school classes, Math aptitude test score, High school English
GPA, English aptitude test score, High school math GPA
Table 6:
Collinearity Diagnostics
Collinearity Diagnosticsa
Model Dimension Eigenvalue
Condition
Index
Variance Proportions
(Constant)
Math
aptitude
test score
English
aptitude
test score
High
school
English
GPA
High
school
math
GPA
GPA in
other high
school
classes
1 1 5.948 1.000 .00 .00 .00 .00 .00 .00
2 .023 15.927 .00 .66 .18 .02 .00 .00
3 .014 20.479 .02 .21 .68 .02 .07 .02
4 .007 29.905 .11 .01 .02 .04 .64 .17
5 .005 33.501 .00 .10 .12 .85 .28 .08
6 .003 48.324 .86 .01 .01 .08 .01 .72
a. Dependent Variable: Average percentage correct on statistics exams