


1
Running head: TWO-WAY ANOVA
GROUP 1 WRITE-UP: SPSS WORKSHEET 3: TWO-WAY ANOVA
Names, Names, Names
Liberty University
Partial Fulfillment
Of the Requirements for EDUC 812
Liberty University
2023
2
TWO-WAY ANOVA
FINDINGS
Research Questions
The research question for this study was:
RQ1: Is there a difference in the amount of time fathers play with their children with no
disability, physical ability, or intellectual disability?
RQ2: Is there a difference in the amount of time fathers play with their male or female
children?
RQ3: Is there significant interaction between the different disability status of the child
and the gender of the child related to the amount of time fathers spend playing with their
children?
Null Hypothesis
The null hypothesis for this study was:
This study is a two-way ANOVA, therefore there are three null hypotheses.
H01: There are no significant differences in the amount of time fathers play with their
children with no disability, physical disability, or intellectual disability.
H02: There are no significant differences in the amount of time fathers play with their
male or female children.
H03: There are no significant differences in the amount of time fathers play with their
male or female children with no disability, physical disability, or intellectual disability.
Descriptive Statistics
A Two-Way ANOVA was conducted to compare the main effects of types of disabilities
between gender and amount of time a father spends playing with the child. Data obtained for the
dependent variable “play time” can be found in Table 1.
3
TWO-WAY ANOVA
Table 1
Dependent Variable: Play
Disability status of the child Gender of Child Mean Std. Deviation N
Typically Developing Male 7.30 1.829 10
Female 6.80 2.201 10
Total 7.05 1.986 20
Physical Disability Male 3.00 1.563 10
Female 3.40 1.897 10
Total 3.20 1.704 20
Intellectual Disability Male 3.22 1.716 9
Female 4.00 1.612 11
Total 3.65 1.663 20
Total Male 4.55 2.613 29
Female 4.71 2.369 31
Total 4.63 2.470 60
Results
Data screening
The data screening regarding inconsistencies was conducted on the influence of the two
independent variables “disability and gender” to measure the time fathers spent playing with
their children. The following disability levels have three categories: (1) Typically Developing,
(2) Physical, and (3) Intellectual. Gender categories include: Male and Female. No data errors
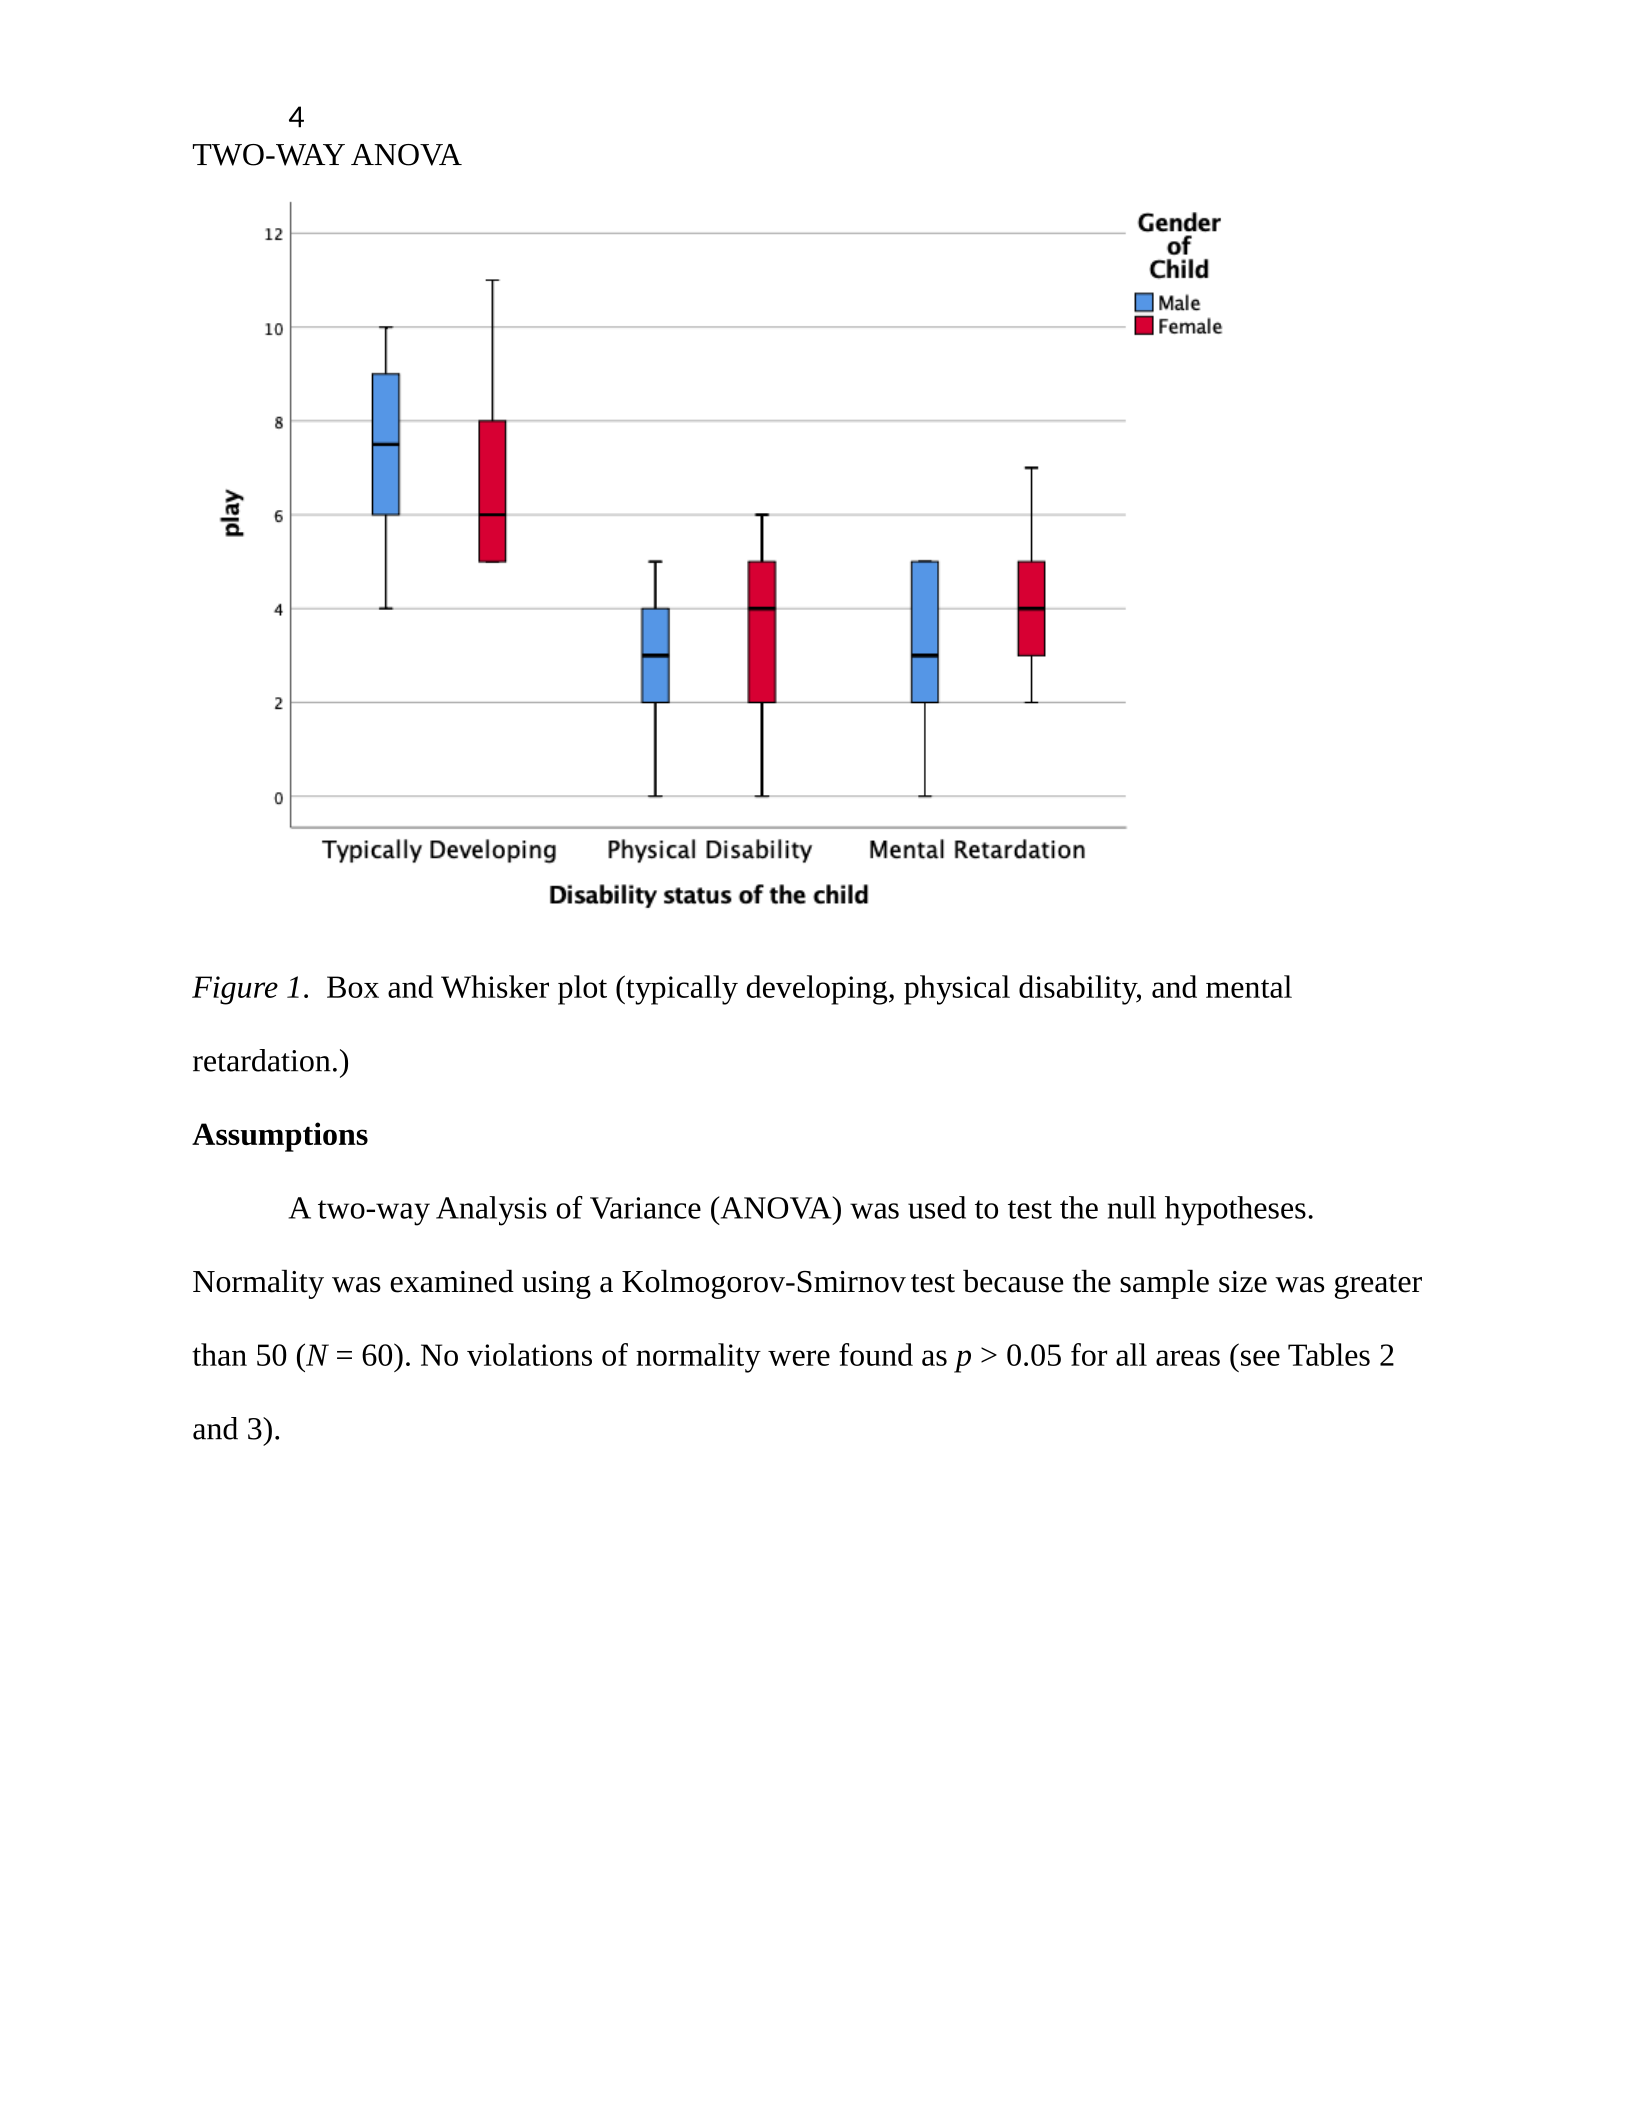
or inconsistencies were identified. Box and Whisker plots were used to conduct and detect
outliers. There were no outliers found (see Figure 1).
4
TWO-WAY ANOVA
Figure 1. Box and Whisker plot (typically developing, physical disability, and mental
retardation.)
Assumptions
A two-way Analysis of Variance (ANOVA) was used to test the null hypotheses.
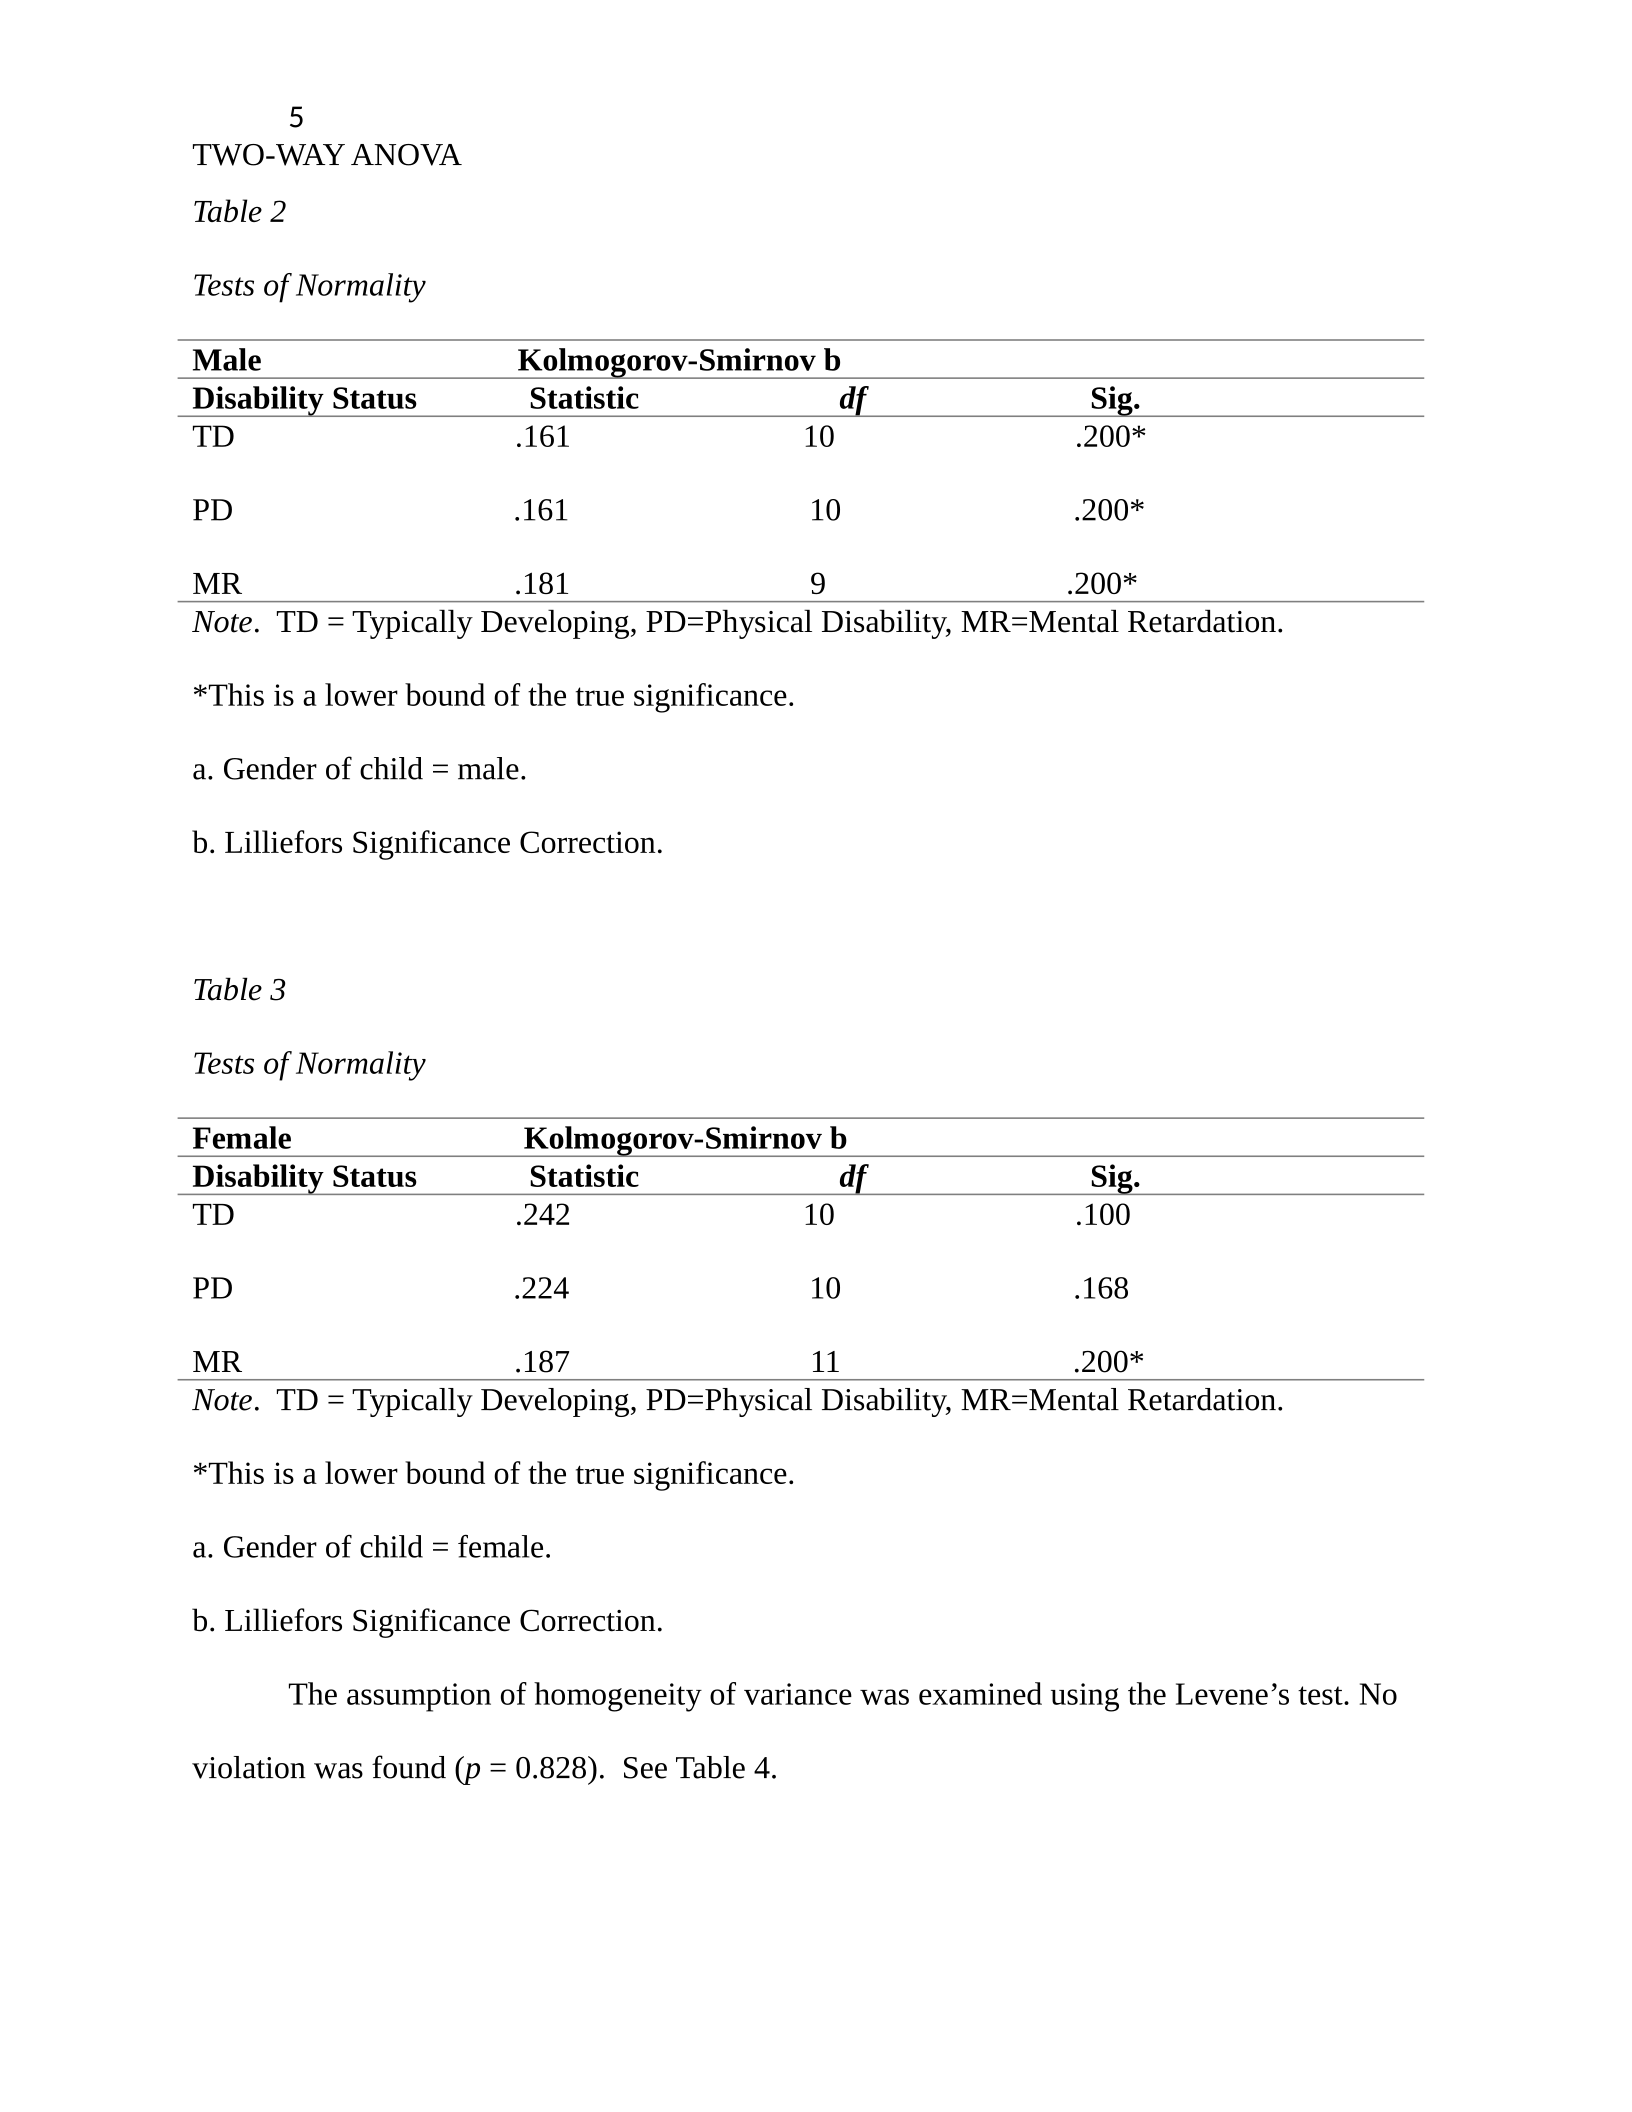
Normality was examined using a Kolmogorov-Smirnov test because the sample size was greater
than 50 (N = 60). No violations of normality were found as p > 0.05 for all areas (see Tables 2
and 3).
5
TWO-WAY ANOVA
Table 2
Tests of Normality
Male Kolmogorov-Smirnov b
Disability Status Statistic df Sig.
TD .161 10 .200*
PD .161 10 .200*
MR .181 9 .200*
Note. TD = Typically Developing, PD=Physical Disability, MR=Mental Retardation.
*This is a lower bound of the true significance.
a. Gender of child = male.
b. Lilliefors Significance Correction.
Table 3
Tests of Normality
Female Kolmogorov-Smirnov b
Disability Status Statistic df Sig.
TD .242 10 .100
PD .224 10 .168
MR .187 11 .200*
Note. TD = Typically Developing, PD=Physical Disability, MR=Mental Retardation.
*This is a lower bound of the true significance.
a. Gender of child = female.
b. Lilliefors Significance Correction.
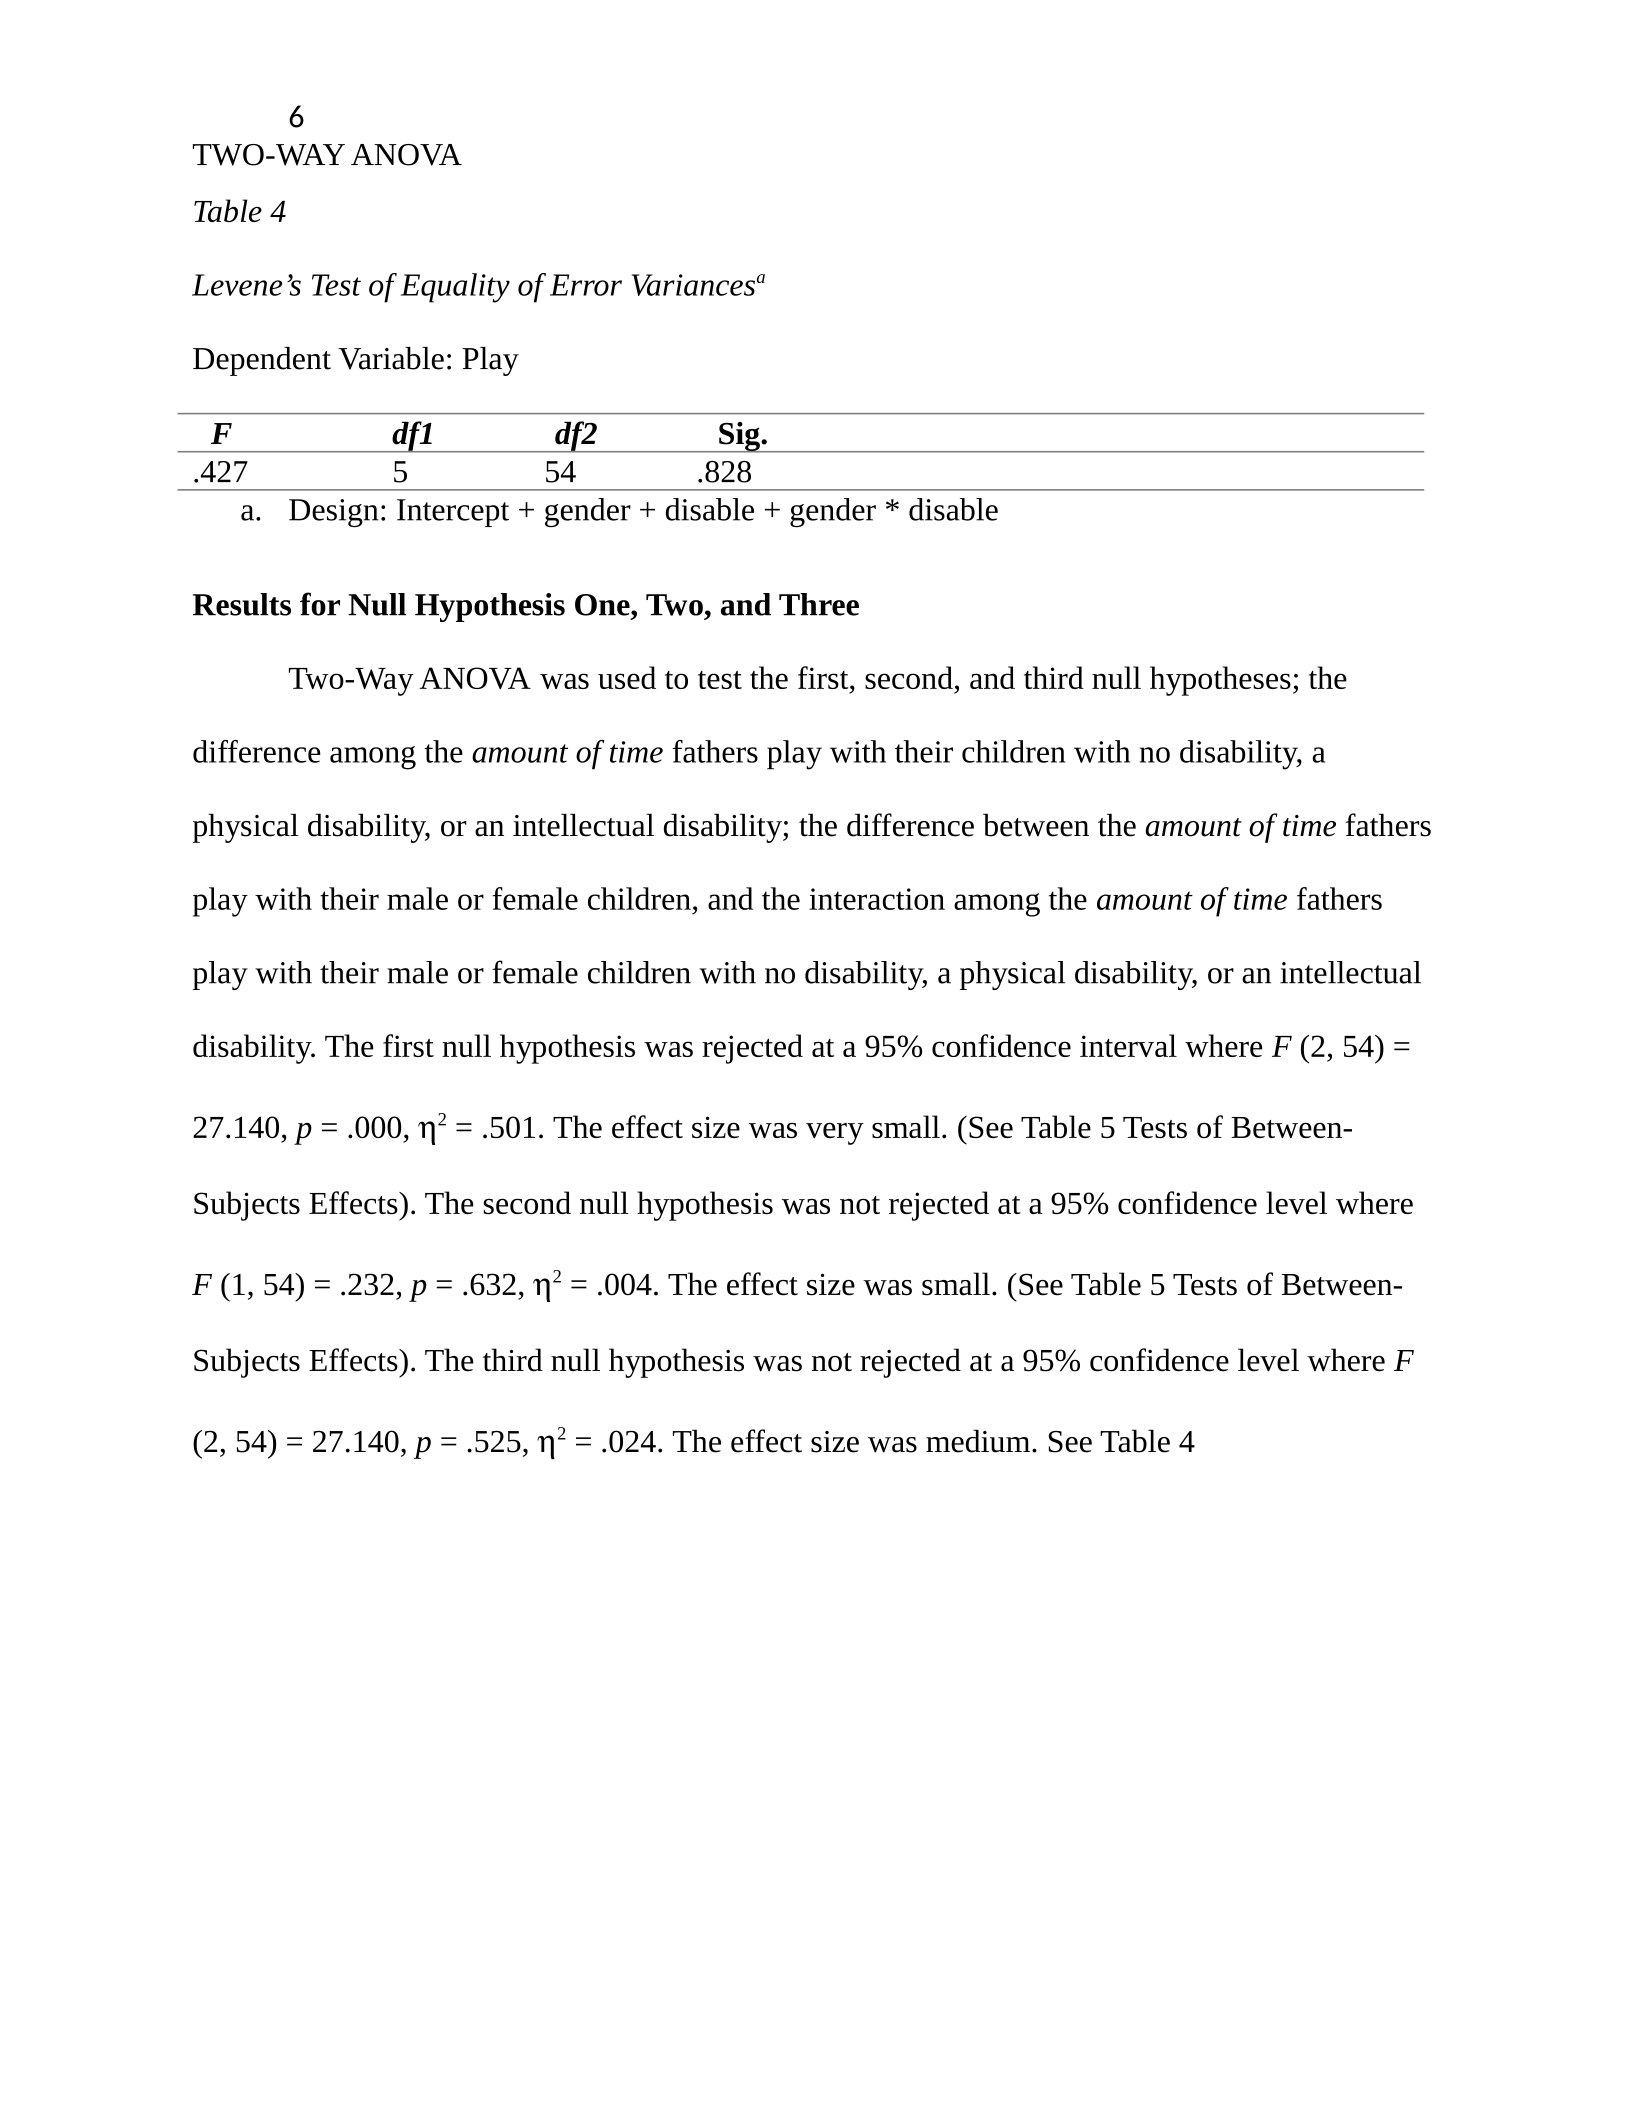
The assumption of homogeneity of variance was examined using the Levene’s test. No
violation was found (p = 0.828). See Table 4.
6
TWO-WAY ANOVA
Table 4
Levene’s Test of Equality of Error Variancesa
Dependent Variable: Play
F df1 df2 Sig.
.427 5 54 .828
a. Design: Intercept + gender + disable + gender * disable
Results for Null Hypothesis One, Two, and Three
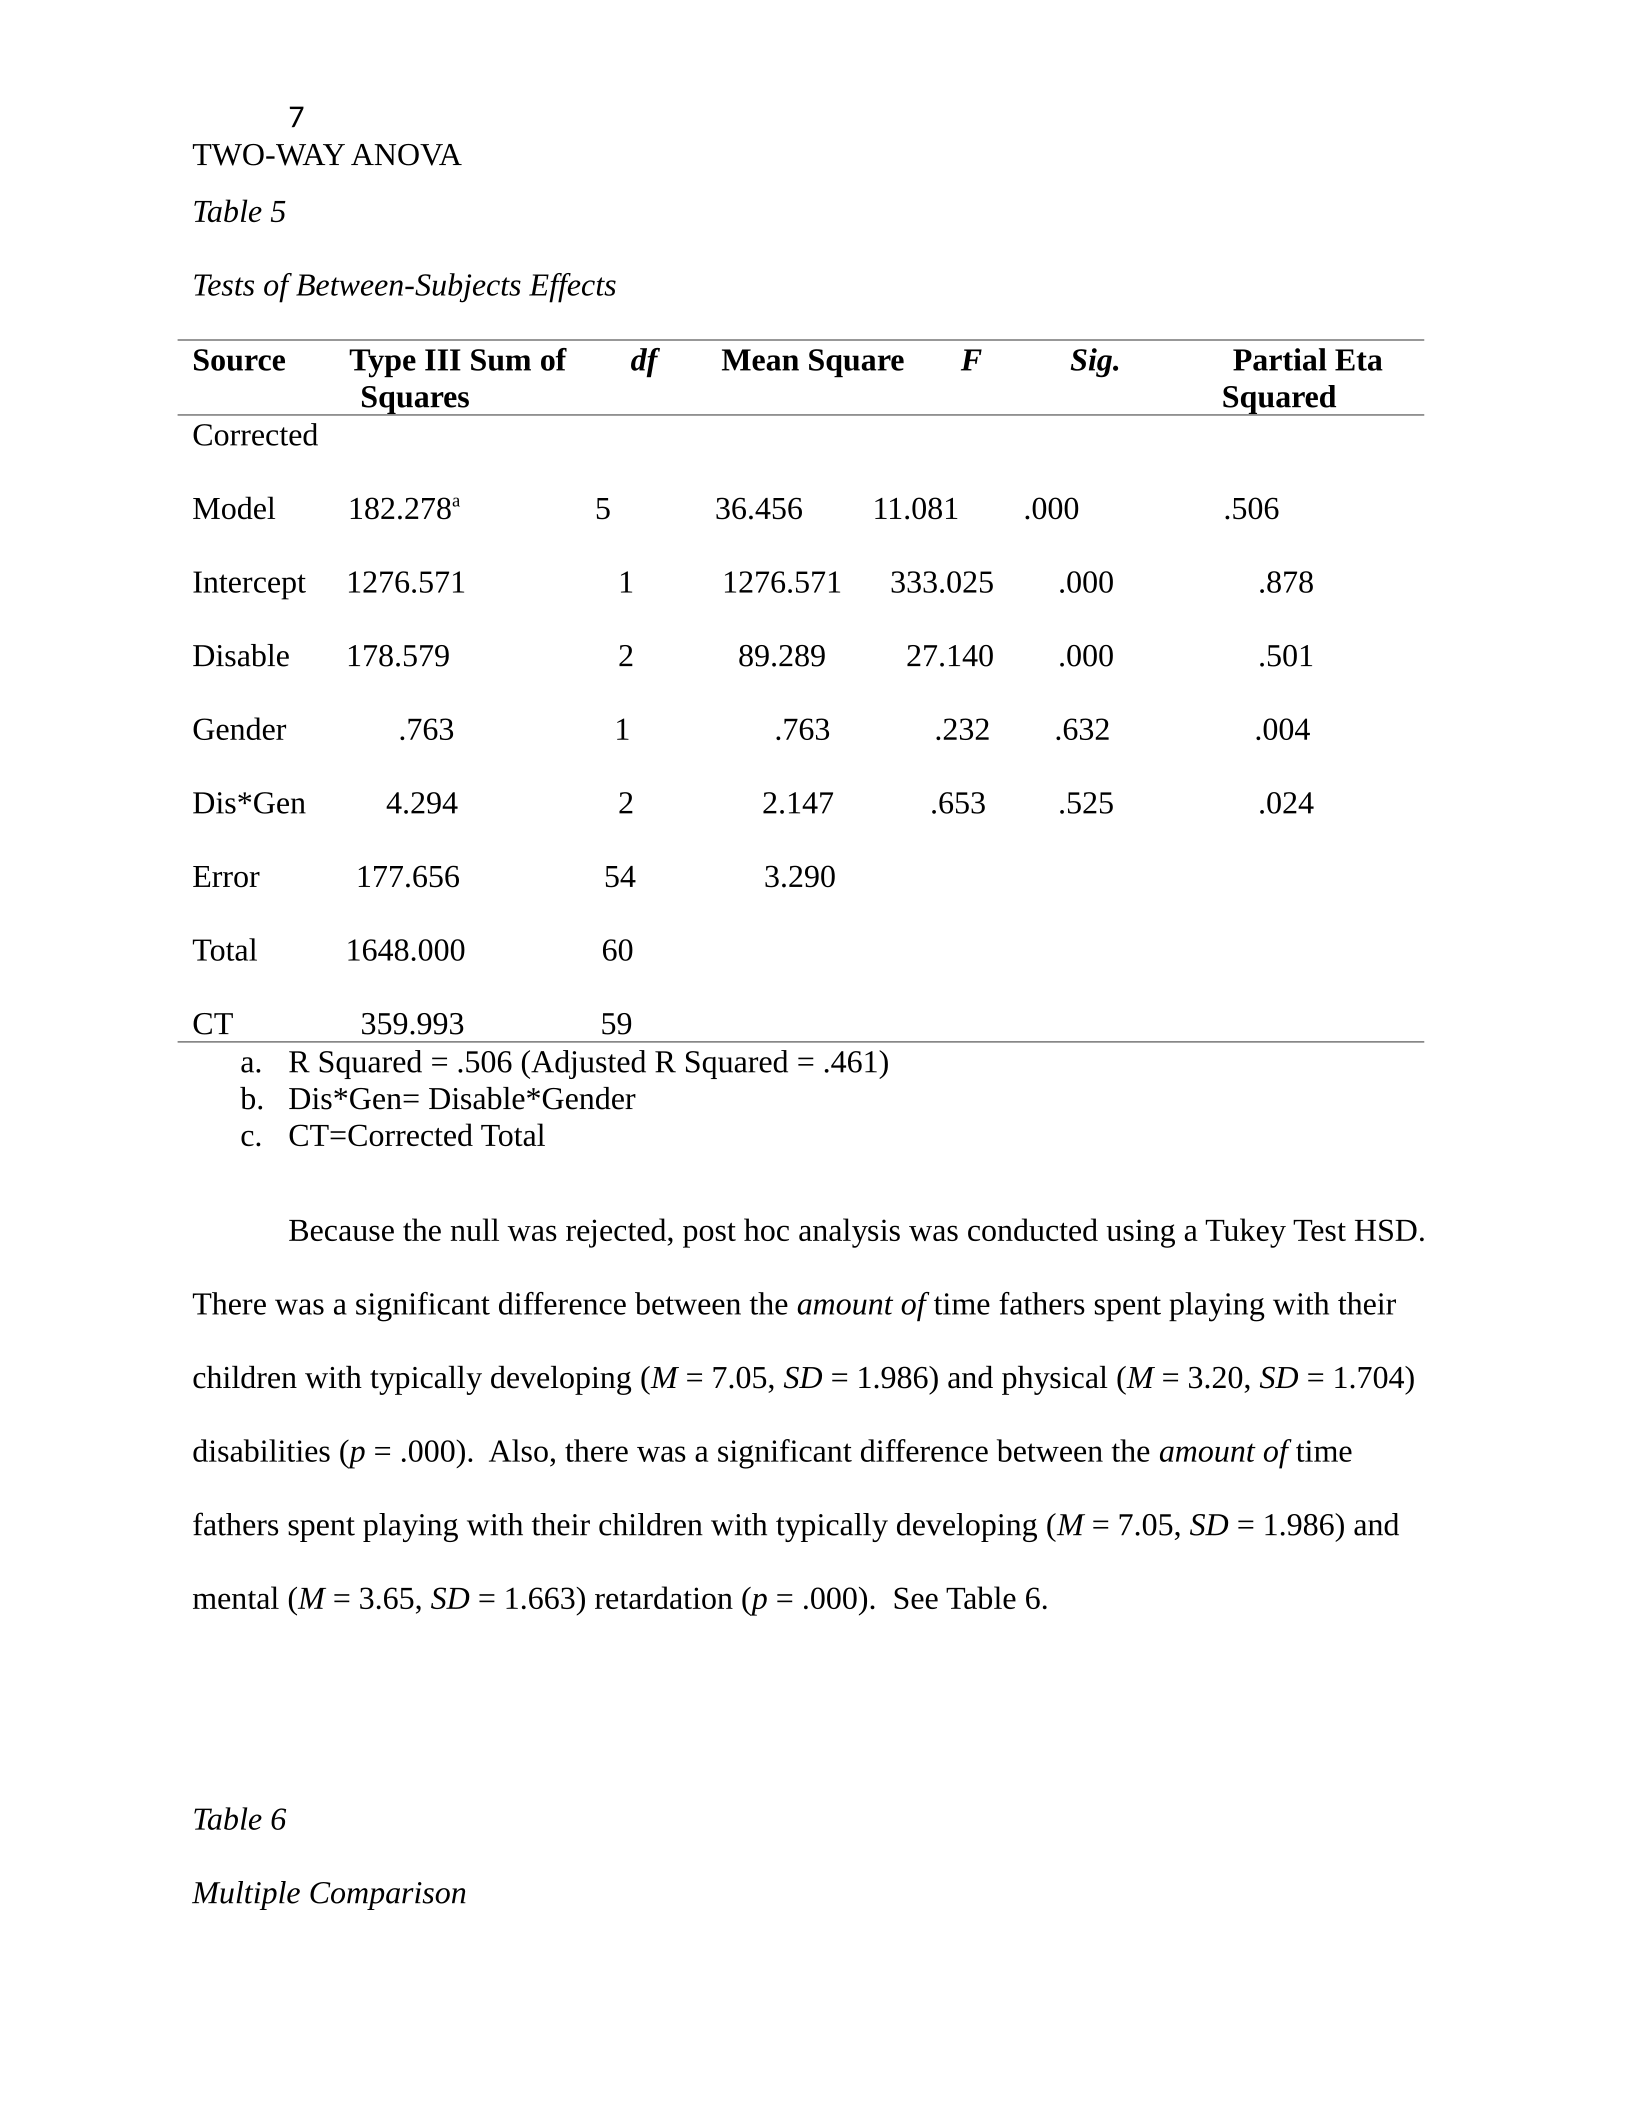
Two-Way ANOVA was used to test the first, second, and third null hypotheses; the
difference among the amount of time fathers play with their children with no disability, a
physical disability, or an intellectual disability; the difference between the amount of time fathers
play with their male or female children, and the interaction among the amount of time fathers
play with their male or female children with no disability, a physical disability, or an intellectual
disability. The first null hypothesis was rejected at a 95% confidence interval where F (2, 54) =
27.140, p = .000, 2 = .501. The effect size was very small. (See Table 5 Tests of Between-
Subjects Effects). The second null hypothesis was not rejected at a 95% confidence level where
F (1, 54) = .232, p = .632, 2 = .004. The effect size was small. (See Table 5 Tests of Between-
Subjects Effects). The third null hypothesis was not rejected at a 95% confidence level where F
(2, 54) = 27.140, p = .525, 2 = .024. The effect size was medium. See Table 4
7
TWO-WAY ANOVA
Table 5
Tests of Between-Subjects Effects
Source Type III Sum of df Mean Square F Sig. Partial Eta
Squares Squared
Corrected
Model 182.278a 5 36.456 11.081 .000 .506
Intercept 1276.571 1 1276.571 333.025 .000 .878
Disable 178.579 2 89.289 27.140 .000 .501
Gender .763 1 .763 .232 .632 .004
Dis*Gen 4.294 2 2.147 .653 .525 .024
Error 177.656 54 3.290
Total 1648.000 60
CT 359.993 59
a. R Squared = .506 (Adjusted R Squared = .461)
b. Dis*Gen= Disable*Gender
c. CT=Corrected Total
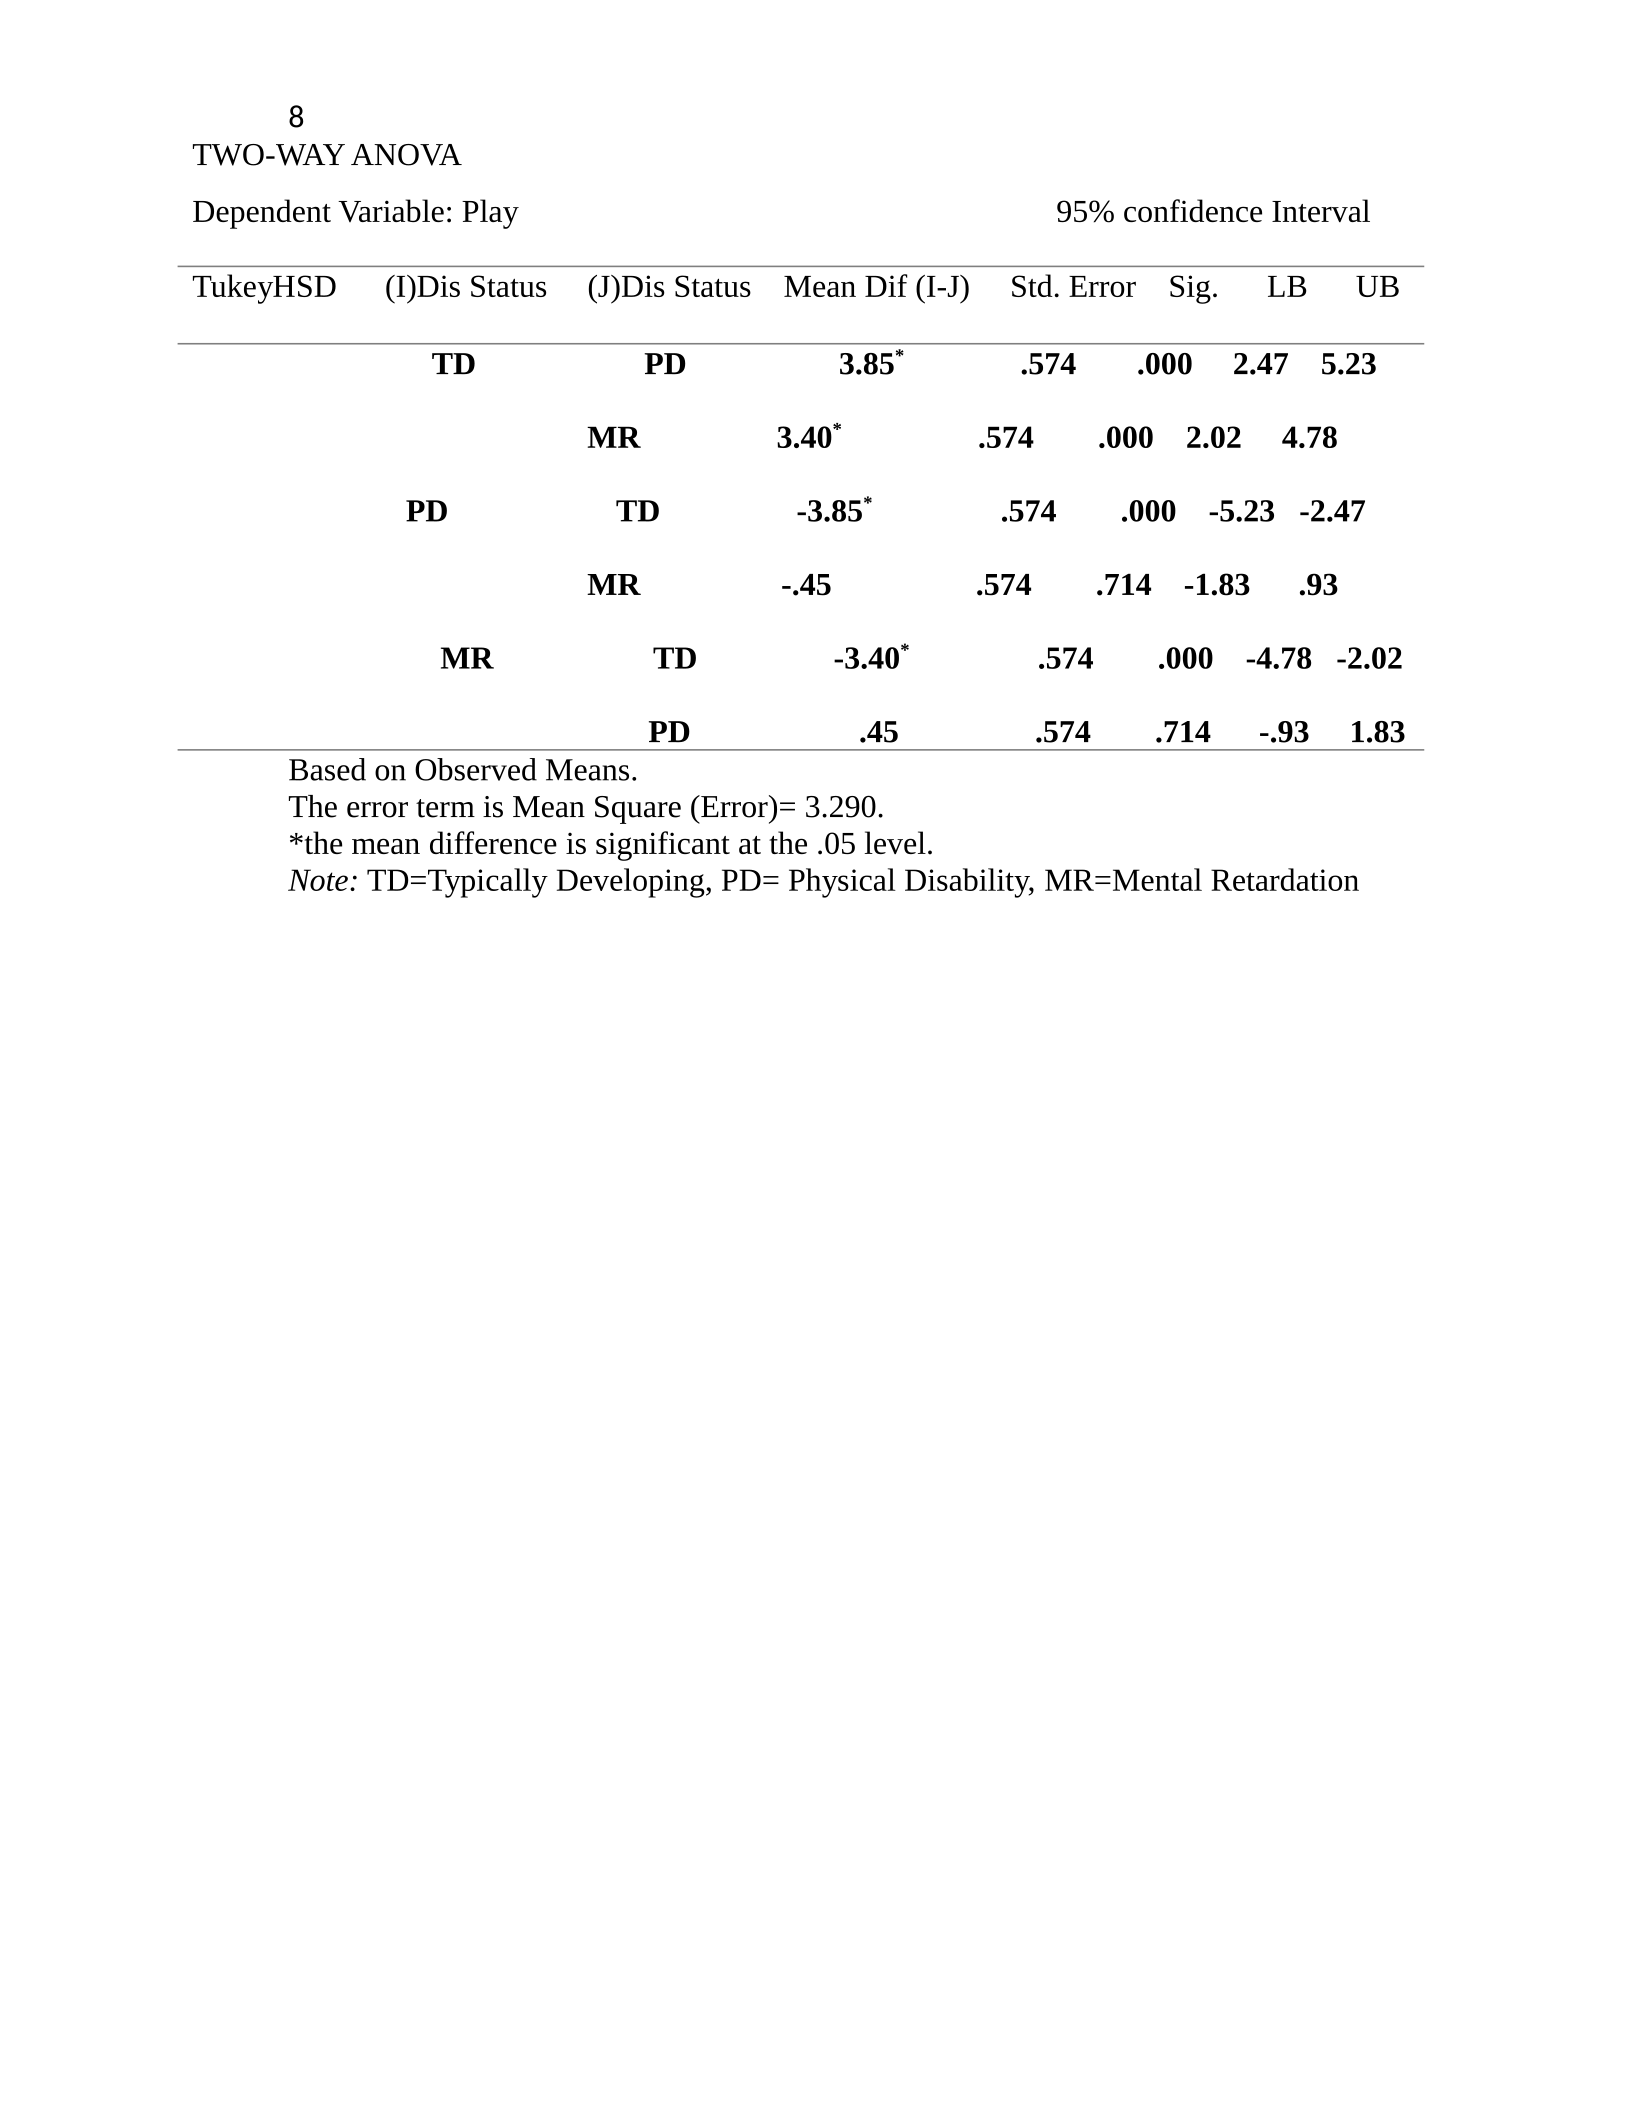
Because the null was rejected, post hoc analysis was conducted using a Tukey Test HSD.
There was a significant difference between the amount of time fathers spent playing with their
children with typically developing (M = 7.05, SD = 1.986) and physical (M = 3.20, SD = 1.704)
disabilities (p = .000). Also, there was a significant difference between the amount of time
fathers spent playing with their children with typically developing (M = 7.05, SD = 1.986) and
mental (M = 3.65, SD = 1.663) retardation (p = .000). See Table 6.
Table 6
Multiple Comparison
8
TWO-WAY ANOVA
Dependent Variable: Play 95% confidence Interval
TukeyHSD (I)Dis Status (J)Dis Status Mean Dif (I-J) Std. Error Sig. LB UB
TD PD 3.85* .574 .000 2.47 5.23
MR 3.40*.574 .000 2.02 4.78
PD TD -3.85*.574 .000 -5.23 -2.47
MR -.45 .574 .714 -1.83 .93
MR TD -3.40*.574 .000 -4.78 -2.02
PD .45 .574 .714 -.93 1.83
Based on Observed Means.
The error term is Mean Square (Error)= 3.290.
*the mean difference is significant at the .05 level.
Note: TD=Typically Developing, PD= Physical Disability, MR=Mental Retardation
Powered by TCPDF (www.tcpdf.org)

