


1
Data Screening Between Group Output
Data Screening Output
Amanda Fellure
Liberty University
EDUC 745: Intermediate Statistics & Research
Dr.

2
Data Screening Between Group Output
Independent samples of t-test were completed to evaluate whether there was a variance in
viewpoints about God in mean of religious and spiritual struggles. The dependent variable
transpired by individual thoughts about God. The important difference existed noted in the
calculation for I believe there is a God with the mean of: M=1.60 with SD of 0.96. The statement
of I familiar with God, but not anymore with a mean of M=1.17, with SD of 0.67, circumstances;
t (450) =4.07, p=0.00. This excluded that mental attitude toward about God do influence an
Individual belief system about God. The primary screening for this data had suggested that
N=637 participant. There was missing data for the calculation of N=98 for RSS-Divine
Struggles. The two definite calculation was Religion and Spiritual Struggles-Divine, the same as
quantitative variable to explain a person belief in God as a firm variable. A frequency
distribution showed that two variables were established to create the percentage of scores for
each calculation. A bar char, box plot and
Frequency distribution for Belief in God was demonstrated as 55.4% equaling out to 353
individual which believed there was a God meanwhile 13.7% shown that they believed
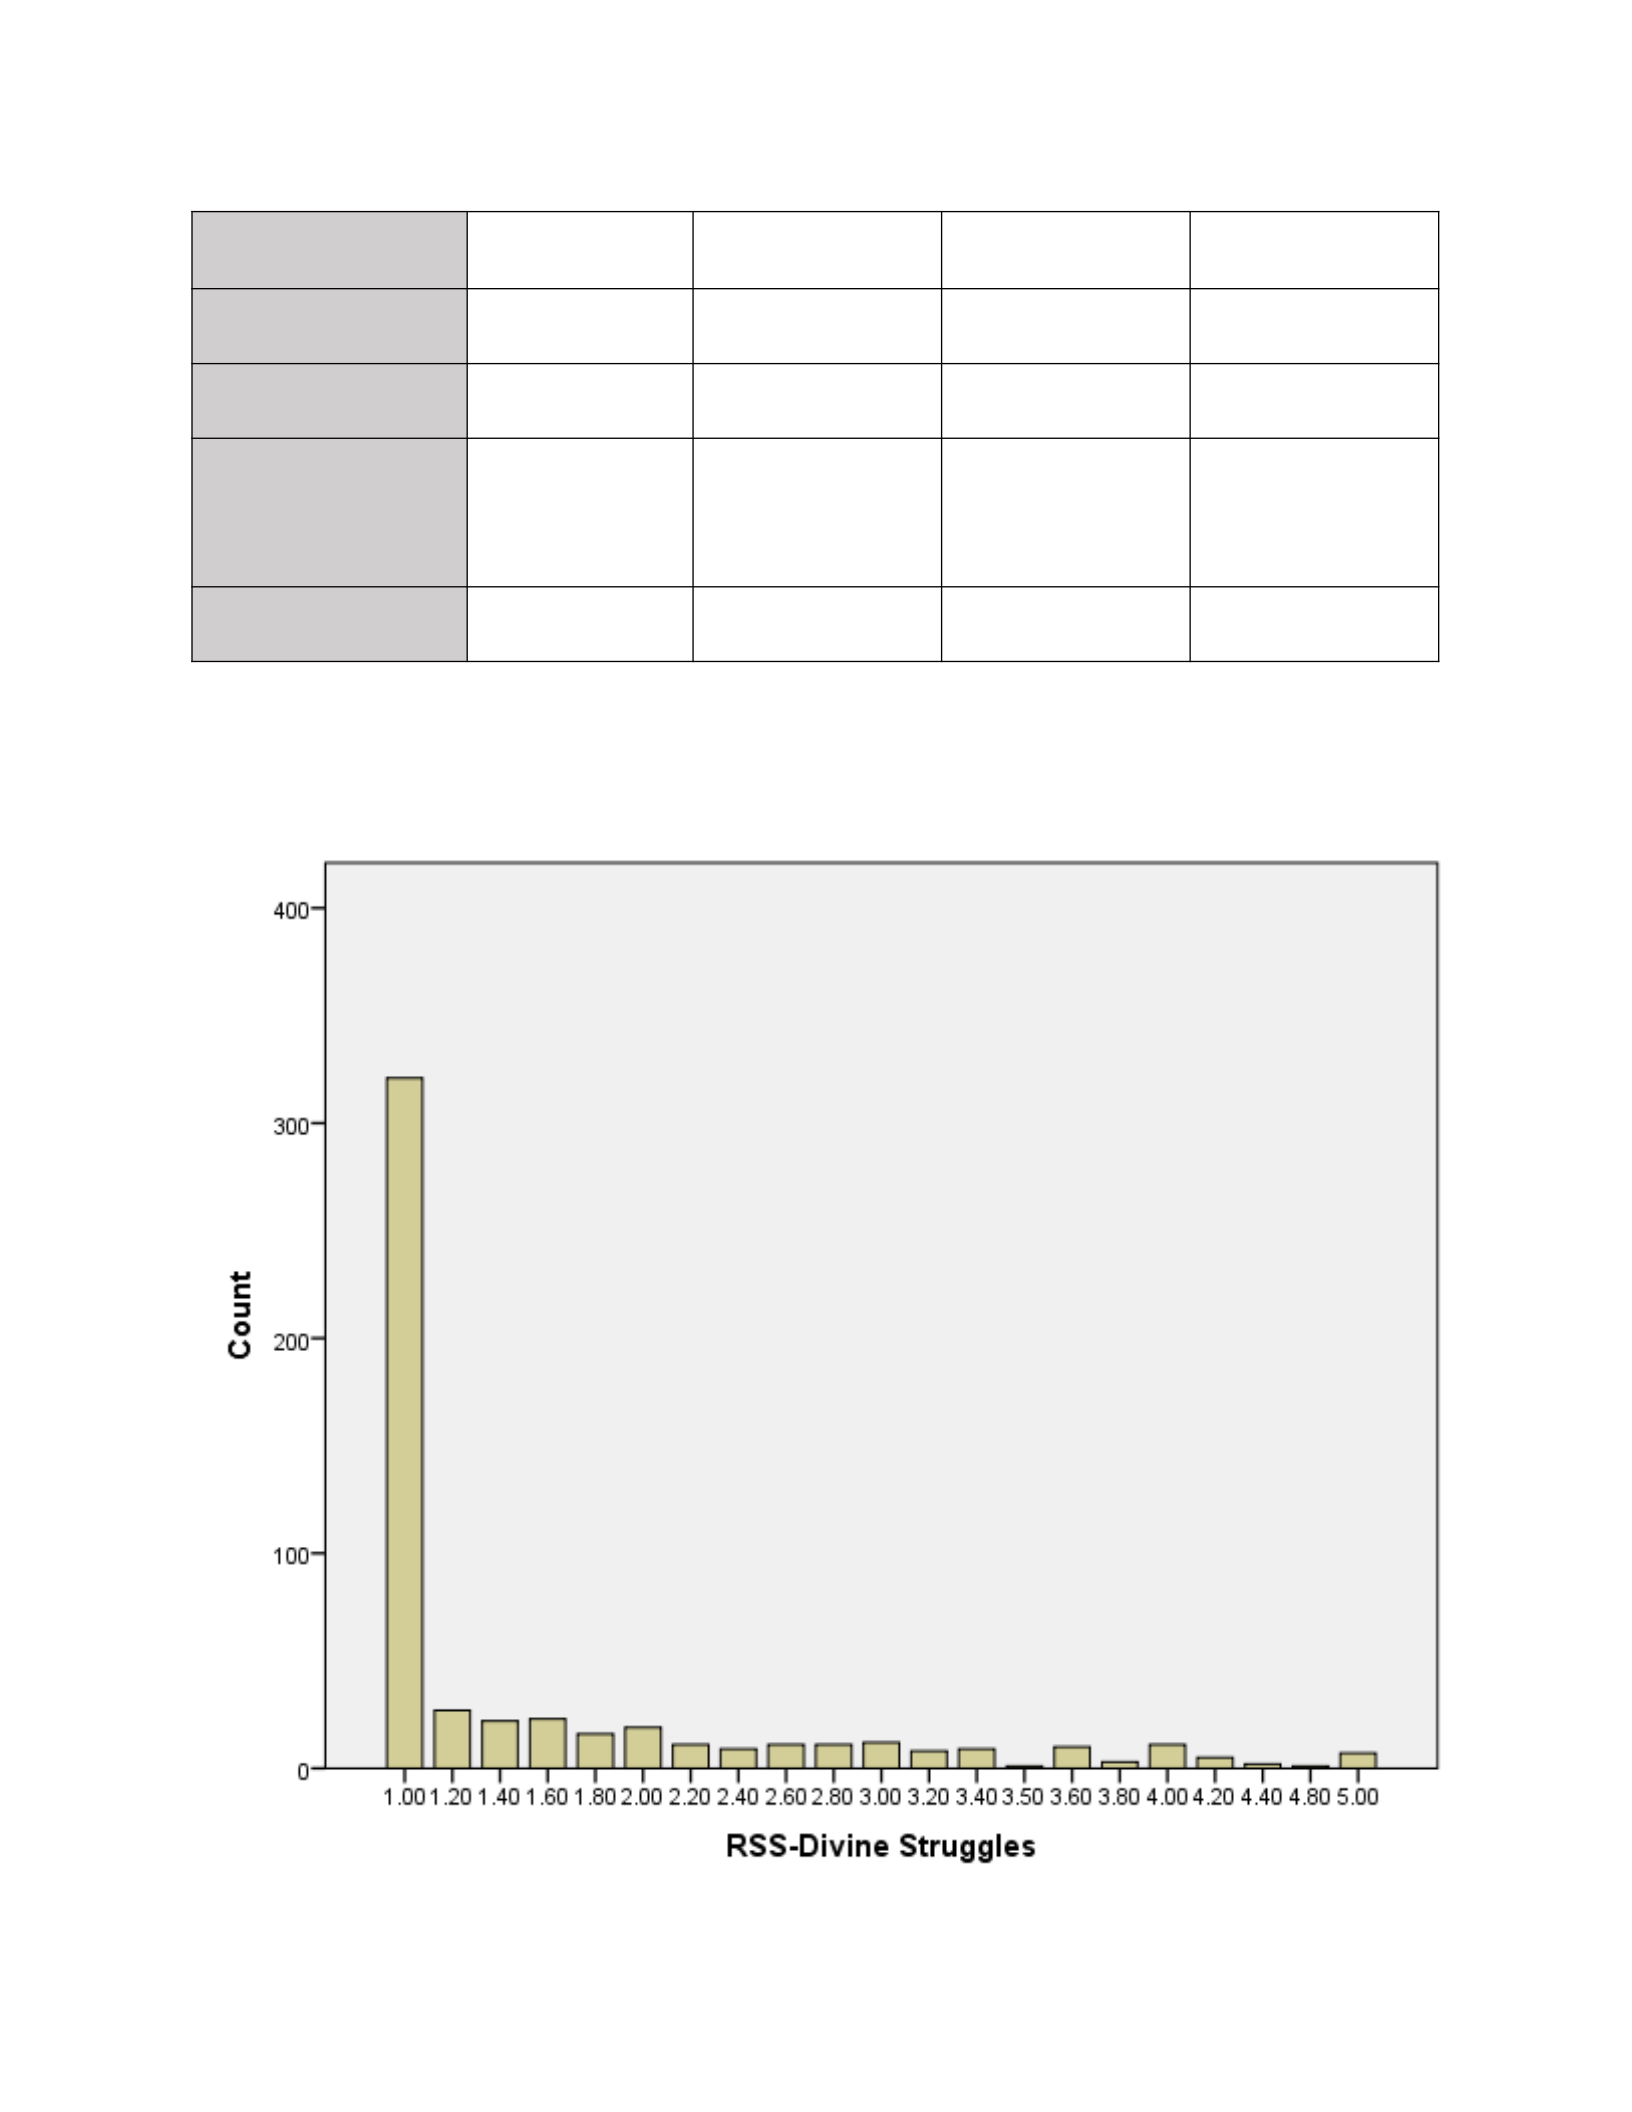
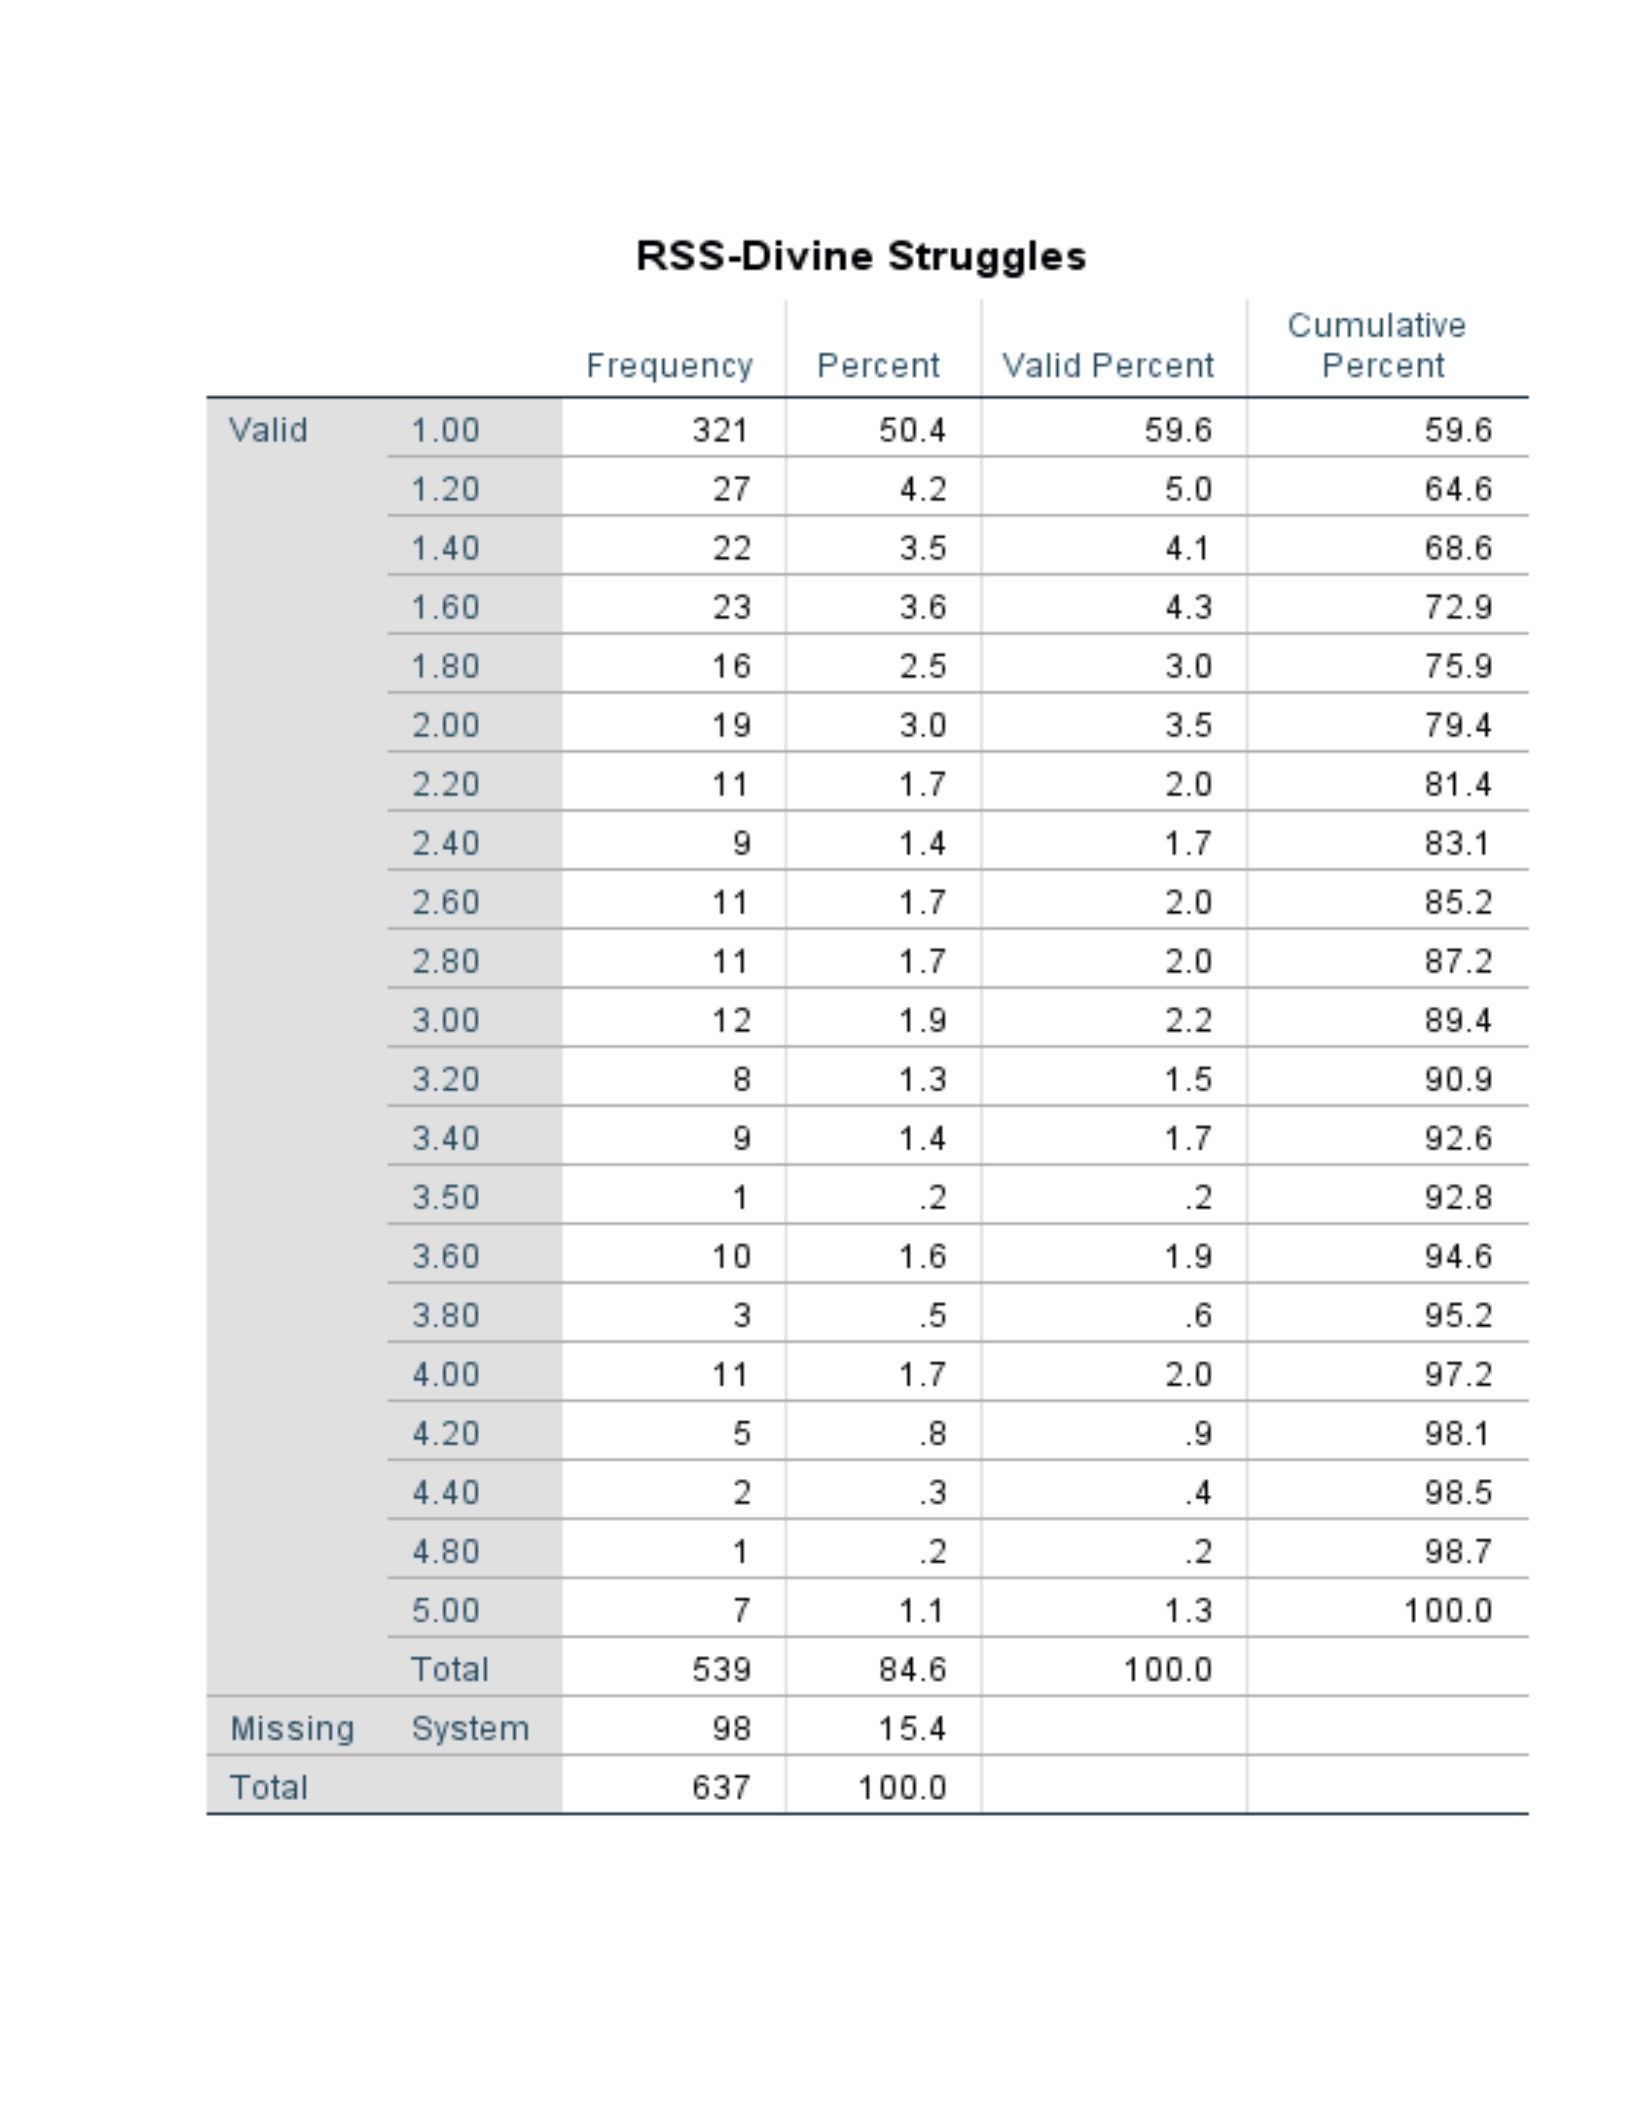
sometimes. The ranges documented were 13.7 to 55.4%. RSS-Divine Struggles varied from 0.2
to 59.6 most of the group chosen 1 as their top choice. Descriptive statistics was demonstrated in
the assessment of Belief of God showing a mean of 1.91 and standard deviation of 1.15
meanwhile Religious and Spiritual Struggles-Divine demonstrated had a mean of 1.58 and
standard deviation of 0.96. A boxplot was applied to reveal an extreme score, outliners. The
solutions were not significant because the levels seemed not to be comparable. There occurred to
be numerous outliners for the statement I used to believe there was a God but not anymore. Also,
the statement I sometimes believe in God. Both statements demonstrated different in the means.

3
Data Screening Between Group Output
Frequencies
Statistics
Please Choose the Answer that best describe your relationship with God.
RSS-Devine Struggles
N Valid 637 539
Missing 0 98
Frequency Table
In this area choose and choose the answer that describes your faith.
Frequency Percent Valid Percent Cumulative %
I believe God
exist.
353 55.4 55.4 55.4
I rarely believe
God exist
87 13.7 13.7 69.1
I sometimes
believe God
exist
100 15.7 15.7 84.8
I believe there is
higher power but
not in God.
97 15.2 15.2 100.0

4
Data Screening Between Group Output
Total 637 100.0 100.0
RSS Spirit Struggles.
Valid Frequency Percent Valid Percent Cumulative %
1.00 321 50.4 59.6 59.6
1.20 27 4.2 5.0 64.6
1.40 22 3.5 4.1 68.6
1.60 23 3.8 4.3 72.9
1.80 16 2.5 3.0 75.9
2.00 19 3.0 3.5 79.4
2.20 11 1.7 2.0 81.4
2.40 9 1.4 1.7 83.1
2.60 11 1.7 2.0 85.2
2.80 11 1.7 2.0 87.2
3.00 12 1.9 2.2 89.4
3.20 8 1.3 1.5 90.9
3.40 9 1.4 1.7 92.6
3.50 1 2 2 92.8
3.60 10 1.6 1.9 94.6
3.80 3 5 6 95.2
4.00 11 1.7 2.0 97.2
4.20 5 8 9 98.1
4.40 2 3 4 98.5
4.80 1 2 2 98.7
5
Data Screening Between Group Output
5.00 7 1.1 1.3 100.0
Total 539 84.6 100.0
Missing System 98 15.4
Total 637 100.0

8
Data Screening Between Group Output
Descriptive

9
Data Screening Between Group Output
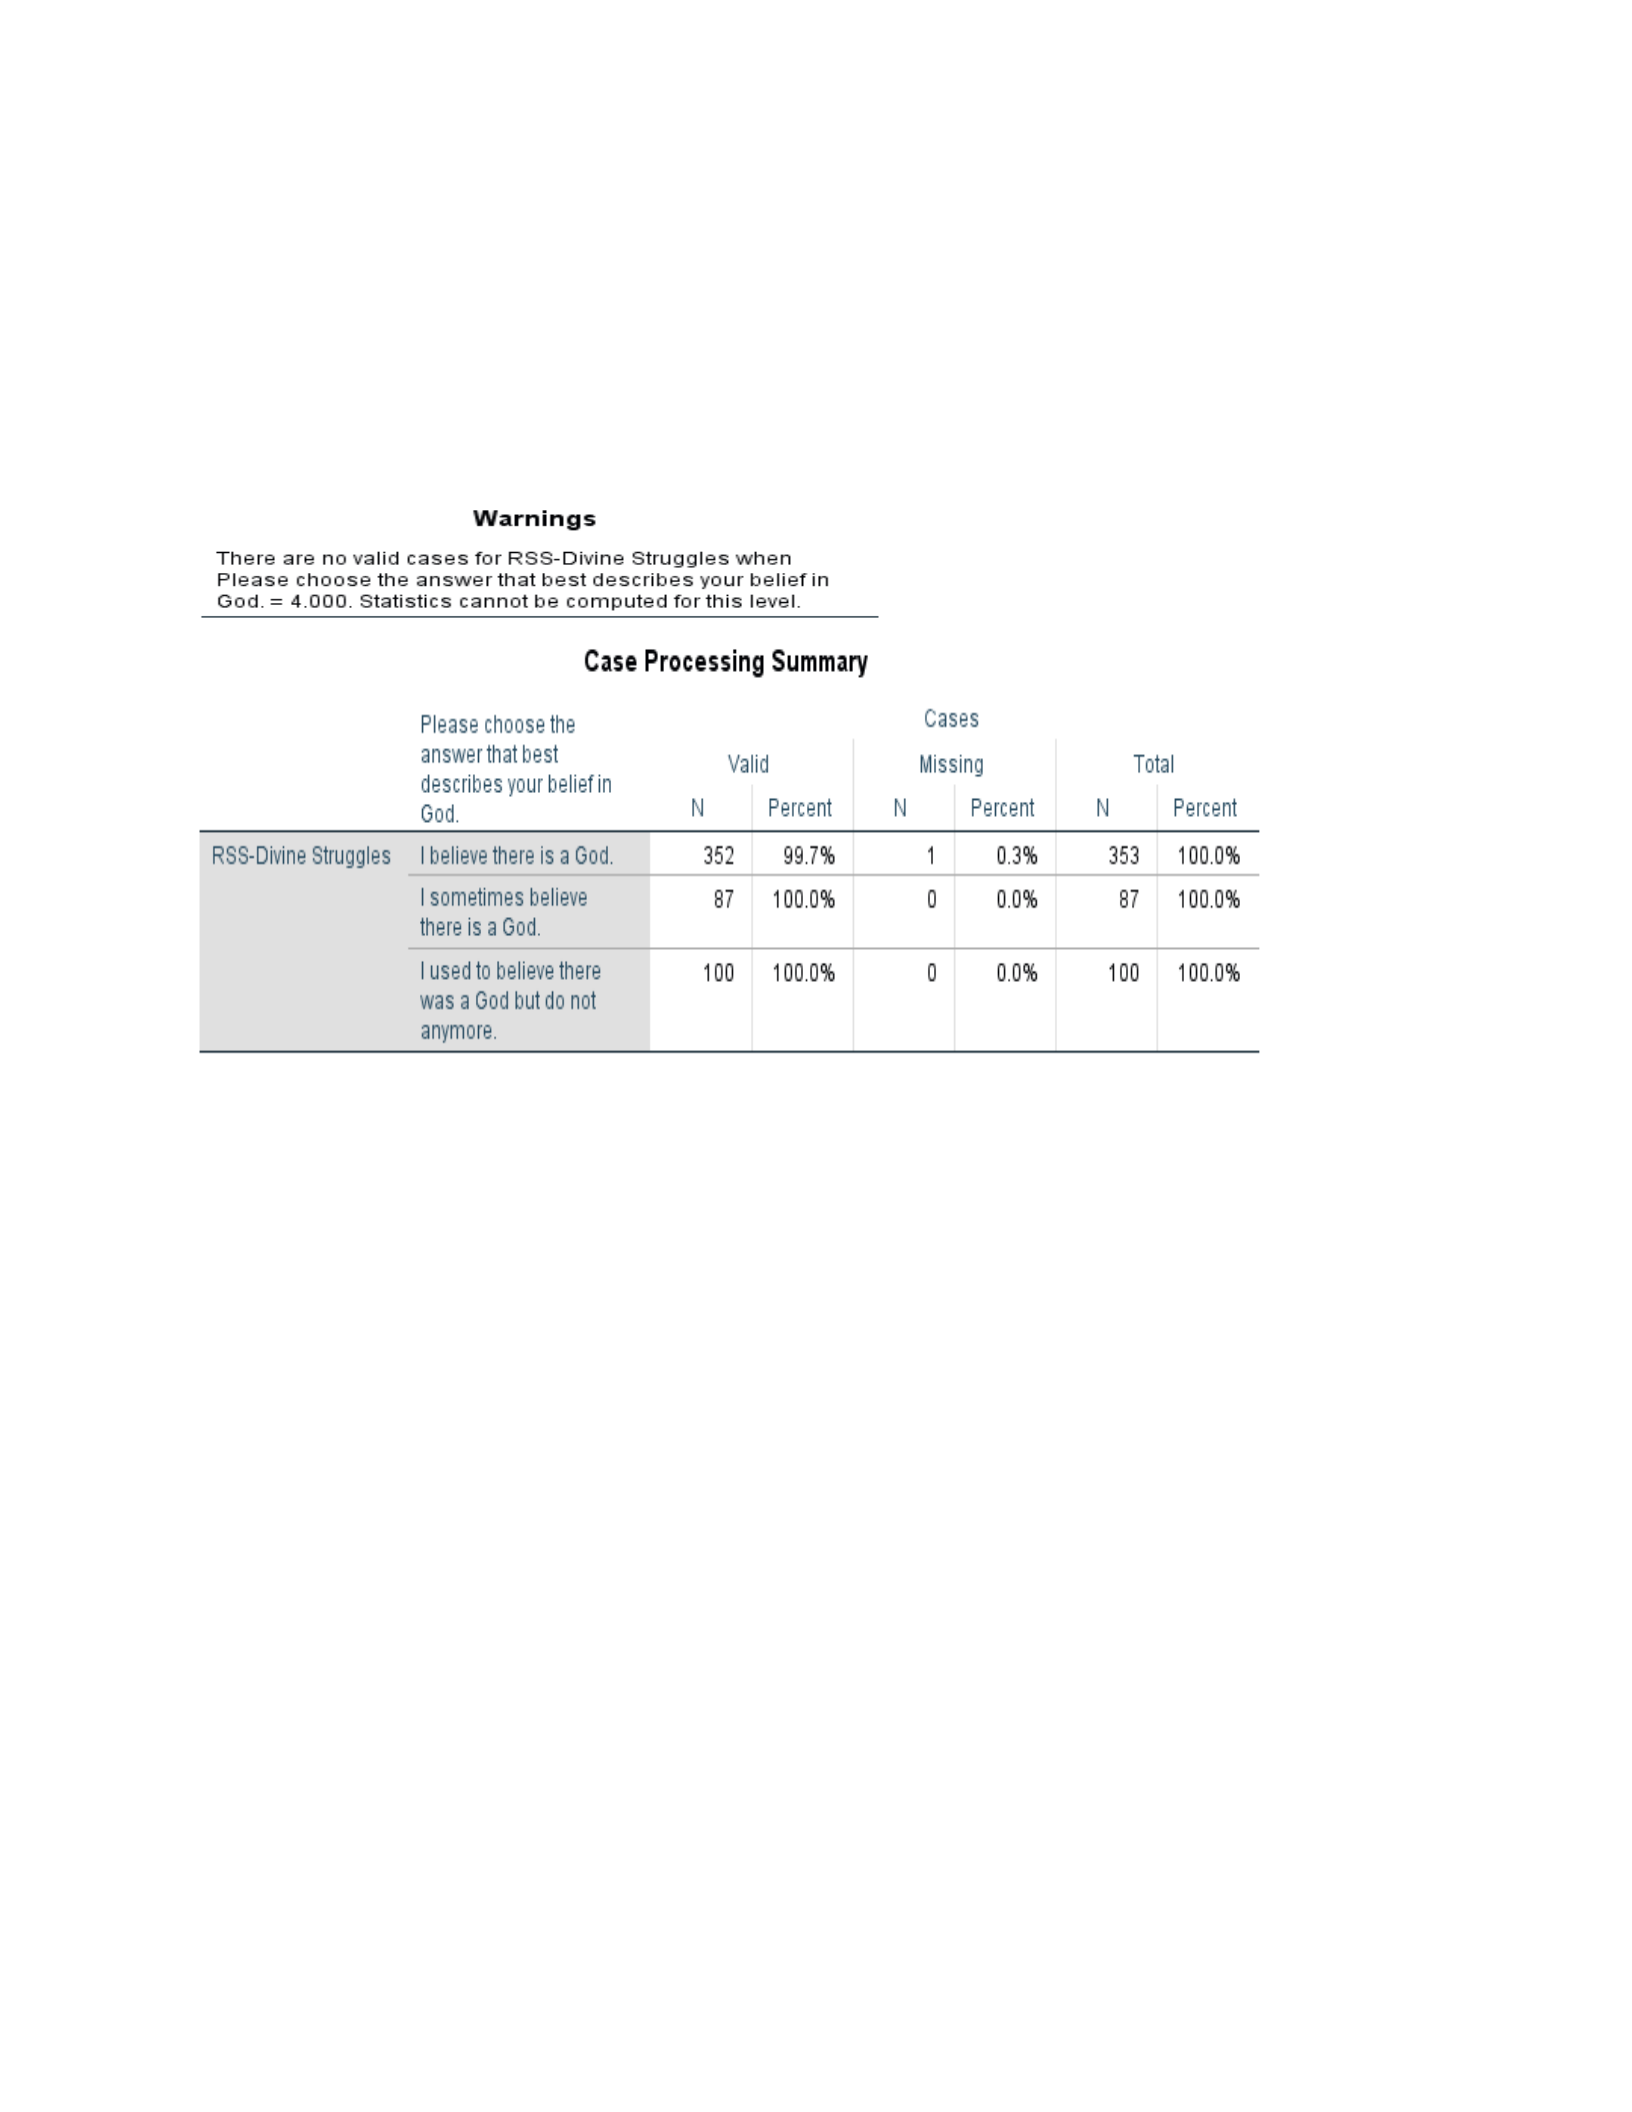
Case Processing Summary
Please Choose the Answer that Best Describes your belief in God.
Valid Case Missing. Total
N Percent N Percent N Percent
RSS-Divine Struggles
I believe there is a God.
352 99.7
1 0.3% 353 100%
I sometimes believe there
is a God.
87 100.0% 0 0.0% 87 100%
I used to believe there
was a God but do not
anymore
100 100.0% 0 0.0% 100 100%

5.005
4.004
e
Struggles
3.004
2.004
1.004
152
503
6-70
504
520182
‘asc?
520
002
335°577,
O21
09
072509?
0.1599
ogra
107
159
4480
104
637
973
358
*
273
4
264
believe
there
is
a
God,
|
sometimes
believe
there
is
@
God
lusedto
believe
there
was
a
God
but
do
not
anymore:
Please
choose
the
answer
that
best
describes
your
belief
in
God.
10
Data Screening Between Group Output
RSS-Divine Struggles
Independent t-Test

11
Data Screening Between Group Output
Group Statistics
Please Choose the answer that best describes your belief in God.
Rss-Divine Struggles
N Mean Std. Dev. Std. Error Mean
I believe there is a
God
352 1.6028 .95987 .05116
I used to believe
there was a God but
do not anymore
100 1.1860 .67285 0.6729
Independent Samples Test
RSS-Divine Struggle
F. Sig t. df. Sig. (2-tailed). Mean Std. Error Lower and Upper
Equal
Variance
Assumed
34.844 .000 4.067 450 .000 .41684 .10250 .21539 .61829
Equal Var.
not assumed
4.931 225.324 .000 .41684 .08453 .25028 .58341
Univariate Analysis of Variance
95% Conf.
Inter. Of Diff
t-test for Eq.
of Means
Leven’s Test for
Equality
of Variance

12
Data Screening Between Group Output
Between-Sub. Factors Value Label N
Please Choose the Answer that best
Describes your belief in God. 1. I believe there is a
God. 352
I sometimes believe
there is a God. 87
2
3 I used to believe
There was a God but 100
do not anymore.
Descriptive Statistics
Dependent Variable: RSS-Divine Struggles
Please choose the answer that best
describes your belief in God.
Mean St. Dev. N
I believe there is God 1.6028 .95987 352
I sometimes believe
there is a God.
1.9184 1.08965 87
I used to believe there
was a God but do not
anymore.
1.1860 .6725 100
Total 1.5764 .9616 539
Tests of Between-Subjects Effects
Dependent Var.:RSS-Divine Struggles
Source Type III Sum
of Squares df. Mean Sq. F Sig.
Corrected
Model
25.633
α
2 12.831 14.623 .000
Intercept 910.536 1 910.536 1037.674 .000
God 25.662 2 12.831 14.623 .000

13
Data Screening Between Group Output
Error 470.328 536 .877
Total 1835.490 539
Corr. Total 495.991 538
a. R Squared=.052 (Adjusted R Squared=.048)
Post HOC Tests
Please choose the answer that best describes your belief in God.
eo
areiig
Geoneet
Givup
UME
Valicl
Missing
Total
RSS-Divine
Struggles
Frequency
1.00
321
4.20
27
1.40
22
1.60
23
1.80
16
2.00
19
2.20
4
2.40
9
2.60
4
2.80
4
3.00
12
3.20
8
3.40
9
3.60
1
3.60
10
3.80
3
4.00
4
4.20
5
4.40
2
4.80
1
5.00
7
Total
539
System
98
637
Percent
50.4
42
3.8
38
28
3.0
47
84.6
164
100.0
Valid
Percent
59.6
5.0
44
43
3.0
35
2.0
aT
2.0
2.0
2.2
1.5
AT
2
1.9
6
2.0
Cumutatve
Percent
59.6
34.6
38.6
72.9
75.9
79.4
314
33.1
35.2
37.2
30.4
30.9
32.6
32.8
34.6
35.2
37.2
38.4
38.5
aB.7
10.0
14
Data Screening Between Group Output

4004
3004
Count
2004
4004
1004.20
1.40 1.60
1
802.00
2.20 2.40
2,802.80
3.00 3.20
3.403350
3.60
380
4.00.4.20
4.40 4.80 5.00
RSS-Divine
Struggles
15
Data Screening Between Group Output
Graph

4007 Mean
=
1.55
‘Std.
Dev.
=
.96
N=539
300-4
&
200
100-4
od
1.00
2.00 3.00 4.00 5.00 6.00
RSS-Divine
Struggles
Descriptive
Statistics
N Minimum
Maximum
Mean
Std.
Deviation
Variance
Skewness
Kurtosis
Statistic
Statistic
Statistic»
Stats’
«Statistic
»=—Statistic
«Statistic
«Std.
Error
Statistic
Std.
Error
Please
choose
the
037
{
4
19
4146
134
782TH
1B
angwel
that
best
describes
yourbeliefin
God
RSS-Diine
Struggles
59100500
1.5764
9616
92)
1082830
Valid
(istwise)
59
16
Data Screening Between Group Output
17
Data Screening Between Group Output
Box Plot
Please choose the answer that best describes your belief in God.
RSS-Divine Struggles
DATA SCREENING 7

18
Data Screening Between Group Output
Independent t-Test
DATA SCREENING 8

19
Data Screening Between Group Output
Univariate Analysis of Variance
Post Hoc Tests
Please choose the answer that best describes your belief in God.

20
Data Screening Between Group Output
DATA SCREENING 9
Homogeneous Subsets

SAl-Awareness
of
God
100
80
Aouanbaly
20
494
476
459
433
4.24
4.00
3.76
3.53
3.29
3.12
2.94
2.76
2.63
2.50
2.35
212
1.94
174
159
144
1.24
142
1.00
SAl-Awareness
of
God
21
Data Screening Between Group Output

