The Software Development Life Cycle
The software development lifecycle (SDLC) is the progression of a software project through five SDLC stages:
1. Requirements: Figuring out and writing down what the software must do, how well, and under what
limitations or constraints.
2. Design: Determining how the software’s code will be structured and how users will interact with
the software.
3. Implementation: Using the requirements and design to code the software.
4. Testing: Checking that the code was written without fault (verification) and that the software is what the
users or client wants (validation).
5. Maintenance: Improving software’s existing functionality and code.
There are different ways to travel through the SDLC stages. Patterns of traveling through the stages are called
software process models. Commonly, people compare the Agile software process model with the Waterfall model.
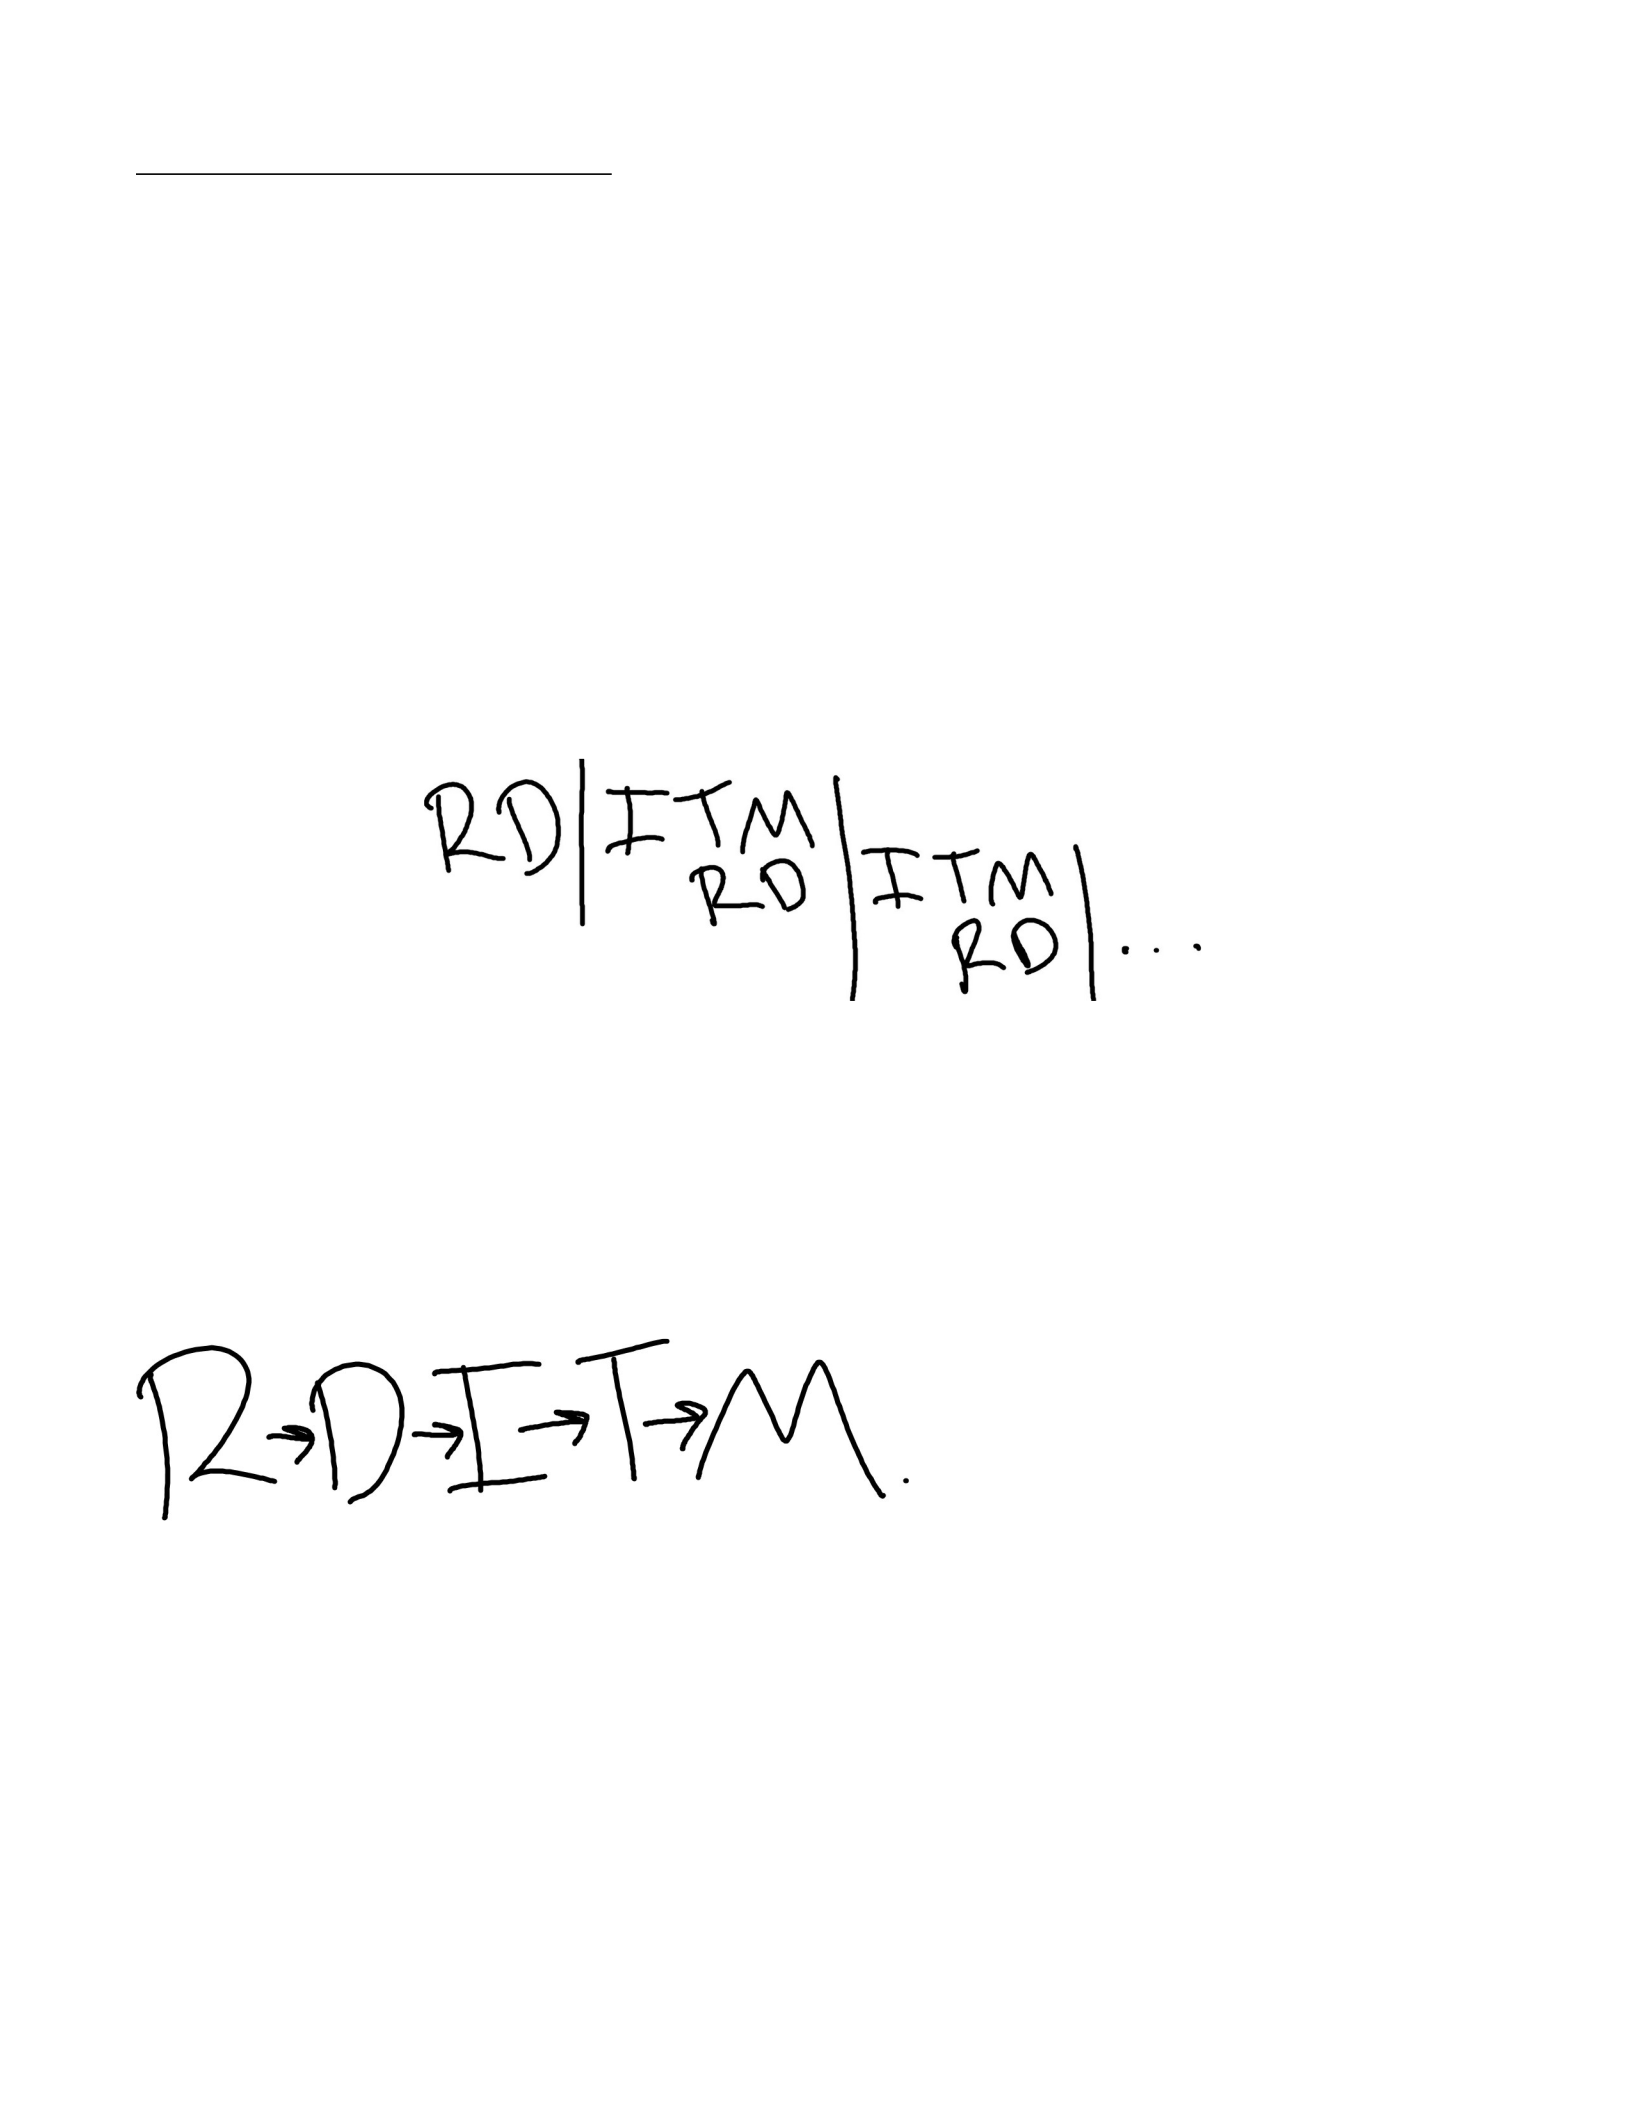
Agile, guided by the Agile Manifesto (Beck et al., 2001), moves through the SDLC approximately like in Figure
1.1.
Figure 1.1 How Agile Projects Move through SDLC Stages
Note. The vertical lines represent development cycle boundaries. Planning (R,D) for the next develop- ment cycle
starts during the previous cycle. R, requirements; D, design; I, implementation; T, testing; M, maintenance.
Agile development cycles are relatively short and numerous. Releases are frequent and incremental. Each cycle,
there’s a little more working functionality. There are multiple ways to go about developing and managing software
in an Agile way, such as by using the Scrum framework (Schwaber & Sutherland, 2020) or Extreme Programming
(XP) (Beck & Andres, 2004; Wells, 2013).
Waterfall moves through the SDLC approximately like in Figure 1.2.

Figure 1.2 How Waterfall Projects Move through SDLC Stages
Movement is fairly linear and sequential. Each stage depends on the previous stage having been com- pleted. Lots
of documentation is produced.
Ironically, people often associate Waterfall with an article that describes Waterfall’s major flaws. The second
figure in Royce’s (1970) article depicts the Waterfall model with seven stages and downward movement from one
stage to the next, suggesting that movement to the previous stage is not allowed—you can’t swim up a waterfall.
Later in the article, Royce suggests modifications to the Water- fall model, such as making and implementing a
preliminary program design (then going back to the requirements stage as needed).
Waterfall might not make sense for many software projects, but how about for building a bridge?
1.1.1 Why Care about Agile, Other Software Process Models, and Software Engineering Methods?
•So you can detect and/or understand what a software development team is doing. When you’re new to a team,
having a general understanding of different software process models can help you ask good questions,
identify what you see the team doing, and look competent in front of your team and managers.
The 2015 CHAOS report contains aggregate data about more than 25,000 software projects.
Some findings about software projects: 9% of Agile projects failed
29% of Waterfall projects failed 23% of large Agile projects failed
42% of large Waterfall projects failed 4% of small Agile projects failed
11% of small Waterfall projects failed

•So you have ideas to choose from when you need to select a software process model or method for a new project.
You might need to choose or recommend how your team proceeds.
•So you have ideas to choose from when a project is in trouble. According to CHAOS Report from the Standish
Group International, Inc. (2015), during fiscal years 2011 to 2015, 17% to 22% of software projects failed
of the 25,000+ software projects in their database, with the likelihood of project failure increasing
drastically with project size. Sometimes, you can save a project if you have the right methods.
Since this book is focused on Agile, the remainder of the chapter summarizes the Agile software process model,
one Agile framework (Scrum), and a few Agile methods.
1.2 Agile, Scrum, and Agile Methods
1.2.1 Agile
The Agile philosophy is summed up by the Agile Manifesto for Software Development (Beck et al., 2001):
Why does this book have a whole chapter about Agile and not one about Waterfall or any other software process
model? Because most organizations use Agile for software or IT projects.
For example, an HP survey of 601 respondents (Hewlett Packard Enterprise, 2017) found the following distribution
of what organizations use as their primary software process model:
•51%: Leaning toward Agile
•46%: Hybrid
We are uncovering better ways of developing software by doing it and helping others do it. Through this
work we have come to value:
Individuals and interactions over processes and tools.
Working software over comprehensive documentation.
Customer collaboration over contract negotiation.
Responding to change over following a plan.
That is, while there is value in the items on the right, we value the items on the left more.

•16%: Pure Agile
•7%: Leaning toward Waterfall
•2%: Pure Waterfall
Why do organizations choose Agile? According to HP, out of 403 organizations that have primarily adopted Agile,
the following percentage of respondents agreed with the following statements about Agile development:
•54%: Enhances collaboration between teams that don’t usually work together.
•52%: Increases the level of software quality in organizations.
•49%: Results in increased customer satisfaction.
•43%: Shortens time to market.
•42%: Reduces cost of development.
1.2.2 Scrum
Scrum is a well-known framework for software project management. It aligns with the Agile philosophy. For
example, the Scrum Guide (the ever-evolving manual for Scrum; Schwaber & Sutherland, 2020) says that to reflect
the “responding to change” value, a software project should be broken into development Sprints that are usually
two to four weeks long. Each Sprint has a Sprint Plan. Sprint Plans can be defined shortly before the Sprint; Teams
(and their customers) might only know what is happening with the pro- ject’s development for a couple weeks at a
time.
Scrum Teams fit their own methods into the Scrum framework, which the current version of the Scrum Guide
divides into three categories: the team, the events, and the artifacts. To give you a quick, conve- nient introduction
to Scrum, each element of the framework is listed below, by category.
The Team. The Scrum Team “consists of one Scrum Master, one Product Owner, and Developers.”
•Scrum Master: “accountable for establishing Scrum as defined in the Scrum Guide.”
•Product Owner: “accountable for maximizing the value of the product resulting from the work of the Scrum
Team.”
•Developers: “people in the Scrum Team that are committed to creating any aspect of a usable Increment each
Sprint.”

The Scrum Master’s focus is process, the Product Owner’s focus is the product (software), and the Developers’
focus is creating a product while following Scrum processes.
The Events. There are five Scrum events:
•The Sprint: fixed-length development periods of “one month or less . . . A new Sprint starts immediately after
the conclusion of the previous Sprint.”
•Sprint Planning: “initiates the Sprint by laying out the work to be performed.”
•Daily Scrum: “a 15-minute event for the Developers of the Scrum Team . . . focuses on progress toward the Sprint
Goal and produces an actionable plan for the next day of work.”
•Sprint Review: “to inspect the outcome of the Sprint and determine future adaptations. The
Scrum Team presents the results of their work to key stakeholders . . .”
•Sprint Retrospective: “to plan ways to increase quality and effectiveness . . . Scrum Team
inspects how the last Sprint went . . .”
A Sprint is a development period that occurs in a series of Sprints, which are each laid out during Sprint Planning.
Each day, the Developers have a 15-minute meeting about planning the next workday. Sprints end with a Sprint
Review (team and stakeholders) and a Sprint Retrospective (team only).
The Artifacts. There are three Scrum artifacts:
•Product Backlog: “an emergent, ordered list of what is needed to improve the product.”
•Sprint Backlog: “composed of the Sprint Goal (why), the set of Product Backlog items selected
for the Sprint (what), as well as an actionable plan for delivering the Increment (how).”
•Increment: “a concrete stepping stone toward the Product Goal.”
The Product Backlog contains a rough list of tasks the Scrum Team is planning to do some time, but the tasks
haven’t yet been scheduled and may not be defined in detail. The Sprint Backlog contains tasks the team has
decided to work on and has added details about completing the tasks. An Increment is an achievement toward
creating the product (e.g., finishing a feature implementation).
The Scrum Guide (Schwaber & Sutherland, 2020) describes the Scrum framework elements in more detail and
defines some of the terms that were unexplained here (e.g., Sprint Goal).

1.2.3 Agile Methods
There are several notable Agile methods that can be used within Scrum (or other frameworks, or other software
process models). A few of them:
•Scrum board: A way to organize and visualize tasks or work as cards on a board. The board has columns for
different categories, and each card is placed within a column. A Scrum board could be a physical bulletin
board with sticky notes or index cards. It is also a common feature of task man- agement software.
•Spike: A quick and to-the-point investigation for gathering information to help the team answer a question or
choose a development path.
User story: A short description of a software feature from the perspective of fulfilling a user need (e.g., using this
format: As a <role> I can <capability>, so that <receive benefit>). Tasks, priori- ties, time/cost estimates, and
acceptance criteria may be associated with a user story.
2.1 Why Learn about Project Management?
Why is there a chapter about project management if this book is intended for people who want to become or are
currently software engineers?

•You might become a project manager (e.g., your employer asks you to fill the role, or you’re inter- ested in a
new position).
•You might have a project manager. Understanding some basics of project management can help you
understand what they’re doing (e.g., using a RACI matrix to define who on the team does what) and what
they’re trying to tell you about the project.
•You might need to self-manage (e.g., within an organization that has a flattened hierarchy or within an
Agile team).
2.2 Triple Constraint
Project management is partially about optimization: How can we use our limited financial and personnel resources
to complete our project by the deadline, without going over budget? These concerns are often summarized as
needing to balance three constraints.
•Time: duration of the project, intermediate deadlines
•Cost: monetary, personnel, and other project resources
•Scope: what the project is meant to accomplish and the requirements of the project, including quality
This set of three is called the triple constraint.
It can be difficult to balance these three constraints. Common challenges:
•You’re meeting with a client who says, “Oh, I forgot to mention we want this feature. That won’t be a big
deal, right?”
•You realize late in the project that to implement feature A, you’ll need to implement B, C, and D as well.
•Your team’s estimates were overly optimistic (the planning fallacy).
These situations are so common that you can assume they’re going to happen and come up with a mit- igation
plan even before the project starts. But many situations are more complicated (more factors with
Authors in other fields sometimes consider quality separate from scope. In software engineering,
requirements include quality.

more interrelationships), more unique to your context, and have factors that leak from your professional life to your
personal life. Here are some examples:
•You’re working on a project with a friend who is an excellent coder but only available for the next three
months (time). They also have their own ideas about where they want the project to go (scope). You know
your friend will be more enthusiastic about the project if they have more con- trol, and that means quicker
implementation and less work for you (cost). But that’d mean sacrific- ing some of your own feature
priorities (scope).
•You’re working with a five-person team. Your colleague needs help, but all hours must be billed to a
project, you’re getting pressured to stay close to the budget, and you bill at a higher rate than your colleague
(cost). If your colleague doesn’t get help, they might spend extra hours self-training (cost), could switch to a
different project, and there’s a small chance they’ll make the project take longer (time). Scope is fixed: the
product must satisfy all its requirements.
Making strategic project decisions involves adjusting project constraints. If you want to reduce time and cost spent
on a project or increase project scope, you’ll need a corresponding change in one or more other constraints (van
Wyngaard et al., 2012).
2.3 Managerial Skill Mix
What skills are required for managing a project? There are three broad categories comprising the man- agerial skill
mix (MSM) (Badawy, 1995).
•Interpersonal: Communicating effectively with anyone likely to affect the project (e.g., engineers on your
team, managers, clients, contractors, IT support, etc.).
•Technical: Using methods and equipment effectively (e.g., knowledge of appropriate processes,
understanding and writing code, etc.).
•Administrative and conceptual: Understanding the “big picture” vision (conceptual) and being able to
move macro-level pieces (e.g., teams, departments, divisions, etc.) toward that vision (administrative).
High-level managers (e.g., CEOs) tend to need a different mix of skills than lower-level managers (e.g., project
managers). For example, a project manager might need strong interpersonal and technical skills while only
occasionally considering the big picture of how a project fits into organization’s overall vision

(Badawy, 1995). Since this chapter is about project management, we will focus on interpersonal and technical
skills.
2.4 Interpersonal Skills: Team Communication
One way to reduce risk is to improve team communication, which can increase the likelihood of pro- ject
success.
As background for this section, consider Tuckman’s model of team development (Stuart, 2014; Tuckman, 1965;
Tuckman & Jensen, 1977).
1. Forming: Team members become oriented through testing each other’s boundaries and establish- ing
dependency relationships with peers, leaders, and existing team standards.
2. Storming: Team members resist group influence, their peers, their peers’ ideas, and tasks.
3. Norming: Team develops cohesiveness, devises new standards and roles, and members express personal
opinions related to tasks.
4. Performing: Team roles become flexible; team dynamics and structure serve the function of the team and
task performance.
5. Adjourning: Team disbands.
The rest of this section discusses specific methods a team can use to improve communication. Consider where each
might fit in to these stages (there’s not just one answer).
2.4.1 Establishing Ground Rules
Team ground rules are a preemptive or reactive method for reducing team conflict and dysfunction. Ground rules
might already exist when a team forms, others might develop as the team becomes normal- ized, and revisions
might happen as the team proceeds with their work and identifies new team concerns or opportunities. To be
effective, the ground rules need buy-in from the whole team. What the ground rules should cover or should be
varies by team, but below are some questions that may help.
When deciding on ground rules, your team might choose to incorporate ground rules or standards
already established by others, such as the IEEE Code of Ethics (Institute of Electrical and Electronics
Engineers, 2020) or Agile Manifesto (Beck et al., 2001).

•What is our vision for what this team is or what we’re trying to accomplish together? (Clients choose us
because we’re honest and transparent.)
•What do we prioritize most? (Delivering a high-quality product ahead of the deadline, input from all team
members, honoring diverse end-users, making the big bucks.)
•What methods will we use for day-to-day communication? (No interrupting, no ’splaining, listen to and
acknowledge what other people are saying, ask people if they’re busy before starting a long conversation).
•What methods will we use to communicate with each other during conflict? (We’ll use nonvio- lent
communication, we’ll focus on the solving the problem instead of who to blame.)
•What expectations do we have for work habits? (Tuesdays from 1:00 to 3:00 p.m. is silent time; be five
minutes early to meetings.)
•What expectations do we have for responsiveness? (Respond within two hours during regular work hours;
have the team Discord open during regular work hours.)
•What will we do when team members fail expectations? (We’ll discuss any team problems on Fri- days at
3:00 p.m.)
•How will we get to know each other? (We’ll discuss each other’s cognitive styles; we’ll set up a chat
channel for socializing.)
The end product of answering questions like these could be a list of short statements that’s posted some- where
people will see it regularly.
The questions your team asks, and the answers, will vary depending on the individuals on the team and on context
(e.g., culture). Whatever those questions and answers are, ideally they will feel meaningful and authentic. If your
team gets the feeling the ground rules are silly, phony, too aspirational, too inflex- ible, or too authoritative, that
could invalidate your team’s efforts toward creating the ground rules.
2.4.2 Defining Roles and Responsibilities: RACI Matrix
A RACI matrix is a chart for defining who is responsible (R) and accountable (A) for a task or deliver- able, and
who should be consulted (C) or informed (I).
Example RACI Matrix. A RACI matrix is often formatted as a table, but it can also be written as a list, as in the
following example.

Project Phase: Minimum Viable Product (MVP)
•Focus groups
◦Frontend Developers: C
◦Frontend Designers: R
◦Frontend Lead: R / A
◦Backend Developers: C
◦Backend Lead: C
◦Team Lead: R / A
•Requirements specification
◦Frontend Developers: R
◦Frontend Designers: R
◦Frontend Lead: A / I
◦Backend Developers: R
◦Backend Lead: A / I
◦Team Lead: C / I
•Throwaway code design
◦Frontend Lead: I
◦Backend Developers: R
◦Backend Lead: A
◦Team Lead: I
•Implementation
◦Frontend Developers: R
◦Frontend Designers: C
◦Frontend Lead: A

◦Backend Developers: R
◦Backend Lead: A
◦Team Lead: C / I
•User acceptance testing
◦Frontend Developers: R
◦Frontend Designers: R
◦Frontend Lead: R / A
◦Backend Developers: R
◦Backend Lead: C
◦Team Lead: C / I
Interpreting a RACI Matrix. One person might have multiple roles. Task or deliverables can be organized into
phases.
•Responsible (R): Who will do the work.
•Accountable (A): Who will approve the work and make sure it gets done.
•Consulted (C): Who can discuss and offer advice about the work.
•Informed (I): Whom to keep up to date about the status of the work.
A RACI matrix is a method for reducing risk. If your team doesn’t know who needs to do what (or for- gets, or can
plausibly deny knowing), that can increase the probability of a negative events and outcomes (e.g., shipping a
broken product to customers because nobody was assigned to quality assurance).
2.4.3 Measuring and Building Consensus: Fist of Five Method
Meanings of single-finger hand gestures vary around the world. For example, in the United States,
putting your thumb up means “good job,” in Germany and Hungary it means “one,” in Japan it means
“five,” and in Australia, Greece, and the Middle East it means “up yours!” (Cotton, 2013).

Fist of five is a method for checking and building consensus within a group of people. One person (e.g., team
leader) makes a statement or proposes an idea to a group, and each person communicates their level or agreement
or support by holding up a fist or up to five fingers. It has become associated with Agile (Belling, 2020), but
students of different ages use it, too (e.g., Fletcher, 2002; Hulshult & Krehbiel, 2019).
What each number of fingers means:
•None: Strong reject. Blocks consensus.
•One: Reject. Major issues need resolving now.
•Two: Weak reject. Minor issues need resolving now.
•Three: Weak accept. Minor issues can be resolved later.
•Four: Accept. No issues.
•Five: Strong accept. Willing to lead or champion.
If anyone suggests rejecting the statement or idea by holding up two or fewer fingers, the team can stop, discuss,
make changes, and vote again until there’s sufficient consensus. It’s up to the team or its leader to decide how
much consensus is needed.
The fist of five method can reduce risk by (1) bringing problems to light and (2) increasing team motiva- tion,
ownership, and investment.
2.5 Technical Skills: Project Definition
This section contains methods for helping with the technical side of defining a project, including defin- ition of
scope, prioritization, estimation, scheduling, and task management.
2.5.1 Project Scope
In an Agile software development environment, a project’s scope is implied through sets of tasks (e.g., release plan,
Product Backlog, iteration plan, Sprint Backlog). Each iteration might have a goal (e.g., a Sprint Goal) that
summarizes what the set of tasks is meant to accomplish, which is also part of defining scope for Agile projects.
The scope is purposely flexible and emerges as the project proceeds.
In other environments, the project scope (a.k.a. statement of work) is a specific document stating the pro- ject’s
objective, deliverables (outputs), milestones, technical requirements, and limitations/exclusions.
2.5.2 Balancing Constraints: Project Priority Matrix
Above, we talked about the three major constraints of project management—time, cost, and scope—and that
balancing them isn’t always straightforward. What should the balance be? How do I know whether I’m achieving
balance? How does this fit into how the project is run? One method for more concretely stating the desired balance
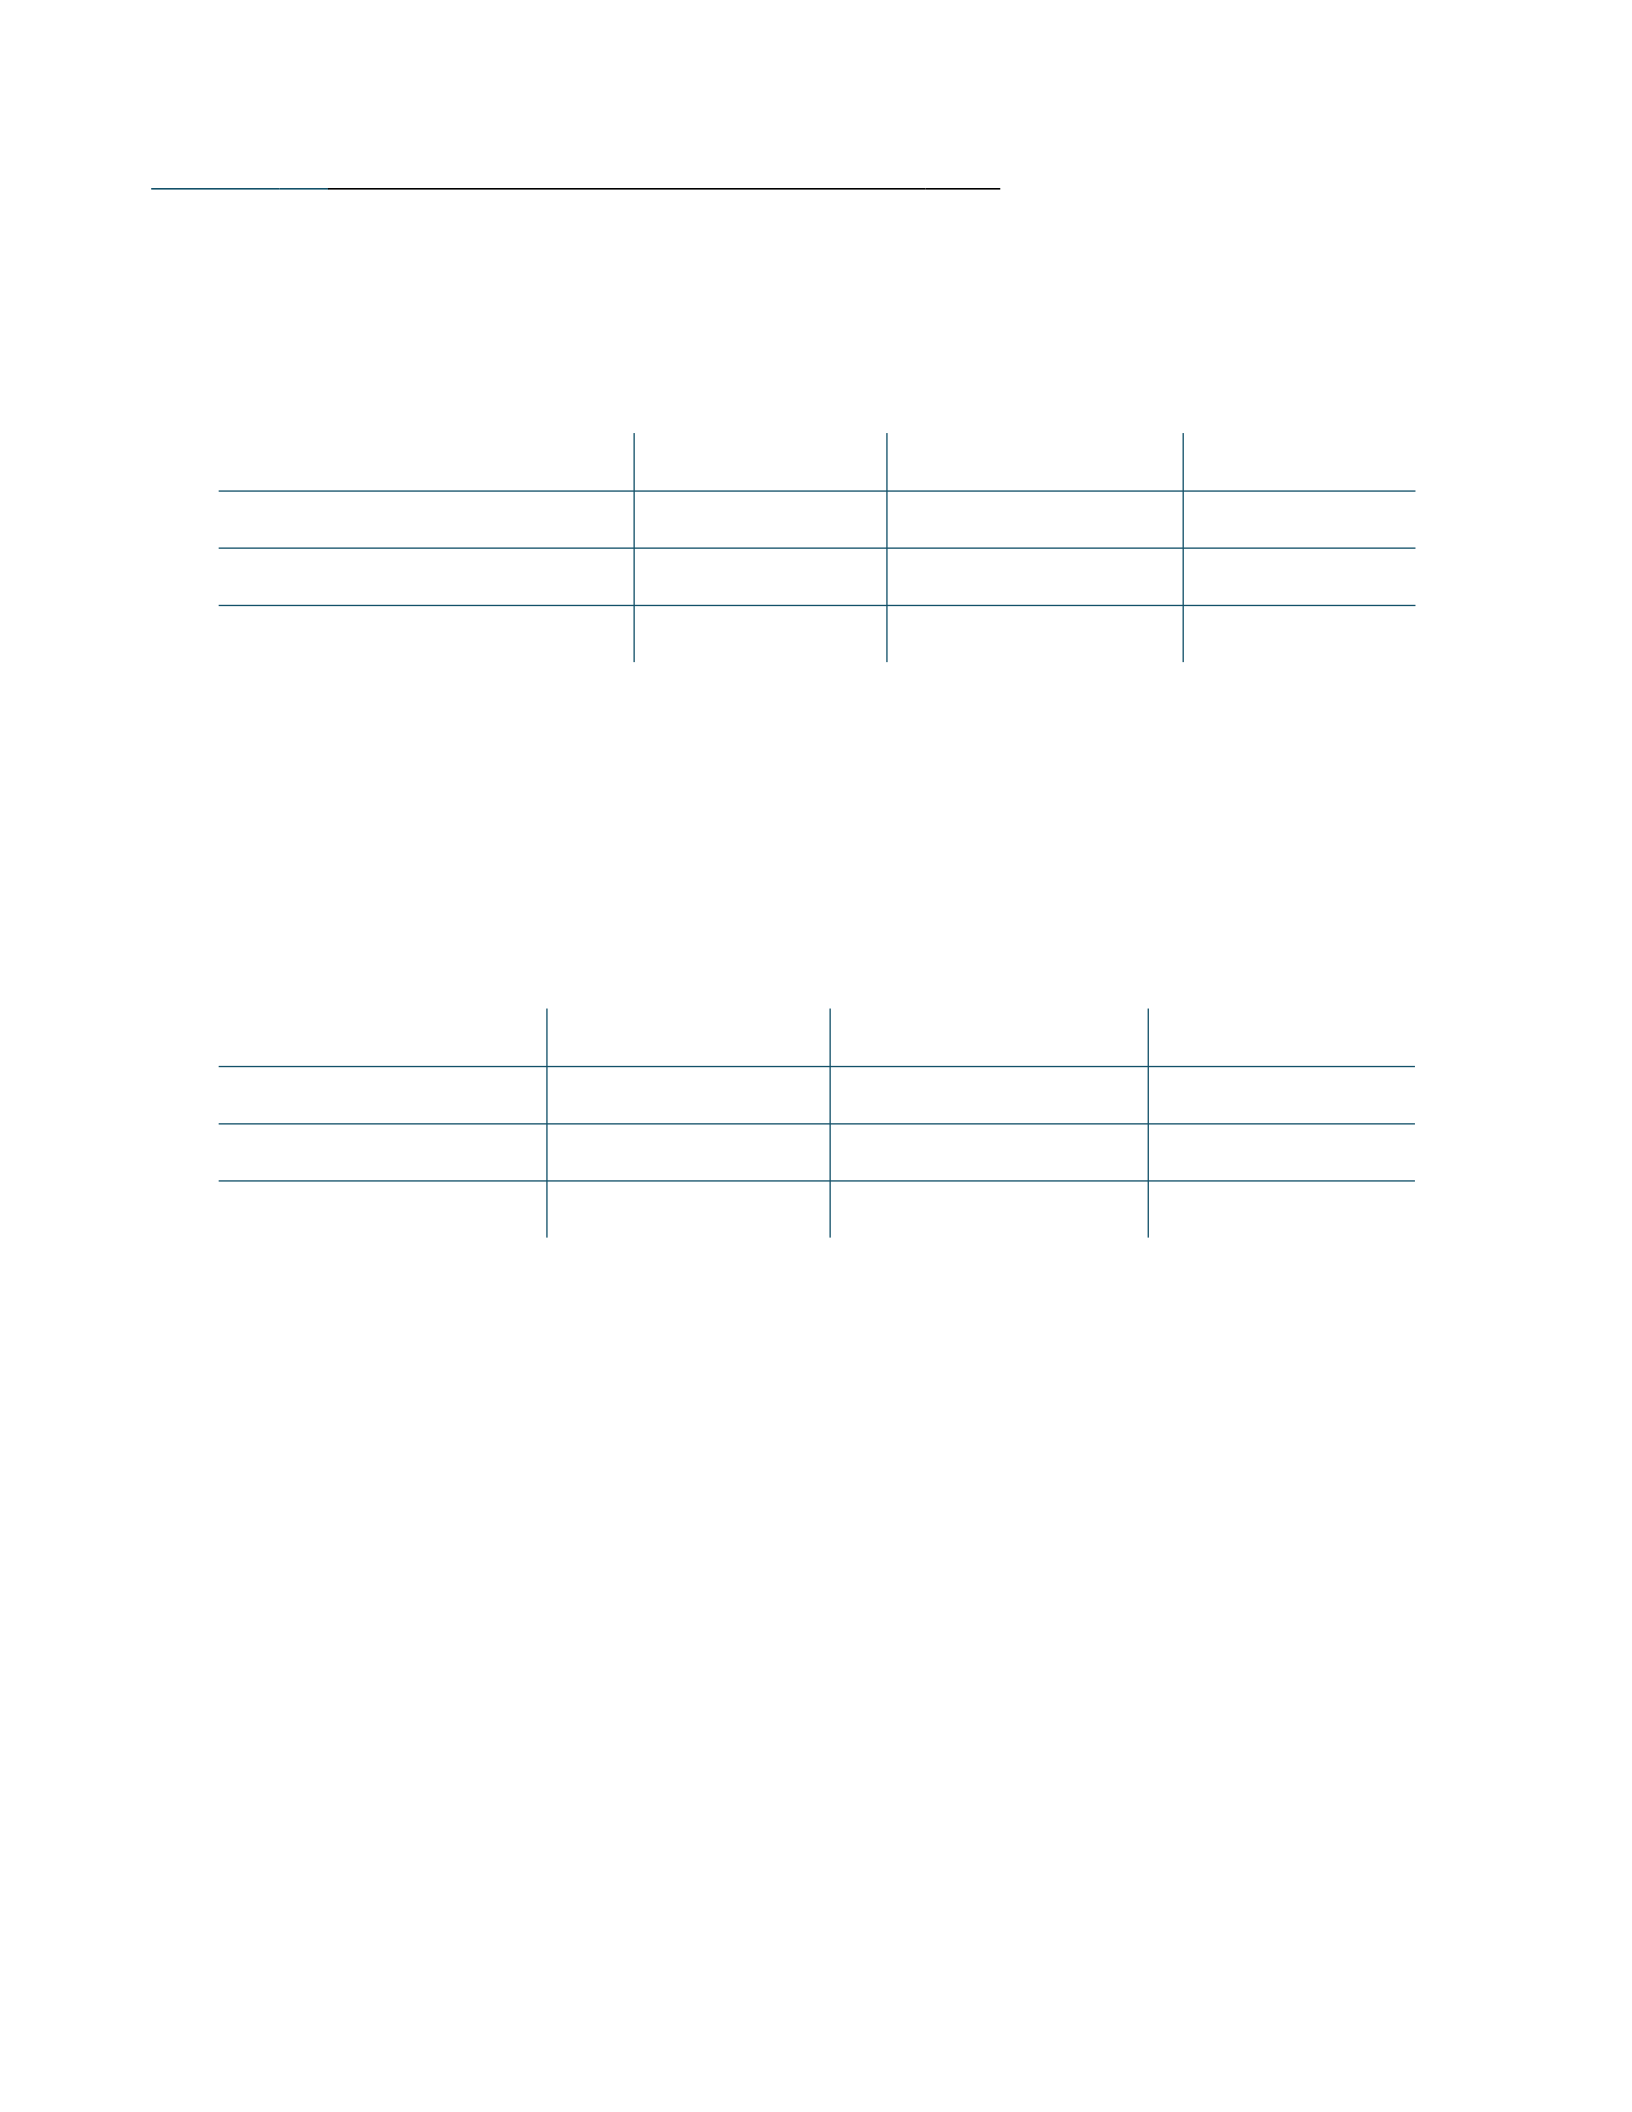
is the project priority matrix. Table 2.1 shows a sample blank project priority matrix.
Table 2.1 Blank Project Priority Matrix
Time Scope Cost
Constrain
Enhance
Accept
•Constrain: The constraint is fixed (can get better but must not get worse).
•Enhance: Try to improve (e.g., take less time, spend less, have more features).
•Accept: Can worsen (e.g., more time, more personnel, fewer features) if necessary.
Table 2.2 shows a sample completed project priority matrix. For this example, imagine you have a grant from the
National Institutes of Health (NIH) to write and test software for a medical device that automat- ically regulates a
person’s pain level.
Table 2.2 Completed Project Priority Matrix
Time Scope Cost
Constrain ✓(cost)
Enhance ✓(scope)
Accept ✓(time)
Note. The text in parentheses is provided to make the table screen-reader-friendly. Each checkmark in the filled
example represents the following.
•Scope: Fixed. Your team must do what they said they’d do and cannot scrimp on quality. If the device only
partially works, that would be a disaster—you’ll be testing it on human subjects!
•Cost: Needs to be tightly controlled because the grant is for a fixed amount and funded by taxpay-

ers.
•Time: While the project hopefully stays on track and delivers as promised, if needed, your team can submit
intermediate results to the NIH and perhaps use those results to get another grant.
Ideally, the project priority matrix would be defined before the project starts (with the client) and refer- enced
throughout the project as needed. Developing and adhering to the matrix can reduce risk by help- ing the team or
project manager balance constraints in ways that are acceptable to the client.
2.5.3 Task Prioritization: Eisenhower Matrix
Individual tasks, too, need relative prioritization. In an Agile Scrum environment, this would be the responsibility
of the Product Owner and in Agile Extreme Programming (XP), it’s the customer.
But how are task priorities decided? One high-level method is called the Eisenhower matrix (Table 2.3).
Table 2.3 Eisenhower Matrix
Urgent Not Urgent
Important Do Decide
Not Important Delegate Delete
Each cell in the Eisenhower matrix means the following.
•Do (urgent, important): Needs to be done correctly and now. An example is documenting your
undocumented code so that a new hire can start contributing.
•Decide (not urgent, important): Needs to be done correctly but not immediately. An example is refactoring
your currently working code. Such a task needs to be done eventually and done right—maybe the new hire
can handle it in a couple months.
•Delegate (urgent, not important): Needs to be done now, but mistakes can be absorbed (e.g., toler- ated,
corrected later). An example is needing to initialize the task management system so the team can begin
defining tasks. If it’s not done right, that’s fine—the developers and managers will adjust the setup as
needed. The task would be a good learning task for the new hire, who doesn’t have much to do right now.
•Delete (not urgent, not important): Doesn’t need to be done correctly or any time soon. Can be eliminated.
An example is implementing a loading screen that looks like a game of pong, but you’re the only one on the
team who thinks that’s a cool idea.

Doing a first-pass task prioritization using an Eisenhower matrix can reduce risk by both conserving resources and
using resources thoughtfully (including yourself). It can also help with getting out of the mode of “putting out
fires” (concentrating on the urgent tasks), which can result in important but nonur- gent tasks getting eternally left
at the end of the to-do list (perhaps resulting in project failure).
2.5.4 Finer-Grained Prioritization
What happens when there are multiple important tasks to complete that have the same level of urgency? How
does one decide which is more important? Here are some methods for deciding which task has higher priority when
they seem roughly equivalent.
•For implementation tasks (e.g., coding, architecture, other implementation choices, etc.), ask an expert.
They might know from experience which tasks have more unknowns, more risk, depen- dencies, and so on.
•If it’s an implementation task and you’re meant to be an expert, you can do a focused research effort called a
spike to gather more information about the task, which in turn can help you priori- tize it. To do a spike:
1. Come up with a question.
2. Try to figure out the answer by reading (e.g., documentation, other people’s opinions) and
experimenting (e.g., coding in a sandbox). You will probably get ideas for more questions in the
process.
3. Repeat until you have enough information.
A good way to do a spike is to start doing the task and see what obstacles you run into. Example: You need to set
up a local server for testing and then write a test suite. You have experience writing test suites but have never set up
a server. After doing a spike, you realize that some of the tests you’re going to write rely on the local server having
a static IP address, which you learned is not the default. Based on your findings, you decide to prioritize the server
setup because (1) the test suite depends on it and (2) the server setup task still has many unknowns, and you’re not
sure how long it’ll take to eliminate those.
•Think about dependencies: Who’s waiting on you to complete the task? How many other tasks depend on
this task? Example: You estimate it’ll take 15 minutes to complete a task that two other people are waiting
on. You decide to do that before your four-hour task. Seems like the obvious choice—but if you’re not
aware of which tasks depend on yours or are deep into solo work mode,

you might make a suboptimal choice.
•If you’re deciding which feature to implement, you can ask the customer or users directly (e.g., through a
phone call, focus group, survey) or indirectly (e.g., by looking at support tickets, asking the marketing team,
detecting an unmet need based on how people use other software).
•Other ways to select features include voting (e.g., within your team) or pairwise comparison (e.g., Is Feature
A more valuable than Feature B? If so, is Feature C more valuable than Feature A?).
A natural side effect of prioritization is finding how long it’ll take to complete a task, what dependencies exist, who
the players are, and what the end user wants. All this knowledge contributes to risk mitigation.
2.5.5 Estimation: Story Points, Ideal Days, and Planning Poker
Intertwined with prioritization is estimation, or figuring out ahead of time how long a task is likely to take. But
what does “how long” mean, and how do we figure it out ?
According to the Agile community (Cohn, 2006), there are two methods for stating the size of a task.
1. Story points: Assign a number to a task representing its size relative to other tasks. For example, a software
installation and a virus scan might both be a 1 if they take roughly the same amount of time and effort, have
roughly the same amount of risk, and the like. Implementing a major feature might, however, be an 8. Your
team decides how far the scale goes.
2. Ideal days: Assign a number of days you think it’d take to complete the task if there were no other tasks or
distractions. For example, if it takes me 5 minutes to remove a single square foot of grass from my lawn and
I have 100 square feet to remove, that is 8 hours and 20 minutes total, so about one ideal day (if your
workdays are 8 or 9 hours).
Once story points or ideal days are assigned, a team can make statements like, “This month, we will complete 50
story points,” “10 ideal days,” and so on. Work completed (in story points or ideal days) is, in Agile teams, called
the velocity. Teams can make initial estimates about velocity and then adjust depending on how accurate those
estimates end up being.
Common scales for story points are 1 to 10, Fibonacci, and powers of 2. The latter two are meant to help
make sizing a task easier by putting more distance between the numbers in the scale; decid- ing
between a 4 and an 8 can be easier than deciding between a 4 and a 5.
But how are estimates assigned to a task? Another Agile idea is planning poker (Cohn, 2006; Mahnič & Hovelja,
2012). With this method, the team gets together to discuss a set of tasks, and each person gets a set of cards with
the different possible story points, ideal days, or other aspects a task can be assigned. One person describes the
task, the team asks questions as needed, and then each person privately decides on an estimate by selecting a card
(keeping it face down or hidden). Once everyone is ready, the cards are revealed. Variations in estimates are
expected, and part of the process: differences open a discussion. Someone making a high estimate, for example,
may think of good reasons why a task is likely to take a long time. Someone making a low estimate may identify an
efficient idea nobody else thought of. The team discusses and, once ready, can repeat the process until estimates
become sufficiently consistent.
2.5.6 Scheduling: Project Network Diagram
Once a set of tasks has been defined, prioritized, and estimated, those tasks can be scheduled. Scheduling a task is
placing it within the time line and context of a project. The context of a project includes other tasks, personnel, and
non-personnel resources (e.g., equipment), and milestones. One method for defin- ing and visualizing a project’s
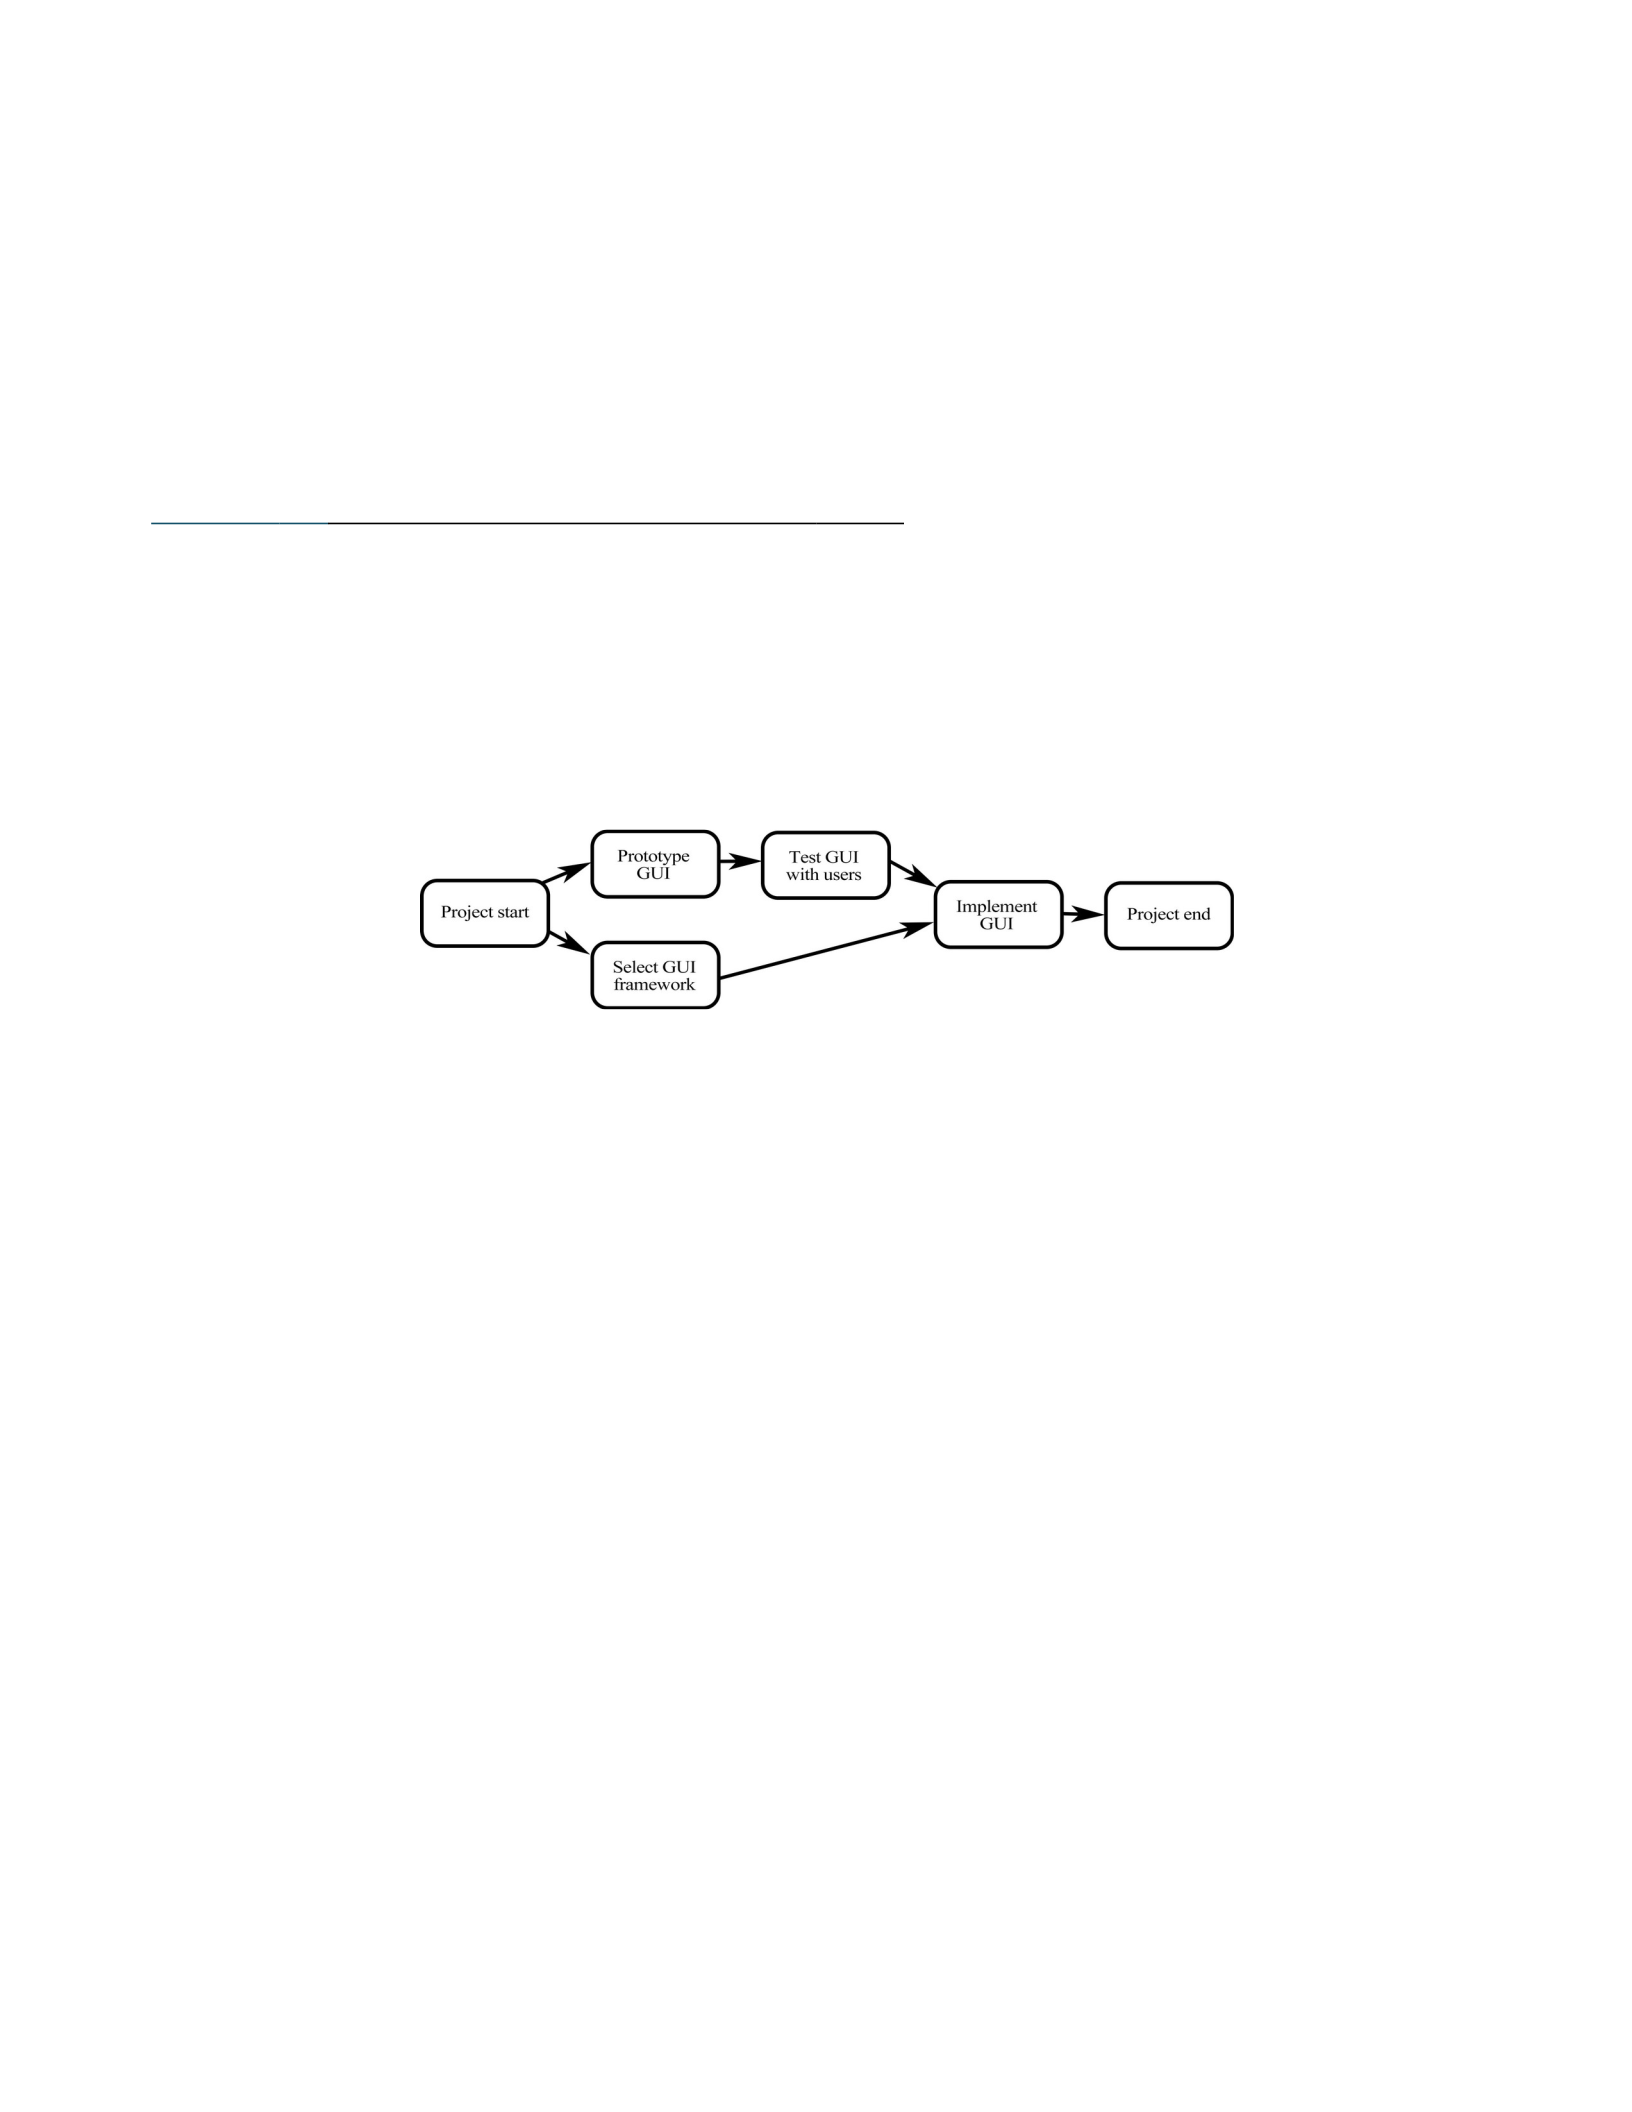
schedule is using a project network diagram, which is a directed graph showing a project’s tasks, the sequence in
which they should be completed, and the dependency relation- ships between the tasks. The nodes in the digraph
represent tasks, and the lines with arrows represent dependency or sequence relationships. A project network
diagram moves left to right, where left is ear- lier in time. Figure 2.1 shows an example.
Figure 2.1 Example Simple Project Network Diagram (No Estimates)
Note. This format of project network diagram is called Activity-on-Node (AON) (Larson & Gray, 2018).
For a task to be represented as a node on a project network diagram, it needs to (at a minimum) be dis- tinct from
other tasks, and its dependent tasks (a.k.a. predecessors) must be known. A project network diagram becomes more
useful if estimates for the tasks are also known, however.
Constructing a project network diagram. A project network diagram can be created manually or auto- matically
generated by software. To automatically generate a project network using software (e.g., MS Project, Lucidchart),
you’d need to enter the project data in tabular form, such as in a spreadsheet. Table
2.4 shows an example.

Table 2.4 Project Scheduling Data
Task ID Task Predecessors Duration (hours)
4 Implement GUI 1,3 50
3 Test GUI with users 2 5
2 Prototype GUI 8
1 Select GUI framework 2
Note. These data could generate the project network diagram in Figure 2.1.
In Table 2.4, even though Task 2 must happen before Task 4, it’s not listed as a predecessor because it’s not an
immediate predecessor.
Depending on the software you choose for creating your project network diagram, you might have access to more
complex options like specific dates by which individual tasks must be completed.
2.5.7 Task Management Systems
A task management system can be used to organize tasks, task details (e.g., description, acceptance cri- teria,
assignee, status), and other relevant information (e.g., which iteration or phase the task belongs to). They’re useful
for organizing and storing information about tasks, but also for the satisfaction of marking a task as done! Task
management systems like Asana, Jira, and Trello are strongly oriented toward team collaboration. Some of these
systems are also Agile oriented in that they offer Agile-inspired features (e.g., templates).
Common features of task management systems:
•Create, remove, update, and delete tasks.
•Enter task name, description, notes/comments, and add attachments.
•View tasks as a list, as cards on a board, or within a time line (e.g., Gantt chart).
•Organize tasks into projects.
•Assign tasks to different team members, with due dates.
•Enter task status (e.g., in progress, done).
•Get email notifications about tasks.
•Add tags, keywords, and categories.

Task management systems don’t have a universal way to generate project network diagrams. For that, you might
need a fully featured project management system (e.g., MS Project). But you may find that a Gantt chart or road
map feature meets your needs and is available within your task management system.
3.1 Types of Requirements
There are two main types of requirements:
1. Functional requirements are “A description of a behavior that a system will exhibit under specific
conditions” (Wiegers & Beatty, 2013, p. 599). For example, “If the user activates the ‘log in’ but- ton, the
login page will appear.” Functional requirements answer the question, “What must the software do?”
2. Nonfunctional requirements are “A description of a property or characteristic that a system must exhibit or a
constraint that it must respect” (Wiegers & Beatty, 2013, p. 600). For example, “If the user activates the ‘log
in’ button, the login page will appear within 500 milliseconds.” This non- functional requirement has a
characteristic that the system must exhibit: responsiveness. Respon- siveness is also called a quality
attribute. An example of a nonfunctional requirement about
respecting a constraint is, “The GUI toolkit must be able to display non-rectangular windows.”
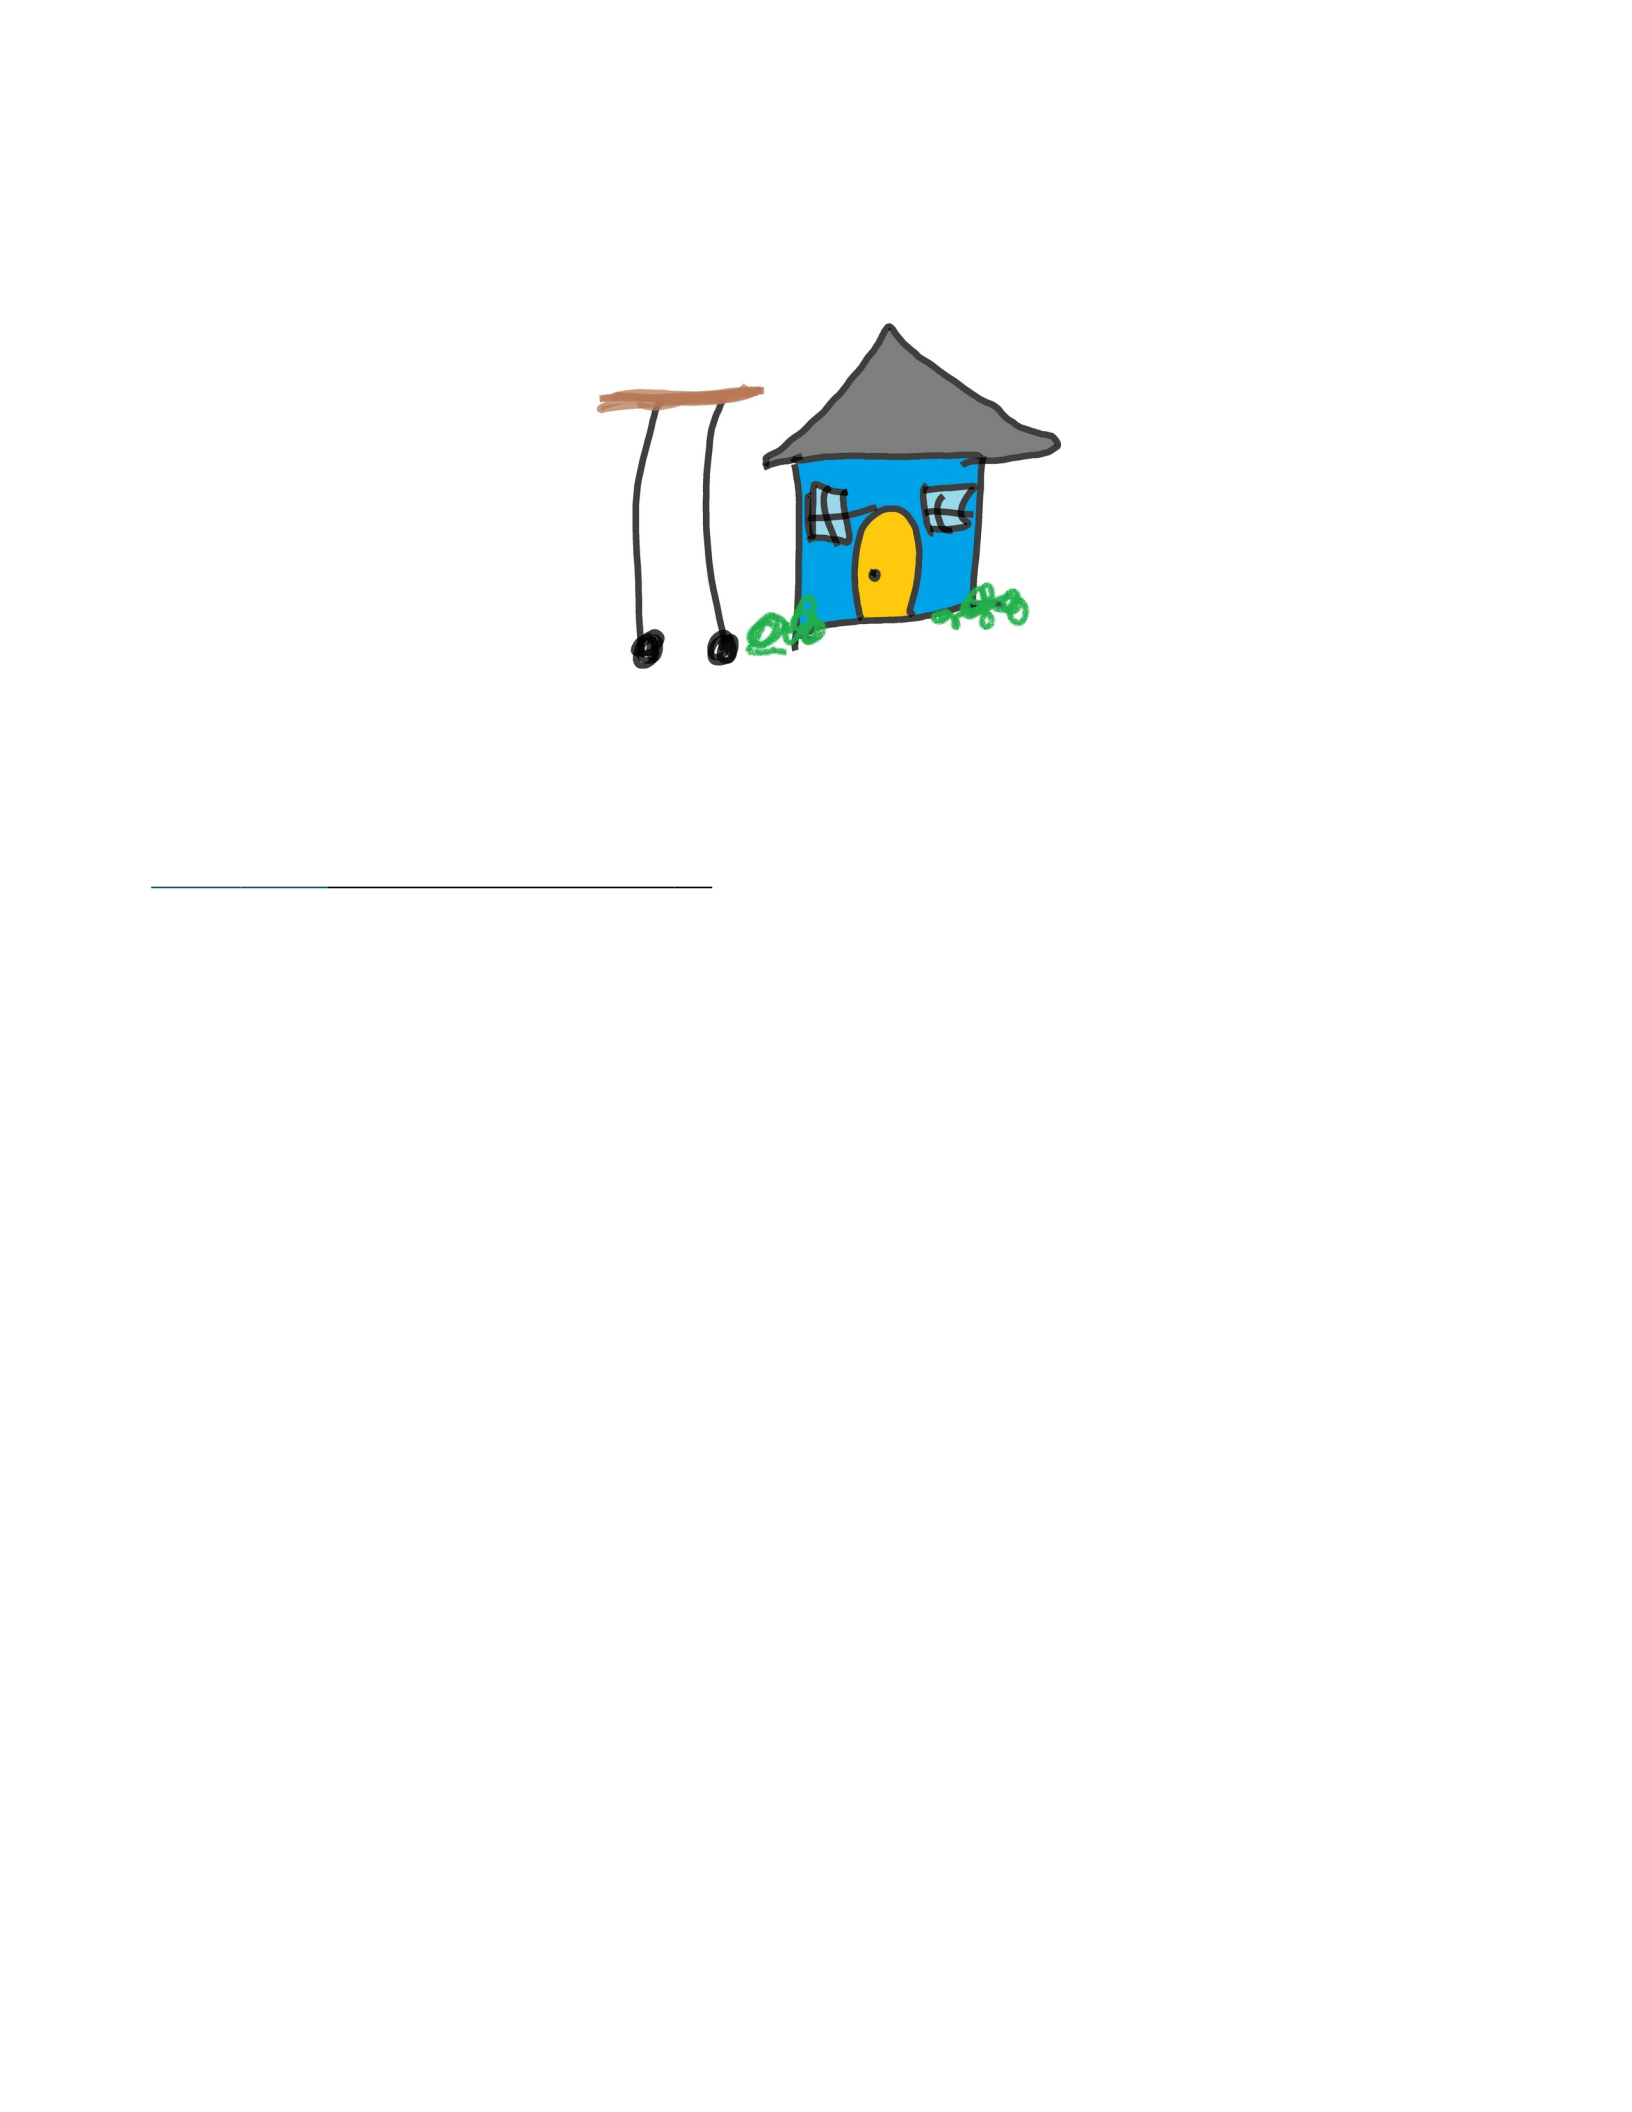
Figure 3.1 shows a simple example of a design failing to reflect a nonfunctional requirement and a func- tional
requirement.
Figure 3.1 Two Failed Requirements
Note. This rolling table fails the nonfunctional requirement of fitting through an average door and the functional
requirement of having four legs.
3.2 Why Requirements Matter
The design and implementation of software should, ideally, follow from the requirements. Here are some
ways requirements are helpful and reasons they are important:
•When developers aren’t given requirements, they might prioritize functionality they personally think is
important or fun to implement, but what developers want to implement might not make the project
successful.
•When multiple developers are working on the same code, requirements can help them stay in sync and
pursue the same goal. Without requirements, time, effort, and money can be wasted implementing
conflicting code.
•When requirements aren’t specified, it’s easier for project stakeholders (e.g., clients, partners, investors,
consultants, management) to influence the project toward satisfying their own (possi- bly fleeting) wants
or needs. This can result in the project drifting away from what it was origi- nally intended to do—and can
lead to project failure.
•Requirements are helpful for communicating about software with stakeholders, keeping track of
everything that needs to get done, and helping you and the client decide what really needs to get

done (clients sometimes don’t know what they really need).
3.3 What Makes a Good Requirement
Teams or organizations can choose their own standards for what makes a good requirement. Here is one set of
standards (Texas Department of Information Resources, 2008):
Requirements should be . . .
•Correct: What they say is right.
•Unambiguous: There is only one way to interpret them.
•Complete: They cover all that’s important.
•Consistent: They aren’t contradictory.
•Ranked for importance and/or stability.
•Verifiable or testable: There’s a way to figure out if they’re satisfied.
•Modifiable: They can be changed.
•Traceable: It’s possible to figure out where they came from.
Requirements should also be . . .
•Cross-referenced to earlier documents that relate.
•Uniquely identifiable.
•Organized for maximum readability.
3.4 Requirements Elicitation
The process of gathering requirements is called requirements elicitation. Requirements can come from any
stakeholder, including clients, managers, users, governments, developers of software to be integrated with yours,
the development team, and yourself. Requirements elicitation involves both detecting stake- holders’ wants and
needs and using your professional judgment to decide which requirements to focus on.

To detect stakeholders’ wants and needs, communicate and observe. Some methods:
•Interviews: Structured (questions defined ahead of time), semi-structured (some questions prede- fined,
some generated during interview), or unstructured conversations.
•Focus groups: Small, group conversations in which the participants discuss topics among them- selves, with
moderator guidance.
•Lab studies: Participants perform tasks in a controlled setting (e.g., try to use an early prototype, then give
feedback).
•Exploratory research: Multiple methods of immersing oneself within the world of relevant peo- ple and
products, with the purpose of gaining knowledge and developing empathy for stakeholders. For example,
after doing a fly-on-the-wall observation, you realize that people can’t find Aisle 25 because it’s in an
unexpected place. You decide to prioritize the Aisle Map feature in the store’s app.
Depending on the software development environment, these methods might be the jurisdiction of spe- cialist
researchers in marketing or interaction design. Hanington and Martin (2019) describe these specialist methods
(and many other relevant methods) in more detail.
Developers can elicit requirements, too, by having conversations with stakeholders. There are factors that can
affect the success of that approach, however.
•Stakeholders might not have experience or expertise. Developers can help bridge the gap between what
the stakeholder wants and what is technically feasible and reasonable (e.g., given time, cost, and scope, what
is also known as the triple constraint).
•Stakeholders might not have good ideas. They might be incorrect about what they or other peo- ple want
or will use. Developers can sometimes provide guidance toward better ideas, but develop- ers can also have
bad ideas. Methods such as focus groups, usability testing, and releasing a minimum viable product (MVP)
can help with figuring out whether users will use (and pay for) the software.
•Stakeholders might not know what they want. They may have a rough idea, or an idea that’s at odds with
their wants or needs.
•Stakeholders might want what’s bad for them or others. For example, users want apps that make their
face beautiful in photos, such features may promote unrealistic beauty standards.
•Stakeholders are humans. They communicate imperfectly.

With experience, you can learn how to effectively gather relevant information from stakeholders and make your
own judgments about how that information translates into requirements.
3.5 Nonfunctional Requirements
Nonfunctional requirements describe how well the software needs to perform or what constraints it must respect.
Examples of nonfunctional requirements:
•Response time should be a few seconds or less in all operating environments.
•The front-end design must be evaluated using the Inclusivity Heuristics by at least two people each Sprint.
•The software must be available 24 hours a day, seven days a week, and must have an uptime of 99.99%.
Notice that each nonfunctional requirement has a quantity. That helps make it testable (a criterion for a good
requirement).
3.5.1 Quality Attributes
Quality attributes are words for describing “a service or performance characteristic of software” (Wiegers &
Beatty, 2013, p. 601). Some common quality attributes are as follows.
•Maintainability: Amount of effort needed for developers to update, refactor, or otherwise modify the
software’s code.
•Portability: Amount of effort needed to run the software on different platforms.
•Reliability: How often the software’s functions succeed or fail.
•Efficiency: Number of resources the software requires.
•Integrity: How frequently the software loses data.
There is a long list of quality attributes on Wikipedia’s “” page (Wiki- media Foundation, 2023).

•Memorability: Amount of time users must spend relearning functionality.
•Flexibility: Number of different ways the software can be used.
•Interoperability: Ease with which the software can integrate with other software.
•Reusability: Extent to which the code can easily be used to solve other problems.
Each quality attribute can be converted to a scale. For example, the lowest value on a reliability scale for a single
could be “the function succeeds 0% of the time,” and 100% would of course be the opposite pole. Given this scale,
we can specify a nonfunctional requirement by defining a performance threshold:
•The function must have high reliability (succeeds >99% of the time).
When you select quality attributes for your software, you are prioritizing what qualities matter most to you/your
team/the project. Ideally, your team would keep these quality attributes (and the corresponding nonfunctional
requirements) in mind for the duration of the project. If the software is not meeting the nonfunctional requirements,
either the software or the threshold of acceptability needs to change.
3.5.2 Constraints
Some nonfunctional requirements are not about quality attributes and are instead about staying within constraints.
The following are example types of constraints (Wiegers & Beatty, 2013):
•Those limiting technology choices (programming languages, frameworks, databases, application
programming interface (API) types, etc.).
•Those limiting what platforms are targeted (e.g., mobile versus desktop, iOS versus Android).
•Those limiting what about the software can change (e.g., for backward compatibility).
•Those limiting how code can be written (e.g., following particular coding and documentation stan- dards).
•Those limiting how data can be handled (e.g., must only be stored on US servers).
A conceptual difference between constraints and quality attributes is that constraints are often externally mandated,
while quality attributes can be chosen internally by the team.

3.6 Functional Requirements
Functional requirements described what the software must do.
Example functional requirements:
•When the “register” button is activated, the user’s information is added to the database and a “thank you for
registering” screen displays.
•As a wholesaler, I want to see the wholesale and retail prices when I go to “product view” so that I know
how much money I’m going to make.
•Given a user has performed at least one editing action, when they activate the “action history” window, they
see a list of editing actions they have taken.
Each of these functional requirements is formatted differently. There isn’t a name for the first format; it simply
states what should happen when a particular action is taken in the software. The second uses user story format,
which is common in Agile software development. This format emphasizes the user, what the user is trying to do,
and their motivations. The third requirement uses the given-when-then format (see Agile Alliance for more
information), which incorporates context. This format is commonly used to write user story acceptance criteria: a
set of statements that, when true, indicate that the user story has been completed.
A more formal way to write functional requirements is the use case format, which follows a template. Figure
3.2 contains an example use case using a simple template.

Figure 3.2 Simple Use Case
3.6.1 User Stories
User stories are a method for specifying functional requirements. They describe a small piece of the software’s
functionality in a simple and easy-to-read sentence. They are written in plain English so that nontechnical people
(e.g., users, clients, other stakeholders) can understand them.
User stories can be written on 3 × 5 index cards and then stuck on a wall or whiteboard. They can also be typed into
task and project management systems (e.g., Jira, Asana, and the like). Figure 3.3 provides a few examples of user
stories within the context of a project (they have priorities and other project-related information attached to them).
Name: Generate list of recovered patients
Actor: Clinician
Flow:
Clinician authenticates using smart card.
Software confirms user credentials and permissions for specific machine.
Software logs access.
Software displays patient search.
Clinician selects “Advanced Patient Search.”
Software confirms user access permissions for advanced search page.
Clinician selects ailment and patient status.
Clinician executes search using “Search” button.
Software returns results.
Software logs query.
The body of a user story is commonly written using this format
As a <ROLE>, I want <SOME FUNCTIONALITY> so that I get <SOME BENEFIT>

Figure 3.3 User Story Functional Requirement Examples
Want more examples of user stories? Mountain Goat Software provides 200 example user stories [PDF] (Cohn,
2004). They list only the “As a . . .” part of the user story requirement.
Anyone on the team—or any project stakeholder—might come up with user stories. Once the user stories are
initially defined, they can be used to start a conversation with the client and others on the team. Clients can guide
you on setting priorities for user stories. This conversation is also a good time to get more details about the user
stories, which should be added to the card.
What makes a good user story? Besides the characteristics of good requirements listed earlier in this chapter, the
INVEST acronym (Wake, 2003) can help you remember characteristics of good user stories:
US-012: App Purpose Priority: Highest (8)
Sprint: 1
Assigned to: Randomira Philibert
As a new user, I want to read about what features the app provides so that I can decide whether to use
it.
US-034: Personalized Avatar Background Priority: Lowest (1)
Sprint: 3
Assigned to: Ade Einarr
As a registered user, I want to change the background around my face on my avatar so that I can
personalize my experience.
US-023: Disabling Comments Priority: Highest (8)
Sprint: 2
Assigned to: Emrah Tuukka
As an admin, I want to disable comments so that I can control spam and spread of disinformation.
Want examples of comically bad user stories? Check out the Twitter feed (@Shi- tUserStory)

•(I) Independent: Does not have unnecessary dependencies or overlap with other user stories.
◦Two user stories that overlap:
▪“As a new user, I want to register so that . . .”
▪“As a new user, I want to register using my Google account so that . . .”
◦Set of user stories that don’t overlap (but some user stories need to be completed before oth- ers—
that’s ok):
▪“As a new user, I want to view the registration page so that . . .”
▪“As a new user, I want to register using Facebook so that . . .”
▪“As a new user, I want to register using Google so that . . .”
▪“As a new user, I want my registration details to be stored so that . . .”
•(N) Negotiable: Encourages instead of discourages discussion and gives developers flexibility.
◦Does not encourage discussion: “As a logged in user, I want to choose either black or white so that . . .”
◦Encourages discussion: “As a logged in user, I want to choose from multiple colors so that . .
.”
•(V) Valuable: Fulfills a user need.
◦Does not fulfill a user need: “As an Enterprise user, I want to watch a little race car drive around the
screen so that I can do something fun while requesting API end points.”
◦Fulfills a user need: “As an Enterprise user, I want to import my API end point requests so that my
requests take less time and are less tedious.”
•(E) Estimable: Can be given a time estimate.
◦Difficult to give a time estimate: “As a new user, I want enough encouragement to register so that I’ll
register.”
◦Easier to estimate: “As a new user, I want to compare plan pricing so that I can decide which plan to
choose.”
•(S) Small: Can fit into a single development period (e.g., a two-week Sprint)
◦Probably too large for a Sprint: “As a user, I want to play chess on my phone so that I have

something to do while waiting at the pharmacy.”
◦Smaller: “As a user, I want to move my pawn so that I can take my turn in chess.”
•(T) Testable: Possible to determine it’s done.
◦Difficult to determine whether it’s done: “As a guest user, I want to be satisfied with my expe- rience
so that I will want to sign up.”
◦Less difficult: “As a guest user, I want to try out the AI text generator without registering first so that I
can decide whether to subscribe.”
There is some overlap between INVEST and the general characteristics of good requirements mentioned above
(which is comforting), but you might find that INVEST is easier to remember.
How do you know when a user story is done? This is negotiated with the client and added to the user story as
acceptance criteria. Acceptance criteria say what must be true about the functionality specified by the user story for
the user story to be considered done (i.e., establishing the Definition of Done for the user story). Figure 3.4 adds a
DoD to one of the user stories from Figure 3.3. The DoD is composed of acceptance criteria following the given-
when-then format.
Figure 3.4 User Story with Definitions of Done Example
US-023: Disabling Comments Priority: Highest (8)
Sprint: 2
Assigned to: Emrah Tuukka
As an admin, I want to disable comments so that I can control spam and the spread of disinforma- tion.
Definition of Done
Given the user is logged in as a user, when they navigate to “Settings,” then there is a “Disable
Comments” button.
Given the user is on the “Settings” page, when they activate “Disable Comments,” then a sta- tus
message appears that indicates the action was successful. The message appears within 10 milliseconds.
Given the user has activated “Disable Comments,” when they navigate to a “Post” page, then
“Comments disabled” appears in the “Comments” section, and no comments are showing.

Once each of the acceptance criteria are confirmed to be done, the user story can be considered “DONE- done.”
Ideally, testing the acceptance criteria can be automated. Figure 3.5 provides example pseudocode for testing an
acceptance criterion.
1
2
3
4
5
6
7
8
9
10
11
Figure 3.5 Pseudocode for Testing an Example Acceptance Criterion
3.6.2 Use Cases
Use cases are a more formal method of specifying functional requirements. They are structured descrip- tions of
what a system is required to do when a user interacts. Figure 3.2 showed a simple use case exam- ple, and
additional examples can be found in the Digital.gov Usability Starter Kit PDF about use cases and personas (US
General Services Administration, 2014).
As use cases are less common in Agile, the remainder of this section will provide only a summary of how use cases
are structured.
Required Parts of a Use Case
Every use case has the following.
•Name: A short title for the use case that often starts with a verb (e.g., “Schedule weekly wellness check”).
The name briefly states the user objective the use case will describe.
•Actor(s): The user or users (human/nonhuman/computer) that are interacting with the software (e.g.,
“Medical staff”).
•Flow of events: Sequence of actions describing the interaction between the actor and the software (a.k.a.
“basic course of action” or “success scenario”).
def test_go_to_time():
# given
assert os.isWindows(),"Not Windows!"
player.open()
player.play_video('test.mkv')
# when
user.send_keyboard_shortcut("Ctrl-T")
# then
assert player.screen.is_showing(GOTOTIME)

Unified Modeling Language | 46
Sometimes, the actor is implied through the flow of events (e.g., “Shopper selects the calendar icon”). Other times,
the actor is stated separately from the flow of events (e.g., “Actor: Shopper”).
4.1 H
ow Diagrams Help
Diagrams can help in at least two major ways:
1. They can help you plan software you will create. Once you’ve created diagrams for planning
your software, you can use them to communicate to the development team what will/should be
imple- mented and decide (evaluate) whether your plans are any good (e.g., are clear, are logical,
reflect your project’s desired quality attributes, and so on).
2. They can help you describe software you’ve already created. If your software is already created,

Unified Modeling Language | 47
diagrams are good for documentation and, as mentioned above, for evaluating how satisfactory
your software is. The purpose of including diagrams in documentation is to communicate some-
thing about your software to somebody. There are many different audiences you could be trying
to communicate with.
Example audiences for your diagrams include other developers on the project, your supervisor or man-
ager, developers who might be interested in joining the team, developers who want to integrate with
your system, curious end users, and students of software engineering. Depending on the integrated
develop- ment environment (IDE)/tools you’re using, diagrams can be automatically generated from
your code, which helps make documentation maintenance easier and more likely to happen.
4.2
What Diagrams Must Do Well
To be helpful, diagrams must communicate clearly and at an appropriate level of detail for your
intended audience. If your intended audience does not understand your diagram—or misunderstands it
—your diagram has failed.
4.3
What
Is
UML?
Unified Modeling Language is a family of graphical notations for describing and designing software
through diagrams. It is especially applicable to object-oriented software, but some parts of UML are
applicable to many types of software. Different UML notations are used for different types of UML
dia- grams, each of which has a specific purpose. UML was first published in 1994, became a standard
of the Object Management Group (OMG) in 1997, and became an ISO standard in 2005. UML is
currently on version 2.
4.4
Why Use UML?
There are multiple benefits of creating diagrams using UML:
• UML gives you (1) notation for designing software so that your implementation will be
struc- tured and (2) notation for describing the existing design of software so that you can
evaluate whether the design is any good.

Unified Modeling Language | 48
• UML diagramming forces you to think about software design in a structured way. When
people try to design software in their minds, they can be sloppy about it—thinking about the
aspects of

Unified Modeling Language | 49
the design they want to think about. UML can encourage you to face the trickier parts of software
design.
• UML diagramming gives you a view of the software at different levels of design (e.g., class
level, component level, package level).
• UML provides a common language between software professionals. Because UML is well
known, it gives developers and managers a way to communicate in detail about software. That
being said, expect to encounter variations in how UML notation is used—it can be difficult to
remember UML notation; developers will make mistakes or adapt the notation to their own way
of thinking. It can help to provide a legend or explanation of what your notation means.
• UML diagrams give you a way to tell people about your software’s structure without asking
them to look through code. This is nice, for example, when onboarding new developers or
communi- cating with managers.
4.5
Why
NOT
Use
UML?
There are some drawbacks to UML diagramming:
• People tend to vary their UML notation, which can cause confusion. Some tips for avoiding
that problem include (1) keeping your notation basic and (2) explaining more complex notation.
• Getting UML notation right can take a lot of time. Remember that diagrams are for communicat-
ing. If creating the diagram takes longer than explaining the code a different way, the diagram
isn’t helping.
• UML diagrams can require a lot of maintenance. If your software design changes frequently,
so must your UML diagrams if you want them to be accurate. Fortunately, some IDEs can
generate some UML diagrams from your code.
Some IDEs will automatically generate some types of UML diagrams from your code. This is nice because
it’s easy to regenerate your diagram when your code changes. The generated diagrams can sometimes
have more detail than you want, however, making them less good for communicat- ing.
Unified Modeling Language | 50
4.6
Class
Diagrams
A class diagram describes a system’s classes and the static relationships that exist among them. Class
diagrams also show properties and operations of a class. Properties represent the structure of a class
(e.g., instance variables) and operations represent the functionality provided by the class (e.g., methods;
Fowler, 2004).
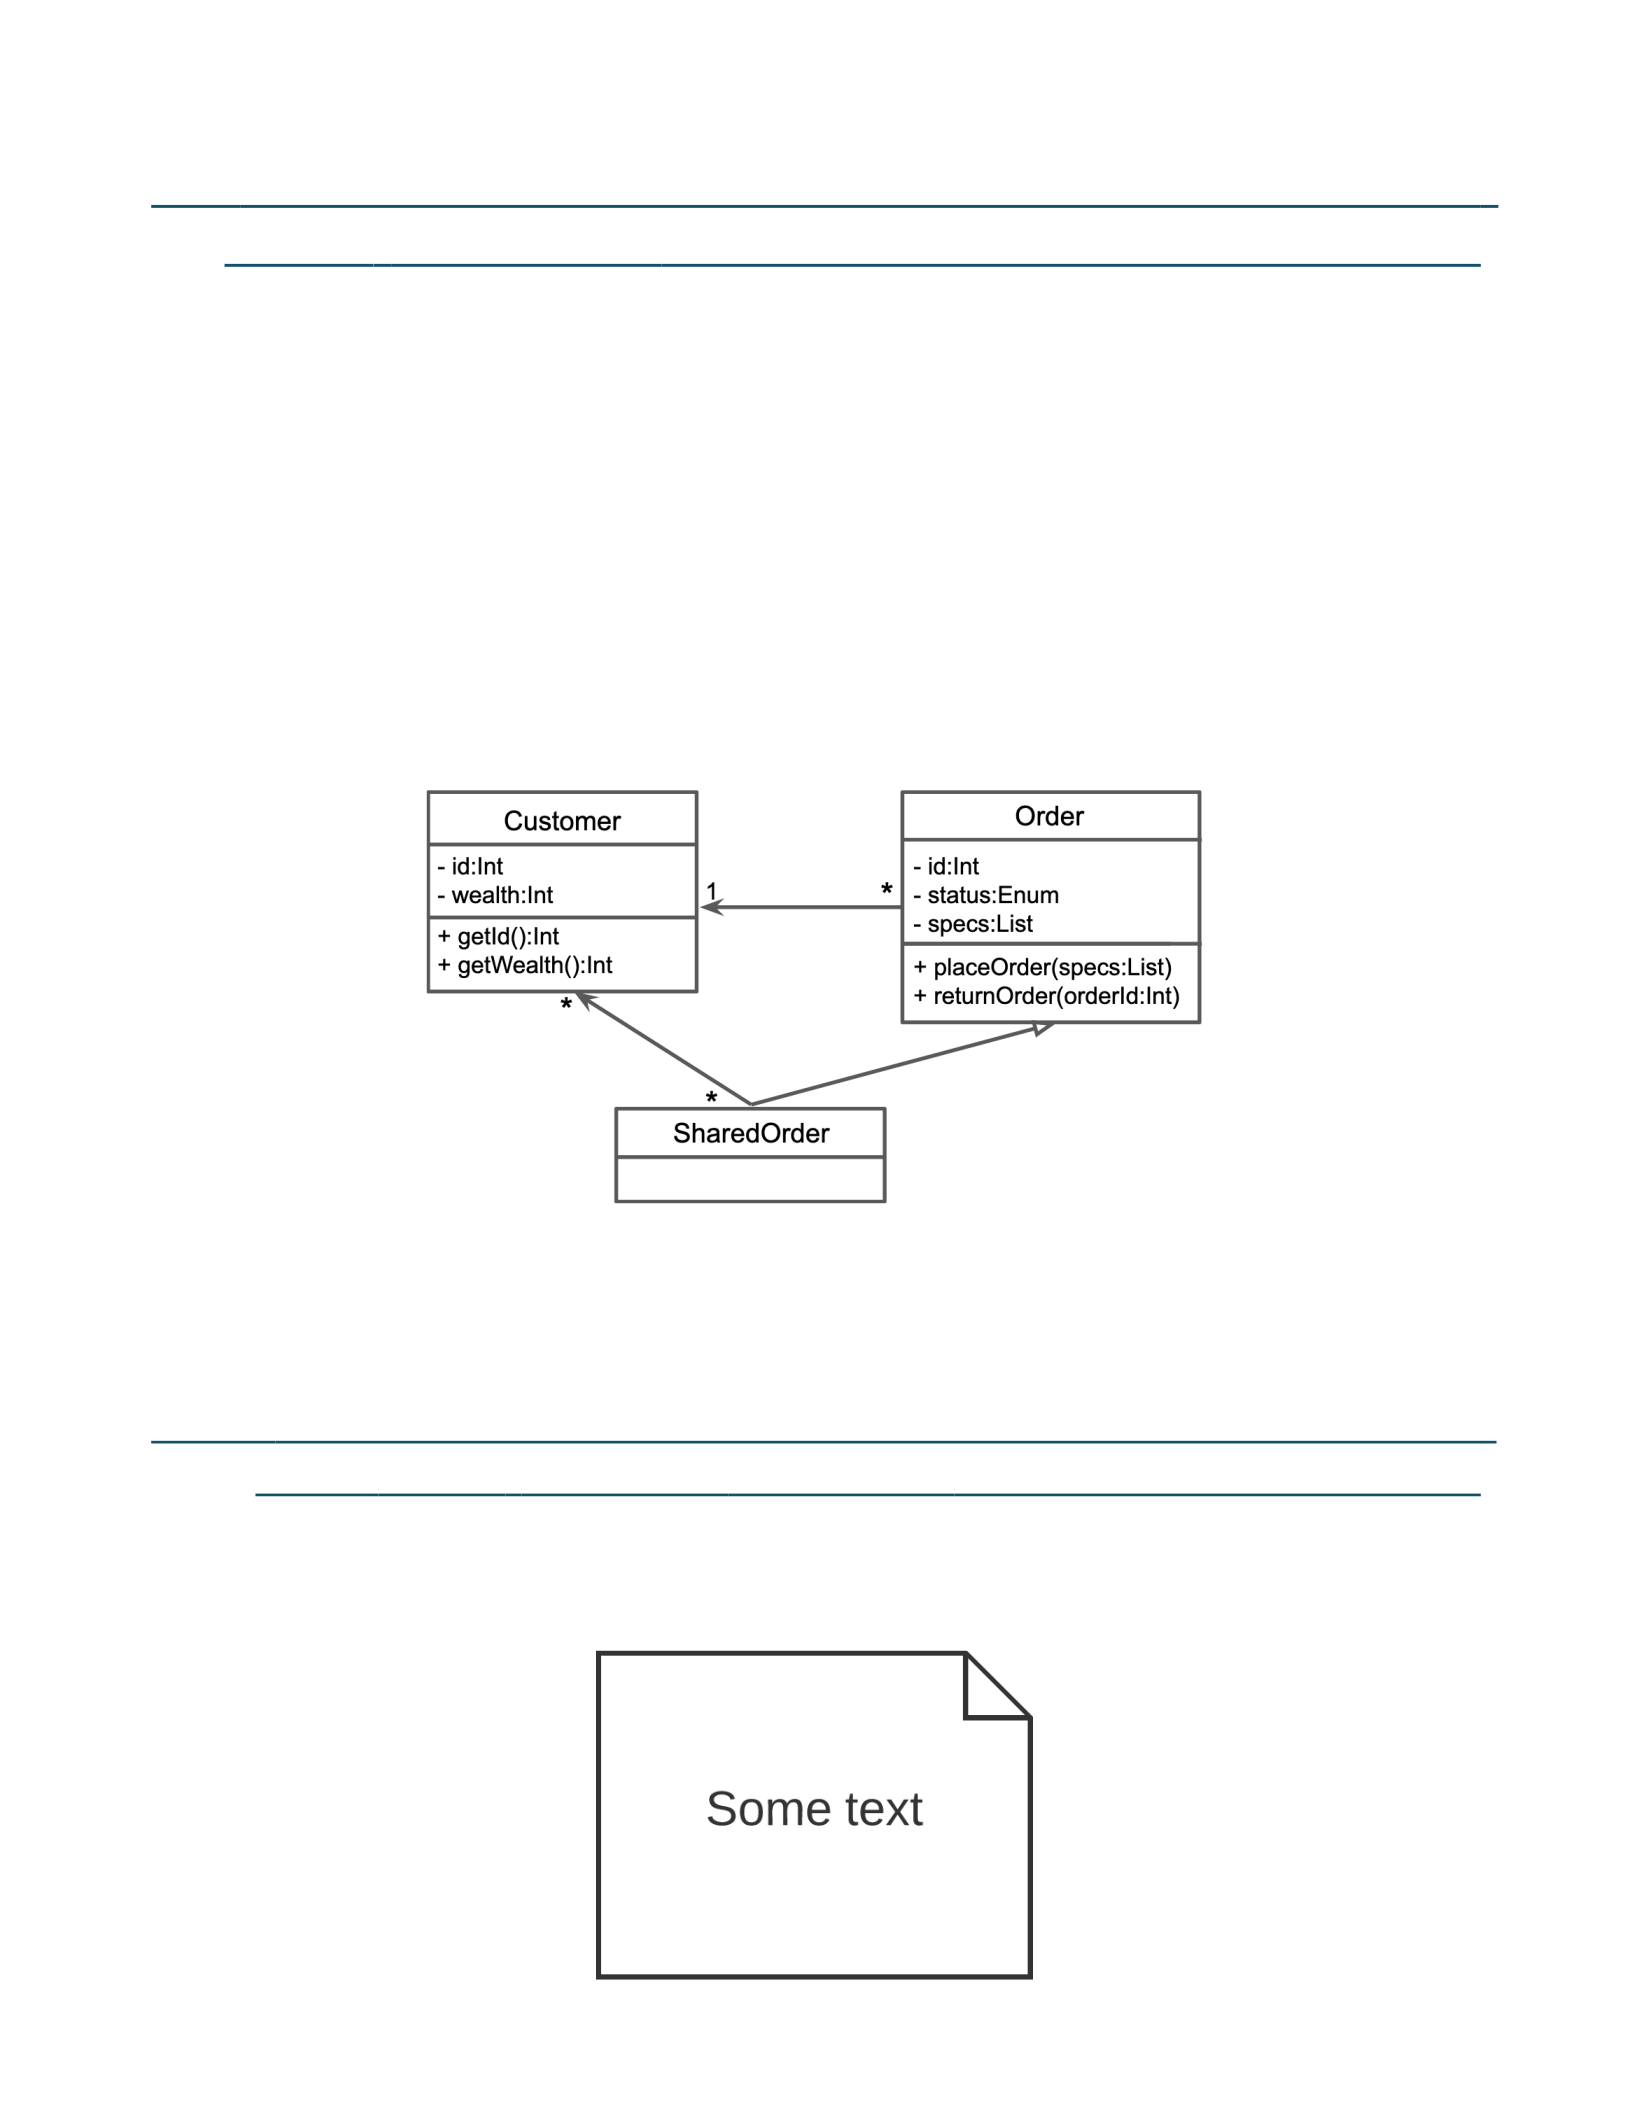
Figure 4.1 shows an example class diagram. In the diagram, there are relationships between three
classes: Customer, Order, and SharedOrder. An Order has one Customer—but the same Customer can
be on multiple Orders. A SharedOrder is a type of Order that can have multiple Customers. The classes
have attributes (e.g., id) and operations (e.g., getId()).
Figure 4.1 Simple Class Diagram
The next section explains each of the notational elements shown in the example.
4.6.1
UML Class Diagram Notation
This section contains some of the most common UML class diagram notation.

Unified Modeling Language | 51
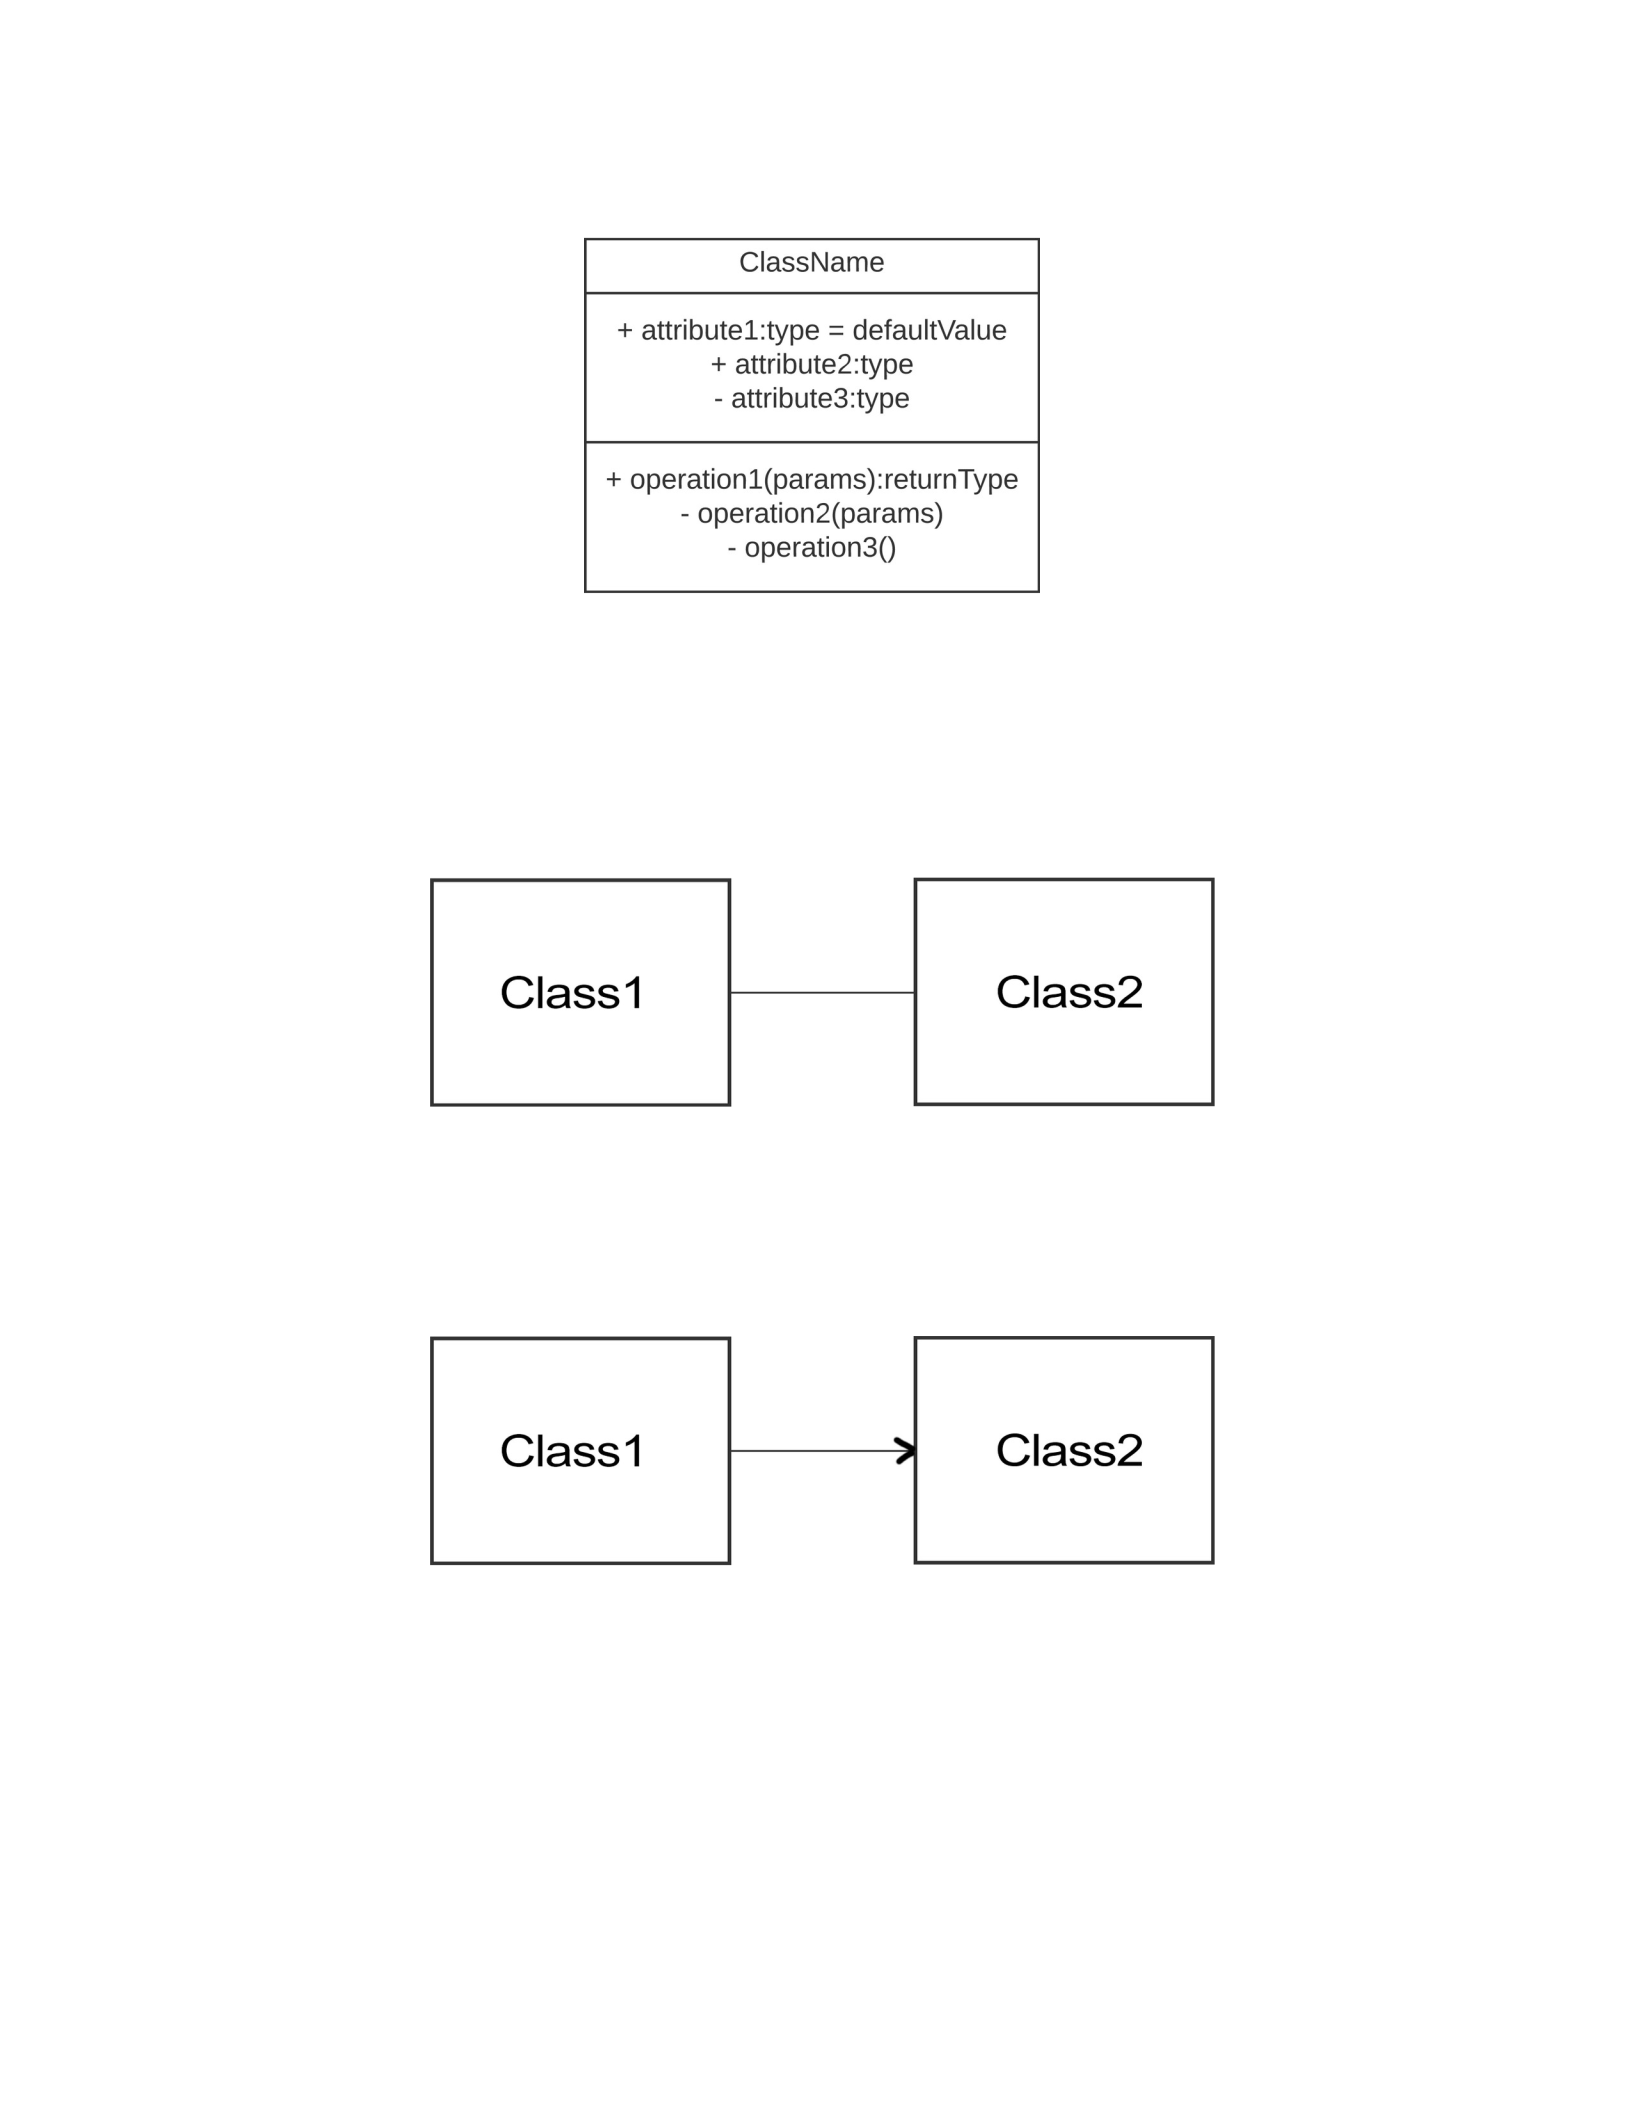
Figure 4.2 Note
Unified Modeling Language | 52
Note. Notes are for placing comments on class diagrams.
Figure 4.3 Class
Note. Attributes are properties that are listed within a class box and the operations are methods. The +
indicates a public method, – is private, and # is protected. The notation includes attribute types (e.g.,
int, Token, etc.), method parameters and return types, and default values for attributes.
Figure 4.4
Association
Note. Association means that a class contains a reference to an object(s) of the other class in the form
of a property. In this example, we aren’t told whether Class1 references Class2 or vice versa.
Figure 4.5 Unidirectional Association
Note. The arrow indicates that Class1 has a Class2.
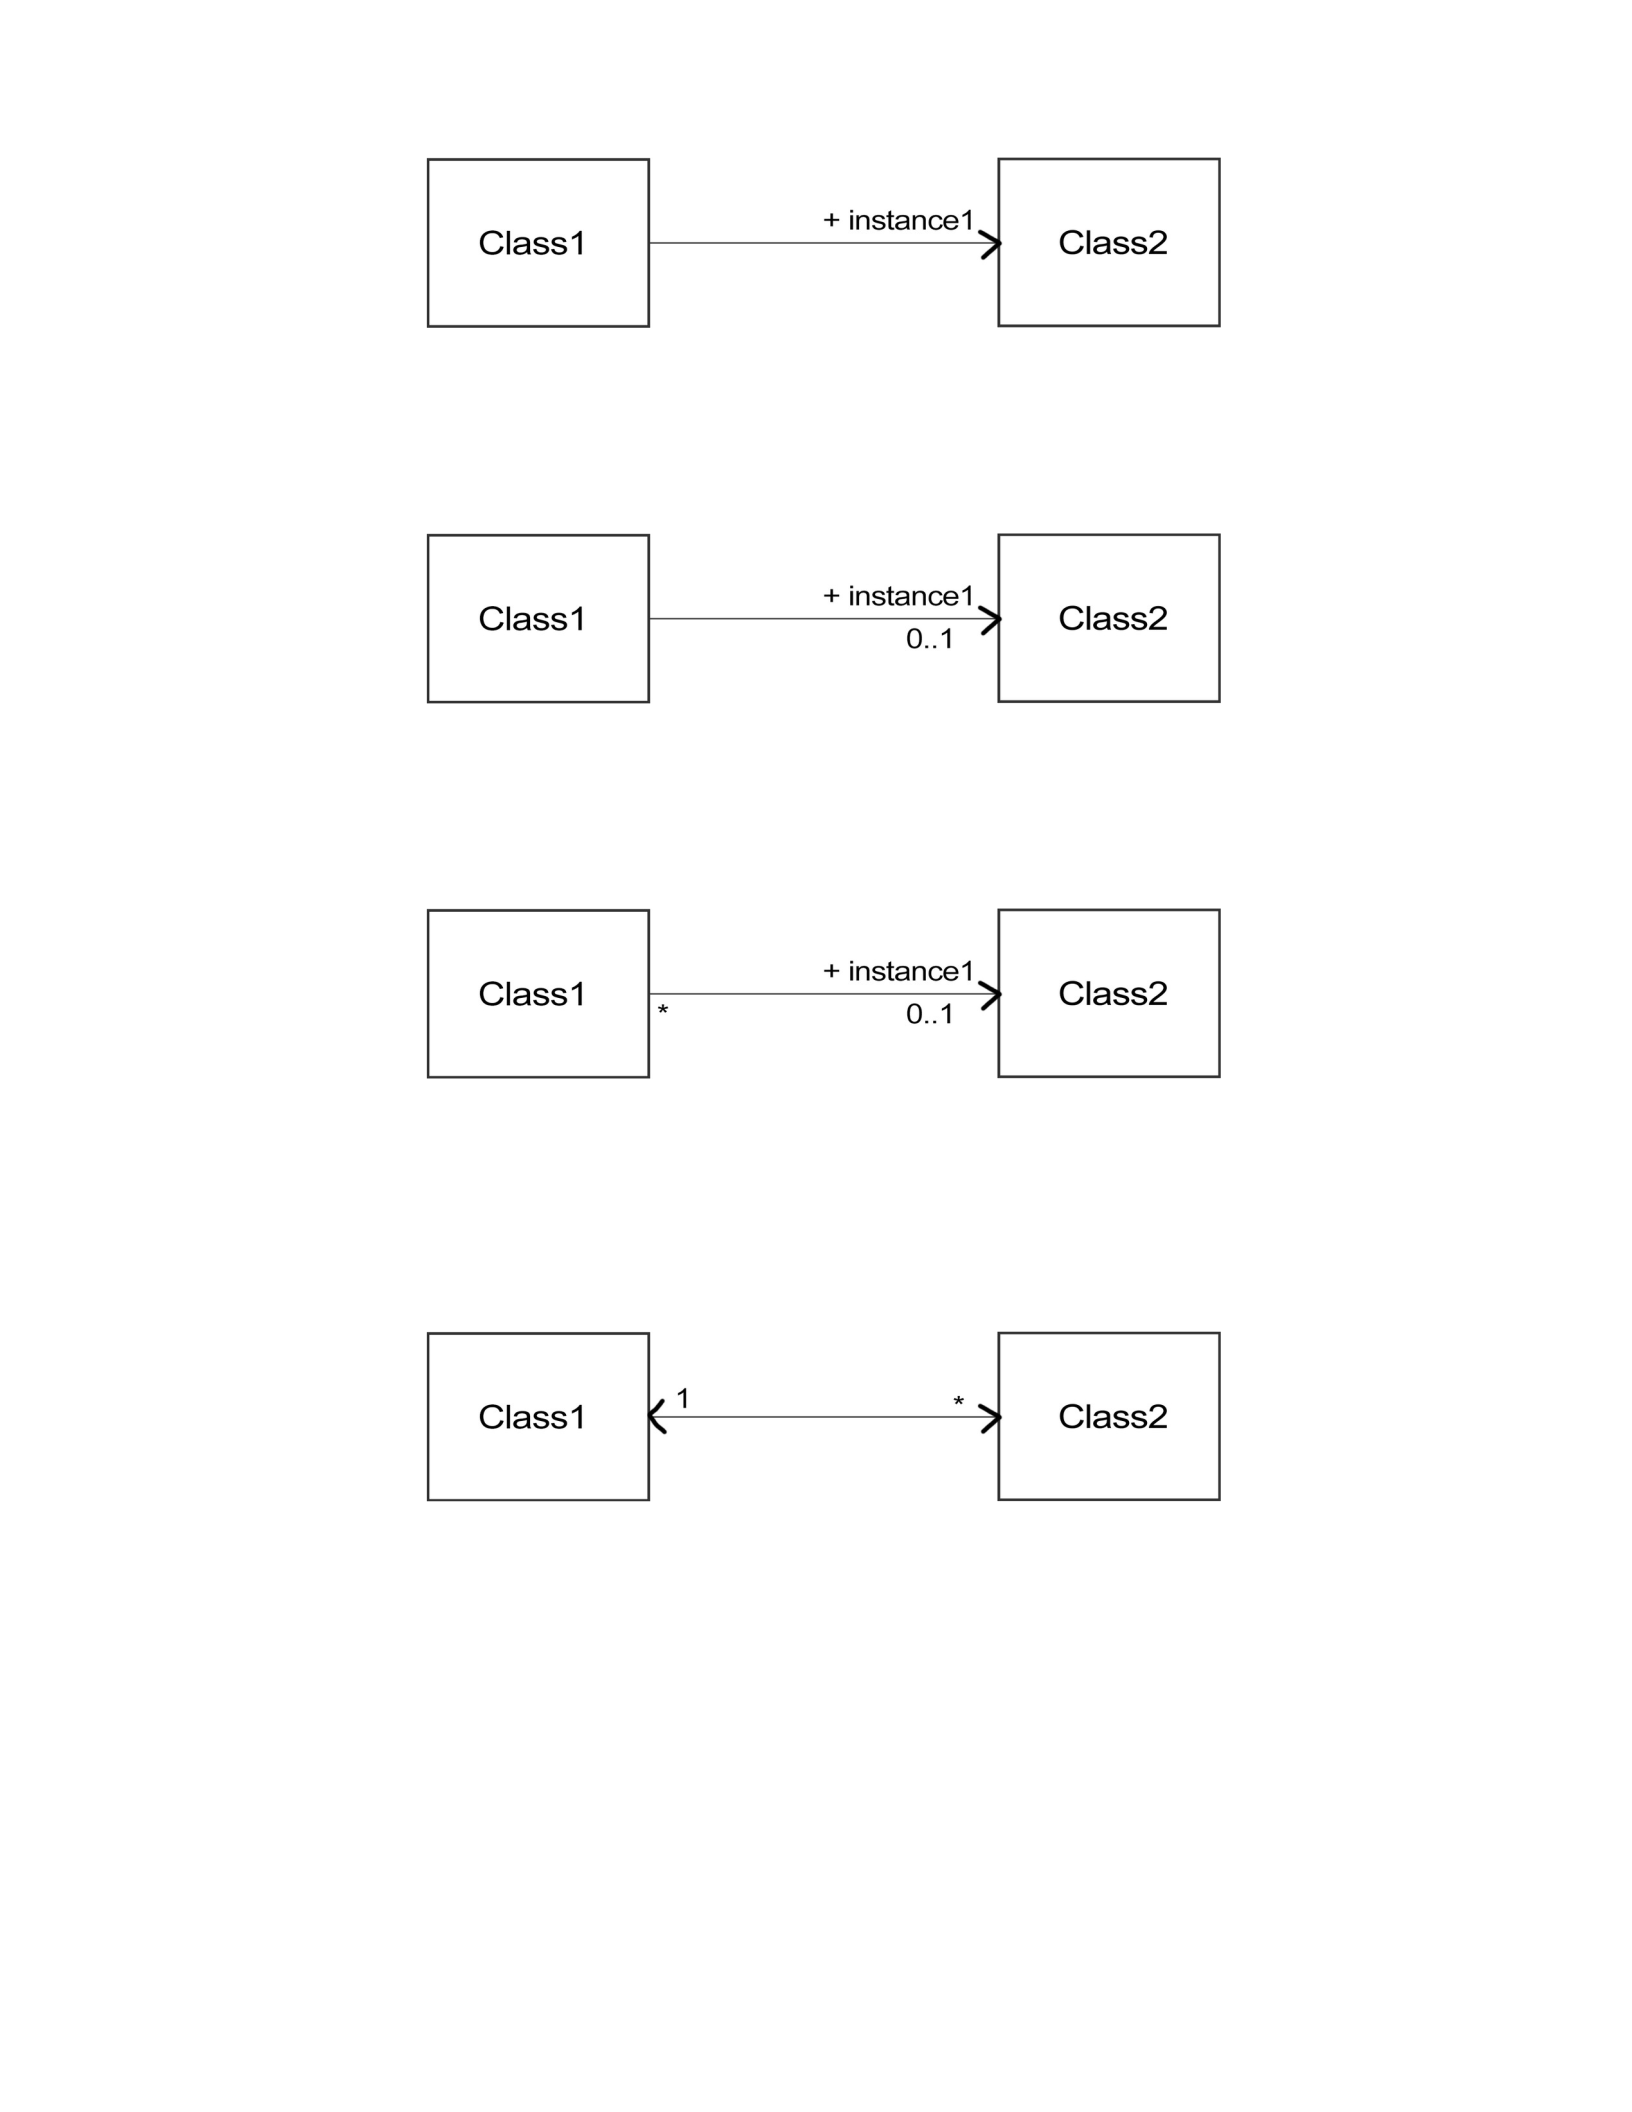
Unified Modeling Language | 53
Figure 4.6 Unidirectional Association with Property
Name
Note. Class1 has a property named instance1. It is an instance of Class2.
Figure 4.7 Unidirectional Association with Property
Name and Target Multiplicity
Note. Class1 has a property named instance1 containing zero or one instances of Class2.
Figure 4.8 Unidirectional Association with Property
Name, Target Multiplicity, and Source Multiplicity
Note. Zero or more instances of Class1 have properties named instance1 containing zero or one instance
of Class2.
Figure 4.9 Bidirectional Association and Target/Source
Multiplicity
Note. Class1 has zero or more instances of Class2. Class2 has exactly one instance of Class1.