


BUSI 820Quantitative Analysis 4
Student Name
Institution Affiliation
Class Title
Assignment 4
Due Date

BUSI820 Quantitative Analysis Assignment 4
15 September 2021 Page 2
Table of Contents
Assignment
Page
A4.1 Chapter 4, Problem 6.1
3
A4.1 Chapter 4, Problem 6.2
4
A4.1 Chapter 4, Problem 6.3
5
A4.1 Chapter 4, Problem 6.4
11
References
14
BUSI820 Quantitative Analysis Assignment 4
15 September 2021 Page 3
Quantitative Analysis 4
A4.6.1 Compute Cohen’s kappa to assess reliability using Rater 1 and Rater 2
Kappa is being used to measure the inter-rater reliability coefficient for Rater 1 and Rater
2. Table 1 shows the Case Processing Summary, where 60 participants have data on the two
variables. In table 2, for the Cross tabulation, we see that four participants’ codes do not agree with
the decisions (in highlighted whole cells). This table also shows the cases where the admissions
essay rater 1 and rater 2 agree (diagonally marked digits in blue). For, 17 + 39 = 56 students agree
or are consistent. For table 3, we have the Symmetric Measures, which show that the kappa value
is .846. This indicates there is strong evidence for reliability between admissions essay rater 1 and
admissions essay rater 2 decisions. Statistical significance is not relevant for reliability measures
as it is .000 under the approximate significance column.
Table 1
Case Processing Summary
Cases
Valid
Missing
Total
N
Percent
N
Percent
N
Percent
Admissions Essay Rater 1
Decision * Admissions
Essay Rater 2 Decision
60
100.0%
0
0.0%
60
100.0%
Table 2
Admissions Essay Rater 1 Decision * Admissions Essay Rater 2 Decision
Crosstabulation
Admissions Essay Rater 2
Decision
Total
Deny
Accept
Admissions Essay Rater 1
Decision
Deny
Count
17
3
20
% of Total
28.3%
5.0%
33.3%
Accept
Count
1
39
40
BUSI820 Quantitative Analysis Assignment 4
15 September 2021 Page 4
% of Total
1.7%
65.0%
66.7%
Total
Count
18
42
60
% of Total
30.0%
70.0%
100.0%
Table 3
Symmetric Measures
Value
Asymptotic
Standard Error
Approximate
Tb
Approximate
Significance
Measure of Agreement
Kappa
.846
.074
6.574
.000
N of Valid Cases
60
a. Not assuming the null hypothesis.
b. Using the asymptotic standard error assuming the null hypothesis.
A4.6.2 Compute inter-rater reliability by running a paired t-test for the essay
score 1 with the essay score 2.
In table 4, the Paired Samples Statistics shows the Means for the two raters of the essay
score 1 and essay score 2. The number of participants, standard deviations, and standard errors are
also shown. For table 5, the inter-rater reliability coefficient of the essay score 1 and the essay
score 2 is r(60) = .908, which indicates strong evidence for reliability. The Paired Samples Test,
as shown in table 6, we see that the means of the two raters of the essay score 1 and the essay score
2 provide the same average score. The mean is not significantly different as p = .122. It is actually
needed for the means of two gradings of the same variable to be the same. Thus, indicating that
the raters did not differ much in grades from each other.
Table 4
Paired Samples Statistics
Mean
N
Std. Deviation
Std. Error
Mean
BUSI820 Quantitative Analysis Assignment 4
15 September 2021 Page 5
Pair 1
Percent Score on Essay by
Rater 1
72.75
60
18.779
2.424
Percent Score on Essay by
Rater 2
71.08
60
19.462
2.512
Table 5
Paired Samples Correlations
N
Correlation
Sig.
Pair 1
Percent Score on Essay by
Rater 1 & Percent Score on
Essay by Rater 2
60
.908
.000
Table 6
Paired Samples Test
Paired Differences
t
df
Sig. (2-
tailed)
Mean
Std.
Deviation
Std. Error
Mean
95% Confidence
Interval of the
Difference
Lower
Upper
Pair
1
Percent Score on
Essay by Rater 1 -
Percent Score on
Essay by Rater 2
1.667
8.233
1.063
-.460
3.794
1.568
59
.122
A4.6.3 Run an Exploratory Factor Analysis using the extraction method of
principal axis factoring. Run the factor analysis on the 13 items related to
stress.
The principal axis factor analysis with varimax rotation helps in assessing the underlying
structures for the 13 items related to stress. The Analyses N, as shown in table 7, indicates there
are 60 participants and shows the descriptive statistics for each variable. Therefore, no participant
had missing data. In table 8, we see how each of the 13 items is related to each of the other 13.
BUSI820 Quantitative Analysis Assignment 4
15 September 2021 Page 6
The pairs of stress-related items with a relatively high correlation of positive or negative .40 do
likely have high loadings from the same factor. In our case, the determinant here is equal to .000;
therefore, we cannot have a possible solution, or otherwise, collinearity in our case is too high.
Also, low correlations less than .20 do not have high loadings from the same factors. Table 9 in
our case shows the tests of assumptions. The Kaiser-Meyer-Olkin Measure of Sampling Adequacy
measures .898, which indicates sufficient items for each factor. The KMO should be greater than
.70 to achieve this sufficiency, and it is not adequate if it is less than .50. On the other side, the
Bartlett test should be significant, that is, less than .05, indicating that the correlation matrix is
significantly different from an identity matrix. The identity matrix has all correlations between
variables at zero.
Table 7
Descriptive Statistics
Mean
Std.
Deviation
Analysi
s N
Upset About
Unexpected
Things
2.10
1.324
60
Unable to Control
Important Things
2.07
1.339
60
Feeling Nervous or
Stressed
2.22
1.106
60
Confident about
Handling
Problems
2.15
1.424
60
Things are Going
Your Way
2.13
1.255
60
Could Not Cope
with Things to Do
2.13
1.321
60
Ability to Control
Irritations
2.17
1.342
60
BUSI820 Quantitative Analysis Assignment 4
15 September 2021 Page 7
Feeling on Top of
Things
2.10
1.349
60
Angered from
Things Out of Your
Control
2.27
1.205
60
Not Going to be
Able to Overcome
Difficulties
2.22
1.209
60
Feeling Ok With
My Family
4.50
.597
60
Feeling Ok With
My Friends
4.28
.490
60
Feeling Ok With
Love Life
4.50
.504
60
Table 8
Correlation Matrix
Upset
About
Unexpe
cted
Things
Unabl
e to
Contr
ol
Impor
tant
Thing
s
Feeli
ng
Nerv
ous
or
Stres
sed
Confi
dent
about
Handl
ing
Probl
ems
Thi
ngs
are
Goi
ng
You
r
Wa
y
Cou
ld
Not
Cop
e
with
Thi
ngs
to
Do
Abilit
y to
Contr
ol
Irritati
ons
Feel
ing
on
Top
of
Thin
gs
Ange
red
from
Thin
gs
Out
of
Your
Cont
rol
Not
Going
to be
Able
to
Overc
ome
Difficu
lties
Feel
ing
Ok
Wit
h
My
Fam
ily
Feel
ing
Ok
With
My
Frie
nds
Feel
ing
Ok
Wit
h
Lov
e
Life
Correl
ation
Upset
About
Unexpe
cted
Things
1.000
.580
.529
-.619
-
.498
.428
-.563
-
.613
.578
.579
.215
.243
-
.178
Unable
to
Control
Import
ant
Things
.580
1.000
.631
-.654
-
.611
.532
-.657
-
.670
.587
.588
.085
.203
-
.126
BUSI820 Quantitative Analysis Assignment 4
15 September 2021 Page 8
Feeling
Nervou
s or
Stresse
d
.529
.631
1.000
-.645
-
.461
.502
-.573
-
.594
.464
.573
.167
.291
-
.015
Confid
ent
about
Handli
ng
Proble
ms
-.619
-.654
-.645
1.000
.624
-
.624
.643
.618
-.586
-.551
.010
-
.183
.201
Things
are
Going
Your
Way
-.498
-.611
-.461
.624
1.00
0
-
.563
.640
.543
-.618
-.455
.226
-
.062
.214
Could
Not
Cope
with
Things
to Do
.428
.532
.502
-.624
-
.563
1.00
0
-.634
-
.559
.573
.385
-
.022
.229
-
.051
Ability
to
Control
Irritatio
ns
-.563
-.657
-.573
.643
.640
-
.634
1.000
.627
-.656
-.534
-
.212
-
.253
.150
Feeling
on Top
of
Things
-.613
-.670
-.594
.618
.543
-
.559
.627
1.00
0
-.590
-.637
-
.190
-
.454
.000
Angere
d from
Things
Out of
Your
Control
.578
.587
.464
-.586
-
.618
.573
-.656
-
.590
1.000
.553
.024
.185
-
.223
BUSI820 Quantitative Analysis Assignment 4
15 September 2021 Page 9
Not
Going
to be
Able to
Overco
me
Difficul
ties
.579
.588
.573
-.551
-
.455
.385
-.534
-
.637
.553
1.000
.082
.295
-
.153
Feeling
Ok
With
My
Family
.215
.085
.167
.010
.226
-
.022
-.212
-
.190
.024
.082
1.00
0
.261
.169
Feeling
Ok
With
My
Friends
.243
.203
.291
-.183
-
.062
.229
-.253
-
.454
.185
.295
.261
1.00
0
.446
Feeling
Ok
With
Love
Life
-.178
-.126
-.015
.201
.214
-
.051
.150
.000
-.223
-.153
.169
.446
1.00
0
a. Determinant = .000
Table 9
KMO and Bartlett's Test
Kaiser-Meyer-Olkin Measure of
Sampling Adequacy.
.898
Bartlett's Test of
Sphericity
Approx. Chi-
Square
415.40
4
df
78
Sig.
.000
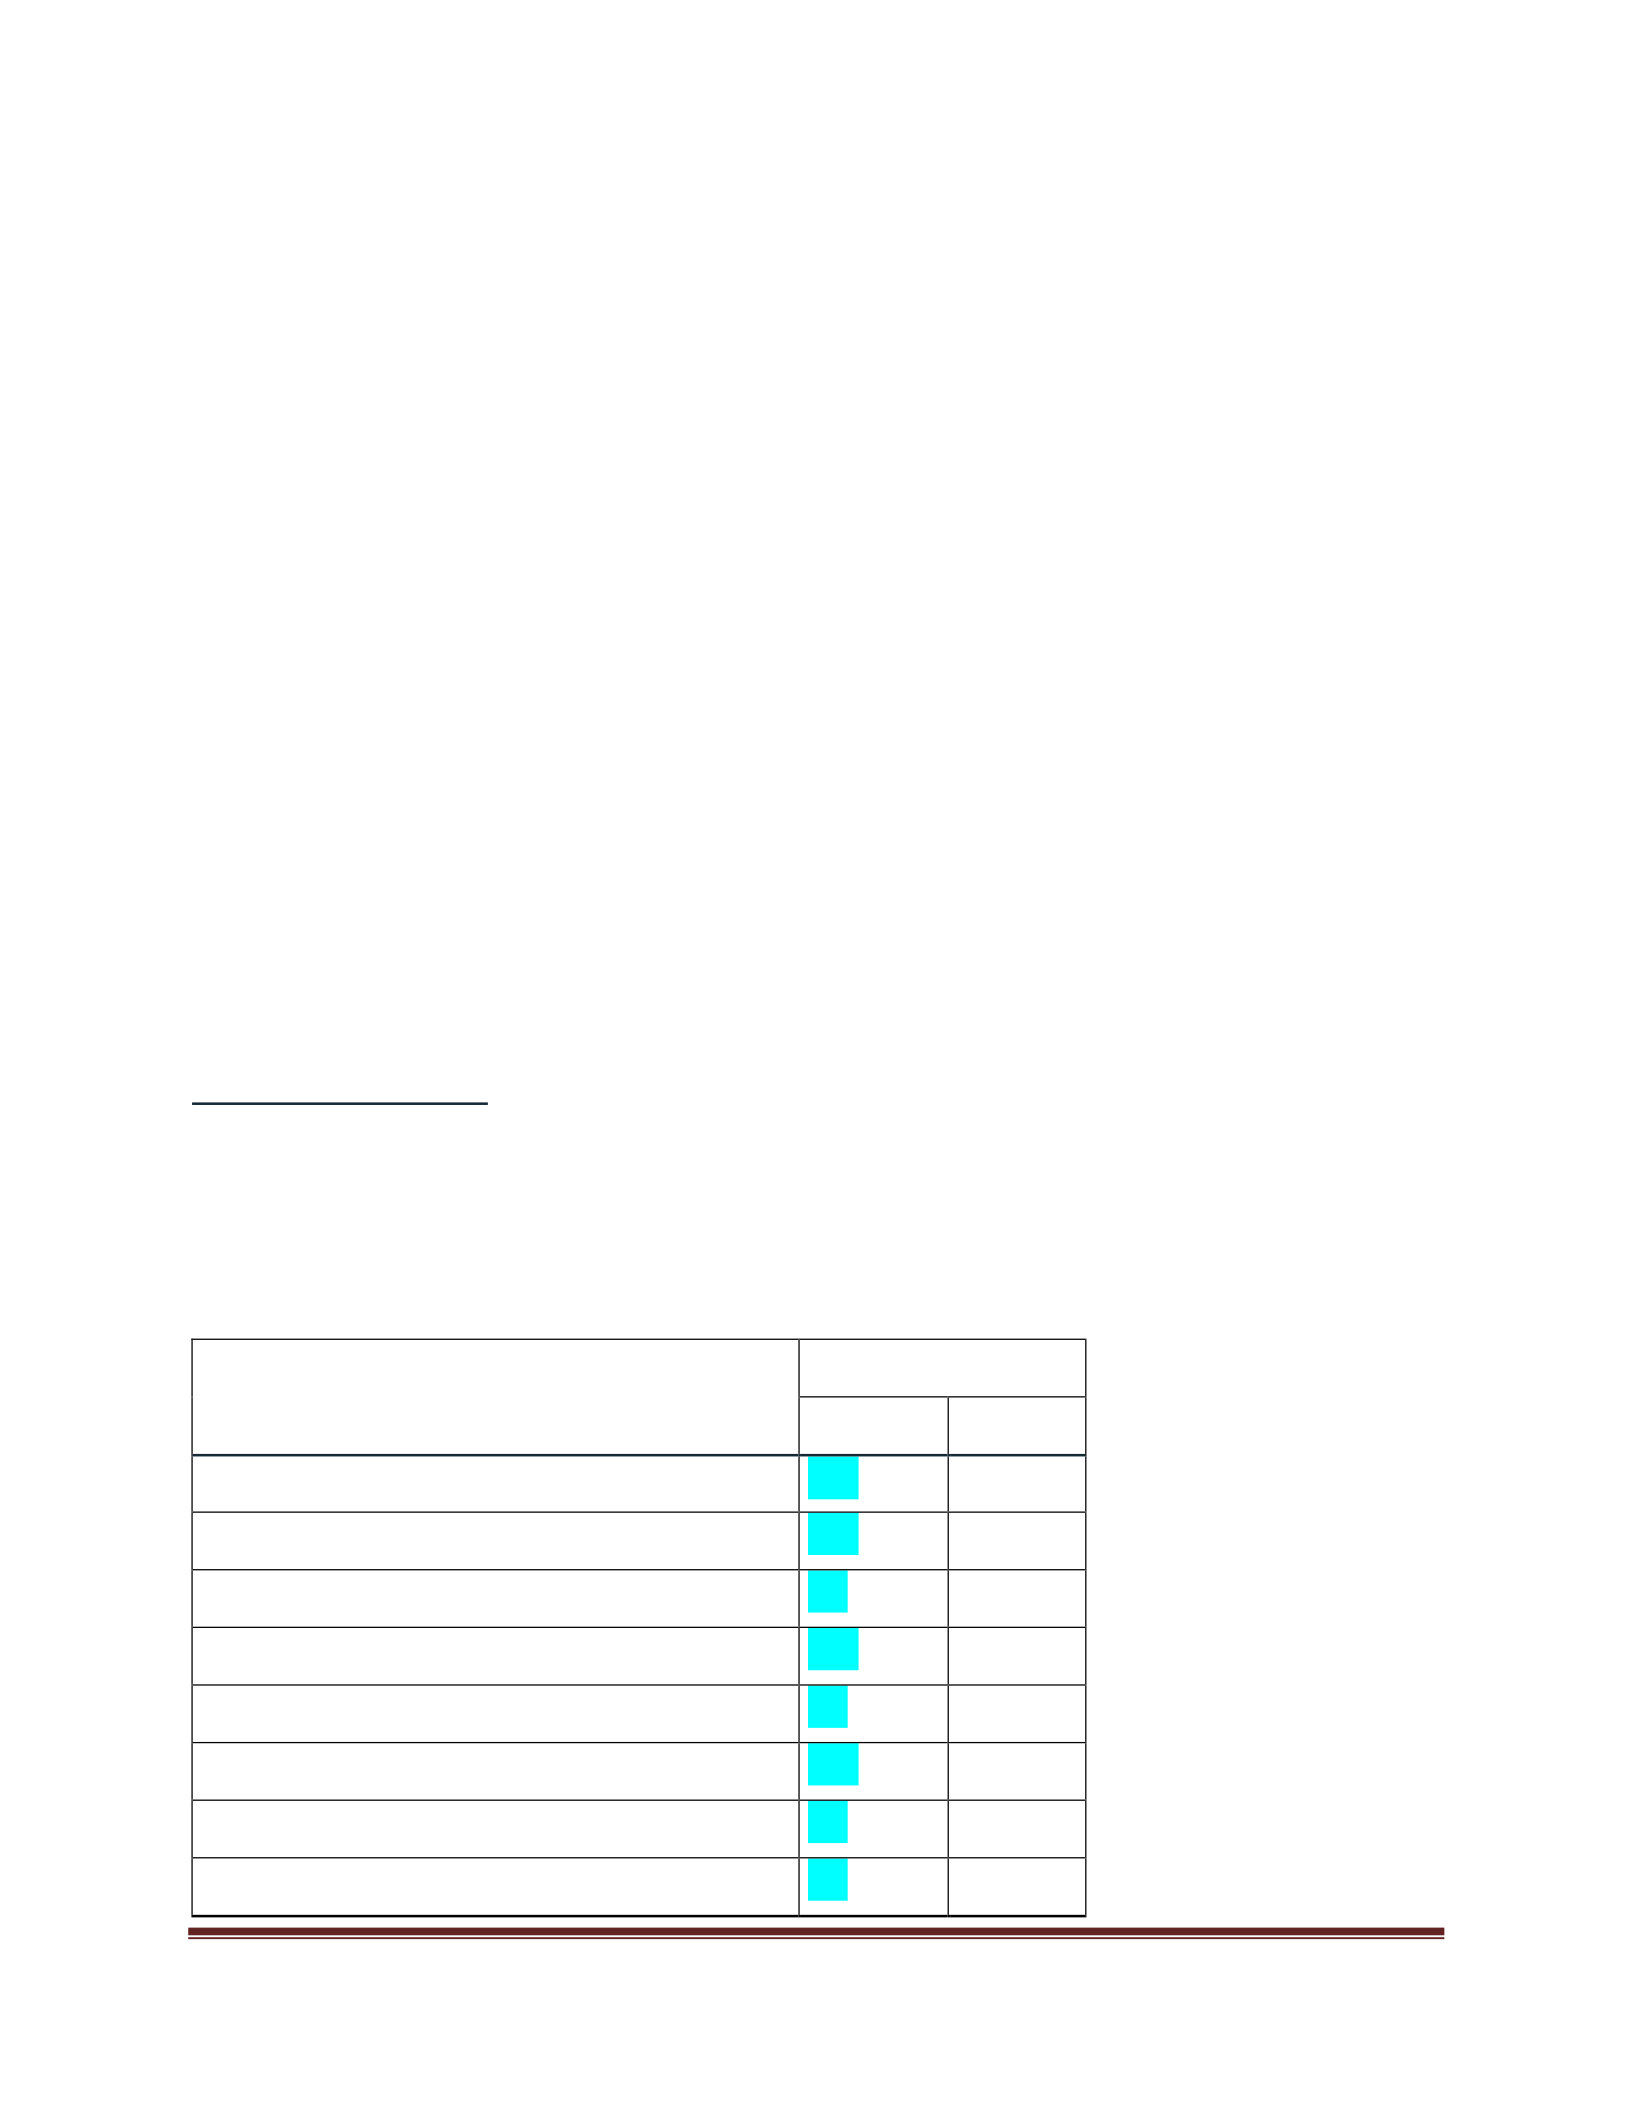
Rotation of factors is done to enhance ease of interpretation. In table 10, The Rotated
Component Matrix, the loadings have been shown for the 13 items related to stress, and analysis
has been divided into two groups, one with the highlighted marked digits and the other not
BUSI820 Quantitative Analysis Assignment 4
15 September 2021 Page 10
highlighted. The 13 items have been sorted in that those having the highest loading, be it positive
or negative from factor 1 (ten items in this analysis), are listed first. They are arranged in the order
of the highest factor loading to the one with the lowest loading from that first factor. In
consideration, every item has some loading from every factor, but the loadings we requested to be
excluded from the output were those less than .30, therefore, having blanks in the table. The total
variance explained (Table 11) shows the percentage of the variance explained by each of the two
factors and the cumulative percentage, which is 62.351 or rather 62. We see that the first factor
has a variance percentage of 48.555 and the second factor has a percentage of 13.796. We observe
from table 11 that half of the variance is already covered by the first two factors. Table 12 shows
the component transformation matrix, which is no big of a deal in the analyses as it was used to
convert the initial component matrix into the rotated component matrix.
Component Matrix
a. 2 components
extracted.
Table 10
Component loadings for the rotated components
Item
Component loading
1
2
Confident about Handling Problems
-.84
Ability to Control Irritations
-.83
Unable to Control Important Things
.83
Feeling on Top of Things
-.81
Angered from Things Out of Your Control
.80
Things are Going Your Way
-.78
Upset About Unexpected Things
.76
Feeling Nervous or Stressed
.74
BUSI820 Quantitative Analysis Assignment 4
15 September 2021 Page 11
Not Going to be Able to Overcome Difficulties
.74
Could Not Cope with Things to Do
.73
Feeling Ok With My Friends
.77
Feeling Ok With Love Life
.73
Feeling Ok With My Family
.63
% of variance
48.56
13.80
Table 11
Total Variance Explained
Component
Rotation Sums of Squared Loadings
Total
% of variance
Cumulative %
1
6.312
48.555
48.555
2
1.794
13.796
62.351
Extraction Method: Principal Component Analysis.
Table 12
Component Transformation
Matrix
Component
1
2
1
.996
.086
2
-.086
.996
Extraction Method: Principal
Component Analysis.
Rotation Method: Varimax with
Kaiser Normalization.
A4.6.4 Run Cronbach’s alpha for the five happiness scale items from the Chapter
Six data file.
According to table 14, we see that the Cronbach’s Alpha coefficient is .967. For the item
statistics table, we obtain the descriptive statistics where we observe that 60 participants have all
the data to the five items of happiness. In table 16, we have the inter-item correlation matrix, the
BUSI820 Quantitative Analysis Assignment 4
15 September 2021 Page 12
five items in the happiness scale correlated positively and relatively highly with the other four
items. The crossed-out digits are the duplicate correlations. For the last table, the corrected item-
total correlation column is key, and it shows a high-to-high (.40+) sequence for the five items. This
will make a summated rating scale with a good component in it. The other important column in
this table is the Cronbach’s Alpha item if deleted. The column shows a slightly lower change
compared to when it has all items in the reliability statistics table.
Table 13
Case Processing Summary
N
%
Cases
Valid
60
100.0
Excluded
0
.0
Total
60
100.0
a. Listwise deletion based on all variables in
the procedure.
Table 14
Reliability Statistics
Cronbach's
Alpha
Cronbach's
Alpha Based
on
Standardized
Items
N of Items
.967
.967
5
Table15
Item Statistics
Mean
Std. Deviation
N
Life is Close to Ideal
4.02
2.369
60
Condition of Life is
Excellent
4.13
2.318
60
Satisfied with Life
4.32
2.127
60
Gotten Important Things in
Life
4.17
2.180
60
BUSI820 Quantitative Analysis Assignment 4
15 September 2021 Page 13
Change Nothing if I were
to Live Life Over
4.23
2.332
60
Table 16
Inter-Item Correlation Matrix
Life is Close to
Ideal
Condition of
Life is
Excellent
Satisfied with
Life
Gotten
Important
Things in Life
Change
Nothing if I
were to Live
Life Over
Life is Close to Ideal
1.000
.873
.833
.856
.859
Condition of Life is
Excellent
.873
1.000
.827
.864
.885
Satisfied with Life
.833
.827
1.000
.822
.856
Gotten Important Things in
Life
.856
.864
.822
1.000
.876
Change Nothing if I were to
Live Life Over
.859
.885
.856
.876
1.000
Table 17
Item-Total Statistics
Scale Mean if
Item Deleted
Scale Variance
if Item Deleted
Corrected Item-
Total
Correlation
Squared
Multiple
Correlation
Cronbach's
Alpha if Item
Deleted
Life is Close to Ideal
16.85
71.553
.906
.824
.959
Condition of Life is
Excellent
16.73
72.063
.916
.844
.957
Satisfied with Life
16.55
76.286
.879
.778
.963
Gotten Important Things in
Life
16.70
74.620
.906
.823
.959
Change Nothing if I were to
Live Life Over
16.63
71.592
.924
.857
.956

BUSI820 Quantitative Analysis Assignment 4
15 September 2021 Page 14
References
College Student data.sav [DataSet1] IBM SPSS Statistics Data Editor (2019)
Morgan, G. A., Barrett, K. C., Leech, N. L., & Gloeckner, G. W. (2019). IBM SPSS for
Introductory Statistics: Use and Interpretation: Use and Interpretation. Routledge.
https://doi.org/10.4324/9780429287657

