



BUSI 820: ASSIGNMENT 1
1 | January 19, 2025
Assignment 1 Quantitative Analysis: Data Coding, Entry, and Checking
BUSI 820 Quantitative Research Methods
January 19, 2025

BUSI 820: ASSIGNMENT 1
2 | January 19, 2025
Table of Contents
Interpretation Questions 3
A.1: Chapter 2, Problem 2.1. 3
A.1: Chapter 2, Problem 2.2. 3
A.1: Chapter 2, Problem 2.3. 4
A.1: Chapter 2, Problem 2.4. 4
A.1: Chapter 2, Problem 2.5. 5
A.1: Chapter 2, Problem 2.6. 5
A.1: Chapter 2, Problem 2.6a. 5
A.1: Chapter 2, Problem 2.6a. 5
SPSS Questions 6
A.1: Chapter 2, Problem 2.1. 6
Results7
A.1: Chapter 2, Problem 2.2. 8
Results9
Conclusions 10
References 11

BUSI 820: ASSIGNMENT 1
3 | January 19, 2025
Interpretation Questions
A.1: Chapter 2, Problem 2.1. What steps or actions should be taken after you collect data
and before you run the analyses aimed at answering your research questions or testing
your research hypotheses?
Before proceeding to the analysis phase, it is crucial to ensure that the filled-out
questionnaires are devoid of any complications or concerns. Look out for issues such as missing
data, inaccurate data, evident errors, and nonsensical data (Morgan et al., 2020). The information
should be scrutinized for data irregularities. Subsequently, the data should be coded. Coding
involves assigning numbers to each distinct level and assigning values to any value labels,
usually done numerically (Morgan et al., 2020). Utilizing higher numbers for more affirmative
responses simplifies data analysis. This is because a more positive number corresponds to a
positive response, making it easier to monitor. In the data input spreadsheet, it is important to
ensure that each variable is confined to its respective column (Morgan et al., 2020). Identifying
evident errors, such as numerical values outside the acceptable range and issues with missing
data, aids in data entry and problem detection before the analyses are displayed on the
spreadsheet. Running descriptive statistics and examining the data can uncover most errors. One
would want to ensure the maximum and minimum values fall within the appropriate ranges by
verifying the information. Following the above noted steps are followed, a researcher can then
begin to answer research questions or testing a research hypothesis.
A.1: Chapter 2, Problem 2.2 Why should you label the values of nominal variables?
Nominal variables, also known as categorical variables, are variables that can be divided
into multiple categories but having no order or priority. This is why it is important to label

BUSI 820: ASSIGNMENT 1
4 | January 19, 2025
nominal variables because such may be either numeric or verbal, and by labeling then can
subsequently allow the variables to be categorize and organized into classes and groups (Morgan
et al., 2020). In SPSS, label values are predominantly beneficial for categorical variables, while
nominal variables, especially when coded, are utilized for the same purpose. It's crucial to label
everything for enhanced comprehension by those reviewing the work.
A.1: Chapter 2, Problem 2.3 Why would you print a codebook or dictionary?
A codebook or dictionary is crucial tool in research. It helps to provide a detailed guide
on how to interpret and understand the data collected in the study. Having a printed codebook
can make it easier to refer to definitions and explanations during data analysis. Codebooks help
to provide detailed explanations of the variables in a data set and how to intrepid them.
Codebooks also are beneficial for other researchers as it provides necessary information to
understand and replicate the study.
A.1: Chapter 2, Problem 2.4 What do you do if you look at your data file and see words or
letters instead of numbers? Why is this important to do?
In the bottom left corner of the SPSS data file, there will be two applicable tabs. One
being variable view, and the other data view. The variable view tab provides detailed information
about the data and the data view, also referenced as data file, is where a researcher will scrutinize
the information (Morgan et al., 2020). In the data file location, only numeric values should be
present. If any alphabetic characters or present, this means the information has been loaded
incorrectly. If the data file is not reviewed in advance, this could result in syntax errors or
incorrect results. The variable view is where variables are transcribed into applicable numerical
values, and it would be appropriate for alphabetic characters to be present in this location.

BUSI 820: ASSIGNMENT 1
5 | January 19, 2025
A.1: Chapter 2, Problem 2.5 Why would you use the Mean function to create a variable, as
we did for the pleasure scale?
When a majority of items on a multi-question construct or scale have been answered by
participants, the Mean function in SPSS can be used to calculate the average score for that
variable across all participants. This includes those with some missing data, as it averages the
responses to the items they did answer. It is important to be mindful and avoid using the Mean
function for computing a multi-item scale if some participants only responded to limited
information.
A.1: Chapter 2, Problem 2.6a Why is it important to check your raw (questionnaire) data
before and after entering them into the data editor?
It is important to meticulously verify questionnaire data both before and after putting
information into the data editor. By checking the data, the researcher can enter missing values
that were unintentionally not entered correctly the first time (Morgan et al., 2020). The process
of checking data before and after allows to correct any potential typing errors, fill in any missing
values that may have been overlooked inadvertently, and confirm all data is numerical except
when data is missing. In the event data is missing it is important to just leave line item blank to
signal absence of information to the SPSS program.
A.1: Chapter 2, Problem 2.6b What are ways to check the data before entering them? After
entering them?
The data editor tool within SPSS displays necessary information in a spreadsheet format.
Users are able to add new data, modify existing data, search the data set, and edit applicable data
features like variable information, display formats and label values. It is recommended that prior
BUSI 820: ASSIGNMENT 1
6 | January 19, 2025
to entering data, to perform a database test to validate the data’s accuracy. If results are not what
was anticipated, it would be a good time to review applicable information. Reviewing applicable
information can include examining all labels and variables to ensure the input and output
information is correct. After entering the data, a proofreading review to confirm accuracy is
important, which can be looked at under codebook or data editor view. If data is entered
incorrectly the SPSS system would provide an error message to help inform the user. If any
accuracies are found throughout this process before or after, corrections can be made.
SPSS Problems
A.1: Chapter 2, Problem 2.1 Compute the N, minimum, maximum, and mean for all the
variables in the CollegeStudentData.sav file. How many students have complete data?
Identify any statistics on the output that are not meaningful. Explain.
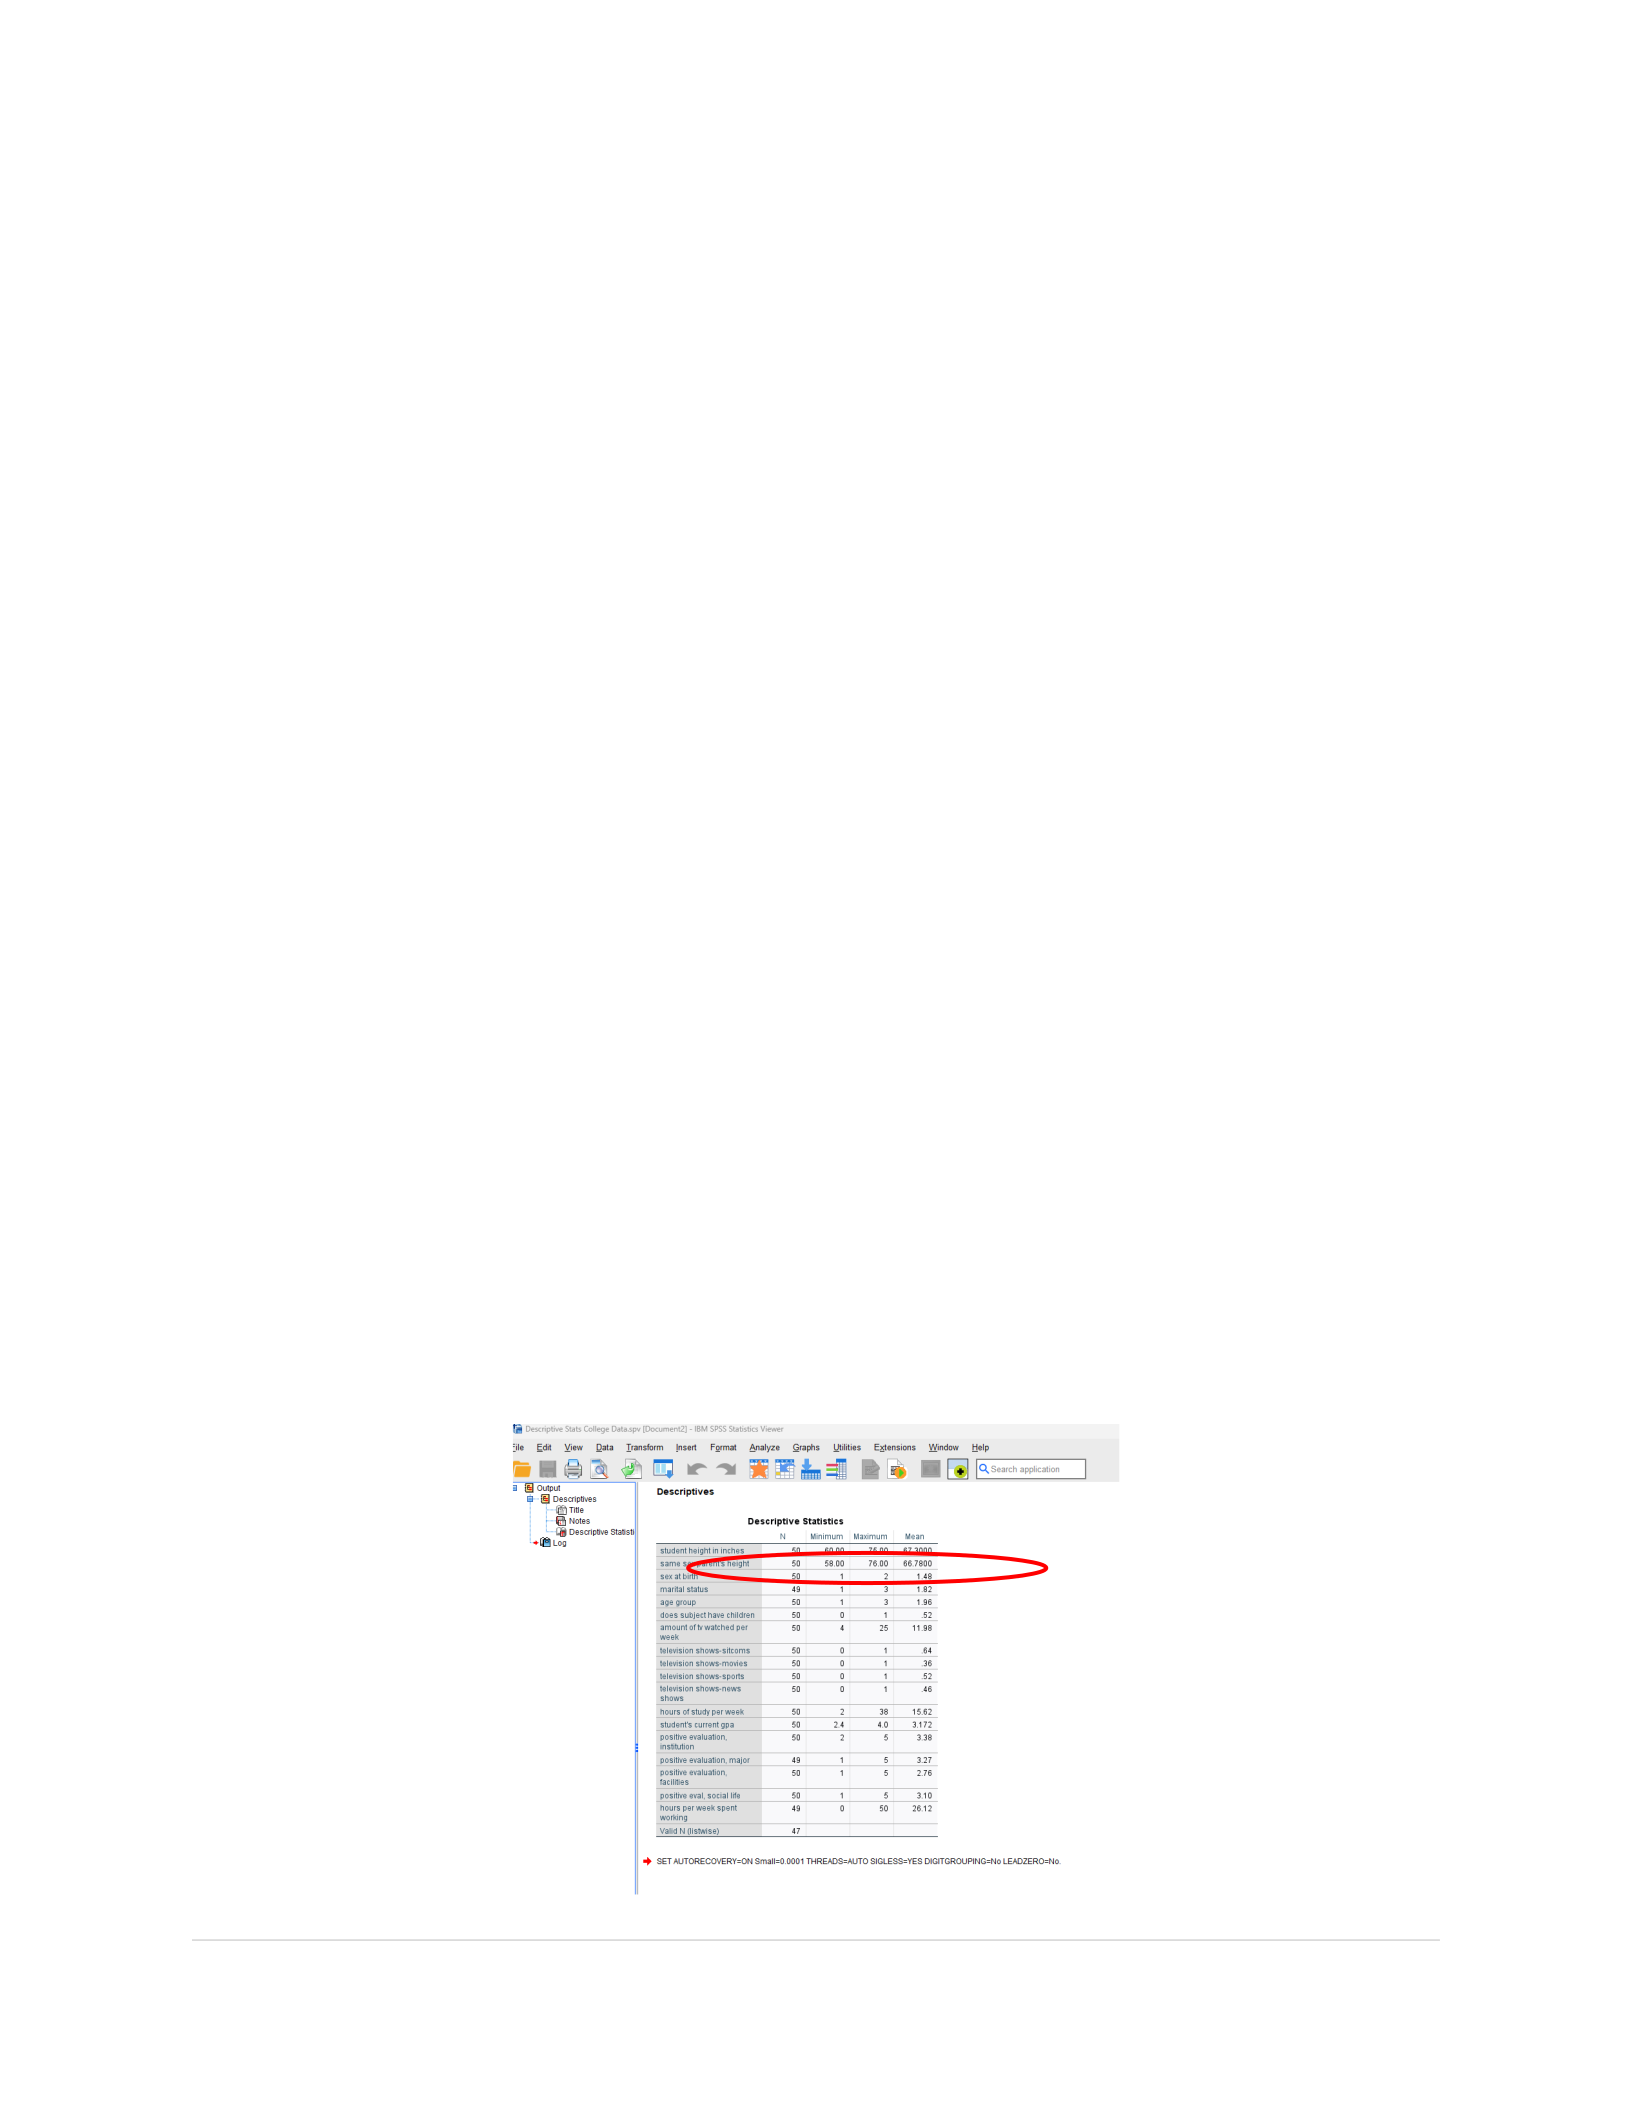
The N, minimum, maximum and mean were computed for the CollegeStudentData.sav
file, as shown in Figure 1.
Figure 1
SPSS Descriptive Statistics Output
BUSI 820: ASSIGNMENT 1
7 | January 19, 2025
Figure 2
SPSS Data Variable View
Results
The output from Figure 1 shows the population of students (N), as well as the minimum,
maximum and mean for each variable. The labels and variables are displayed and based on
subsequent information, the student’s height and same sex parent’s height would be valuable to
examine for potential correlation and causation of the two variables. The total number of
students analyzed were 50, but the computed and valid N is noted as 47 which means only 47
have complete data sets and 3 are were limited or incomplete. Looking at descriptive statistics
the 3 missing data sets are from the variables of marital status, positive evaluation major and
hours per week spent working. This is noted under the value N. Information that is not
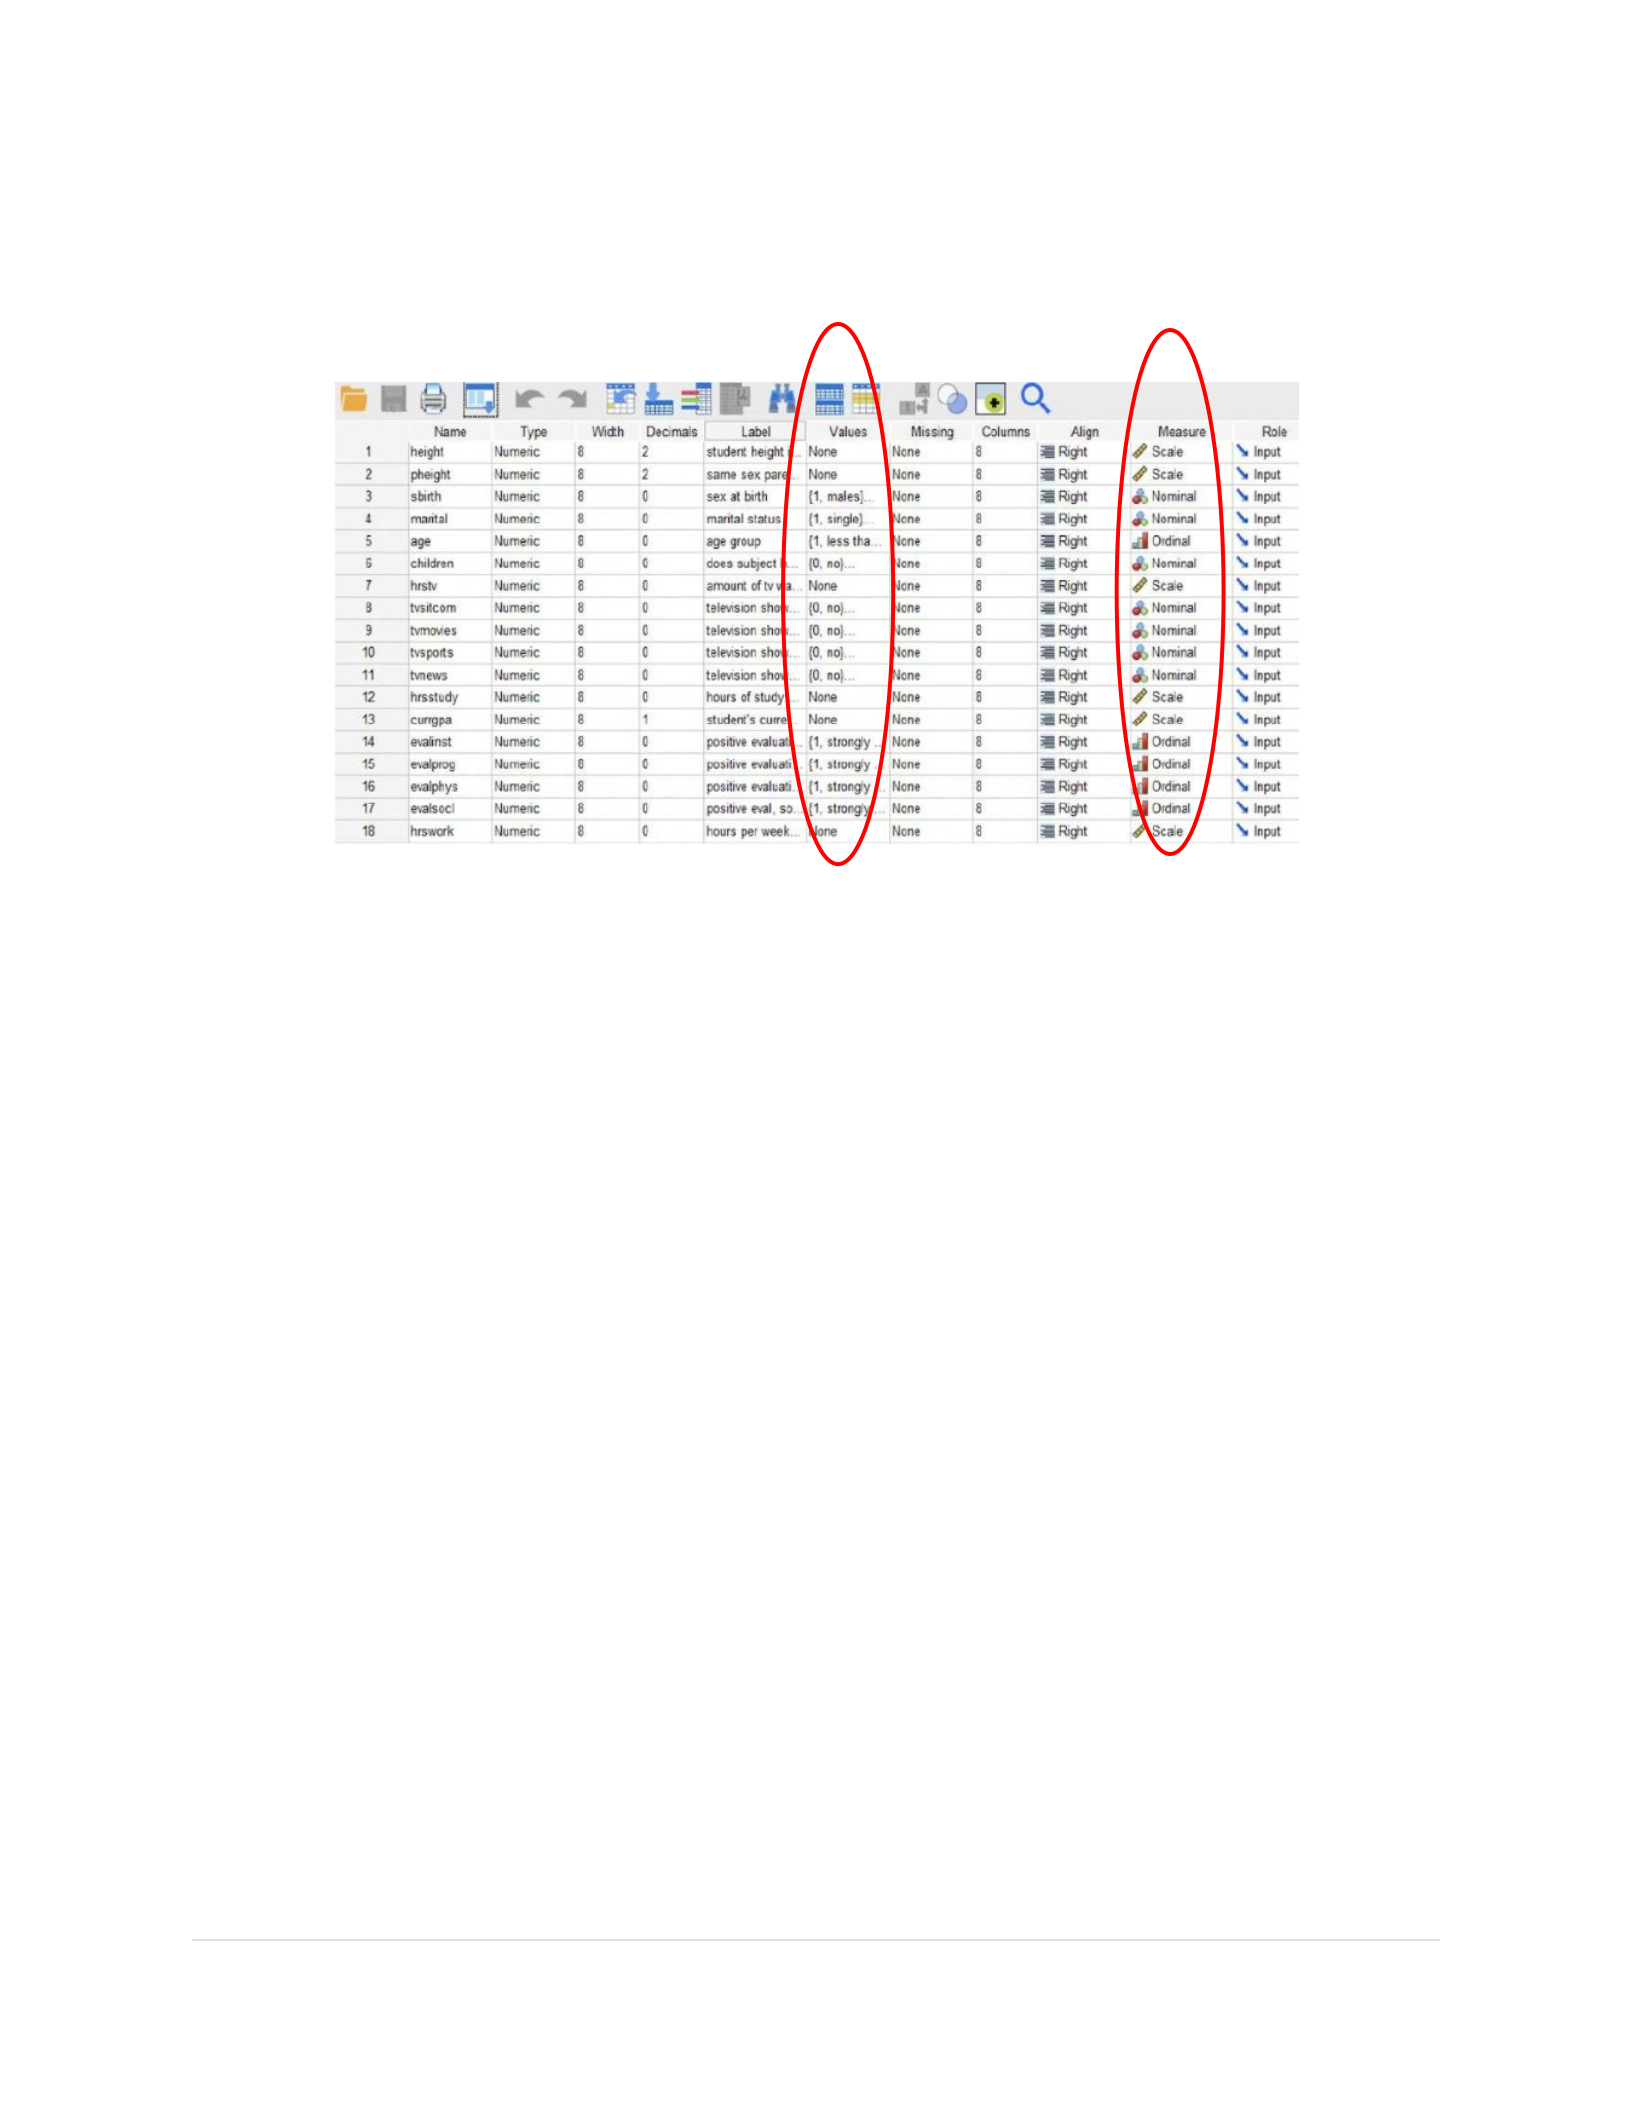
meaningful would-be datasets that are missing information. In Figure 2, it is shown values range
from 0 to 5 depending on the variable measure if scale, nominal or ordinal. In some data fields
under value, it returns none. This indicates some information may not be provided by
participants.
BUSI 820: ASSIGNMENT 1
8 | January 19, 2025
A.1: Chapter 2, Problem 2.1 What is the mean height of the students? What about the
average height of the same-sex parent? What percentage of students are males? What
percentage have children?
Figure 3
SPSS Descriptive Statistics for Student Height
Figure 4
SPSS Descriptive Statistics for Sex at Birth
BUSI 820: ASSIGNMENT 1
9 | January 19, 2025
Figure 5
SPSS Descriptive Statistics for Students with Children
Results
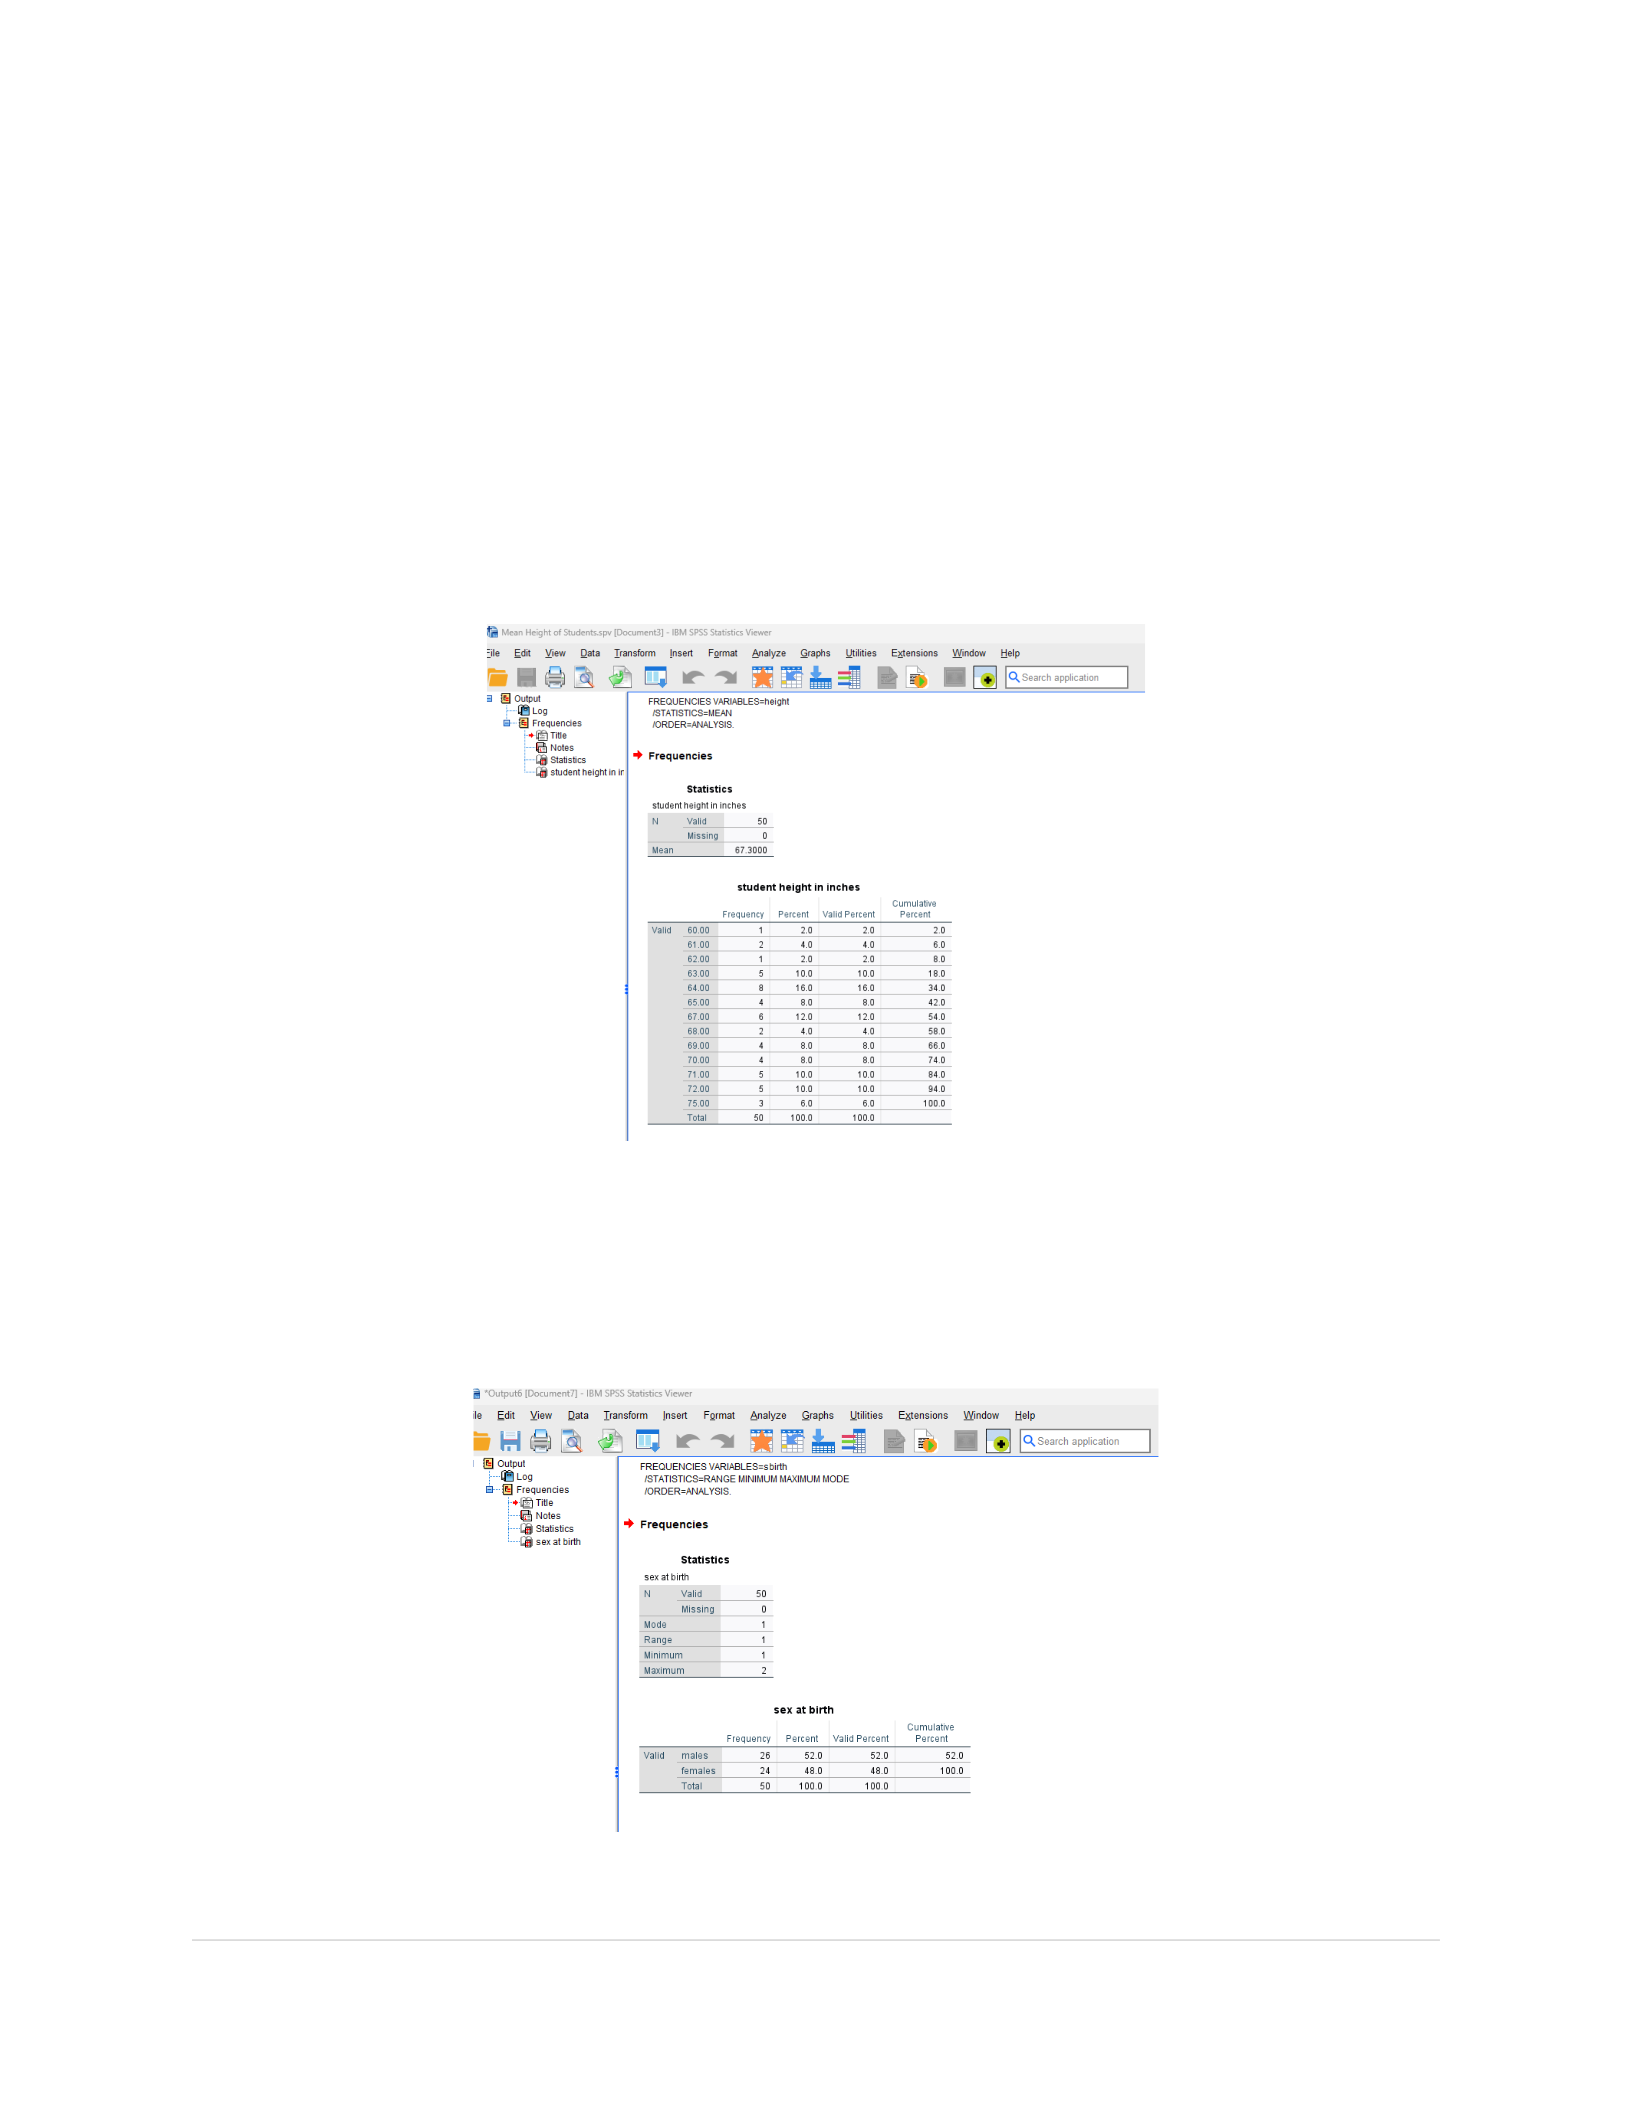
Noted in Figure 3, the descriptive statistics were analyzed to pull a report the mean height
of the students to be 67.300 inches. This information was calculated based on a variety of
reporting’s between 60 to 75 inches and the computing the by the value of N. Similarly, to the
individual descriptive statistics for heigh of students, noted in Figure 1, one can also see the
average for a variety of variables, like heigh of same-sex parent, being 66.7800 inches. What is
beneficial about a product like SPSS is the ability to look at overall variables, and also have the
option to analyze based on individual variable to pull up necessary information to review and
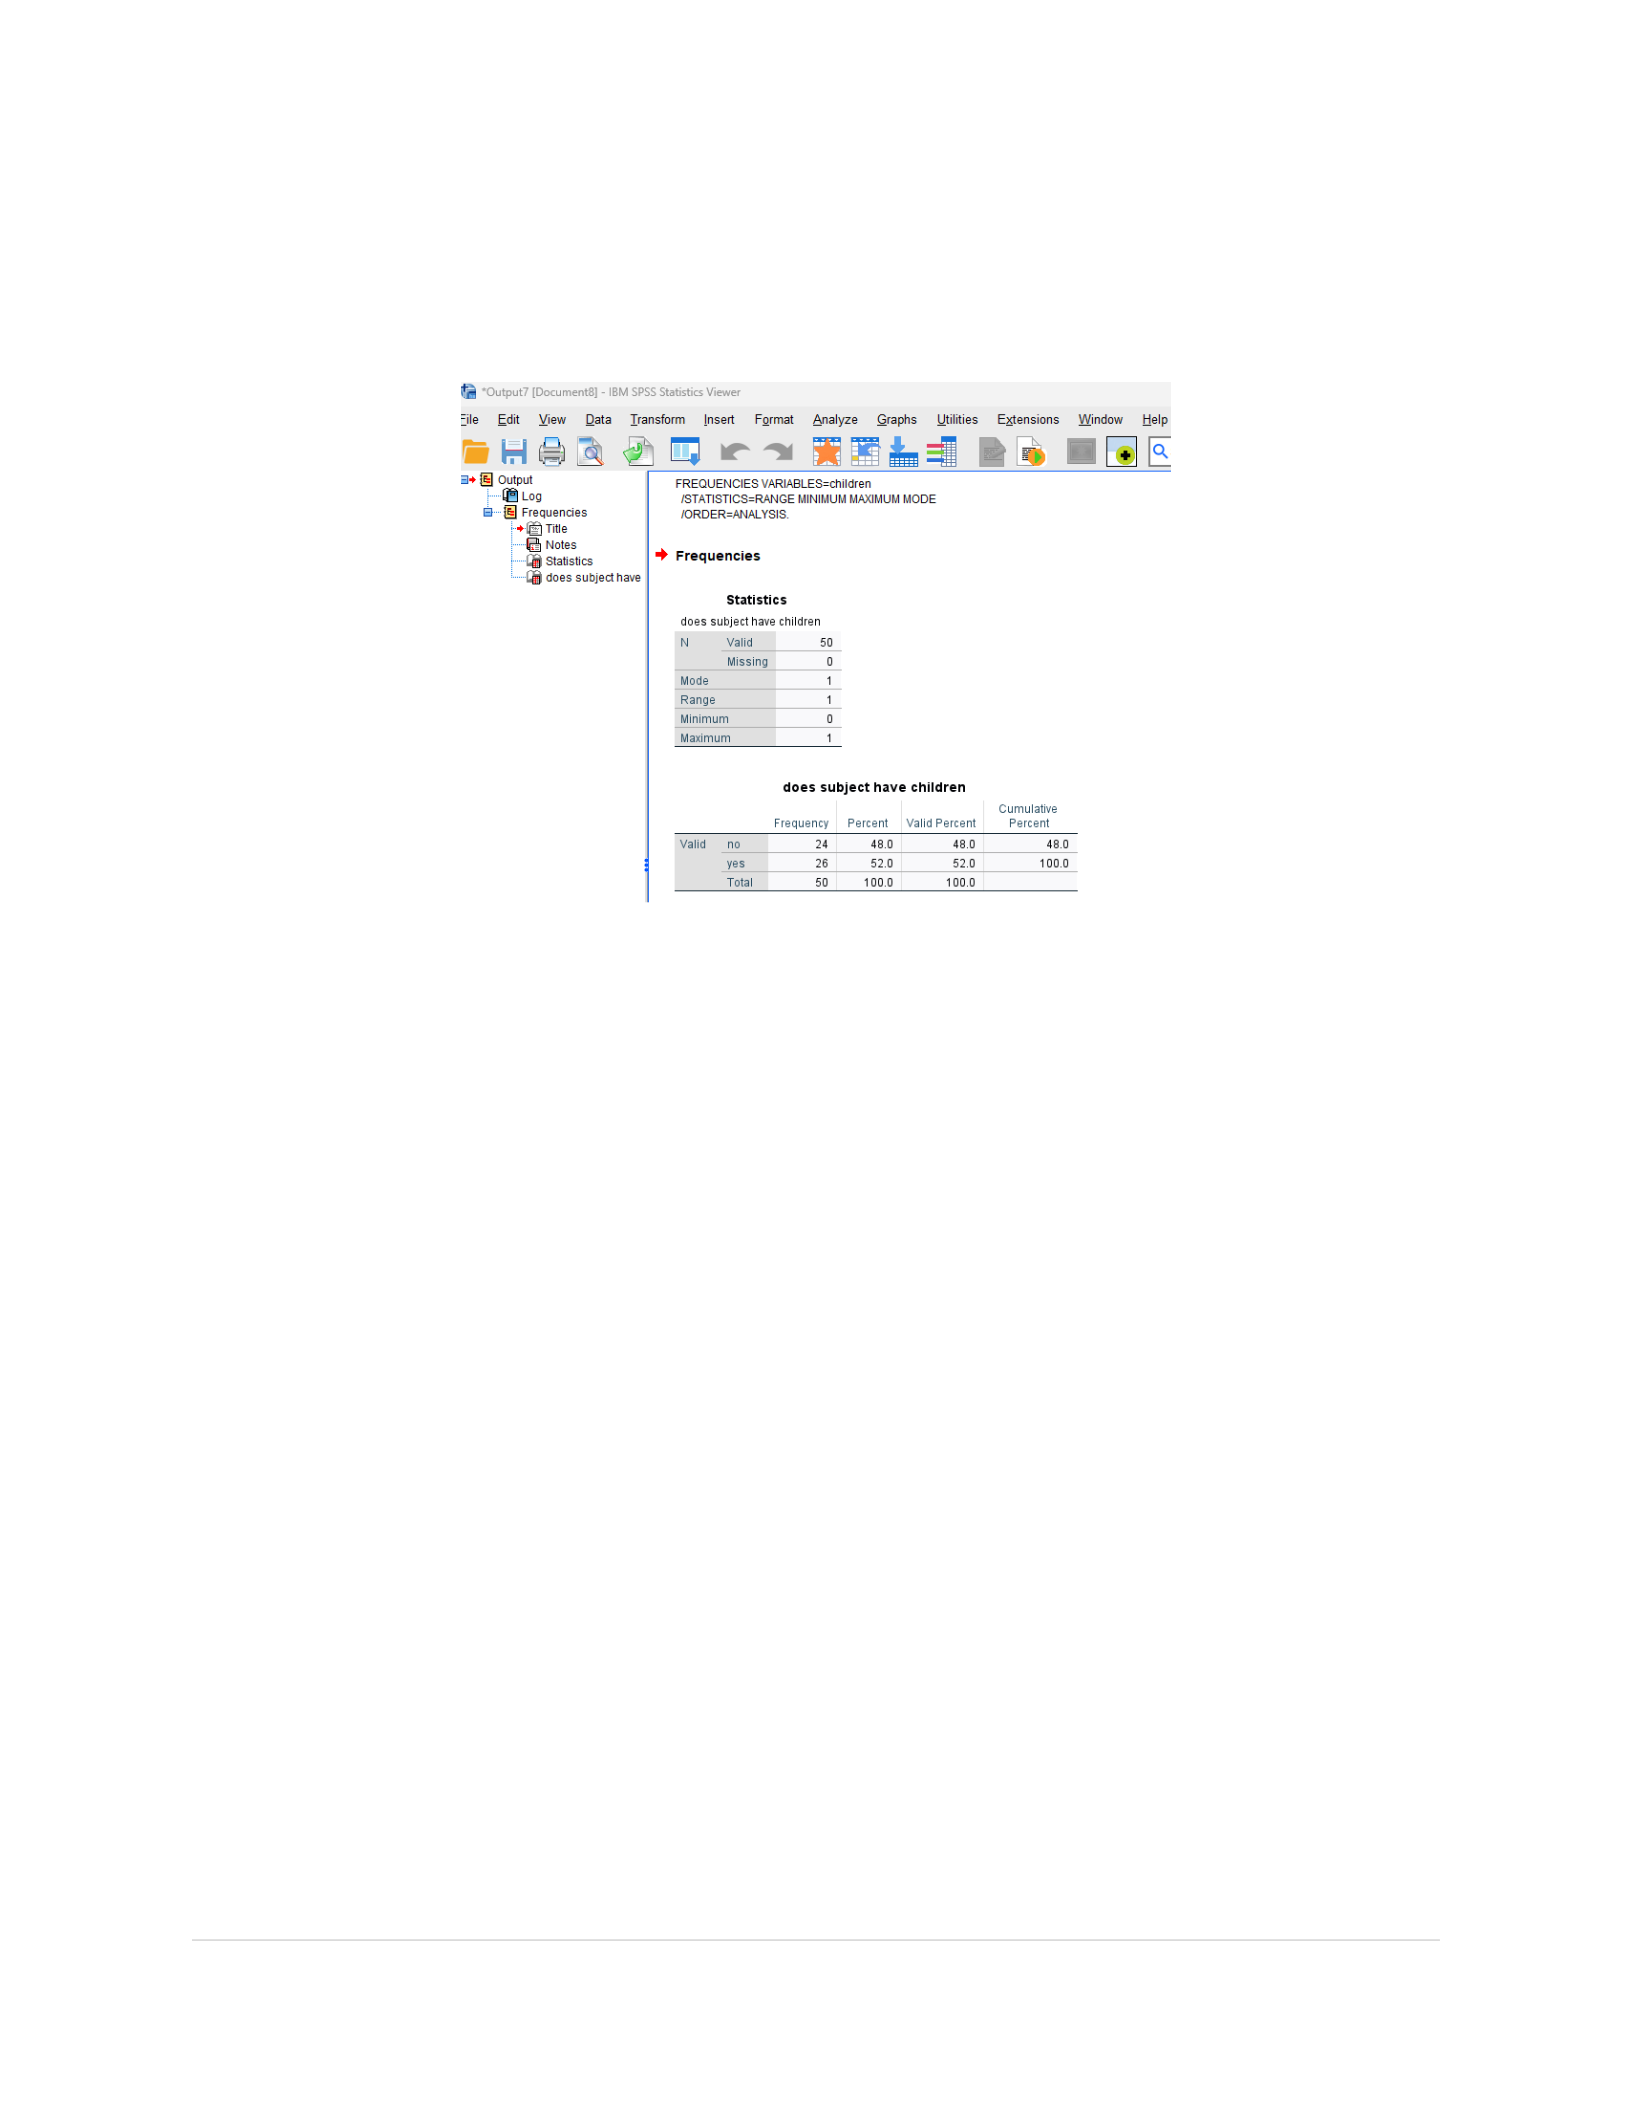
pinpoint, for example, percentages. The descriptive analysis was pulled for both students’ sex
and students who have children, Figure 4 and 5, respectively. It is noted that 52% of students are
males, and the remaining percentage to total a cumulative percentage of 100%, 48% are females.
The percentage of students who have children is 52%, and 48% do not have children.

BUSI 820: ASSIGNMENT 1
10 | January 19, 2025
Conclusion
The use of SPSS data software for analysis is important and beneficial for several
reasons. The user-friendly interface helps with accessibility and easy of manipulation and
analysis without need for extensive programming knowledge. The statistical test that are
provided help make it a versatile tool for a variety of variables and research topics makes it very
inclusive and manageable. The management features handle large data sets and perform complex
data transformations as well as support with high-quality graph charts in a clear and
understandable manner. The use of SPSS for data analysis is beneficial for comprehensive
statistical tests, robust data management, graphical representation, and reporting capabilities.
These features make it an essential tool for researchers, statisticians, and data analysts.

BUSI 820: ASSIGNMENT 1
11 | January 19, 2025
References
Morgan, G. A., Barrett, K. C., Leech, N. L., & Gloeckner, G. W. (2020).GIBM SPSS for
introductory statistics: Use and interpretationG(6th ed.). Routledge.

