


Running Head: QUANTITATIVE ANALYSIS 4th Sept 2021
Quantitative Analysis
Name
Institution
Professor
Date

QUANTITATIVE ANALYSIS 4th Sept 2021 2
Contents
Quantitative Analysis..................................................................................................................................2
Table 3.1. Descriptive Statistics..................................................................................................................2
Table 3.2. Ethnic Composition....................................................................................................................2
Table 3.3. Mother’s Education Status..........................................................................................................3
Table 3.4 Maths Achievement.....................................................................................................................4
Table 3.5. Academic Track..........................................................................................................................5
Figure 3.1. A bar Chart for Academic Track Record...................................................................................5
Figure 3.2. The bar chart above shows the mother’s education status.........................................................6
Figure 3.3. Ethnic Composition...................................................................................................................7
Histograms..................................................................................................................................................8
Figure 3.4. Mother’s Education...................................................................................................................8
Figure 3.5. Histogram for the Ethnic Composition of the respondents........................................................9
Frequency Polygons..................................................................................................................................10
Table 3.6. The range, standard deviation, and skewness............................................................................10
Table 3.7. The mean, median, and mode...................................................................................................11
QUANTITATIVE ANALYSIS 4th Sept 2021 3
Quantitative Analysis
Quantitative analysis is a statistical technique that deals with numerical values to present
meaningful information about the variables under investigation.
Statistics
Math achievement test Academic track Mother's education Ethnicity
N
Valid 75 75 75 75
Missing 0 0 0 0
Mean 12.564453 .55 4.11 4.35
Median 13.000000 1.00 3.00 1.00
Mode 14.3330 1 3 1
Std. Deviation 6.6703064 .501 2.240 15.722
Variance 44.493 .251 5.015 247.175
Range 25.3340 1 8 98
Minimum -1.6670 0 2 1
Maximum 23.6670 1 10 99
Table 3.1. Descriptive Statistics
The table above shows a summary of the descriptive statistics for the hsbdata. The data
set contains 75 valid cases.
Ethnic ethnicity
Code Frequency Percent Valid Percent Cumulative
Percent
Valid
1 41 54.7 54.7 54.7
2 15 20.0 20.0 74.7
3 10 13.3 13.3 88.0
4 7 9.3 9.3 97.3
98 1 1.3 1.3 98.7
99 1 1.3 1.3 100.0
Total 75 100.0 100.0
Table 3.2. Ethnic Composition
The table above shows the percentage and the cumulative percentages for the variable
ethnicity of the study respondents. Code 1,2,3,4,98, and 99 indicates the major ethnic
composition of the study participants. Forty-one out of the seventy-five respondents comprise
QUANTITATIVE ANALYSIS 4th Sept 2021 4
54.7% of the study respondents who belong to ethnic group code 1 which is the majority. Only
one out of the seventy-five respondents belong to the ethnic group Code 98 and 99, which gives
the minority groups of the study participants making 2.6% of the total study group. All the study
participants responded to the question, which gives 100% valid cases in the study sample.
Mother's Education
Code Frequency Percent Valid Percent Cumulative Percent
Valid
2 17 22.7 22.7 22.7
3 31 41.3 41.3 64.0
4 2 2.7 2.7 66.7
5 5 6.7 6.7 73.3
6 7 9.3 9.3 82.7
7 5 6.7 6.7 89.3
8 3 4.0 4.0 93.3
9 3 4.0 4.0 97.3
10 2 2.7 2.7 100.0
Total 75 100.0 100.0
Table 3.3. Mother’s Education Status
The respondent’s mother’s education was categorized into nine ordered measures coded
from 2 through 10. Thirty one out of the seventy-five study sample had their mothers attain
education level of code 3 which makes 41.3% of the total respondents. Education status code 4
and 10 had two respondents each which makes 5.4% of the total sample. Code 8 and 9 had three
respondents each, which makes 8% of the total respondents.
Math Achievement Test
Frequency Percent Valid Percent Cumulative Percent
Valid -1.6670 1 1.3 1.3 1.3
1.0000 2 2.7 2.7 4.0
2.3330 1 1.3 1.3 5.3
3.6670 3 4.0 4.0 9.3
4.0000 2 2.7 2.7 12.0

QUANTITATIVE ANALYSIS 4th Sept 2021 5
5.0000 5 6.7 6.7 18.7
5.3330 1 1.3 1.3 20.0
6.3330 2 2.7 2.7 22.7
6.6670 1 1.3 1.3 24.0
7.6670 4 5.3 5.3 29.3
8.0000 1 1.3 1.3 30.7
9.0000 4 5.3 5.3 36.0
9.3330 1 1.3 1.3 37.3
10.3330 4 5.3 5.3 42.7
10.6670 1 1.3 1.3 44.0
11.6670 2 2.7 2.7 46.7
12.0000 2 2.7 2.7 49.3
13.0000 3 4.0 4.0 53.3
14.3330 9 12.0 12.0 65.3
14.6670 1 1.3 1.3 66.7
15.6670 2 2.7 2.7 69.3
17.0000 5 6.7 6.7 76.0
18.3330 1 1.3 1.3 77.3
18.6670 1 1.3 1.3 78.7
19.6670 3 4.0 4.0 82.7
20.3330 1 1.3 1.3 84.0
21.0000 3 4.0 4.0 88.0
22.3330 2 2.7 2.7 90.7
22.6670 1 1.3 1.3 92.0
23.6670 6 8.0 8.0 100.0
Total 75 100.0 100.0
Table 3.4 Maths Achievement
The table above show the Math scores for the study participant. The lowest scored an
aggregate of -1.6670 and the highest had 23.6670 out of the total school. Nine students scored
14.330 which makes 12.0% of the study participants. All the respondents gave their maths score
which makes 100% valid cases in the study variable. The table gives a column for the frequency,
QUANTITATIVE ANALYSIS 4th Sept 2021 6
percent, valid percent and the cumulative percentage. The frequency is the number of times each
score is appearing among the study participants.
Academic Track
Frequency Percent Valid Percent Cumulative
Percent
Valid
0 34 45.3 45.3 45.3
1 41 54.7 54.7 100.0
Total 75 100.0 100.0
Table 3.5. Academic Track
The table above shows the academic track for the respondents where 45.3% of the study
participants agreed that they achieved code 0 and 54.7% agreed they achieved code 1. The
variable academic track is dichotomous in that it has only two ordered responses. There was no
observed missing case in the sample responses.
0 1
0
5
10
15
20
25
30
35
40
45
34
41
Academic Track
Frequency
Figure 3.1. A bar Chart for Academic Track Record
The figure above shows the bar representation of the two academic track records. The
data is dichotomous with only two ordered measurements. Academic track code zero had a total
QUANTITATIVE ANALYSIS 4th Sept 2021 7
of 34 respondents out of the total seventy-five, while code one had forty-one respondents. It
implies that the majority of the sampled students had achieved more of code one than code zero.
2 3 4 5 6 7 8 9 10
0
5
10
15
20
25
30
35
17
31
2
5
7
5
332
Mother's Education
Frequency
Figure 3.2. The bar chart above shows the mother’s education status.
The figure above shows the distribution of the students' mothers' education. The majority
of the mothers had attained code three levels of education which forms 41.3% of the total
respondents. It is closely followed by two at 22.7 percent. Code ten and code four each had two
mothers representing 2.7 percent of the sampled students' mothers. Code nine and eight had three
mothers each which make 4 percent of the total study sample. The data is not symmetrical
because majority of the students' mothers had attained code three levels of education and very
few acquiring code ten and four levels of education.
QUANTITATIVE ANALYSIS 4th Sept 2021 8
1 2 3 4 98 99
0
5
10
15
20
25
30
35
40
45 41
15
10
7
1 1
Ethnicity
Frequency
Figure 3.3. Ethnic Composition.
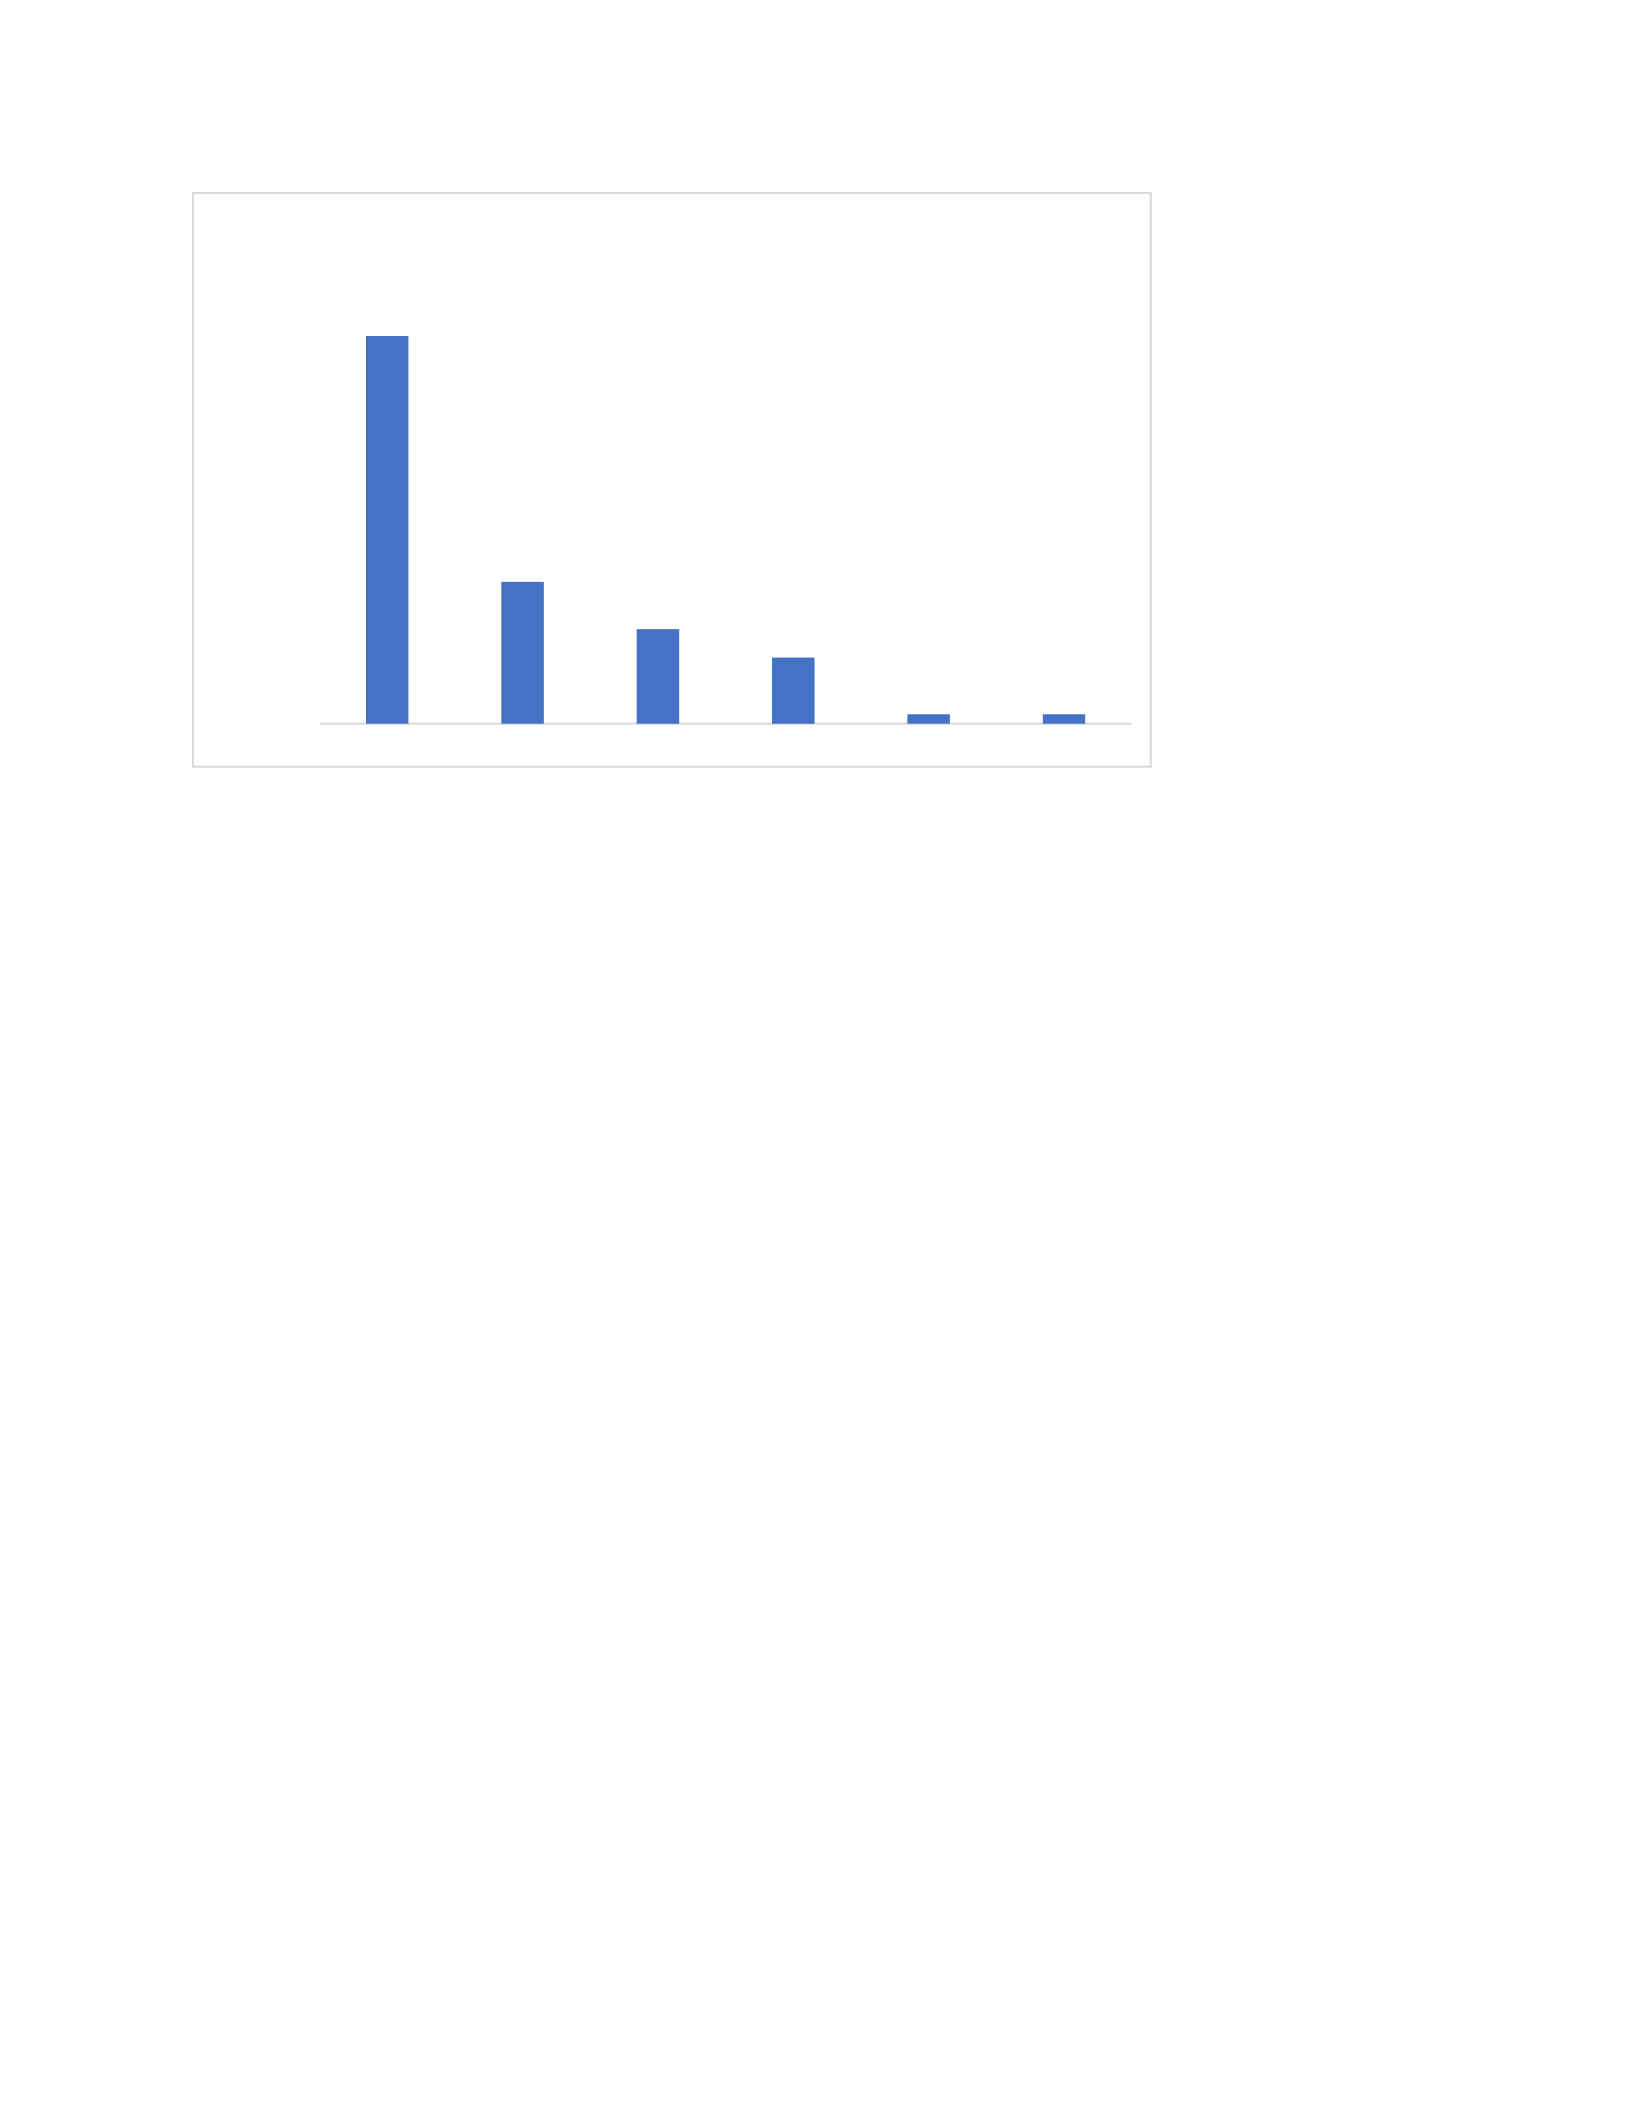
The majority of the students reported being from code one ethnic group, which had a total
of forty-one students out of the possible seventy-five sampled students. It is closely followed by
code 2 with fifteen students. Next is ethnic code three with ten students. Code four has seven
respondents, while codes 98 and 99 have one student each.
A bar chart for the math achievement will not be appropriate because the values are not
grouped and would not provide a meaningful representation of the data. The math achievement
data points are discrete but over a large interval making it difficult to construct a bar chart to
represent the data. The bars would be too many, each representing the individual data which
would not give an appropriate representation of the data. A feasible option to represent the data
using a bar chart would be to group it using an appropriate interval and then constructing the bars
using the chosen groups.
QUANTITATIVE ANALYSIS 4th Sept 2021 9
Histograms
Histograms represent data using stacked bars. Unlike a bar chart with spaces between the
different bars, a histogram has its bars without spaces between them. The height of the bars is
equivalent to the frequency of the attribute being presented.
Figure 3.4. Mother’s Education
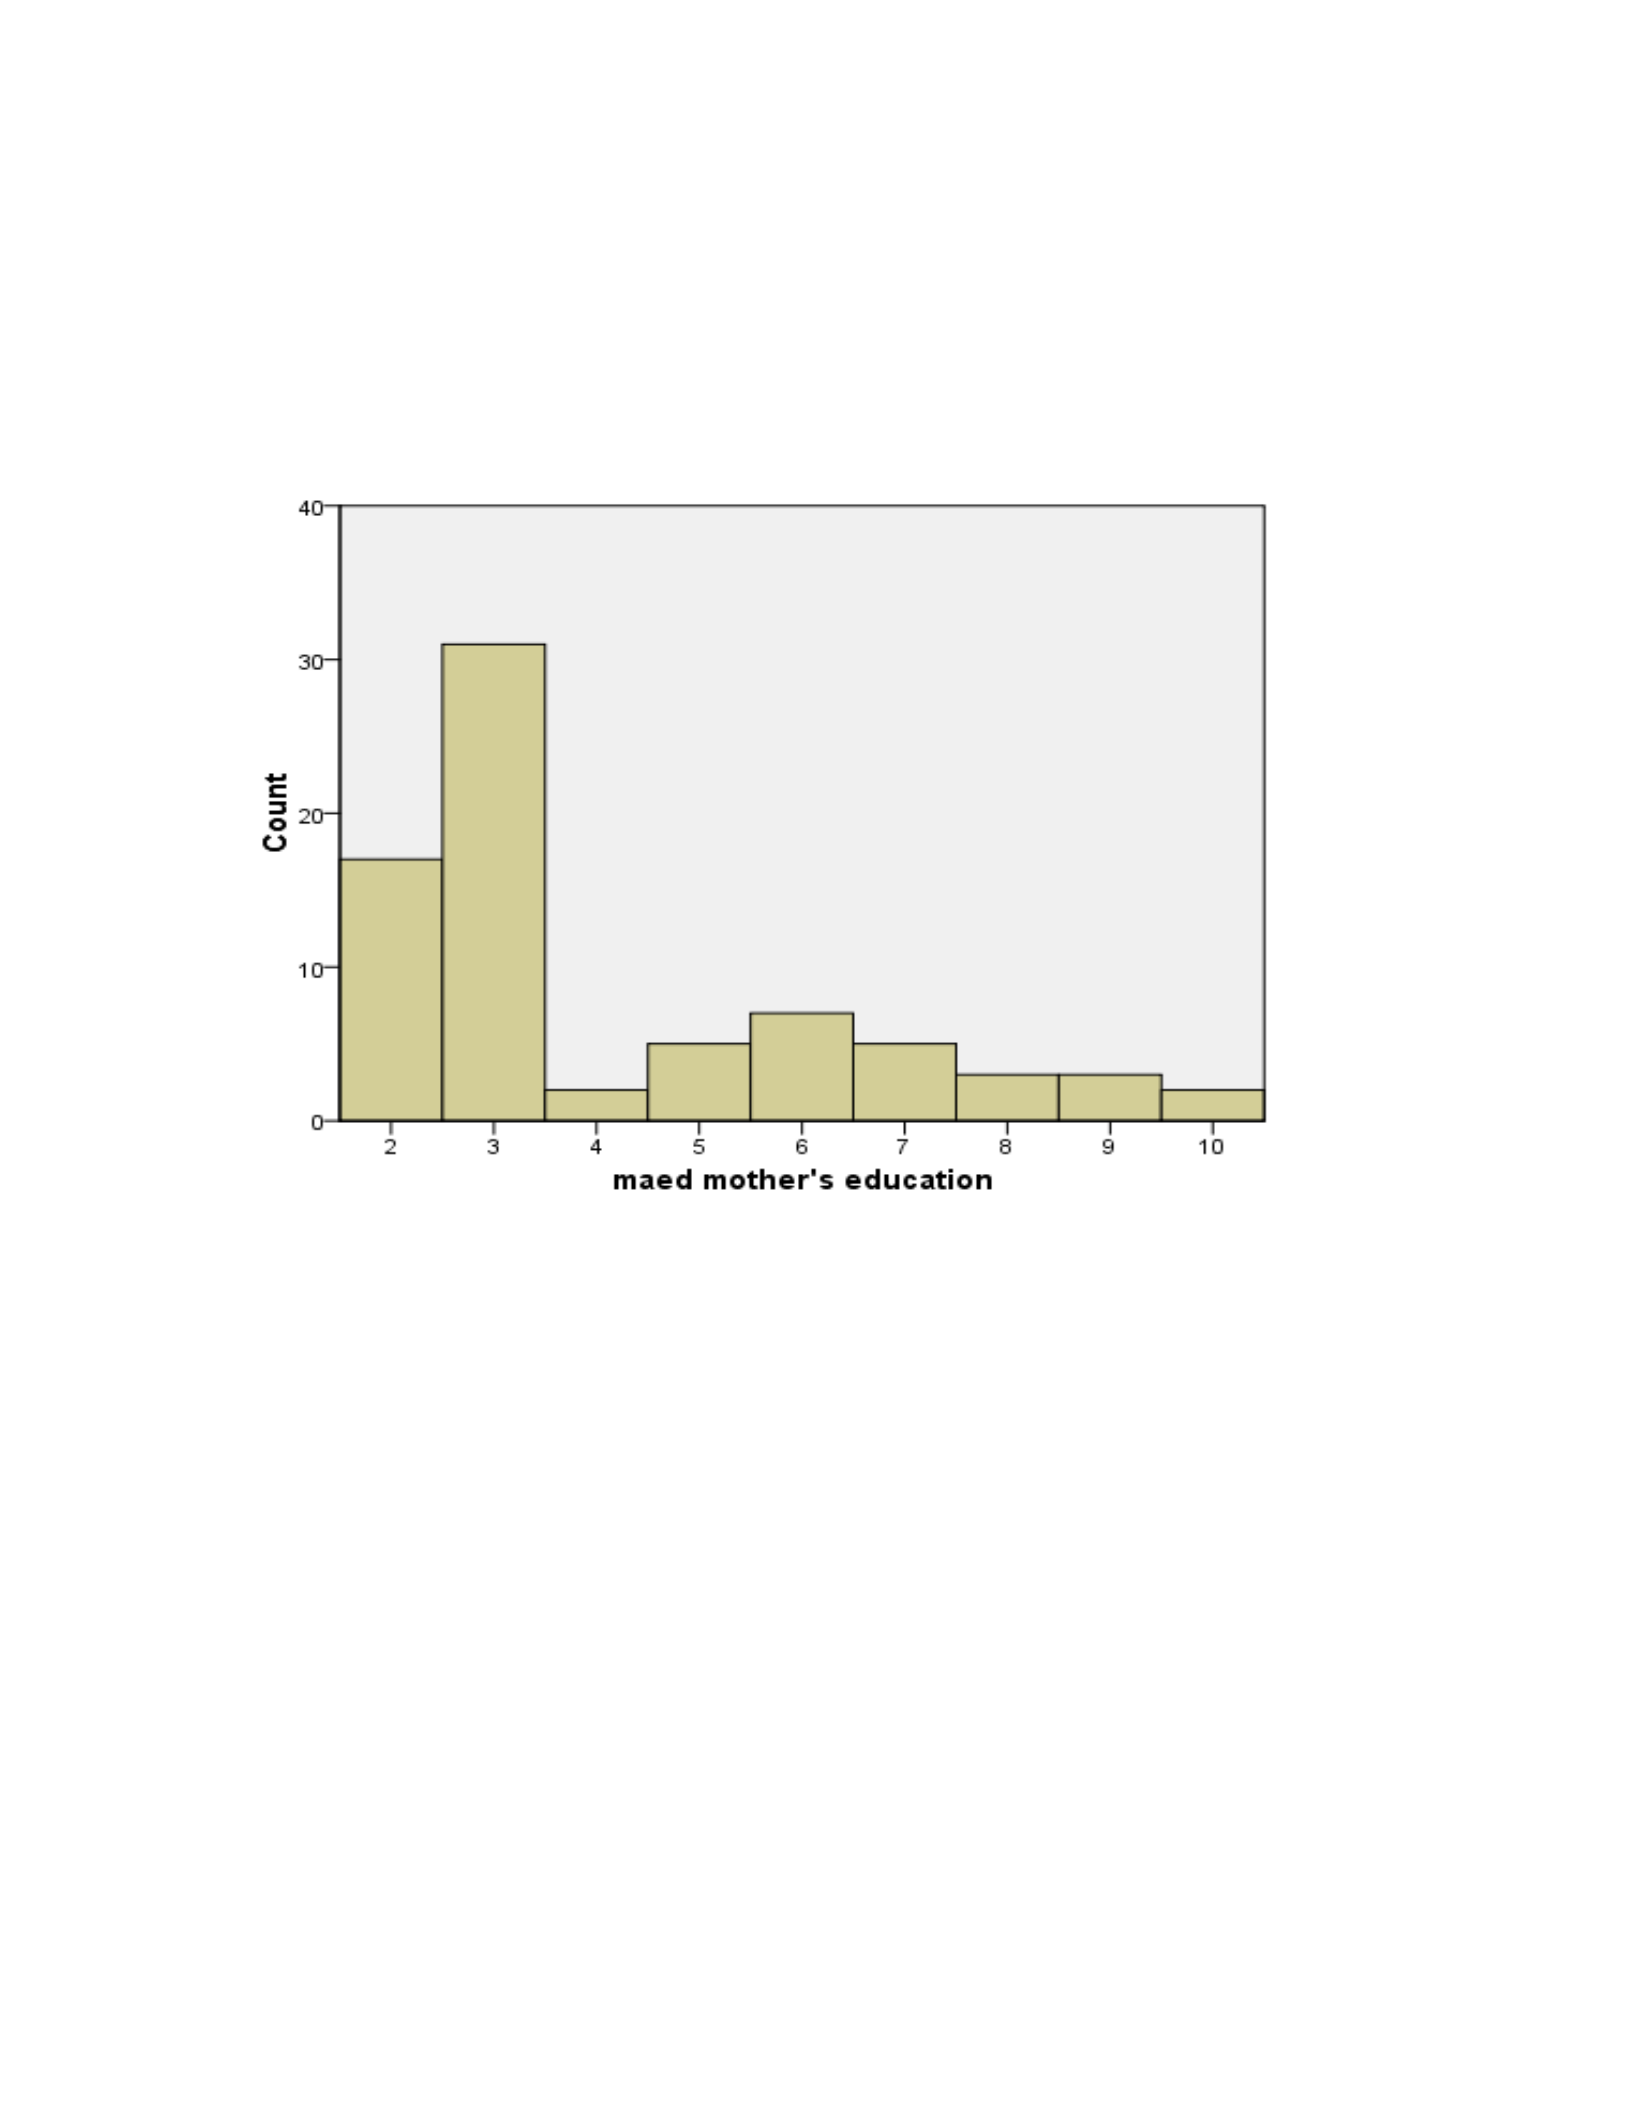
The histogram above gives a visual representation of the student's mother's educational
background. The vertical axis of the histogram gives the frequency of the different education
background codes obtained from the sampled students. The horizontal axis gives the education
background codes, with the code being indicated at the center of the bars. If the data was
grouped, the upper- and lower-class boundaries would be used to label each bar. The width of the
bars would be equivalent to the class interval. Most of the mothers have achieved code three
level of education, which gives 41.3% of the total study respondents. It is closely followed by
two at 22.7 percent. Code ten and code four each had two mothers representing 2.7 percent of the
QUANTITATIVE ANALYSIS 4th Sept 2021 10
sampled students' mothers. Code nine and eight had three mothers each which make 4 percent of
the total study sample. The data is not symmetrical because majority of the students' mothers had
attained code three level of education, and very few acquiring code ten and four levels of
education
Figure 3.5. Histogram for the Ethnic Composition of the respondents
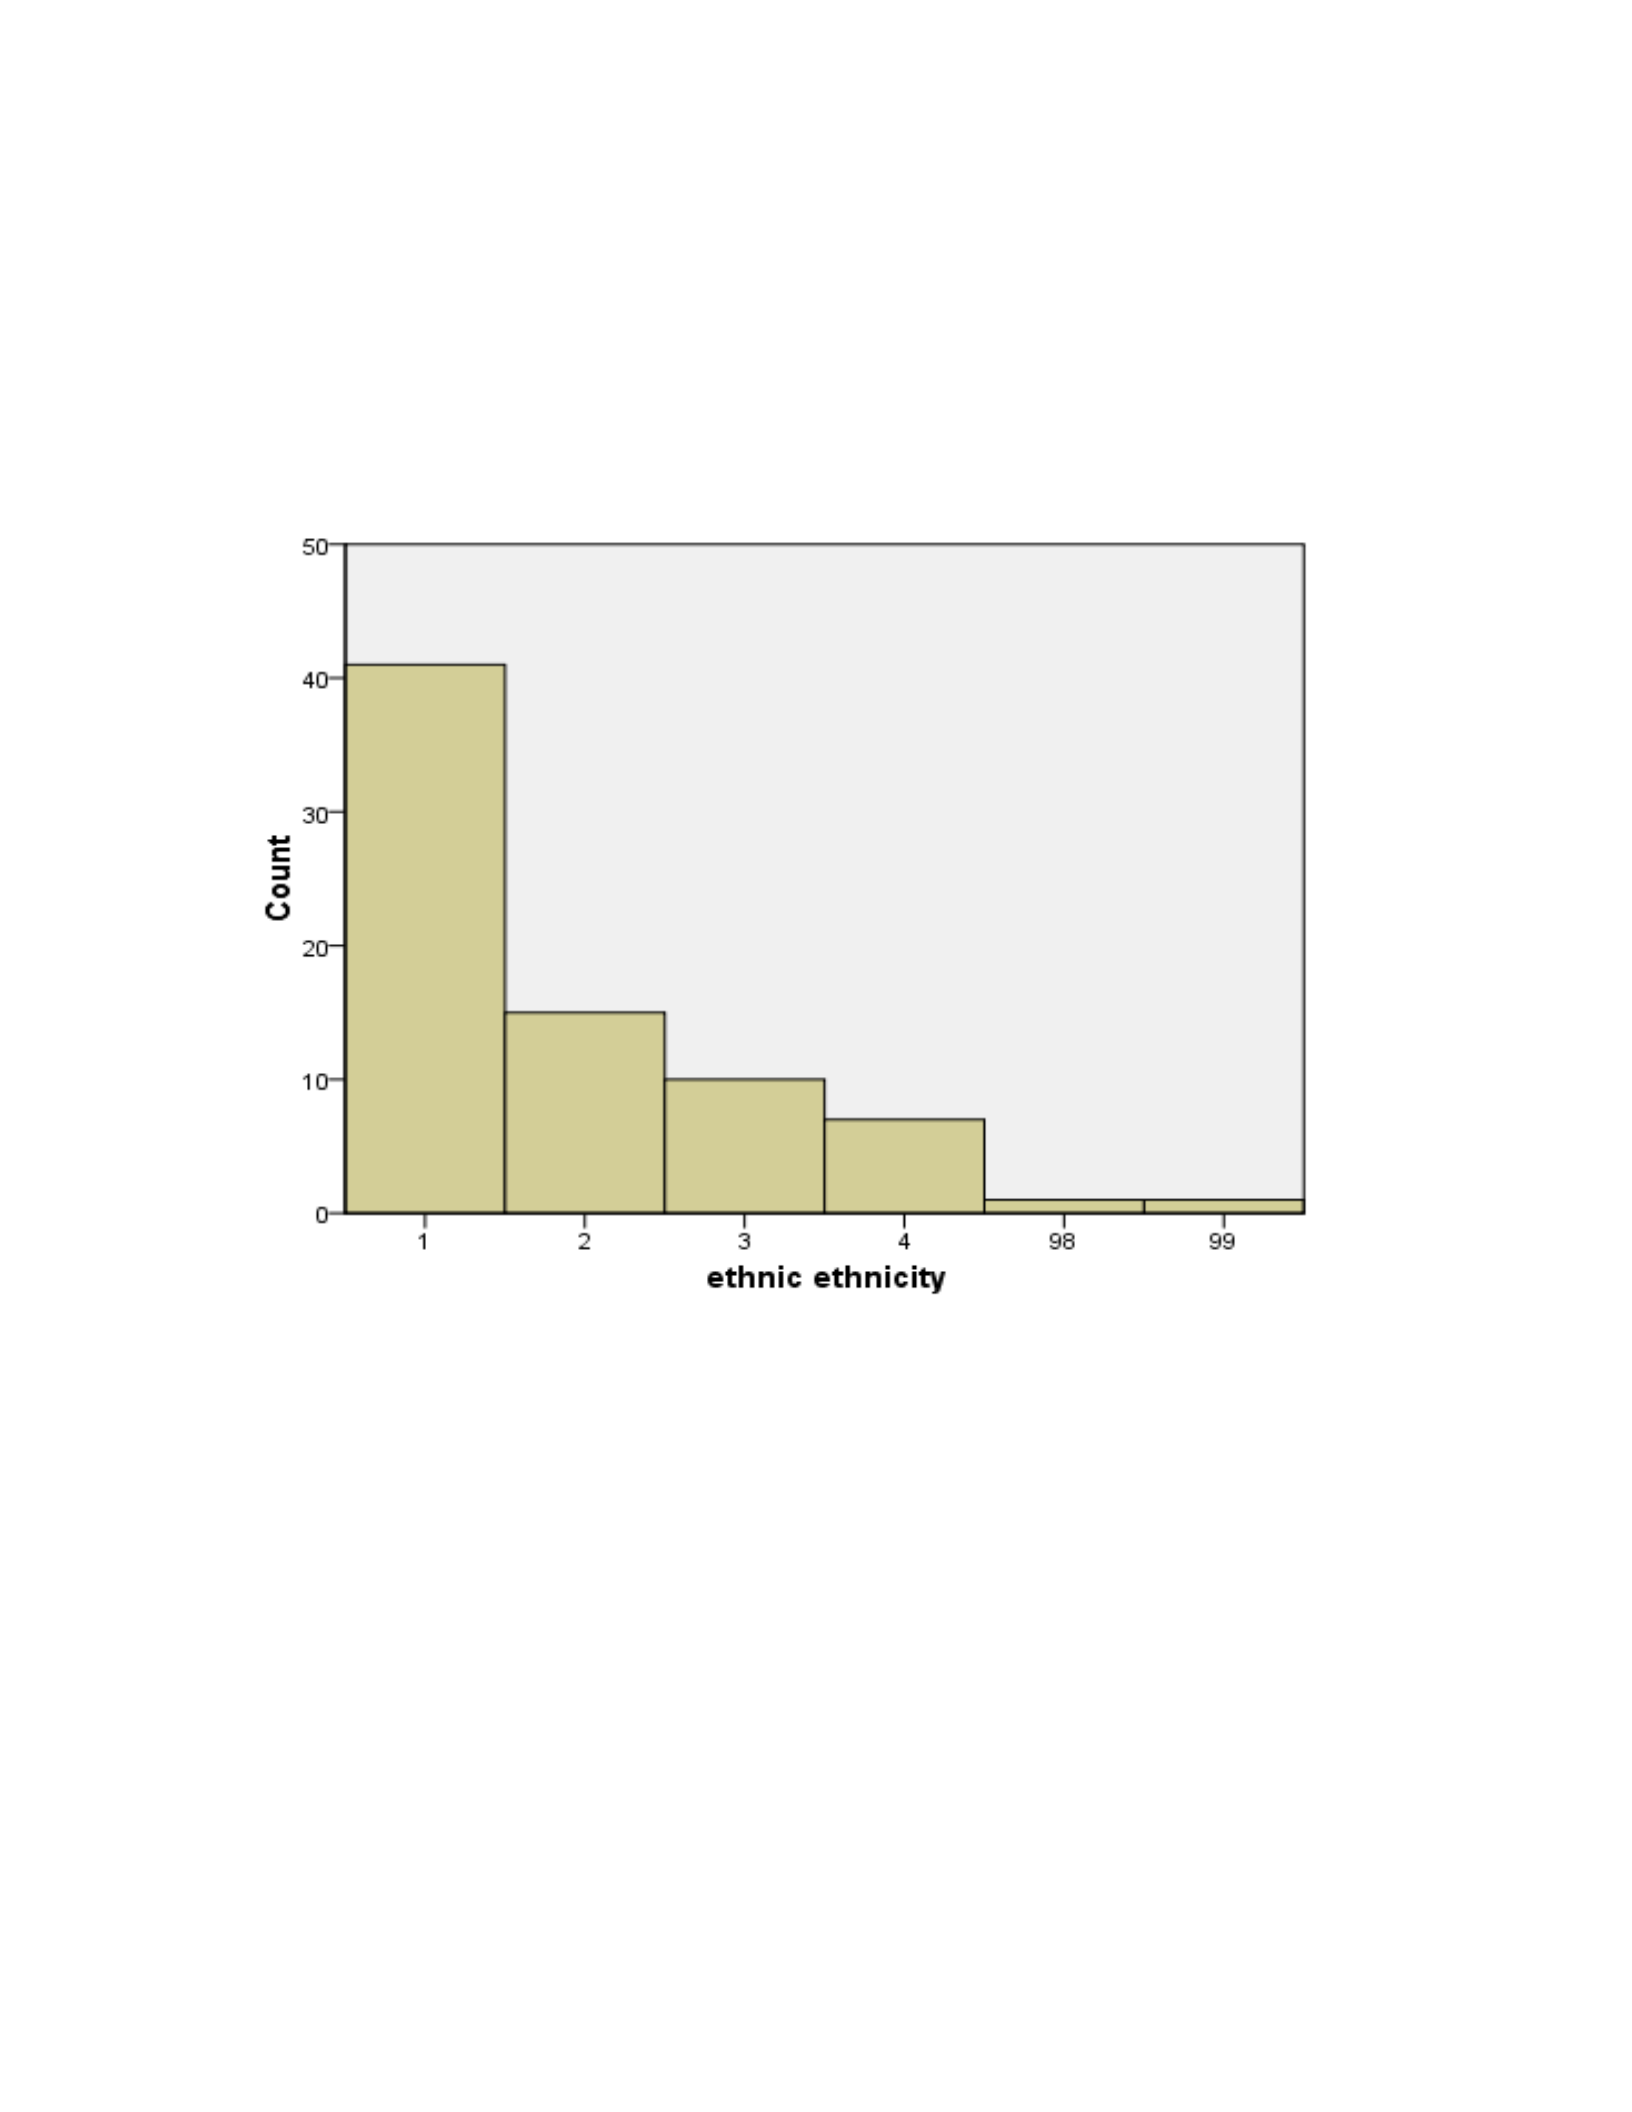
Most of them belonged to ethnic group code one comprising of forty-one individuals. It
means that the study area was widely occupied by a majority of code 1. The next major group is
given by code 2 with fifteen students. Next is ethnic code three with ten students. Code four has
seven respondents, while codes 98 and 99 have one student each. All the study respondents gave
information about their ethnic affiliation giving 100% valid cases of the response.
QUANTITATIVE ANALYSIS 4th Sept 2021 11
It is not possible to represent the academic track and math achievement using a histogram
because the variables are not grouped into unique groups. The A histogram for the academic
track and math achievement variables will not provide any meaningful representation of the data.
The bars would be relatively many, making it look like a line graph which does not provide a
clear visual representation of the data.
Frequency Polygons
It will not be possible to create frequency polygons for the four variables because the data
is not grouped. The data is not normally distributed to produce a line of symmetry for the data
variables being analyzed. A frequency polygon or an ogive is given by joining the mid-point of
the bars in a histogram for grouped data variables. Grouping the data works to normalize the data
where a frequency polygon peaks highest at the line of symmetry for the data. A frequency
polygon is similar to the normal curve for normally distributed data points.
Measures of Dispersion
Math
achievement test
Academic track
Achievement
Mother's
education
Ethnic Affiliation
N
Valid 75 75 75 75
Missing 0 0 0 0
Std. Deviation 6.6703064 .501 2.240 15.722
Skewness .044 -.191 1.124 5.958
Std. Error of Skewness .277 .277 .277 .277
Range 25.3340 1 8 98
Table 3.6. The range, standard deviation, and skewness
The three measures of dispersion show how data is spread from the mean. The range
gives the difference between the largest and the smallest value in a data set. The standard
deviation is the square root of the variance, which indicates how data values deviate from the
mean value of a given data set. In statistics, skewness is the asymmetry or distortion of data from
QUANTITATIVE ANALYSIS 4th Sept 2021 12
a normal distribution. Symmetrical data has a skewness coefficient of zero. The computed
measures of dispersion may not give an accurate representation of the information because the
statistical software computed the given code as quantitative data. The given values are in terms
of the code given in the data. The range would be the best measure of dispersion because it gives
how the data is spread from the smallest to the largest. It shows how the values are distributed in
the data set.
Measures of Central Tendency
Math
achievement
test
Academic track Mother's
education
Ethnicity
N
Valid 75 75 75 75
Missing 0 0 0 0
Mean 12.564453 .55 4.11 4.35
Median 13.000000 1.00 3.00 1.00
Mode 14.3330 1 3 1
Table 3.7. The mean, median, and mode
The mean of a data set gives the average value of the whole data. You sum the total
values and dividing them by the total number of items in the data set. The median gives the
central value in a data set. The mode is the number appearing the most in a data set. The
measures of central tendency given in the table above are computed based on the codes given for
the four variables: the maths achievement, mother's education background, ethnicity, and
academic track for the study respondents. The mean is the best measure of central tendency
because it gives an average score required from each item. Computing the mean shows how far
every individual is from the average value. The mean value for the academic achievement
variable shows the average score for the seventy-five students who were sampled.

QUANTITATIVE ANALYSIS 4th Sept 2021 13
References
Aljandali, A. (2016).CQuantitative analysis and IBM® SPSS® statistics. Springer International
Publishing.
Asmus, E. P., & Radocy, R. E. (2017). Quantitative analysis. InCCritical Essays in Music
EducationC(pp. 129-172). Routledge.
Sheard, J. (2018). Quantitative data analysis. InCResearch Methods: Information, Systems, and
Contexts, Second EditionC(pp. 429-452). Elsevier.

