


Employee Rewards
With the aim of understanding how rewards affected employee turnover the study
employed the use of a Likert scale to rate some statements associated with rewards. The
Likert scale was divided into five points where: 1= Strongly Disagree, 2 Disagree,
3=Neither Agrees or Disagrees, 4= Agree, 5= Strongly Disagree. Table 4.8 presents the
findings.
Table Employee Rewards
Statement N Mean Std. Deviation
Rewards are given based on individual
performance 70 2.91 0.258
I enjoy rewards offered by my organization 70 2.85 0.318
I am given bonuses based on my performance
in my organization 70 2.67 0.334
My organization offers other non- monetary
rewards 70 2.6 0.256
The evaluation of performance in my
organization is fair and translates into
rewards
70 2.57 0.037
Total Aggregate 70 2.72 0.241
Source: Primary Data, 2022
Table 4.8 indicated the respondents were uncertain about how employee rewards influenced
employee turnover in the hospital. This was indicated by an average mean of
2.72. The 0.241 showed unanimity among respondents’ ratings. Individual assessment of
the statements that make the employee rewards respondents neither agreed nor disagreed
that rewards are given based on individual performance with mean 2.91. The standard
deviation 0.258 indicated a general consensus among the respondent’s ratings. Moreover,
respondents neither agreed nor disagree on how the evaluation of performance in their

organization is fair and translates into rewards with a mean of 2.57. The standard
deviation of 0.037 showed agreement in the respondents’ scores.
Wages and Salary
With the intention of comprehending how wages and salary affected employee turnover,
the study employed the use of a Likert scale. The Likert scale was divided into five points
where: 1= Strongly Disagree, 2 Disagree, 3=Neither Agrees or Disagrees, 4= Agree, 5=
Strongly Disagree. Table 4.9 presents the findings.
Table Wages and Salary
Statement
N
Mean Std.
Deviation
I am fairly compensated on my position
and my skills development 70 2.67 0.266
I am satisfied by the salary my
organization offers 70 2.65 0.303
My organization regularly reviews the
employees’ wages and salary 70 2.65 0.251
My salary ranges to the salary offered in
the market 70 2.59 0.317
I am compensated my salary in a timely
manner 70 2.42 0.384
Total Aggregate 70 2.6 0.304
Source: Primary Data, 2022
Table 4.9 above indicates that the respondents were unresolved about how wages and
salary as factor influenced employee turnover. This was indicated by an aggregate mean
of
2.6. The standard deviation of 0.304 indicated a general consensus among the
respondent’s views.
In regards to individual statements on wages and salary, the respondents neither agreed
nor disagreed that they were fairly compensated on their position and their skills
development with mean 3.67. The standard deviation 0.266 indicated agreements in the

respondent’s views.
However, the respondents disagreed that they were compensated their salary in a timely
manner with mean 2.42. The standard deviation 0.384 indicated that there was consensus
with the among the respondents.
Supervision of Employees
In order to establish how supervision of employees affected employee turnover, the study
employed the use of a Likert scale. The Likert scale was divided into five points where:
1= Strongly Disagree, 2 Disagree, 3=Neither Agrees or Disagrees, 4= Agree, 5= Strongly
Disagree. Table 4.10 presents the findings.
Table Supervision of Employees
Statement
N
Mean Std. Deviation
My manager communicates with me with
respect
70 3.61 0.262
My manager is concerned about my health
and safety
70 3.2 0.44
I enjoy the way my supervisor ensures
clarity with me after giving me a task
70 3.14 0.32
I am flexible to work at any time as long as
I deliver my work in time
70 3 0.414
I have manageable and less stressful
workload
70 2.8 0.391
Total Aggregate 70 3.15 0.365
Source: Primary Data, 2018

Table 4.10 indicates that the respondents neither agreed nor disagreed with total
aggregated mean of 3.15 that supervision of employees had an effect on the employee
turnover. The standard deviation of 0.365 implied that the respondents rating were
reached upon a consensus.
With respect to individual statements respondents neither agreed nor disagreed with a
mean of 3.61 that their manager communicates with me with respect was one of the
major ways in which supervision of employees influenced employee turnover. The
standard deviation of 0.262 showed agreement in respondent’s scores.
In addition, the respondents neither agreed nor disagreed they have manageable and less
stressful workload with a 2.8 mean. A 0.391 standard deviation indicated a consensus
among respondent’s scores.
Factor Analysis
Factor analysis is method in statistics method that is used to model variables that have
been and their covariance structure, based on the factors that are unobservable in small
numbers. For the study the researcher considered nine factors. These factors were
included in factor analysis because the researcher thought they informed employee
turnover which he sought to measure. Principal component analysis was adopted for
factor analysis to data reduction by creation of new variables that were in linear
combination with the observed variables.
Variance co variances of the variables were determined in order to help map out the
number of factors to be used. Eigen values and Eigen vectors on the other hand were
established so as to measure the amount of variance the observable variable a factor
explains.

KMO Test
Kaiser-Meyer-Olkin (KMO) test measures how adequate every variable is according to
the given model. When variables have a value of 1.0, they are of high value and its data
can be analyzed by factor analysis.
Bartlett's Test of Sphericity tells whether a hypothesis is an identity matrix based on the
given correlation matrix. This in turn would mean that the variables used for the study are
unrelated and thus improper for structure detection. Significance level of less than 0.05
indicates that factor analysis is useful in modeling the data. The findings of these tests are
as presented in figure below.
Table KMO and Bartlett's Test
KMO and Bartlett's Test
Kaiser-Meyer-Olkin Measure of Sampling Adequacy. 0.792
Bartlett's Test of Sphericity
Approx. Chi-
Square 135.916
df 36
Sig. 0.00
Source: Primary Data, 2018
From the table above the KMO test is 0.792. This suggests that the data was good enough
to allow for modeling of factor analysis. The Bartlett’s test of Sphericity on the other
hand had a p value of 0.00 and thus it was highly significant from modeling factor
analysis to the data.
Table Factor Analysis on Employee Turnover (Communalities)
Communalities Initial Extraction
Employee Training 1 0.831
Working Conditions 1 0.682
Leadership factor 1 0.663
Workplace Conflict 1 0.709
Communication 1 0.714
Tenure 1 0.614
Rewards 1 0.753
Wages and Salary 1 0.678
Supervision of Employees 1 0.762
Extraction Method: Principal Component Analysis.
Source: Primary Data, 2022
The communalities table above helps explain how the proportion of variance each
factor has in common with the other factors. Thus it can be deduced that employee
training has 83.1% communalities or shared relationship with other variables which is
the greatest. Tenure has the least communalities with the other variables at 61.4%.
Table Total Variance Explained
Total Variance Explained
Component
Initial Eigenvalues Extraction Sums of Squared
Loadings
Total % of
Variance Cumulative % Total % of
Variance
Cumulative
%
1 3.715 41.282 41.282 3.715 41.282 41.282
2 1.598 17.758 59.041 1.598 17.758 59.041
3 1.093 12.142 71.183 1.093 12.142 71.183
4 0.686 7.62 78.803
5 0.558 6.198 85.001
6 0.381 4.237 89.238
7 0.364 4.05 93.288
8 0.335 3.718 97.006
9 0.269 2.994 100
Extraction Method: Principal Component Analysis.

Source: Primary Data, 2018
The above mentioned table shows that the study used Kaiser Normalization Criterion, to
allow for elements extraction with a more than 1 value of the Eigen. To identify the
factors,
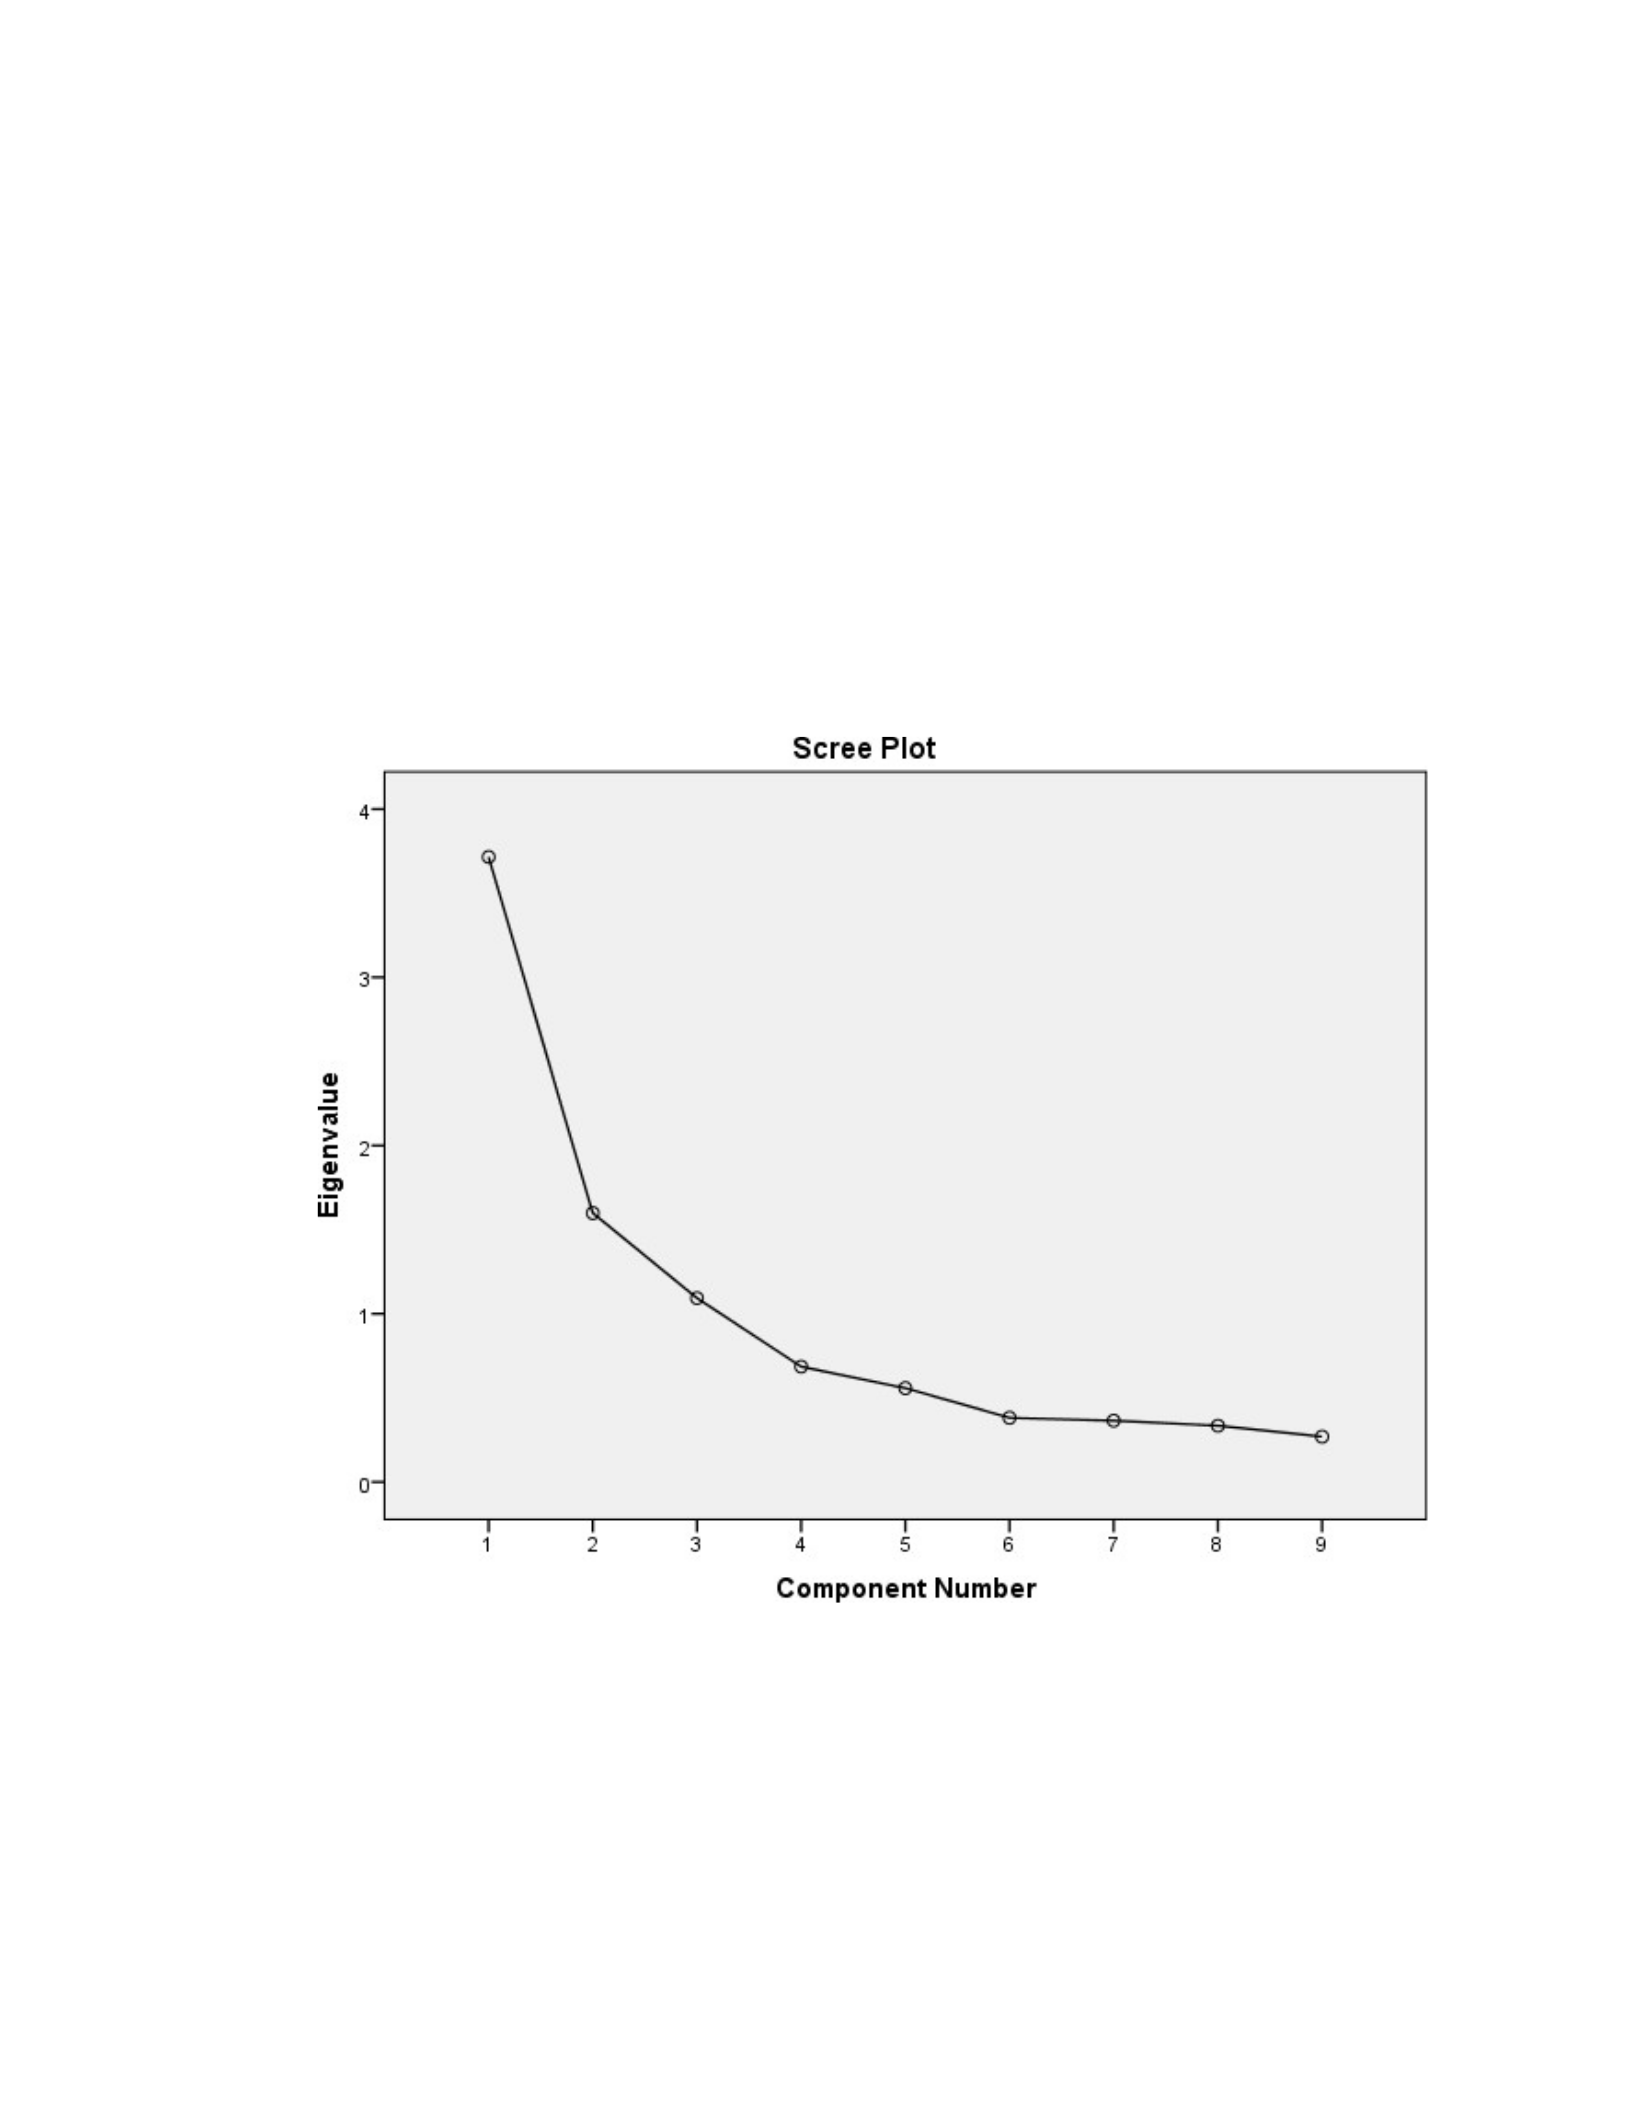
the principal component analysis was used deriving 3 main factors from it that influence
turnover in Wendo hospital.
The three factors explained a total of 71.183% of the total variation. The contribution of
each factor to the total variation decreases sequentially. Factor contribution to the total
variation is the greatest accounting for 41.282% of the total. Factor 2 and factor 3
accounts for 17.758% and 12.142% of the total variation respectively.
The above scree plot was associated with the employee turnover factors.

Table Component Matrix
Component Matrixa
Component 1 2 3
Employee Training 0.348 0.263 0.8
Working Conditions -0.027 0.779 -0.271
Leadership 0.782 -0.224 -0.034
Workplace Conflict 0.812 0.075 -0.209
Communication 0.759 0.262 -0.262
Tenure 0.663 -0.051 0.414
Rewards 0.798 -0.177 -0.291
Wages and Salary 0.688 -0.45 0.042
Supervision of Employees 0.441 0.749 0.087
Extraction Method: Principal Component Analysis.
a. 3 components extracted.
Source: Primary Data, 2018
From the table above there is a clear indication that component 1 loads highly with
leadership, workplace conflict, communication, tenure, rewards and wages and
salary factors.
Component 2 loads highly with working conditions and supervision of employees
while component 3 loads highly with only employee training.

