


Analysis of respondents’ demographic information
The demographic data of the respondents was investigated in Section A of
the questionnaire. The respondents’ demographic data is presented in this
section in the form of bar graphs and pie charts, under the following
headings age, gender, highest education qualification, and length of public
service, length of service at the department, directorate, and occupational
level.
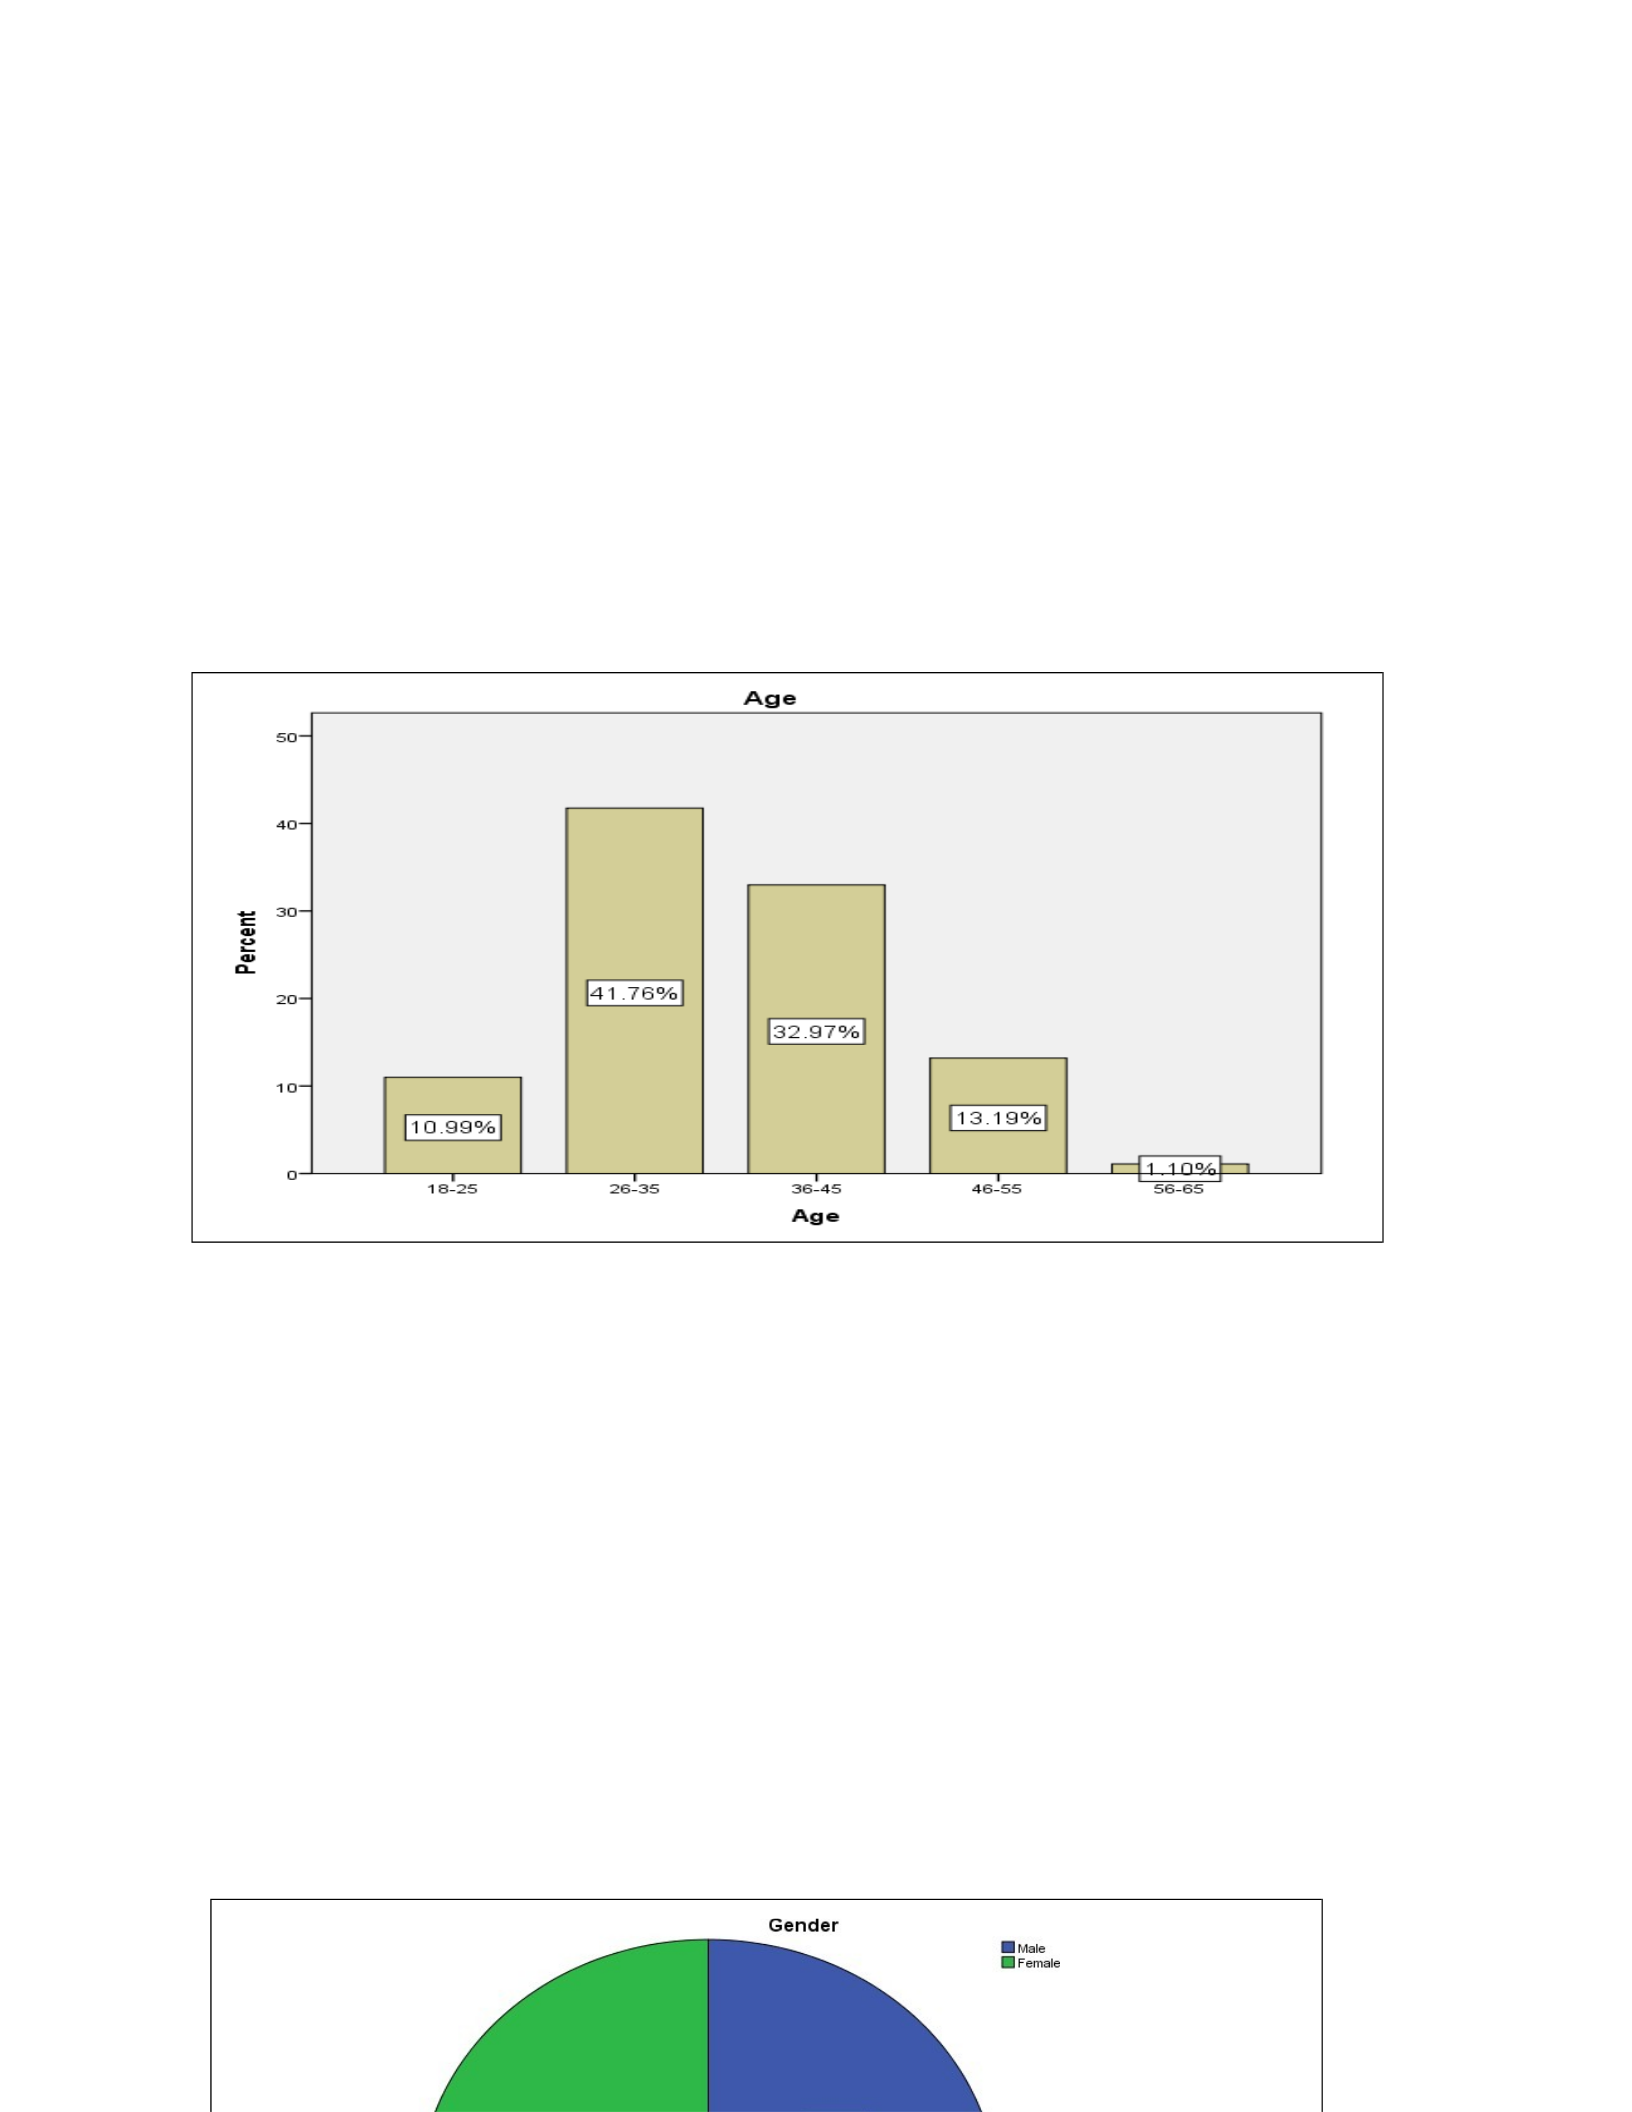
Figure 4.2.1 Age of respondents (N91)
The study examined the composition of the respondents in relation to
age. Figure 4.2.1 indicates that majority of the respondents (42%) for this
study were aged between 26 and 35 years old, 33% of the respondents were
aged between 36 and 45, 13% of the respondents were aged between 46 and
55, 11% of the respondents were aged between 18 and 25 and only 2% of
the respondents indicated that they were between the age of 56 and 65.
Therefore, it means that the majority of the respondents were aged between
26 and 35, followed by age 36-45. This entails that a majority of
participants of the study are in their youthful age and may stay in their
positions to get more experience.
Figure 4.2.2 Gender distribution of respodents (N91)
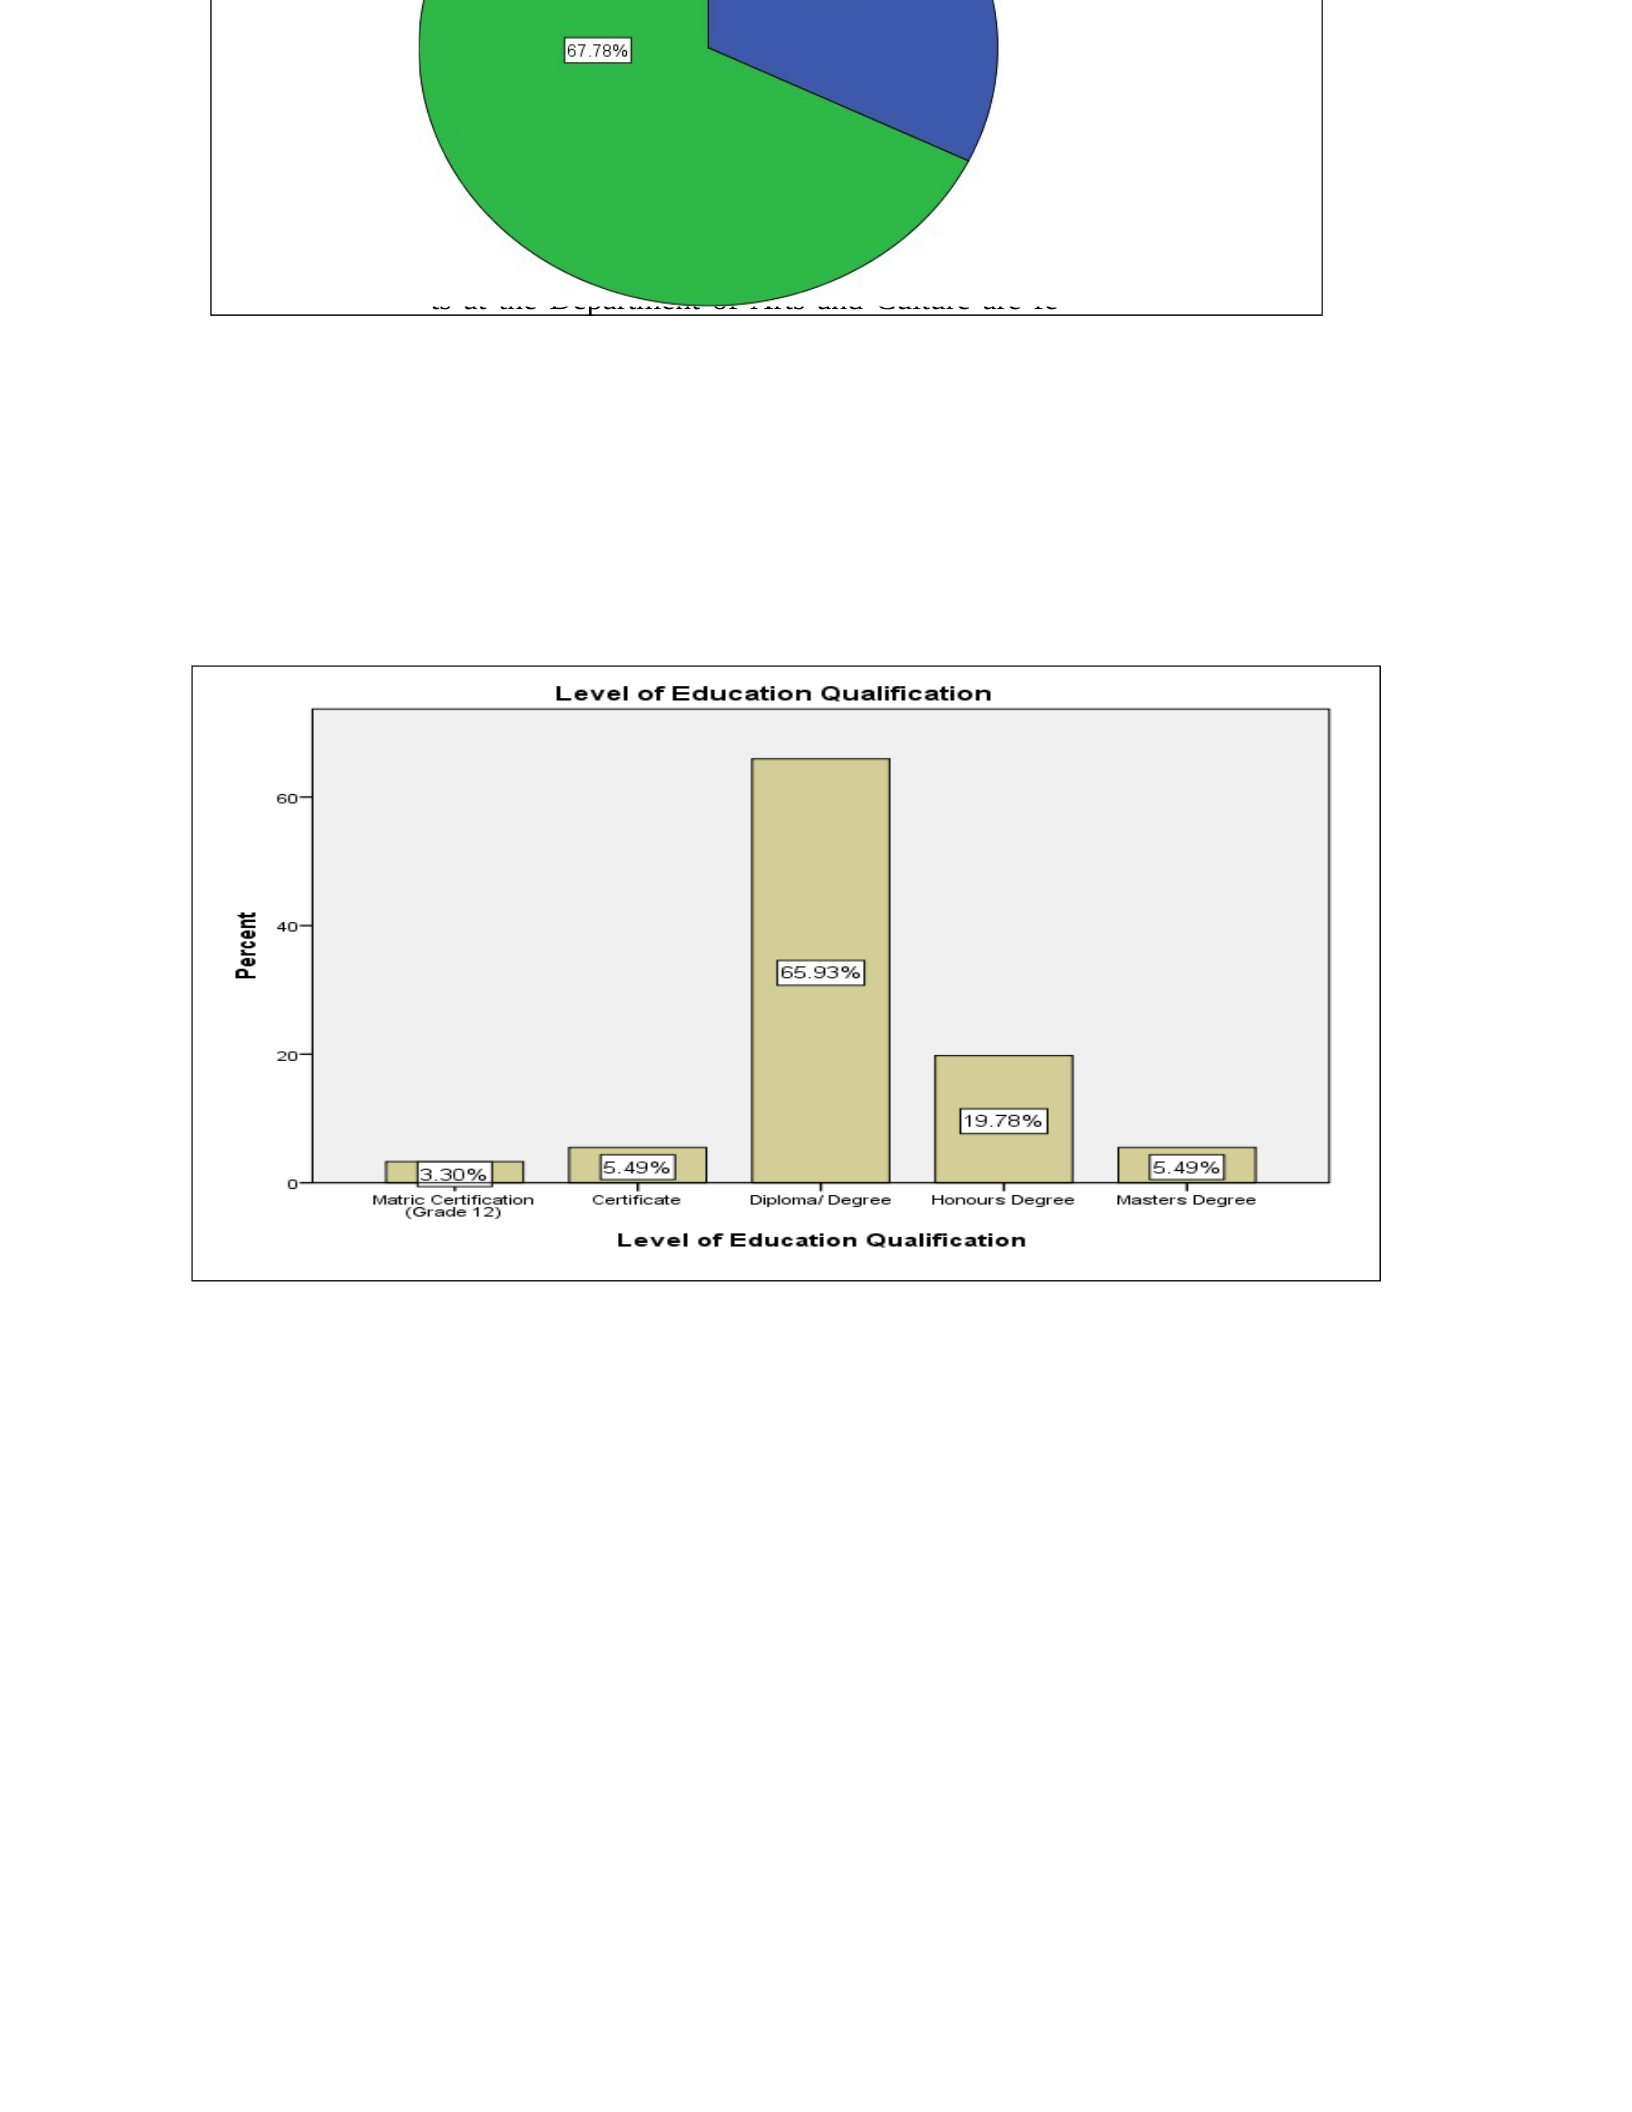
Figure 4.2.2 above indicates the gender of respondents. The majority of the
respondents at the Department of Arts and Culture are females, illustrated
by 68% and while 32% consist of males. This outcome demonstrates that a
huge number of respondents were females as compared to men. This could
also mean that the female respondents were more easily accessible to the
researcher or that the KZNDAC has more female employees employed than
male employees.
Figure Level of education qualification of respondents (N91)
The Department of Arts and Culture employs employees from diverse
departmental units who possess different academic qualifications. Figure
4.2.3 above indicates that majority (66%) of respondents in the department
attained a Bachelor Degree or Diploma level of education, 20% indicated
that they had attained a Honours Degree, 5% of the respondents indicated
that they had attained Certificate and also another 5% of the respondents
indicated they had attained a Master’s degree, and only 3% of the
respondents had attained a Matric certificate (Grade12). Based on the
results most of the respondents were in possession of a Diploma or
Degree qualification and a postgraduate qualification. This entails that a
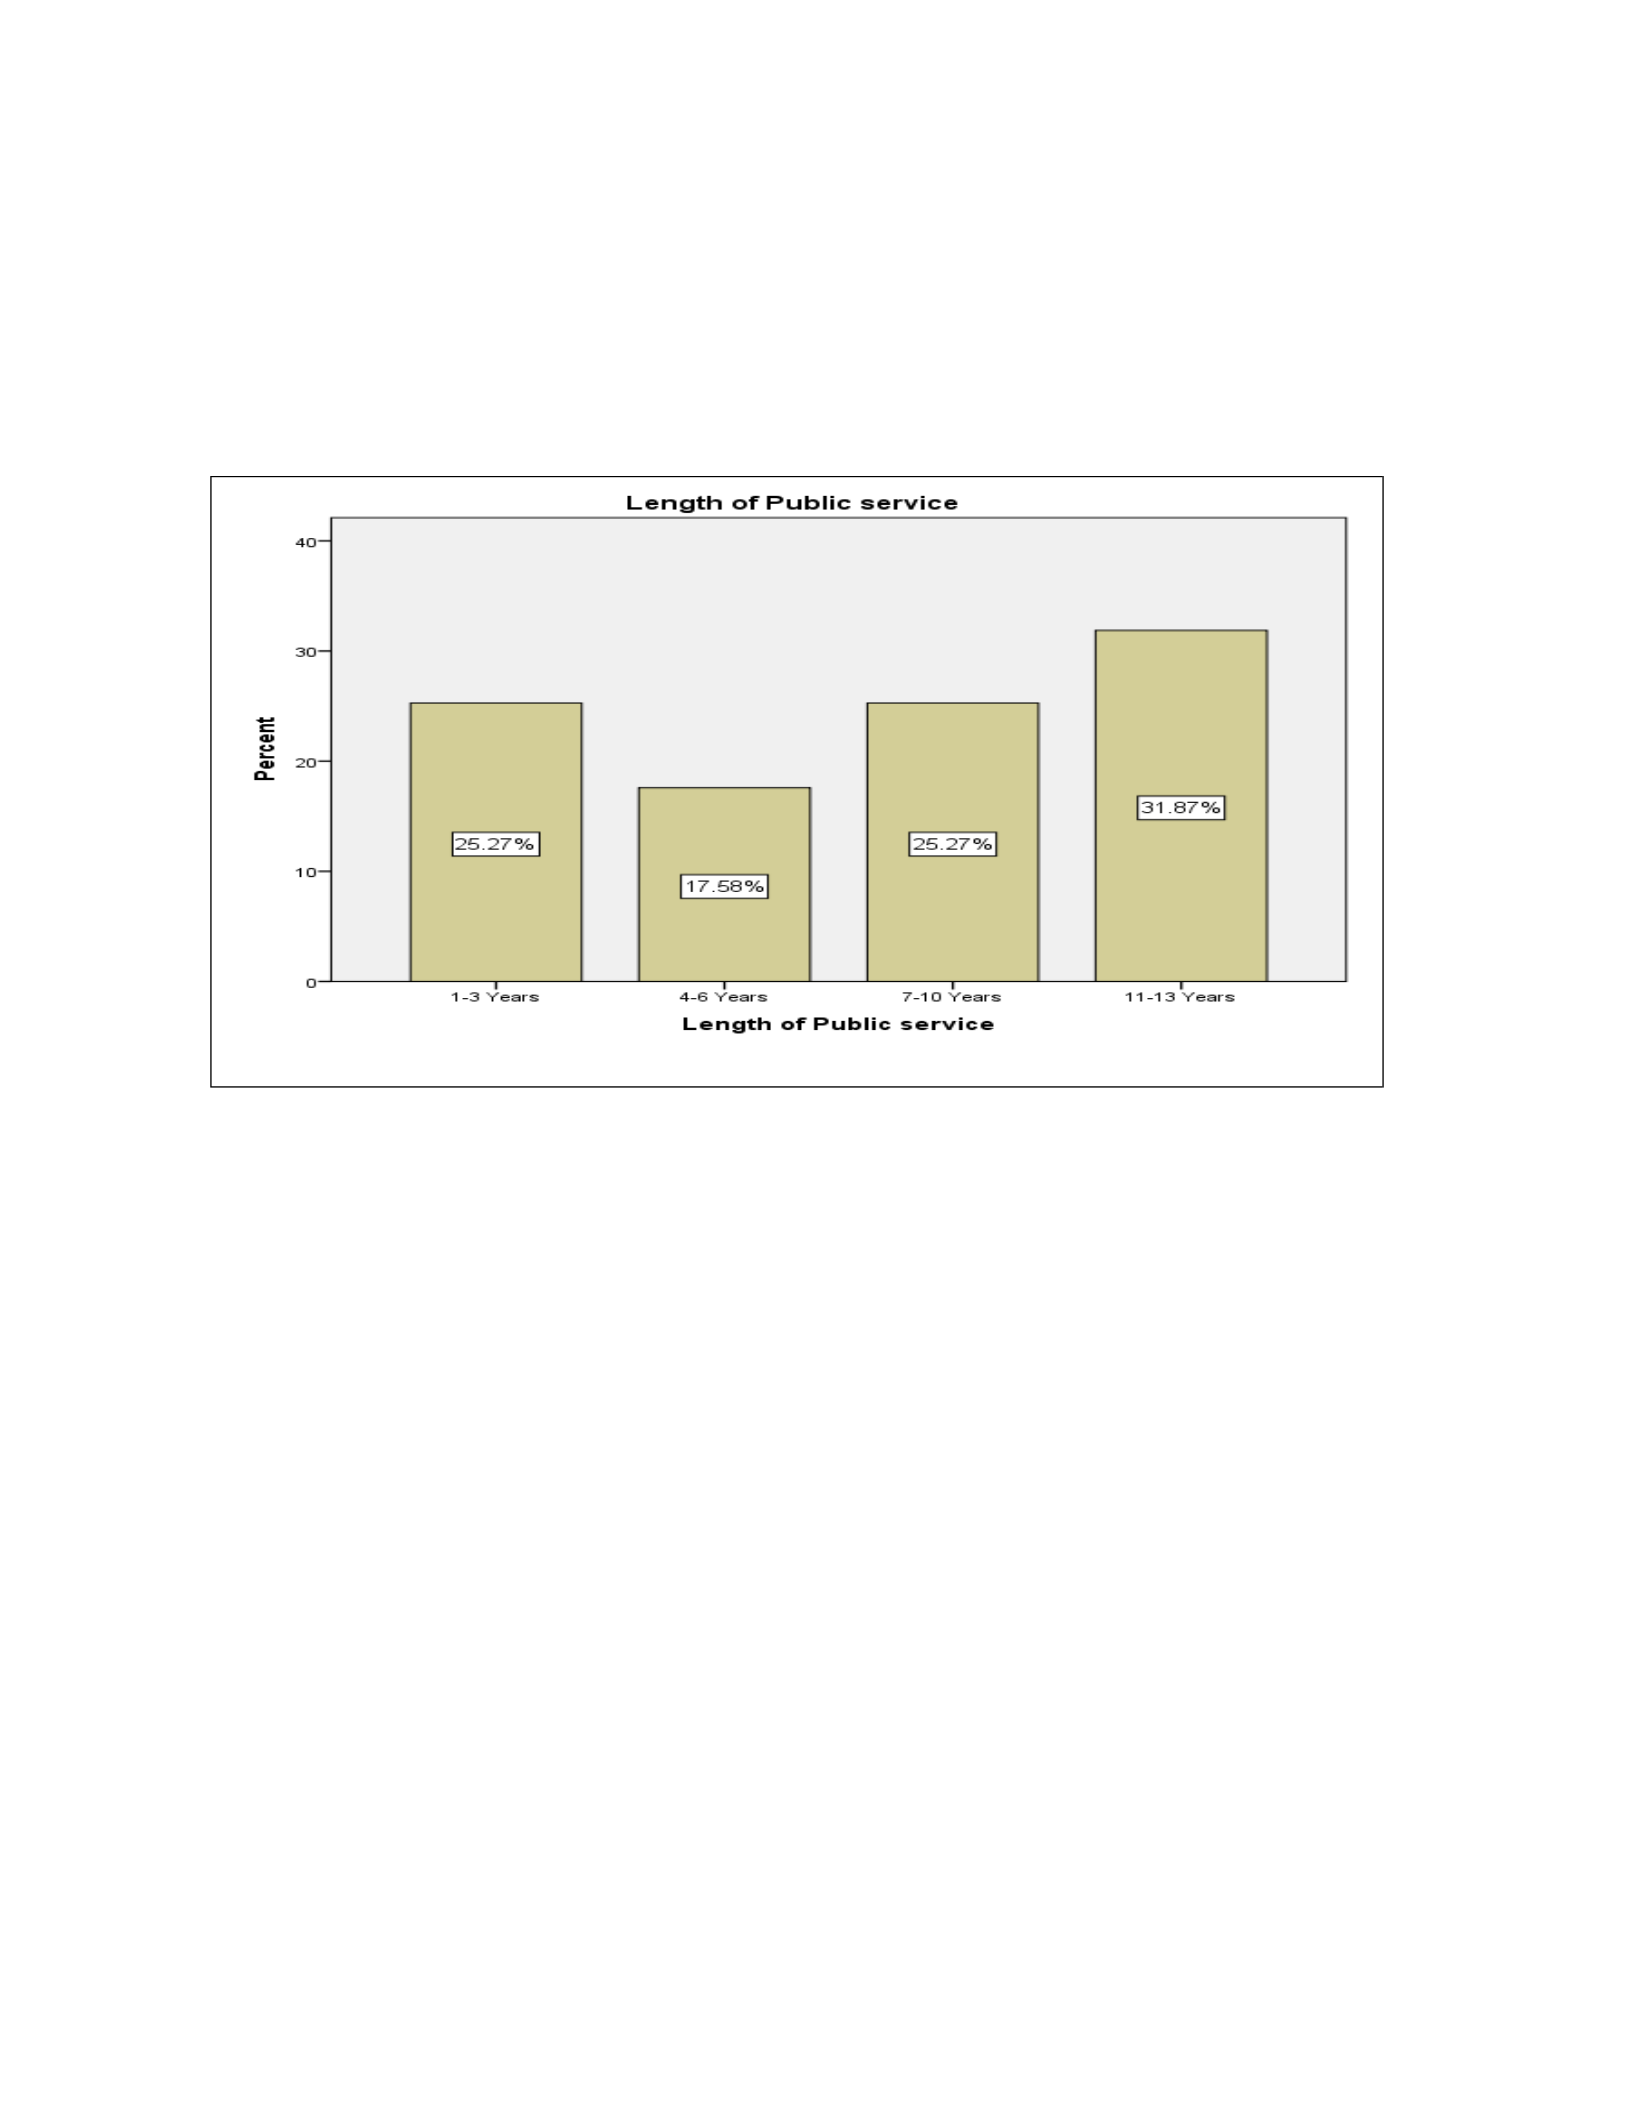
number of employees at the KZNDAC were graduates. This could mean
that this department depend on human skills to achieve its objectives. It is
concluded that the respondents were literate enough to comprehend the
prerequisites of the study, ensuring the validity of the findings.
Figure 4.2.4 Length of public service of respondents (N91)
The length of public service determines to which extent an individual is
alert of issues in the public sector. Figure 4.2.4 above indicates that majority
(32%) of the respondents have been working in the public sector for 11 to
13 years, 25% of the respondents reported that they have been working in
the public sector for 7 to 10 years, and also another 25% of the respondents
have been working in the public sector for 1 to 3 years, and lastly, 18% of
the respondents have been tendering their services to the public sector for 4
to 6 years. The results clearly show that most of the respondents have been
working for the public sector for a long time. It can be concluded that the
participants have a lot of experience working for the public service.
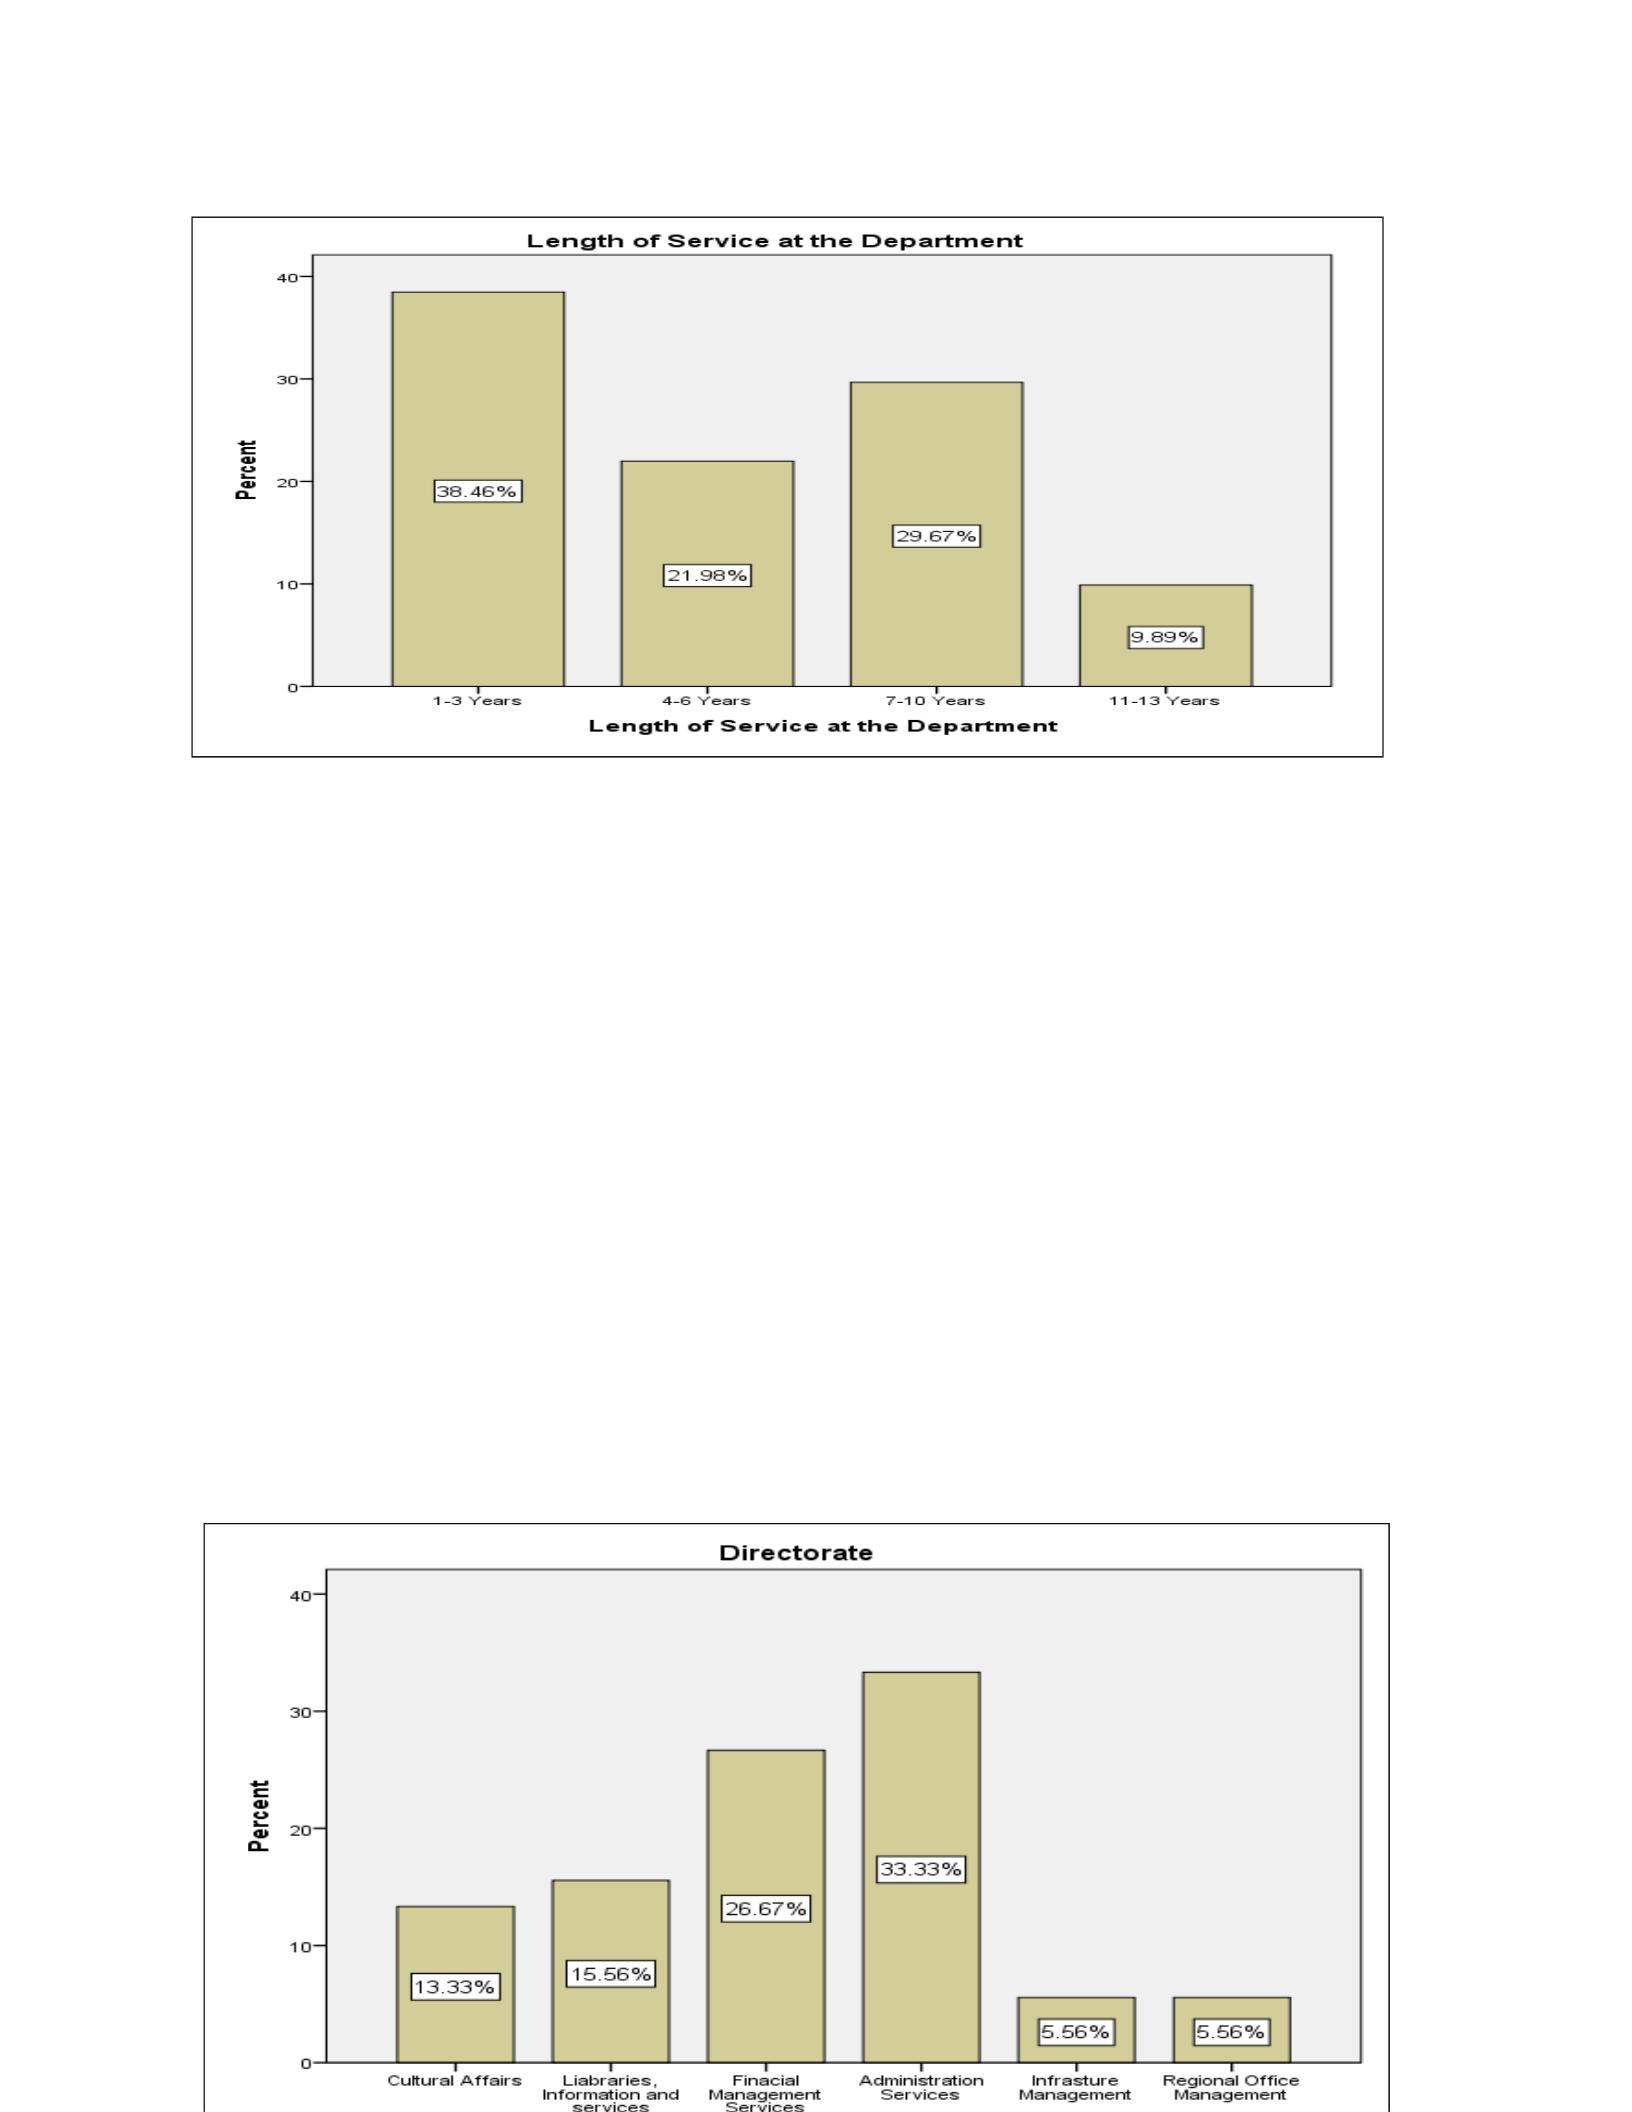
Length of Service at the Department (N91)
Figure 4.2.5 indicates that majority (38%) of the respondents have been
working for the department for 1 to 3 years, 30% of the respondents have
been with the department for 7 to 10 years, 22% of the respondents have
been tendering their service for 4 to 6 years, while 10% of the respondents
have been rendering their services to the department for 11 to 13 years. The
results above clearly show that a large number of respondents have only
been working at the department for not more than 3 years. This entails that
there is a problem in this organisation as a large number of participants have
only been working at the department for not more than 3 years. Based on
this it can be concluded that the organization is failing to retain its
employees.
Figure 4.2.6 Directorate respondents belong to (N91)
The Department of Arts and Culture is divided into 6 directorates, and each
directorate performs certain duties that are different from other directorates.
Figure 4.2.6 above indicates that majority (33%) of respondents are from
the Administration Services Directorate, 27% of the respondents are from
the Financial Management Services Directorate, 16% of the respondents are
from the Libraries Information and Services Directorate, 13% of the
respondents are from the Cultural Affairs Directorate, 6% of the
respondents are from the Infrastructure Management Directorate, and
another 6% of respondents are from the Regional Office Management
Directorate. The results show that most respondents are from the
Administration and Financial Management Services Directorate. This means
many employees of KZNDAC are from the Administration Service
Directorate.
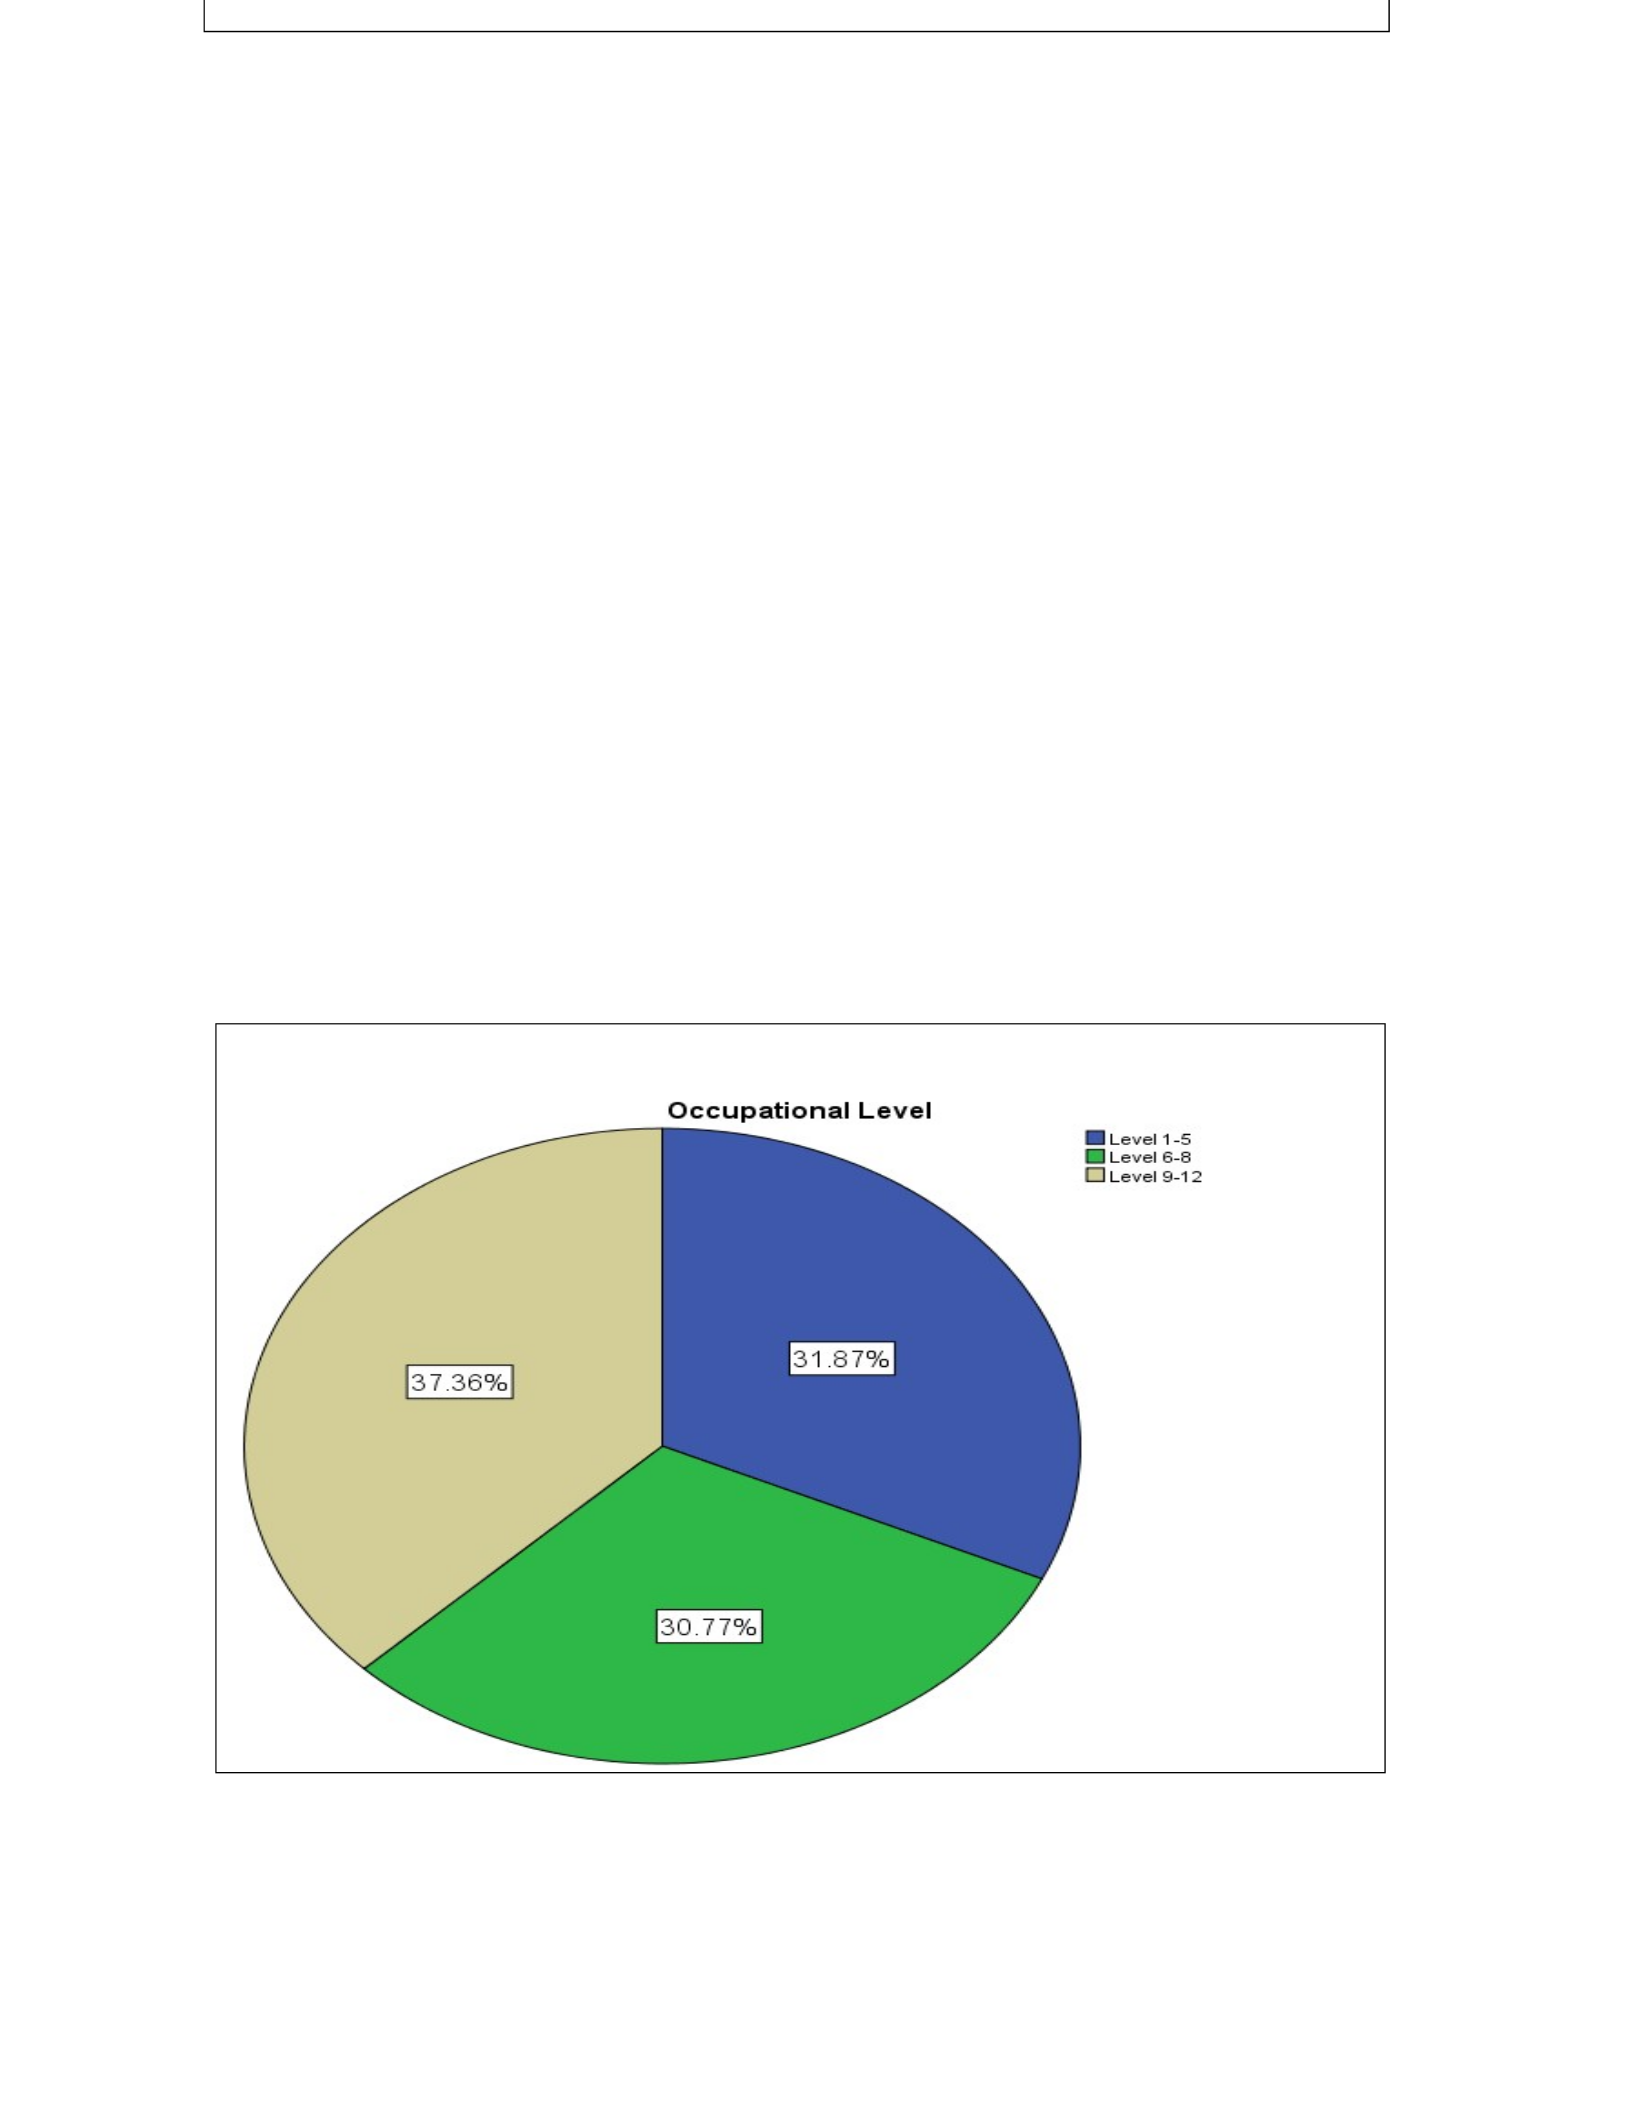
Figure 4.2.7 Occupational level of respondents (N91)
The researcher collected data from a sample size of 127, of which consisted
of employees from Level 1-5, Level 6-8 and Level 9-12. Figure 4.2.7

indicates that majority of respondents are from level 9 to 12, 32% of
respondents belong to level 1 to 5, while 31% of respondents are from level
6 to 8. Based on the results the majority of the respondents are from level 9-
12. This entails that KZNDAC has many employees in level 9-12 than the
other levels in the organisation.

