



Week One Acct 212 Study Notes
Financial Statement Analysis:
Applies analytical tools to general-purpose financial statements and related data for making business
decisions. It involves transforming accounting data into more useful information. Reduces hunches,
guesses and intuition. It provides an effective and systematic basis for making business decisions.
Purpose: Is to provide strategic information to improve company efficiency for internal users
of accounting information; those who make the important decisions, including managers,
officers, auditors, consultants. Budgeting , marketing.
Building Blocks of Analysis:
Liquidity and efficiency-ability to meet short term obligations and to efficiently generate
revenues.
Solvency-ability to generate future revenues and meet long term obligations
Profitability-ability to provide financial rewards sufficient to attract and retain
financing. Market Prospects-ability to generate positive market expectations.
Applying the building blocks of financial statement analysis involves determining (1) the objectives of
analysis and (2) the relative emphasis among the building blocks. The four blocks are used separately to
make business decisions yet are interrelated. Early in analysis you need to determine the relative
emphasis of each building block. Emphasis and analysis can later change as a result of evidence
collected.
Information for Analysis
General purpose financial statements: available to all employees and include
Income Statement, Balance Sheet, Statement of Stockholders’ Equity (Stmt of
Retained Earnings), Statement of Cash Flows, and Notes to these statements.
Financial Reporting- refers to the communication of all useful information useful for making
Investment, credit and other business decisions. Includes:
General Purpose Financial Statements, Information from SEC 10-K or other filings,
Press releases, shareholders meetings, forecasts, management letters, auditors reports
and webcasts.
MD&A (Management Discussion and Analysis) is an example of useful information.

Standards for Comparison
Intracompany- The Company provides its own analysis of financial info
Competitor- competitors can contribute standards for industry comparison Coke vs. Pepsi
Industry-a conglomerate provides industry comparisons, like S&P 500
Guidelines (Rule of Thumb)- General Standards for comparison.
Tools for Analysis
1. Horizontal Analysis- comparison of a company’s financial condition and performance
across time.
a. Comparative Financial Statements- show financial amounts in side by side columns
on a single statements called Comparative format. Comparing amounts for two or
more successive periods often helps in analyzing financial statements.
b. Computation of Dollar Changes and Percent Change –
i. Dollar Change=Analysis period amount – base period amount
ii. Percent Change(%) = Analysis Period – Base Period/Base period X 100
1. When Negative amounts appear in the base period and a positive
amount in the analysis period (or Vice Versa) we cannot compute
a meaningful percent change.
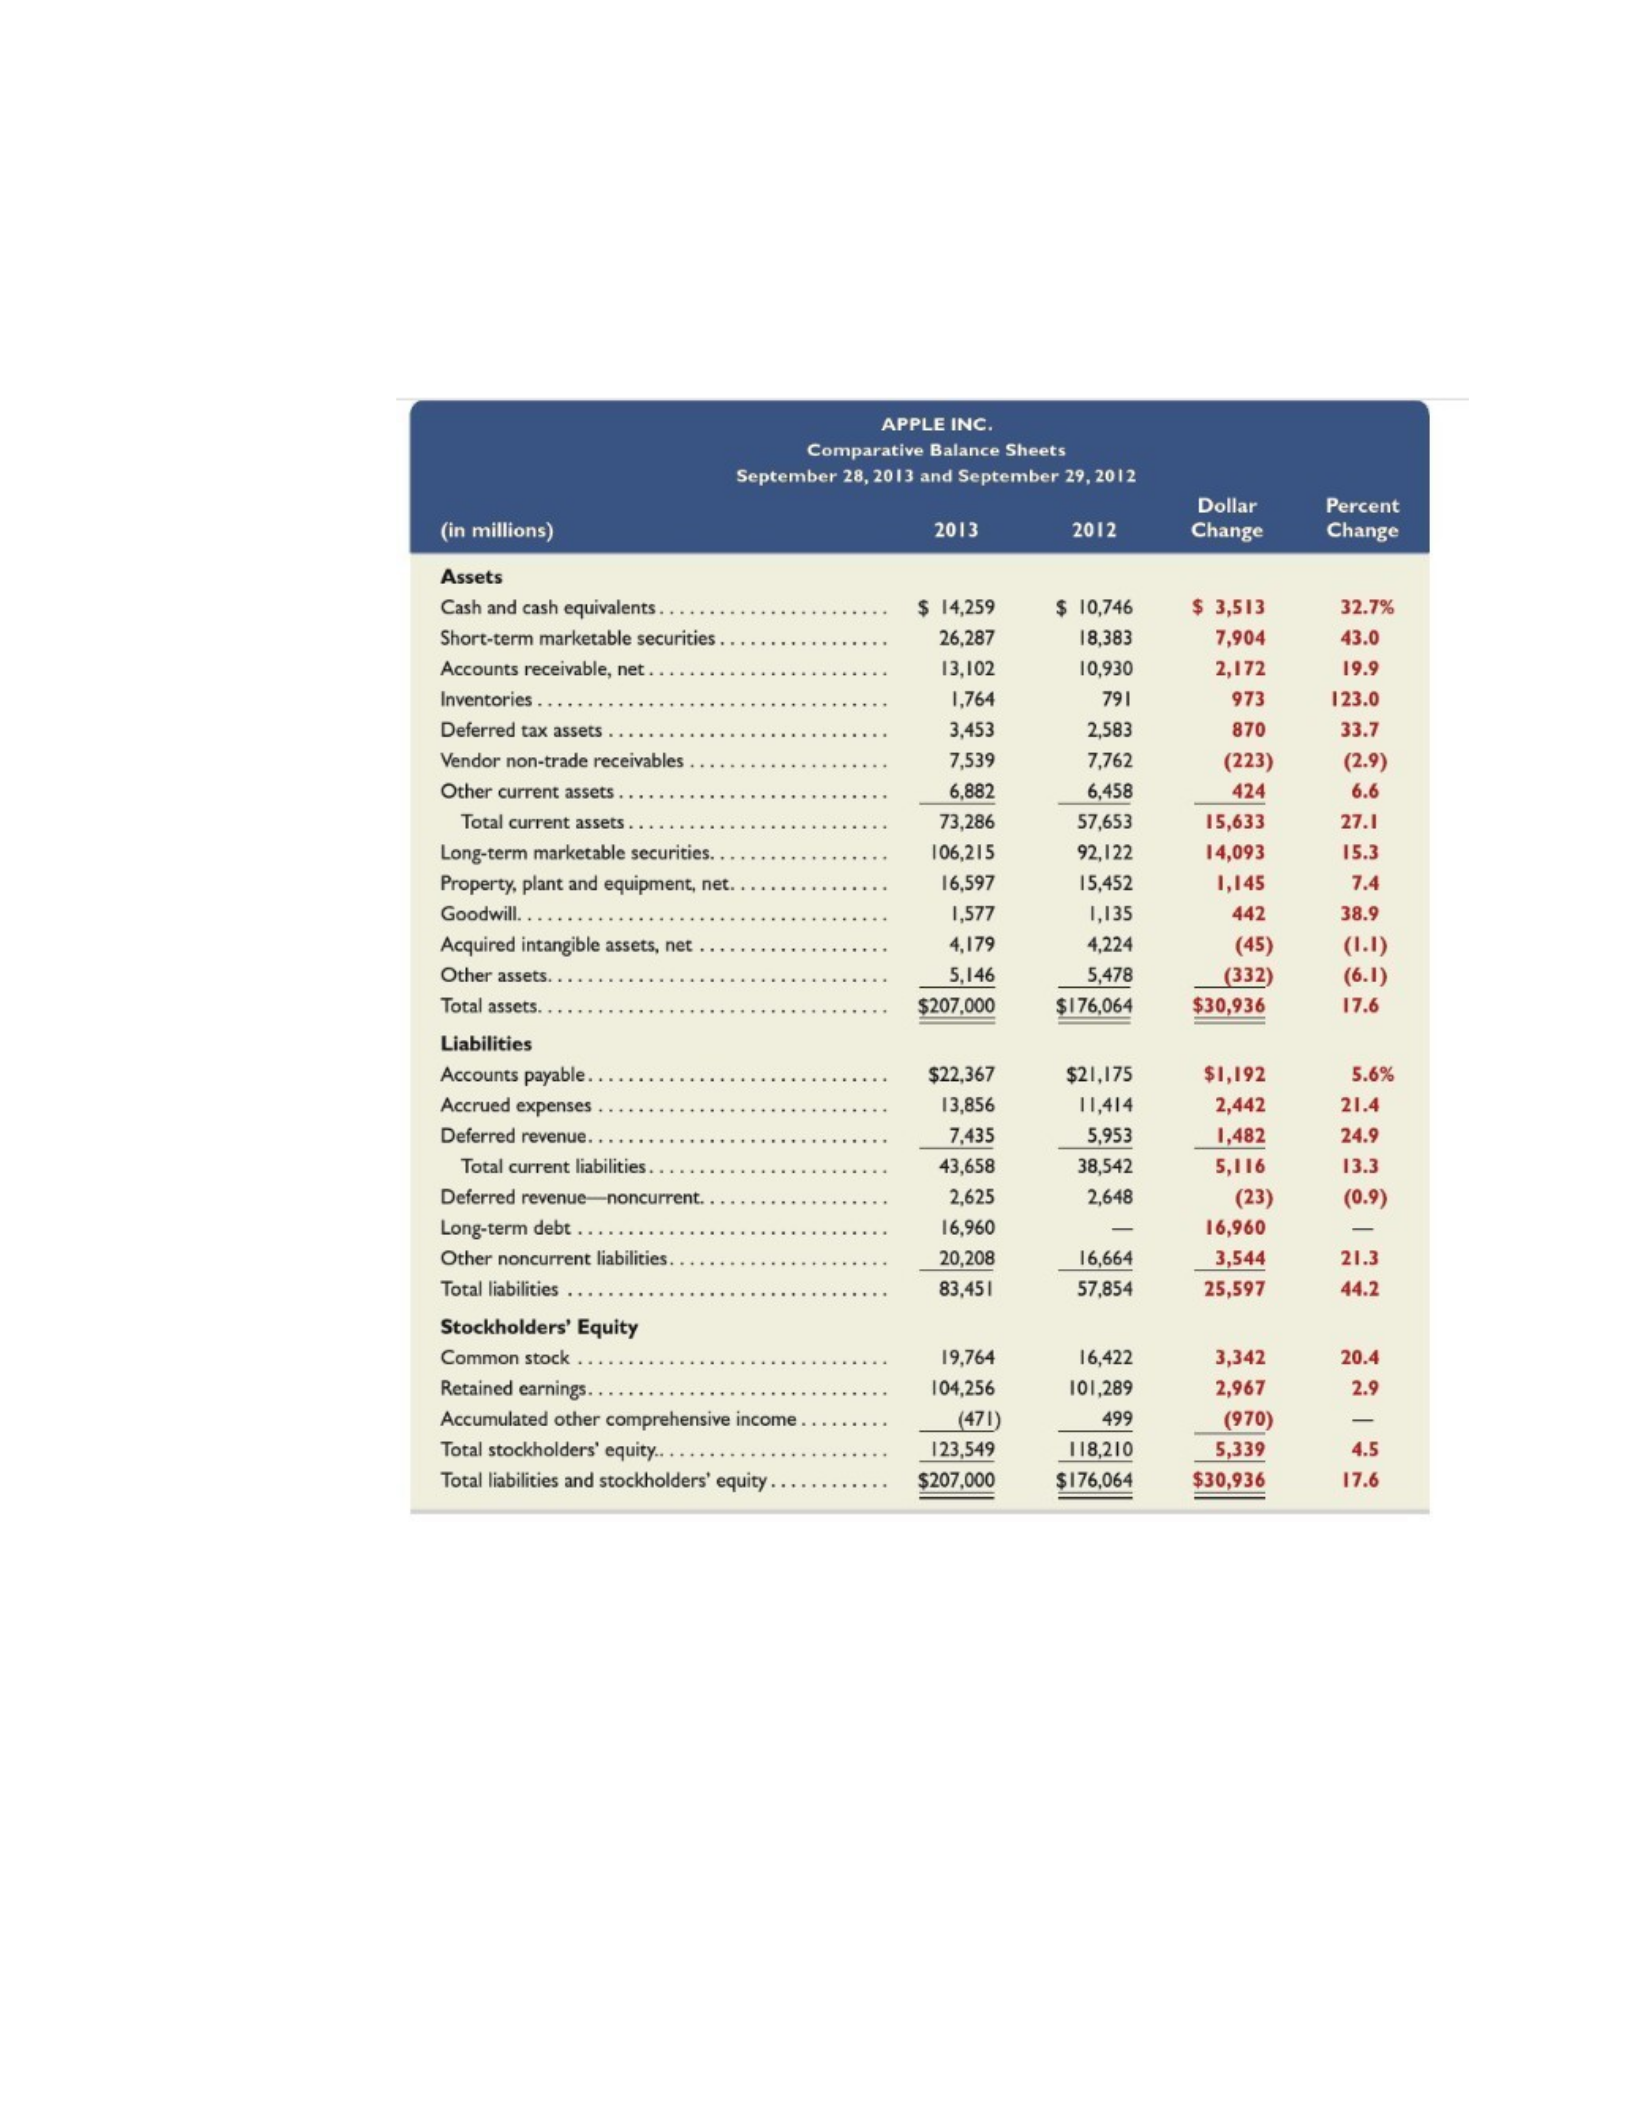
c. Comparative Balance Sheets- Balance sheet amounts from two or more balance
sheet dates arranged side by side. Useful when shown the dollar change and
percent change to highlight large change.
d.
e. Comparative Income Statements – Prepared similarly to comparative balance
sheets. Amounts for two or more periods are placed side by side, with
additional
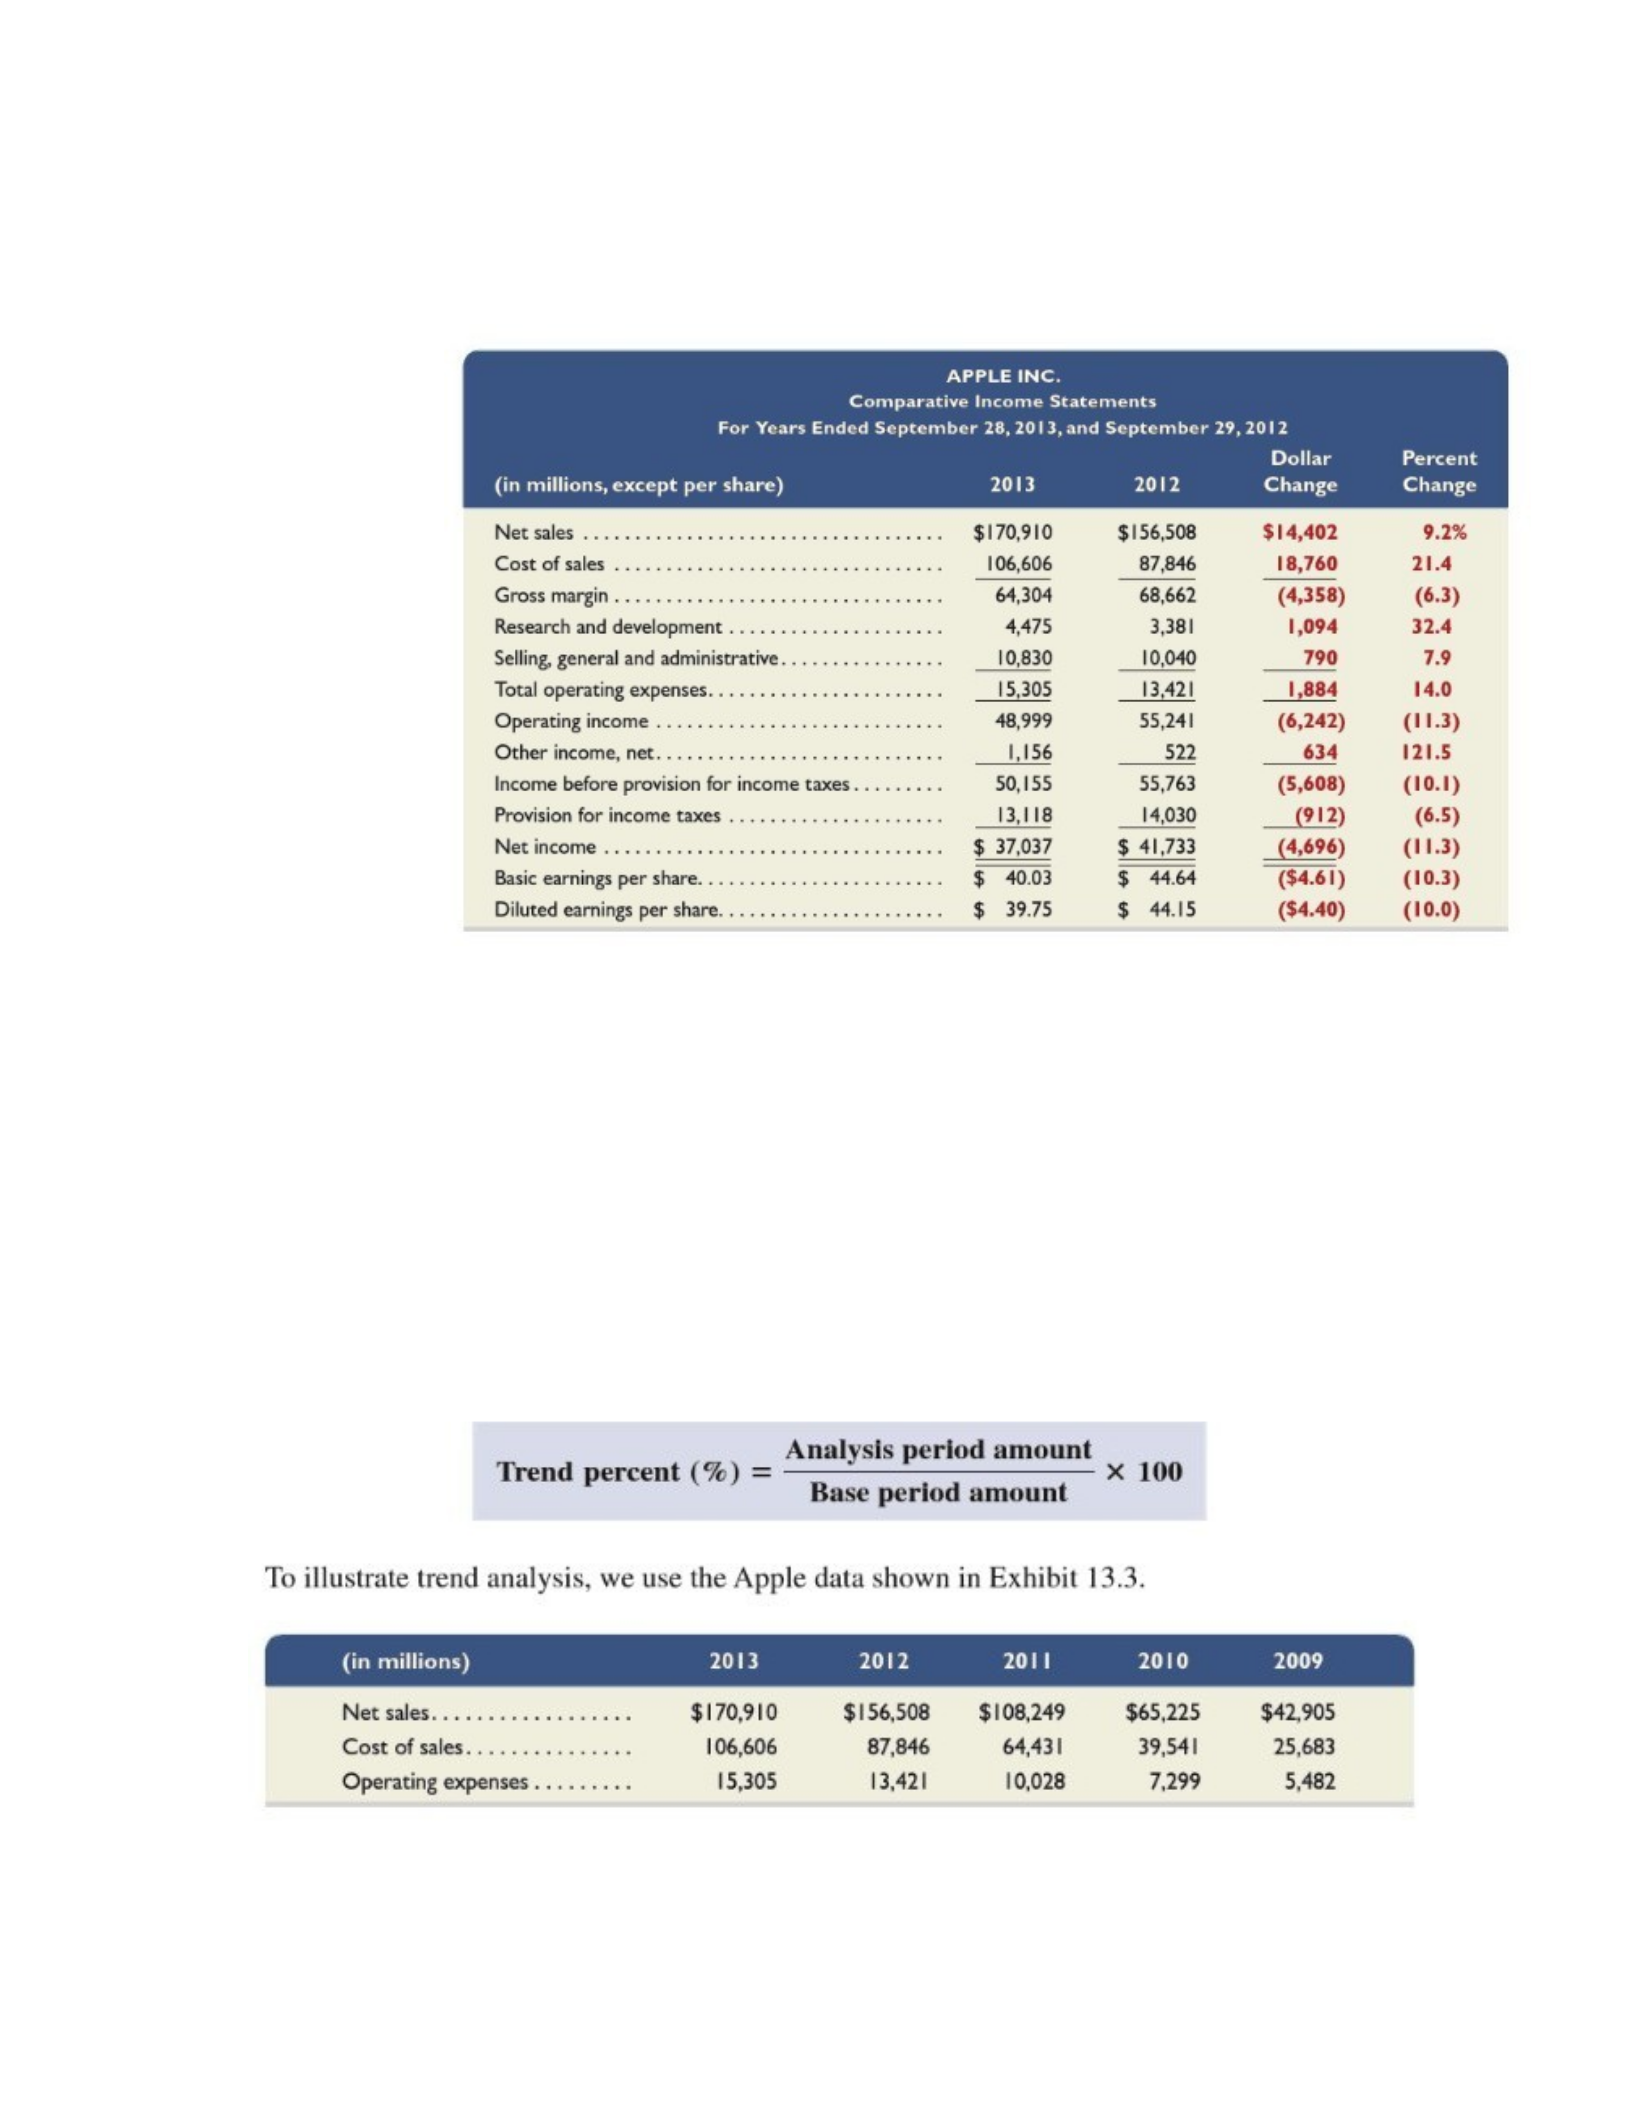
columns for dollar and percent changes.
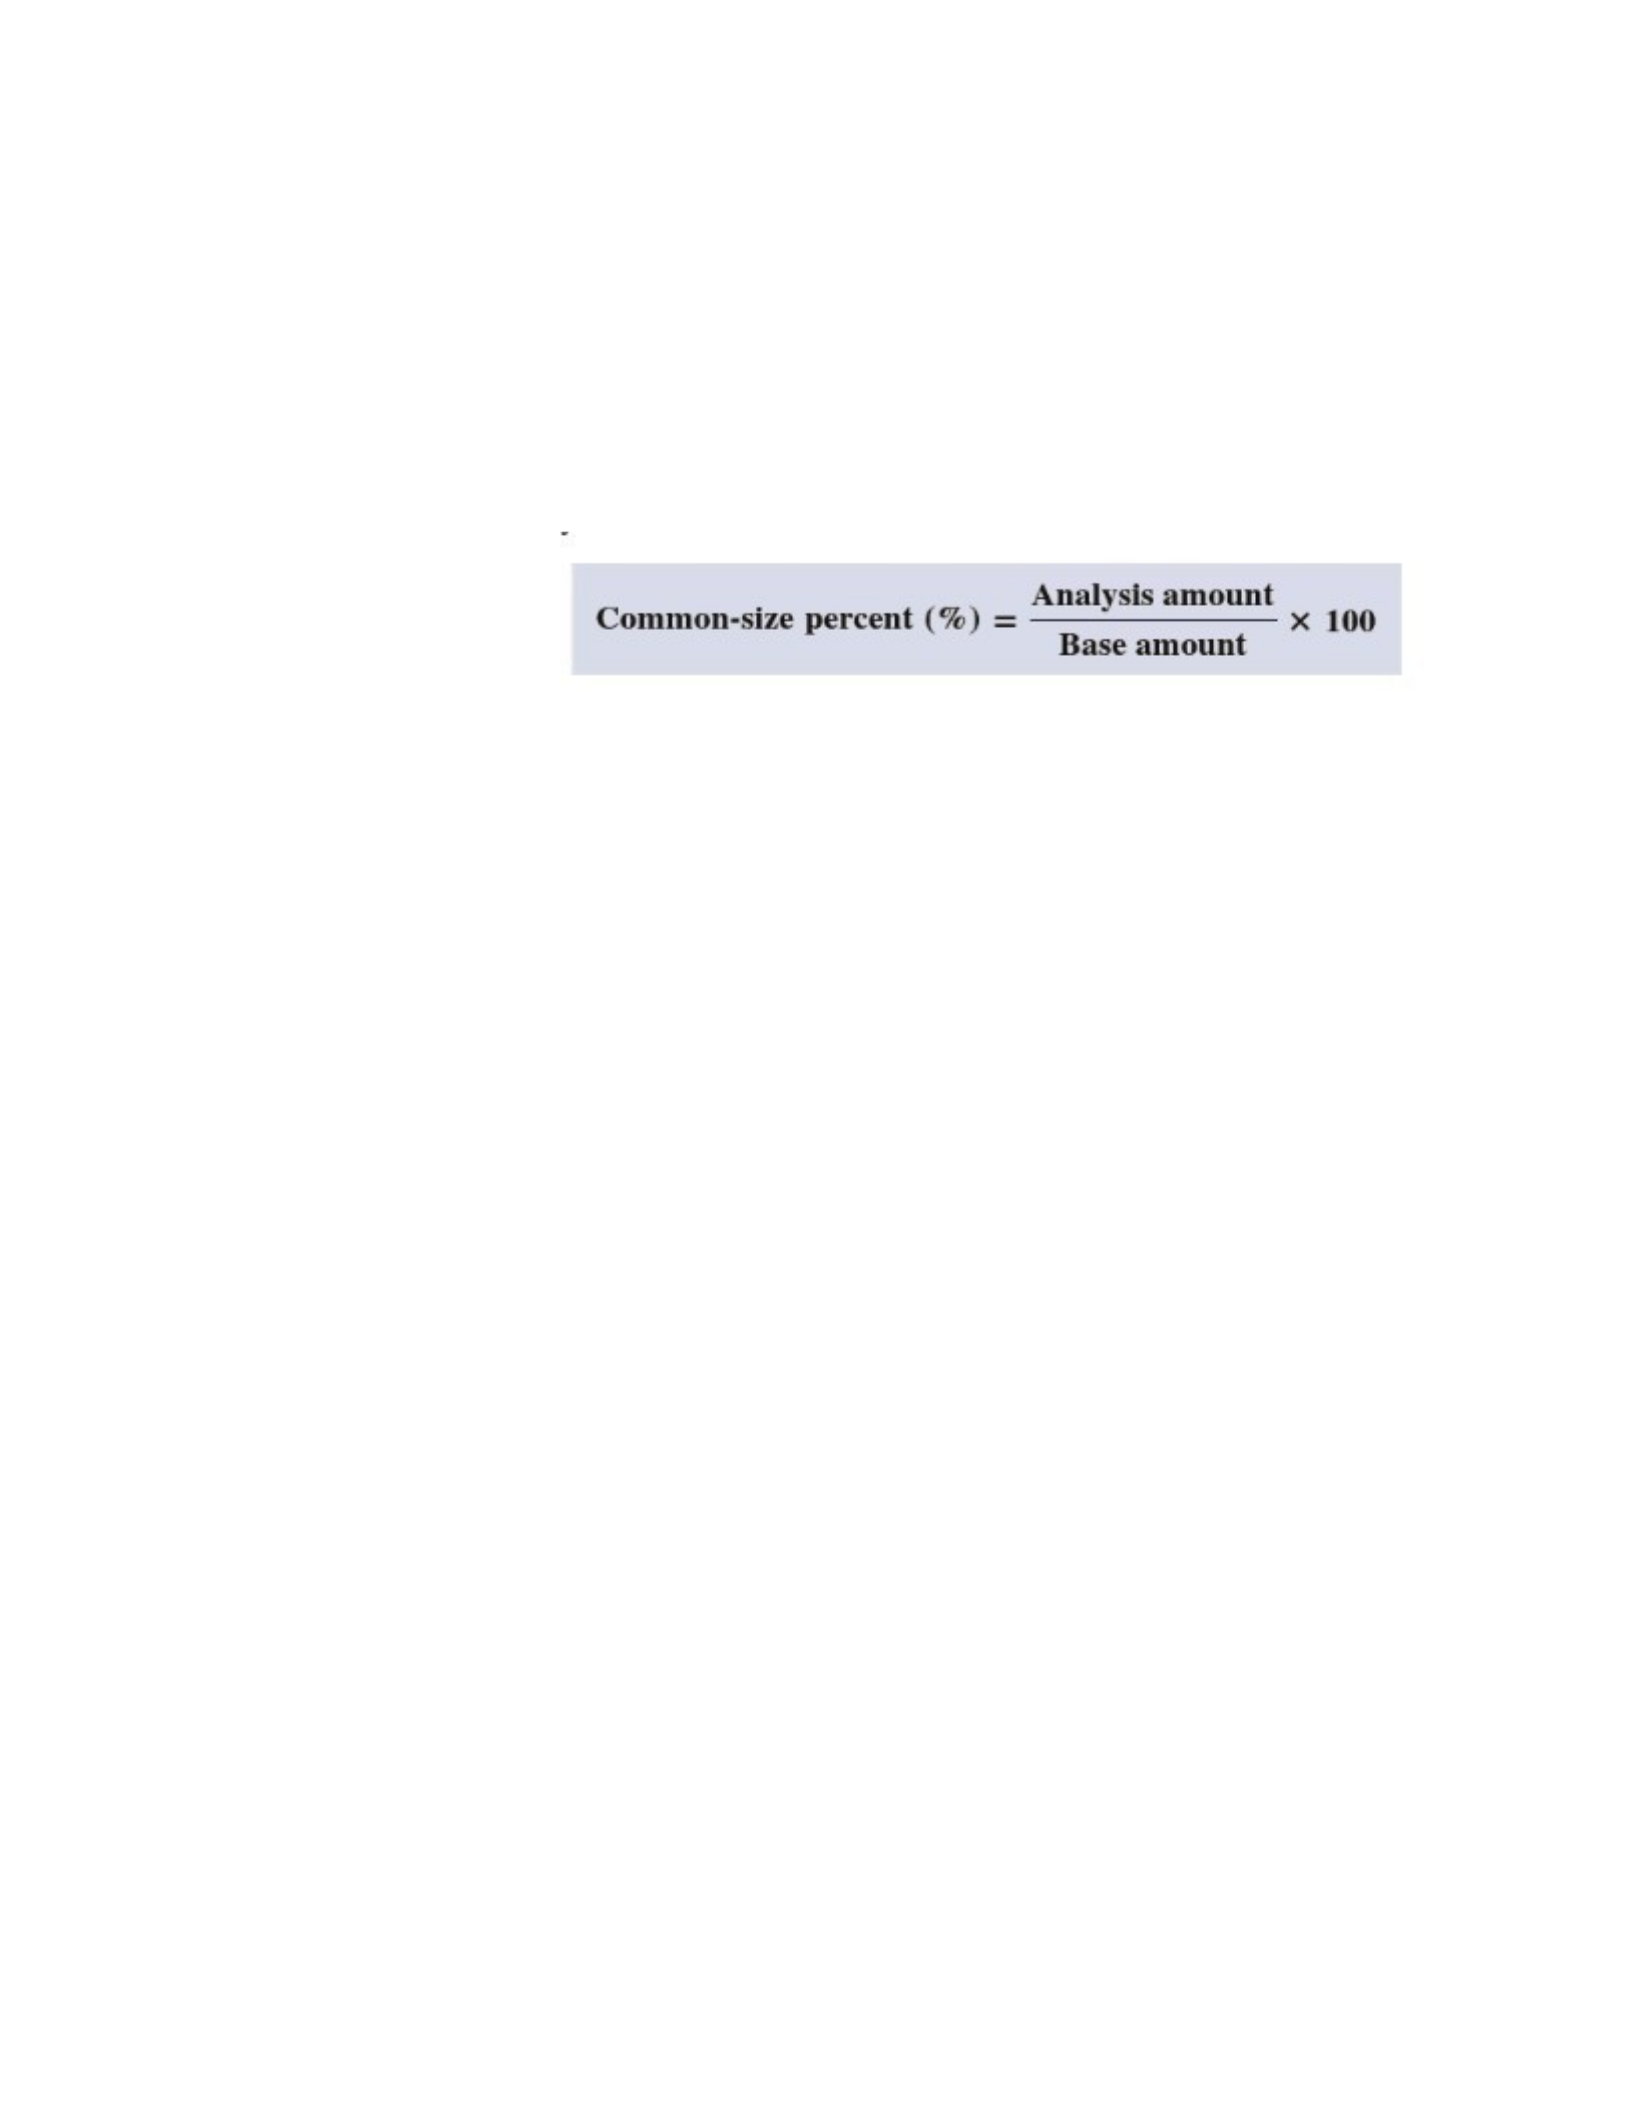
f. Trend Analysis- Also called Trend Percent Analysis or Index Number Trend
Analysis, is a form of horizontal analysis that can reveal patterns in data across
successive periods. It involves computing trend percent’s for a series of financial
numbers and is a variation on the use of percent changes. The difference is that
trend analysis does not subtract the base period amount in the numerator. To
compute trend percent’s , Trend percent can also be calculated in line graph
format.
i. Select a base period and assign each item in the base period a weight of
100%
ii. Express financial numbers as a percent of their base period number.
1. Vertical Analysis-Comparison of a company’s financial condition and performance to a
base amount. You usually define a key aggragate figure as the base, for income statement
is usually REVENUE and for balance sheet is usually TOTAL ASSETS.
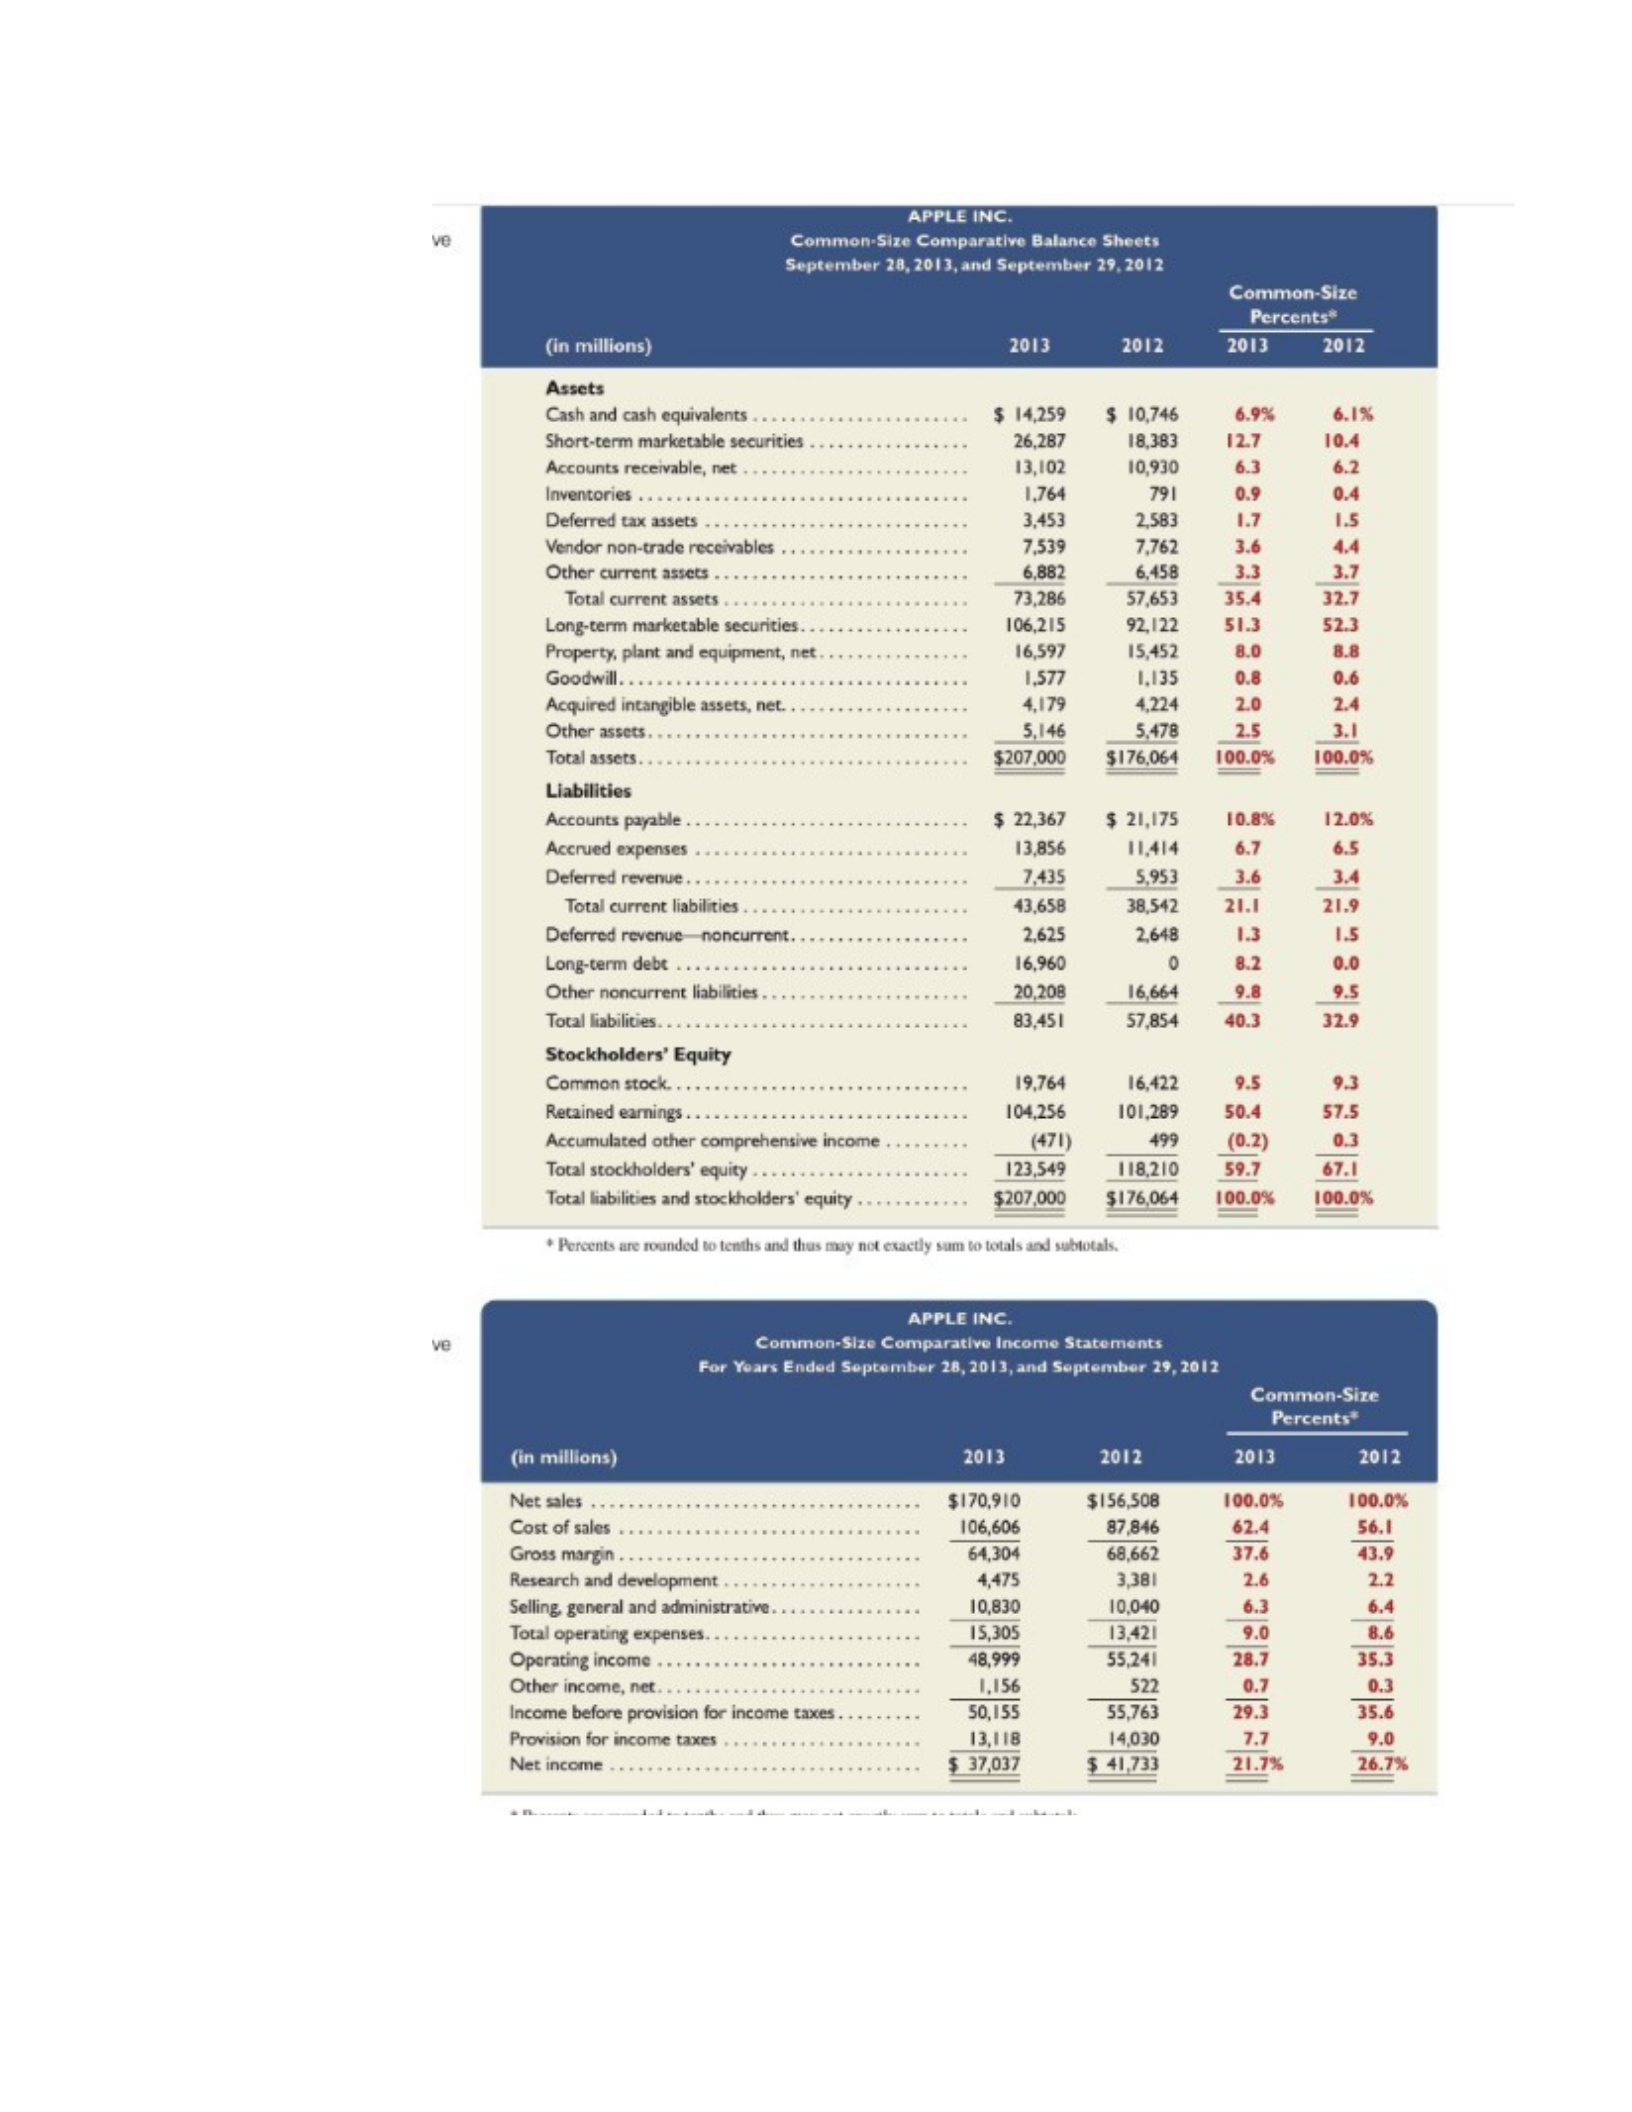
a. Common Size Financial Statements – used to reveal changes in the relative
importance of each financial statement item. All individual amounts in common-
size statements are redefined in terms of common-size percents.
i. Common Size Percents- is measured by dividing each individual financial
statement amount under analaysis by its base amount.
b. Common Size Balance Sheets- express each item as a percent of Base Amount,
which for common-size balance sheet is usually total assets. The base amount is
assigned a value of 100% we then compute a common size percent for each asset,
liability, and equity item using total assets as the base amount.when the
company’s successcive balance sheets are presented this way, it changes in the
mixture of assets, liabilities and equities.
c. Common Size Income Statements –Analysis also benefits from use of a common
size income statement. Revenue is usually the base amount, which is assigned a
value of 100% each common size income statement item appears as a percent of
revenue.
d. Common Size Graphics-two of the most common tools of common size analysis are
trend analysis and common size statement s and graphical analysis. The trend
analysis of common size statements is similar to that of comparative statements in
vertical analysis. The only difference is the substitution of common size percents for
trend percents.
2. Ratio Analysis- measurement of key relations between financial statement items. One of
the most widely used tools of financial analysis because they provide clues to the symptoms
of underlying conditions. Can be expressed as percent, rate, or proportion.
a. Liquidity and Efficiency-both important and complimentary all other measures of
analysis are of secondary importance.
i. Liquidity- refers to the availability of resources to meet short-term cash
requirements. It is affected by the timing of cash inflows and outflows
along with prospects for future performance. Analysis of Liquidity is aimed
at a company’s funding requirements. A lack of liquidity often precedes
lower profitability and fewer opportunities. It can foretell a loss of owner
control.
ii. Efficiency- is usually measured relative to how much revenue is generated
from a certain level of assets.
b. Working Capital and Current Ratio- the amount of current assets less
current liabilities. Current assets normally generate a low return on
investment. The current ratio must recognize at least three additional
factors:
i. Type of business
ii. Composition of current assets.
iii. Turnover rate of assets.
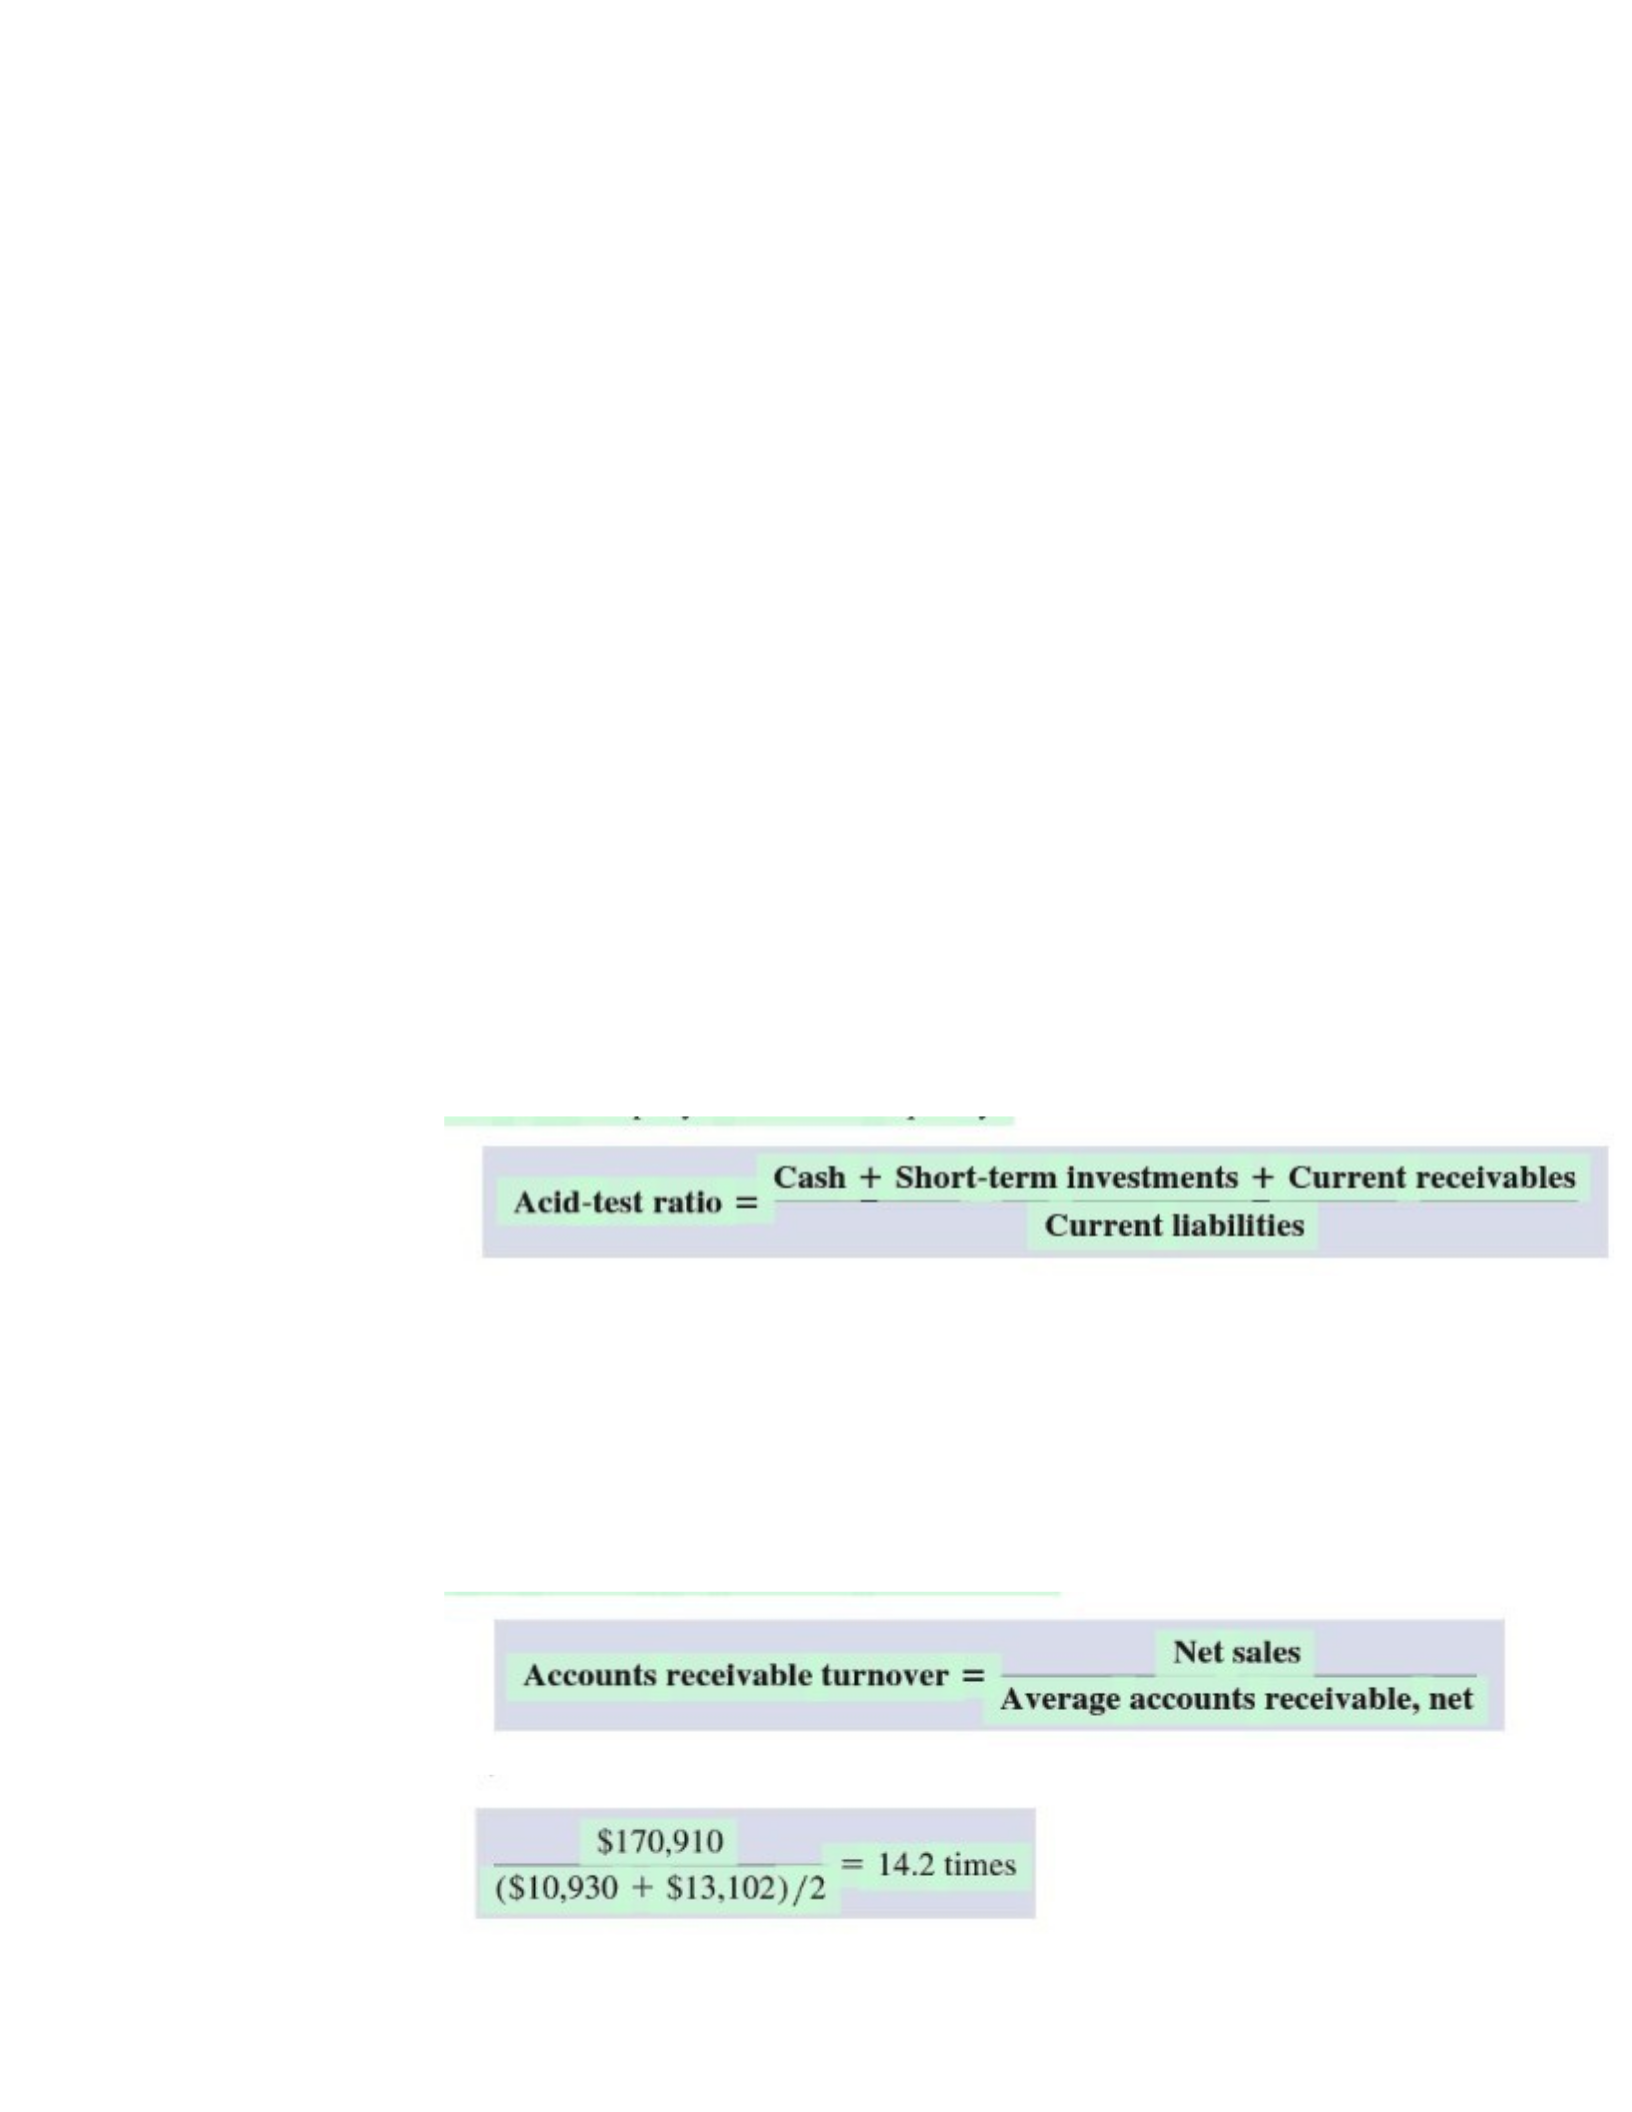
c. Acid Test Ratio- quick assets are cash, short term investments, and current
receivables. The acid test ratio also called quick ratio reflects on a company’s
short term liquidity. 1:1 is the common guideline for an acceptable acid test ratio.
d. Accounts receivable turnover- we can measure how frequently a company
converts its receivables into cash by computing the accoutns receivable turnover.
This ratio is defined as: Net sales divided by average accounts receivable, net.
Short term receivables from customers are oftern included in the denominator
along with accounts receivable. Accts receivable turnover is more precise if credit
sales are used for the numerator, but external users generally use net sales or net
revenues.
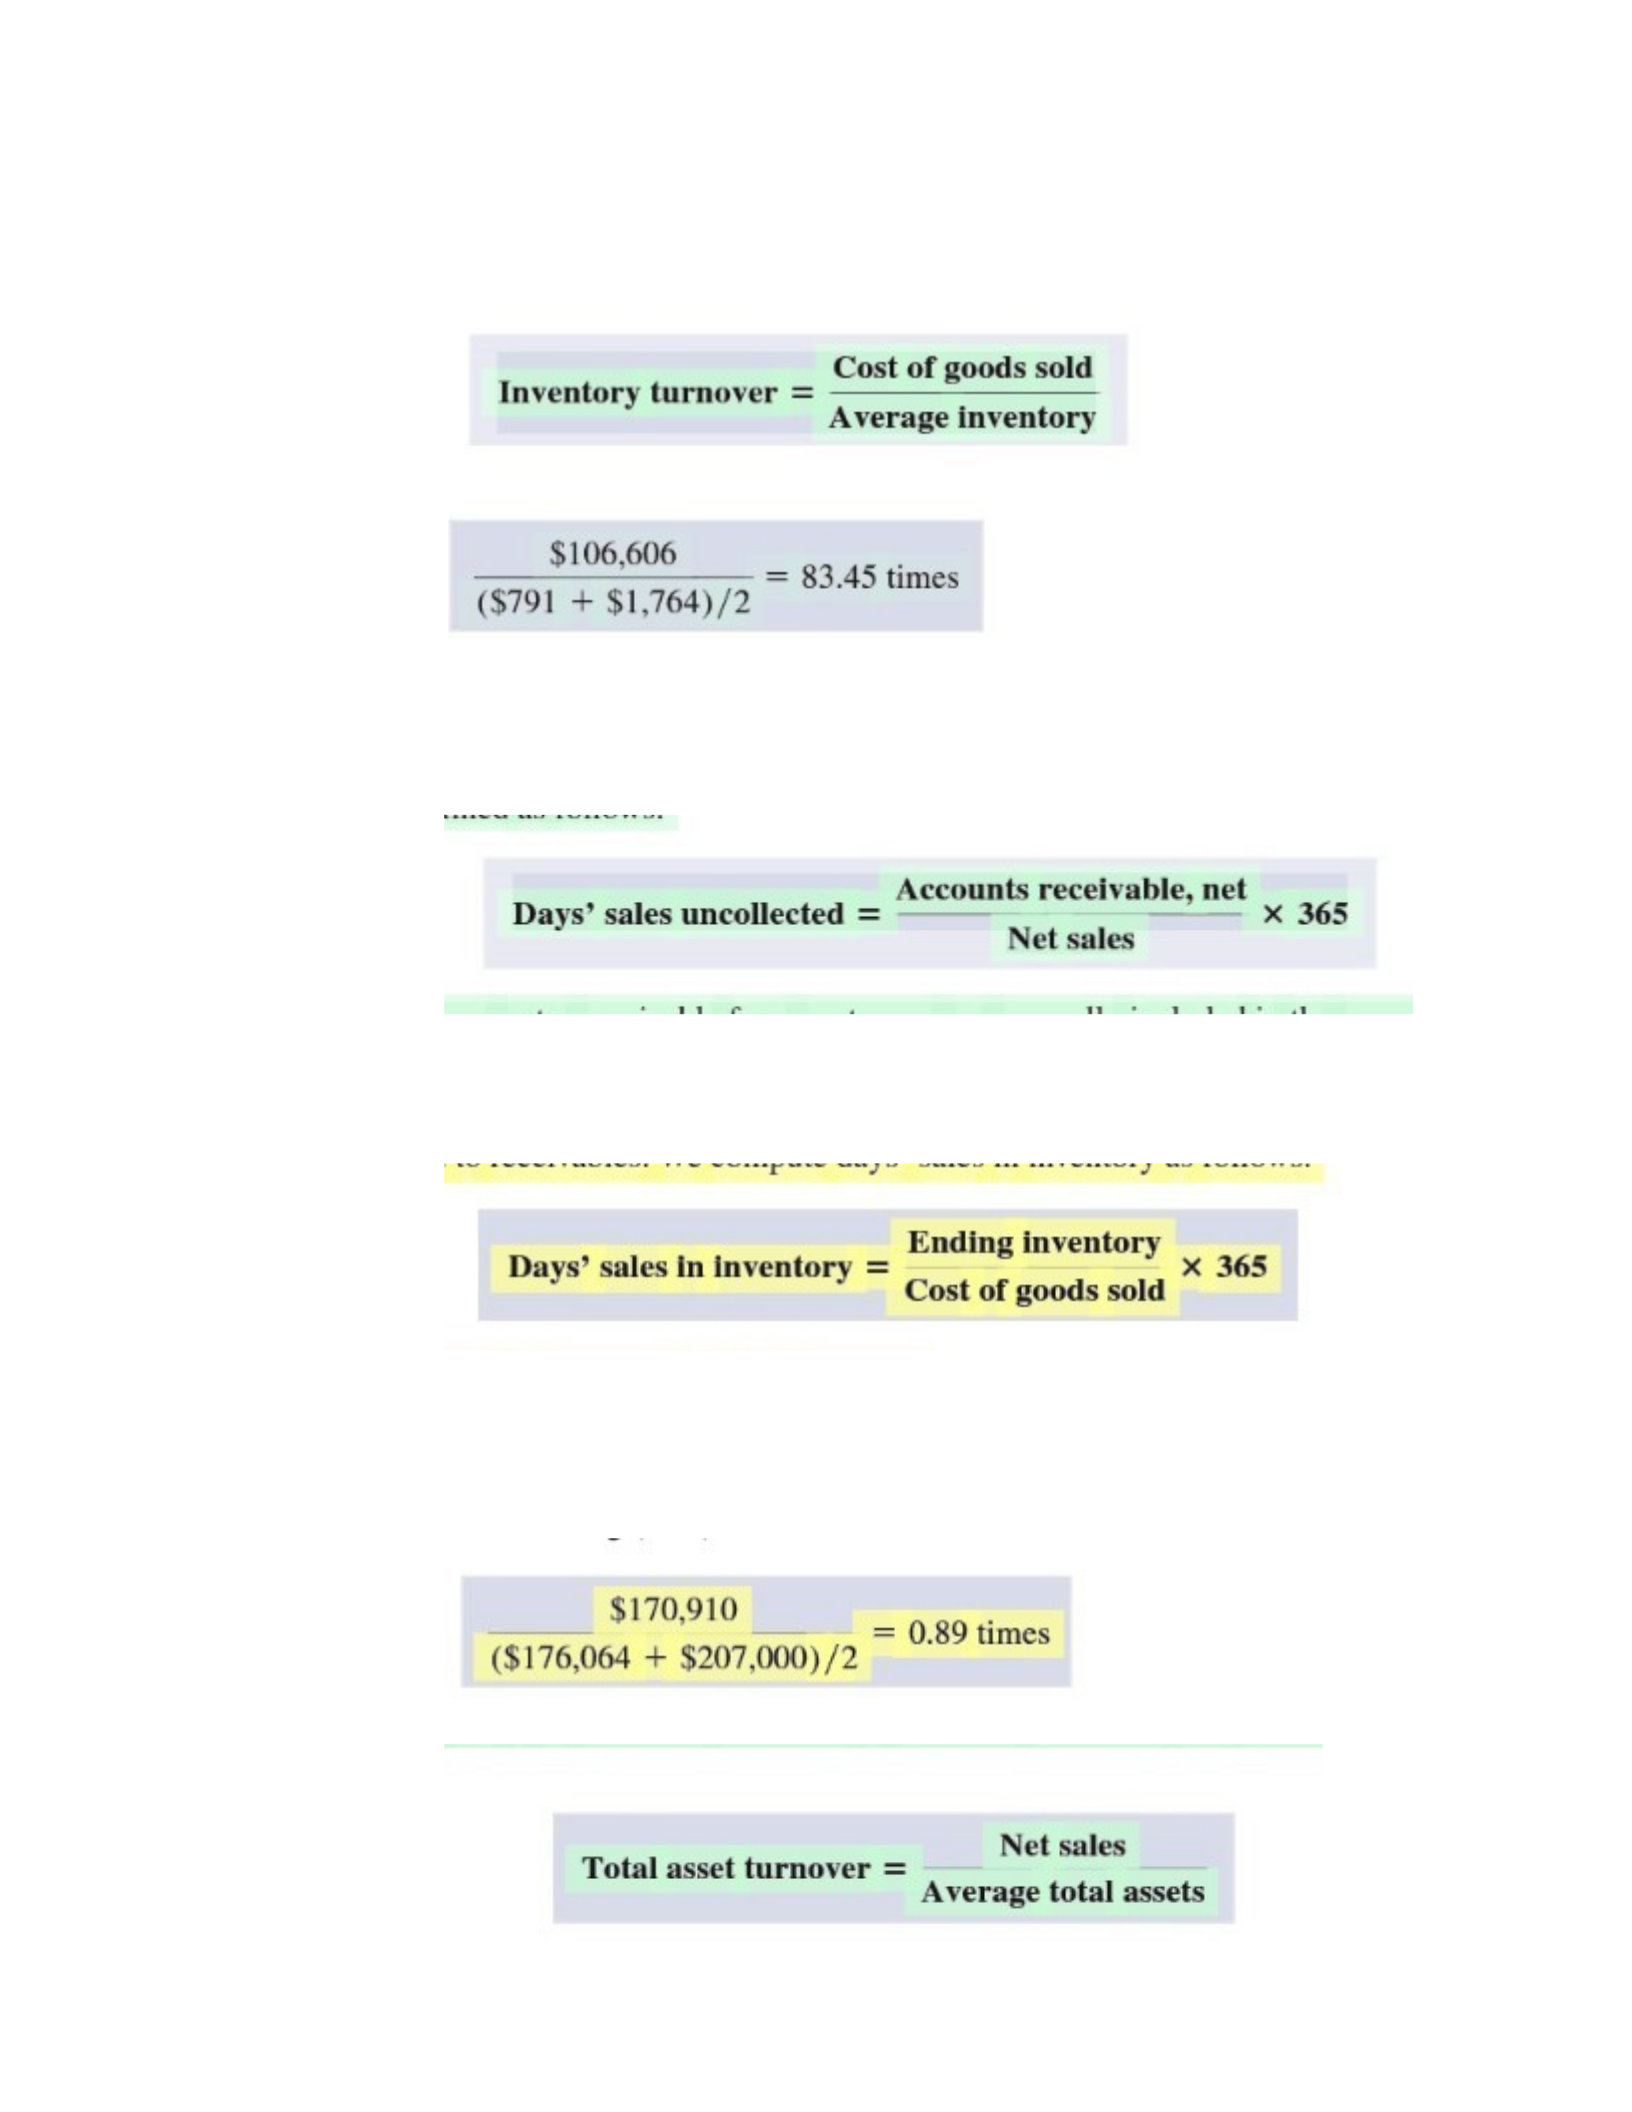
e. Inventory Turnover-How long a company holds inventory before selling it. This
is also called merchandise turnover or merchandise inventory turnover, which is
defined as:
f. Days Sales Uncollected- Accounts receivable turnover provides insight into how
frequently a company collects its accounts. Any short term notes receivable
from customers are normally included in the numerator. Defined as:
g. Days Sales Inventory-is a useful measure in evaluating inventory liquidity.
Days’ sales in inventory is linked to inventory in a way that days’ sales
uncollected is linked to receivables. It is computed as:
h. Total Asset Turnover- reflects a company’s ability to use its assets to generate
sales and is an important indication of operating efficiency. The definition of this
ratio is:
i. Solvency- refers to a company’s long-run financial viability and its ability to
cover long term obligations. All of a company’s business activities ; financing,
investing and operation affect its solvency. Analysis of Solvency is long term
and uses less precise but more encompassing measures than liquidity. One of
the most important components of solvency analysis is the composition of a
company’s capital structure. Capital Structure refers to a company’s financing
sources.
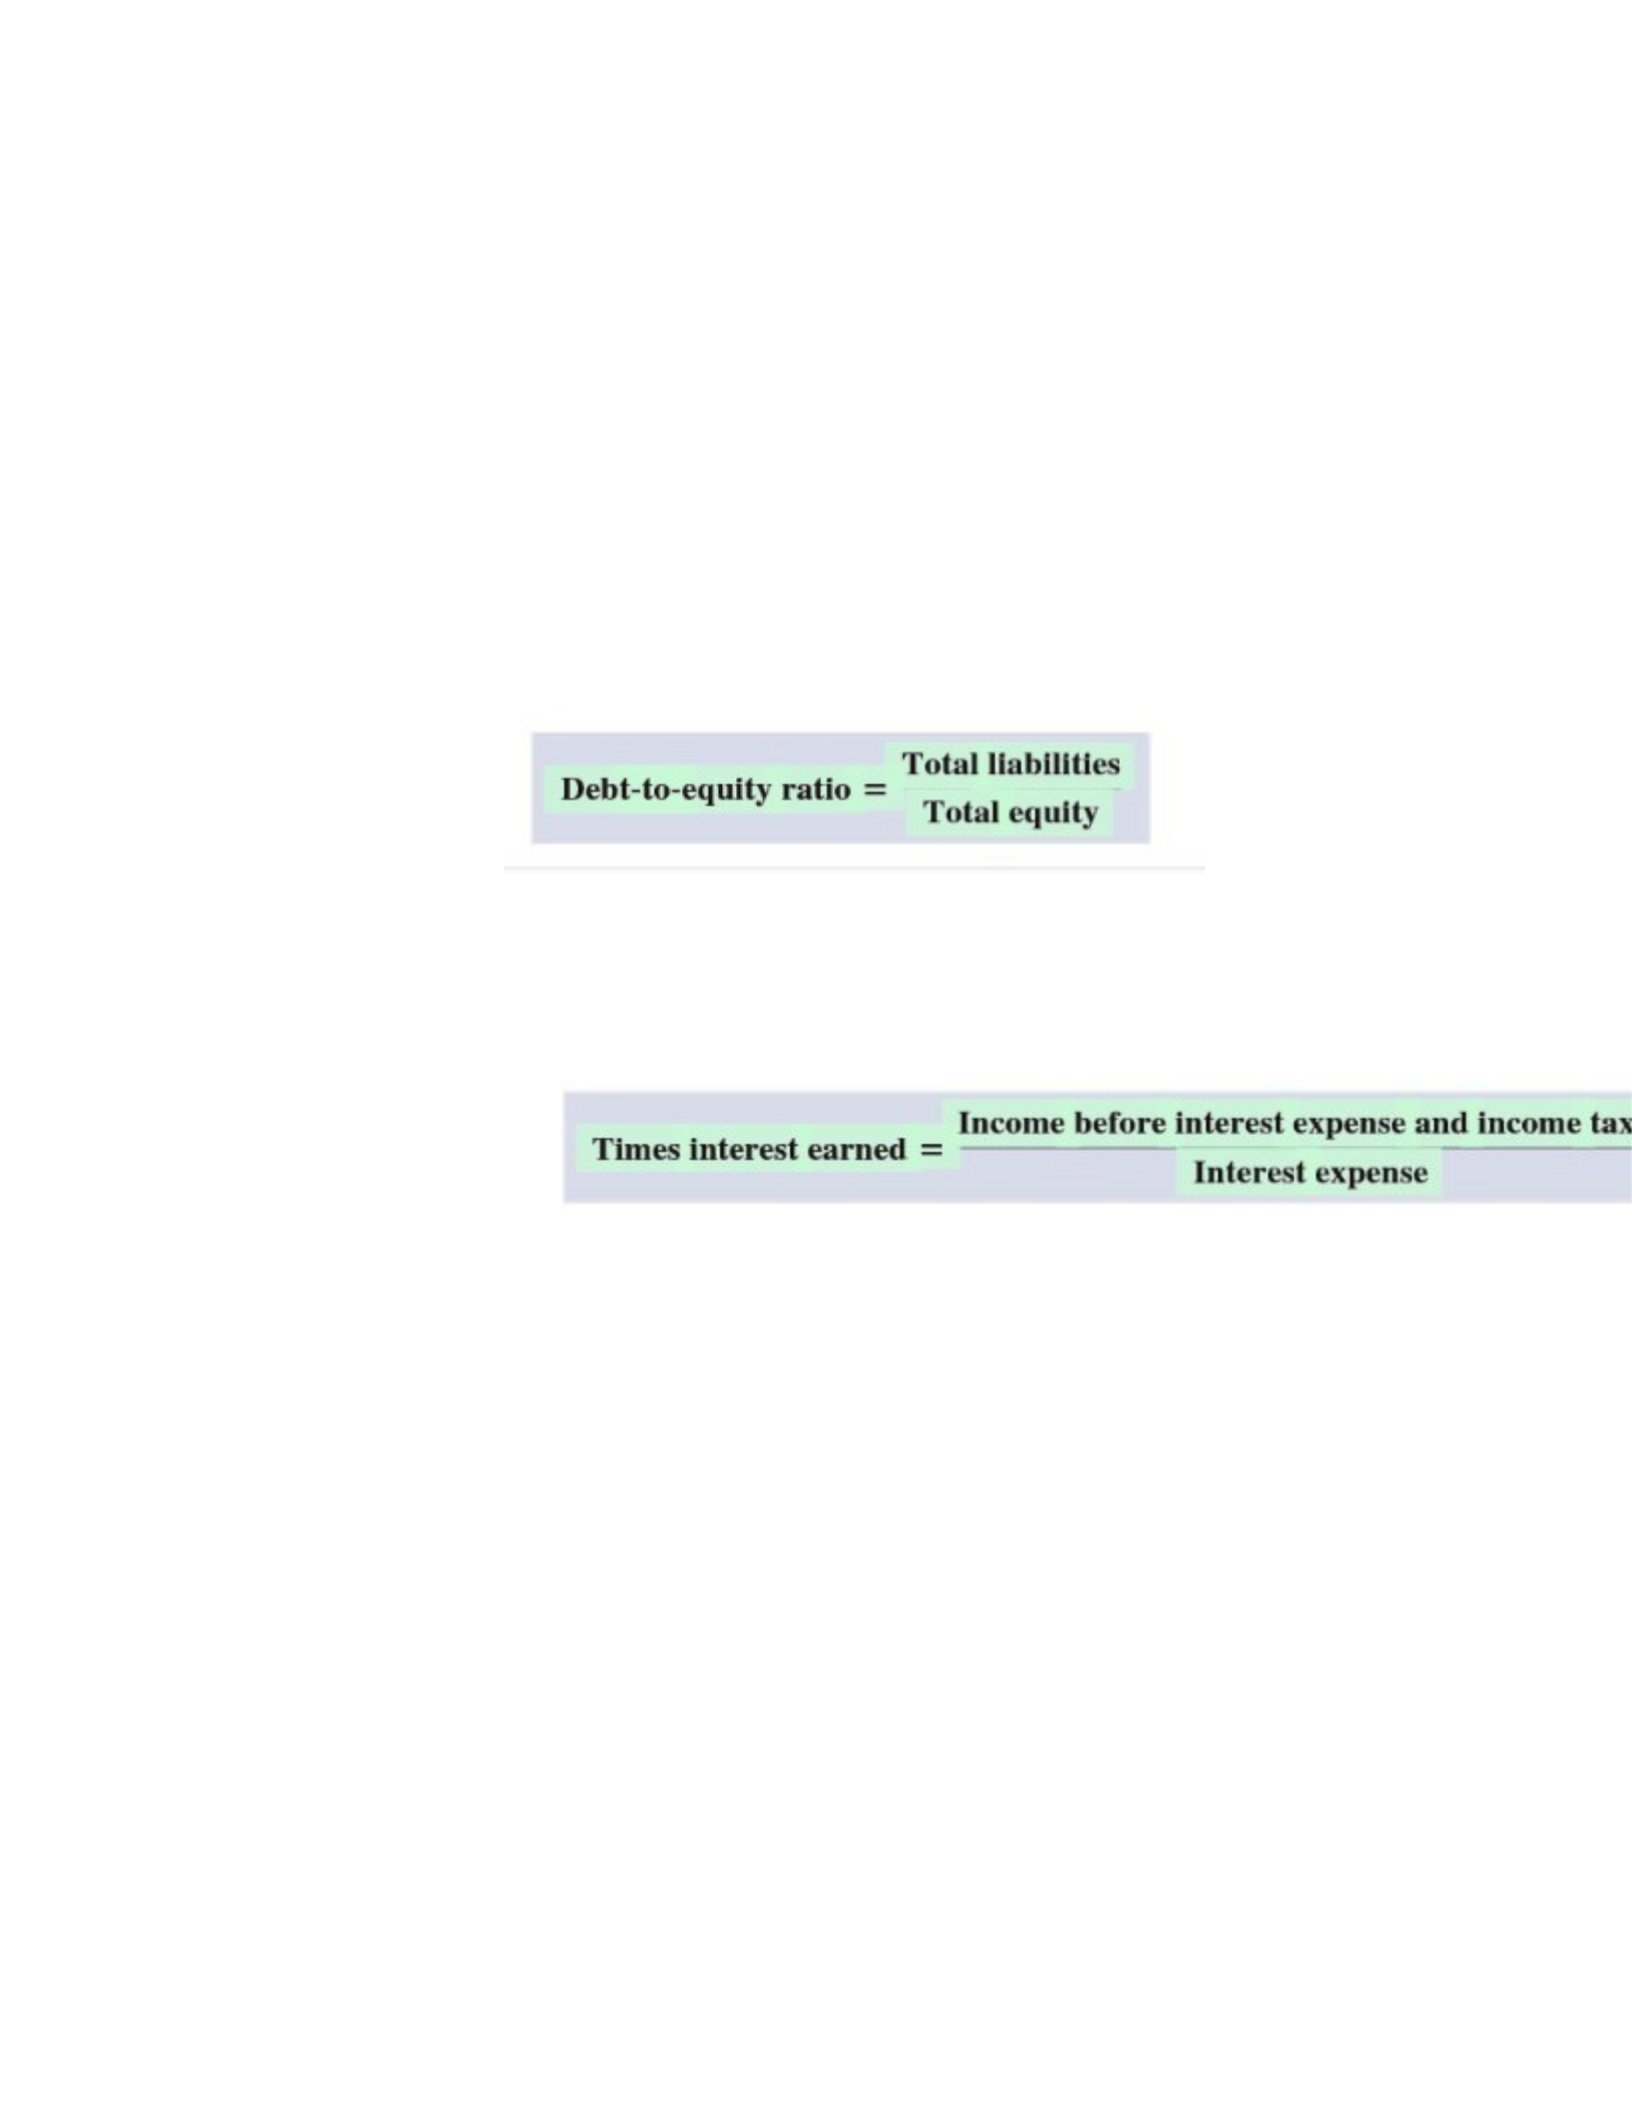
i. Debt and Equity Ratio- one element of solvency analysis is to assess the
portion of a company’s assets contributed by its owners and the portion
contributed by creditors. The Debt Ratio expresses total liabilities as a
percent of total assets. The Equity ratio provides complementary
information by expressing total equity as a percent of total assets.
ii. Times interest earned – the amount of income before deductions for
interest expense and income taxes is the amount available to pay
interest expense. The larger this ratio the less risky the company for
creditors.
(Through page 525)

