


-Problem Definition
-Data Collection and Evaluation
-Data Organization
Module 1
Why Statistics?
What can MBA students learn about statistics?
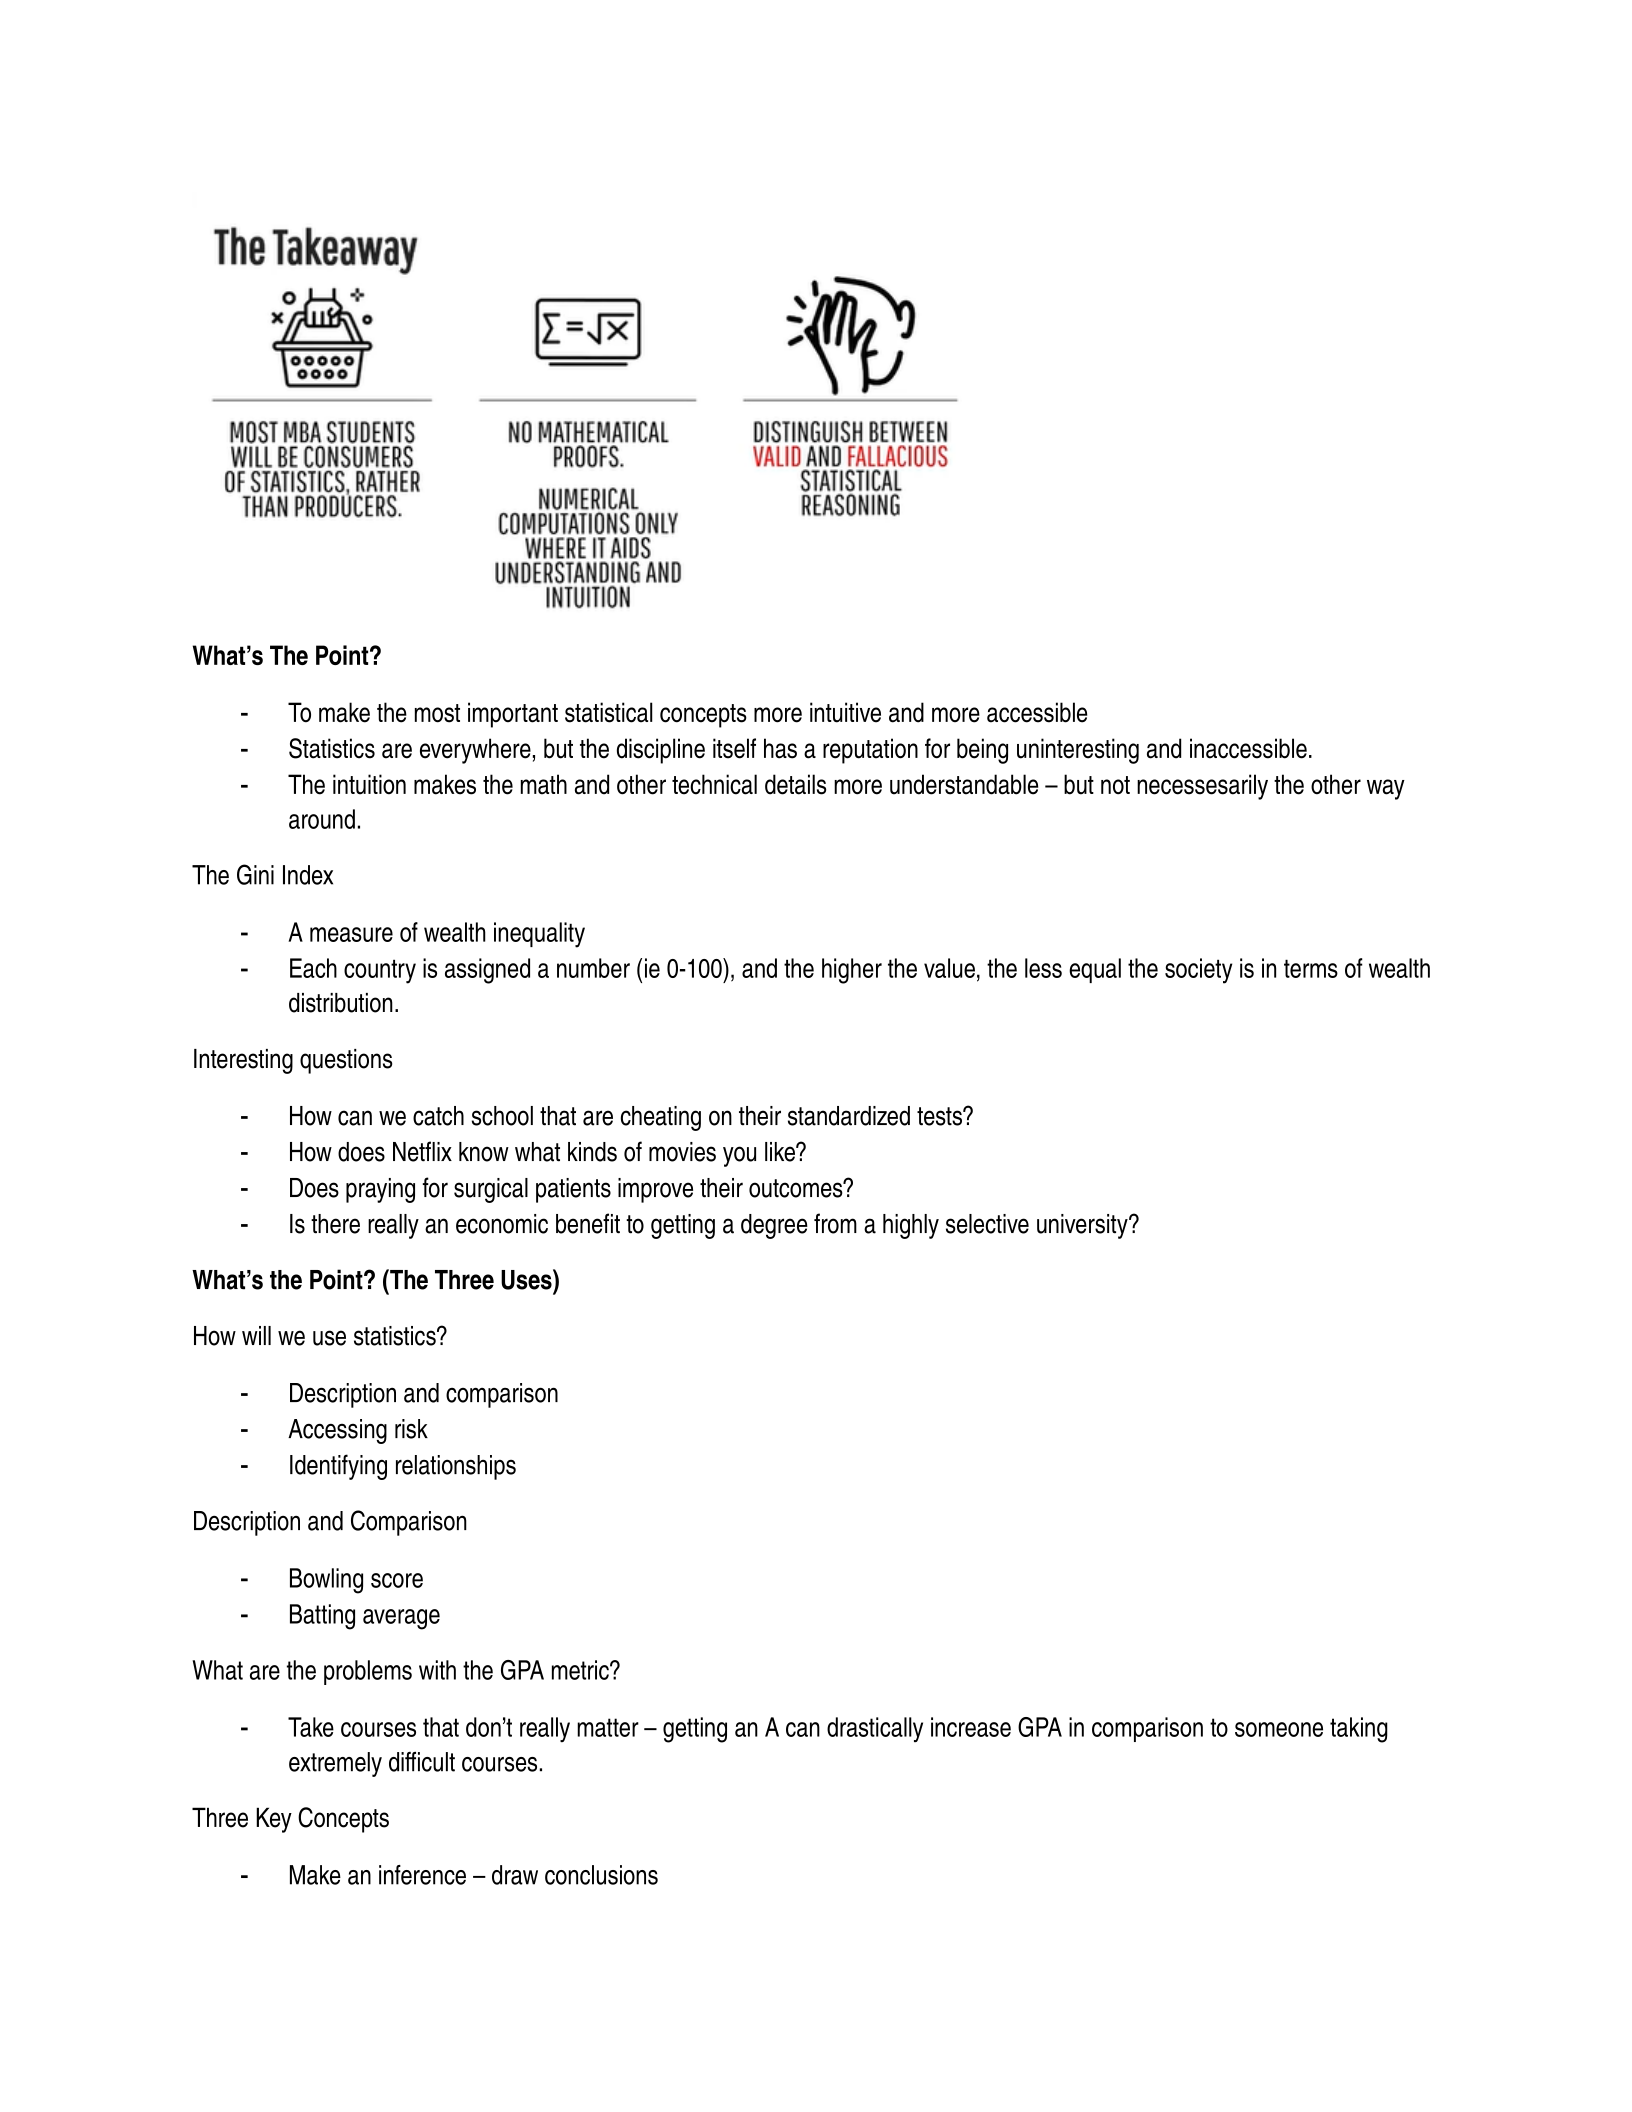
-Be effective consumers and producers
-How to Evaluate Statistical Information
-How to critically Evaluate the Quality of Data
-Recognize Data can be Misleading
Definition of Statistical Analysis
-How do I move from an interesting question to a useful answer and how do I present that effectively.
What is Statistics?
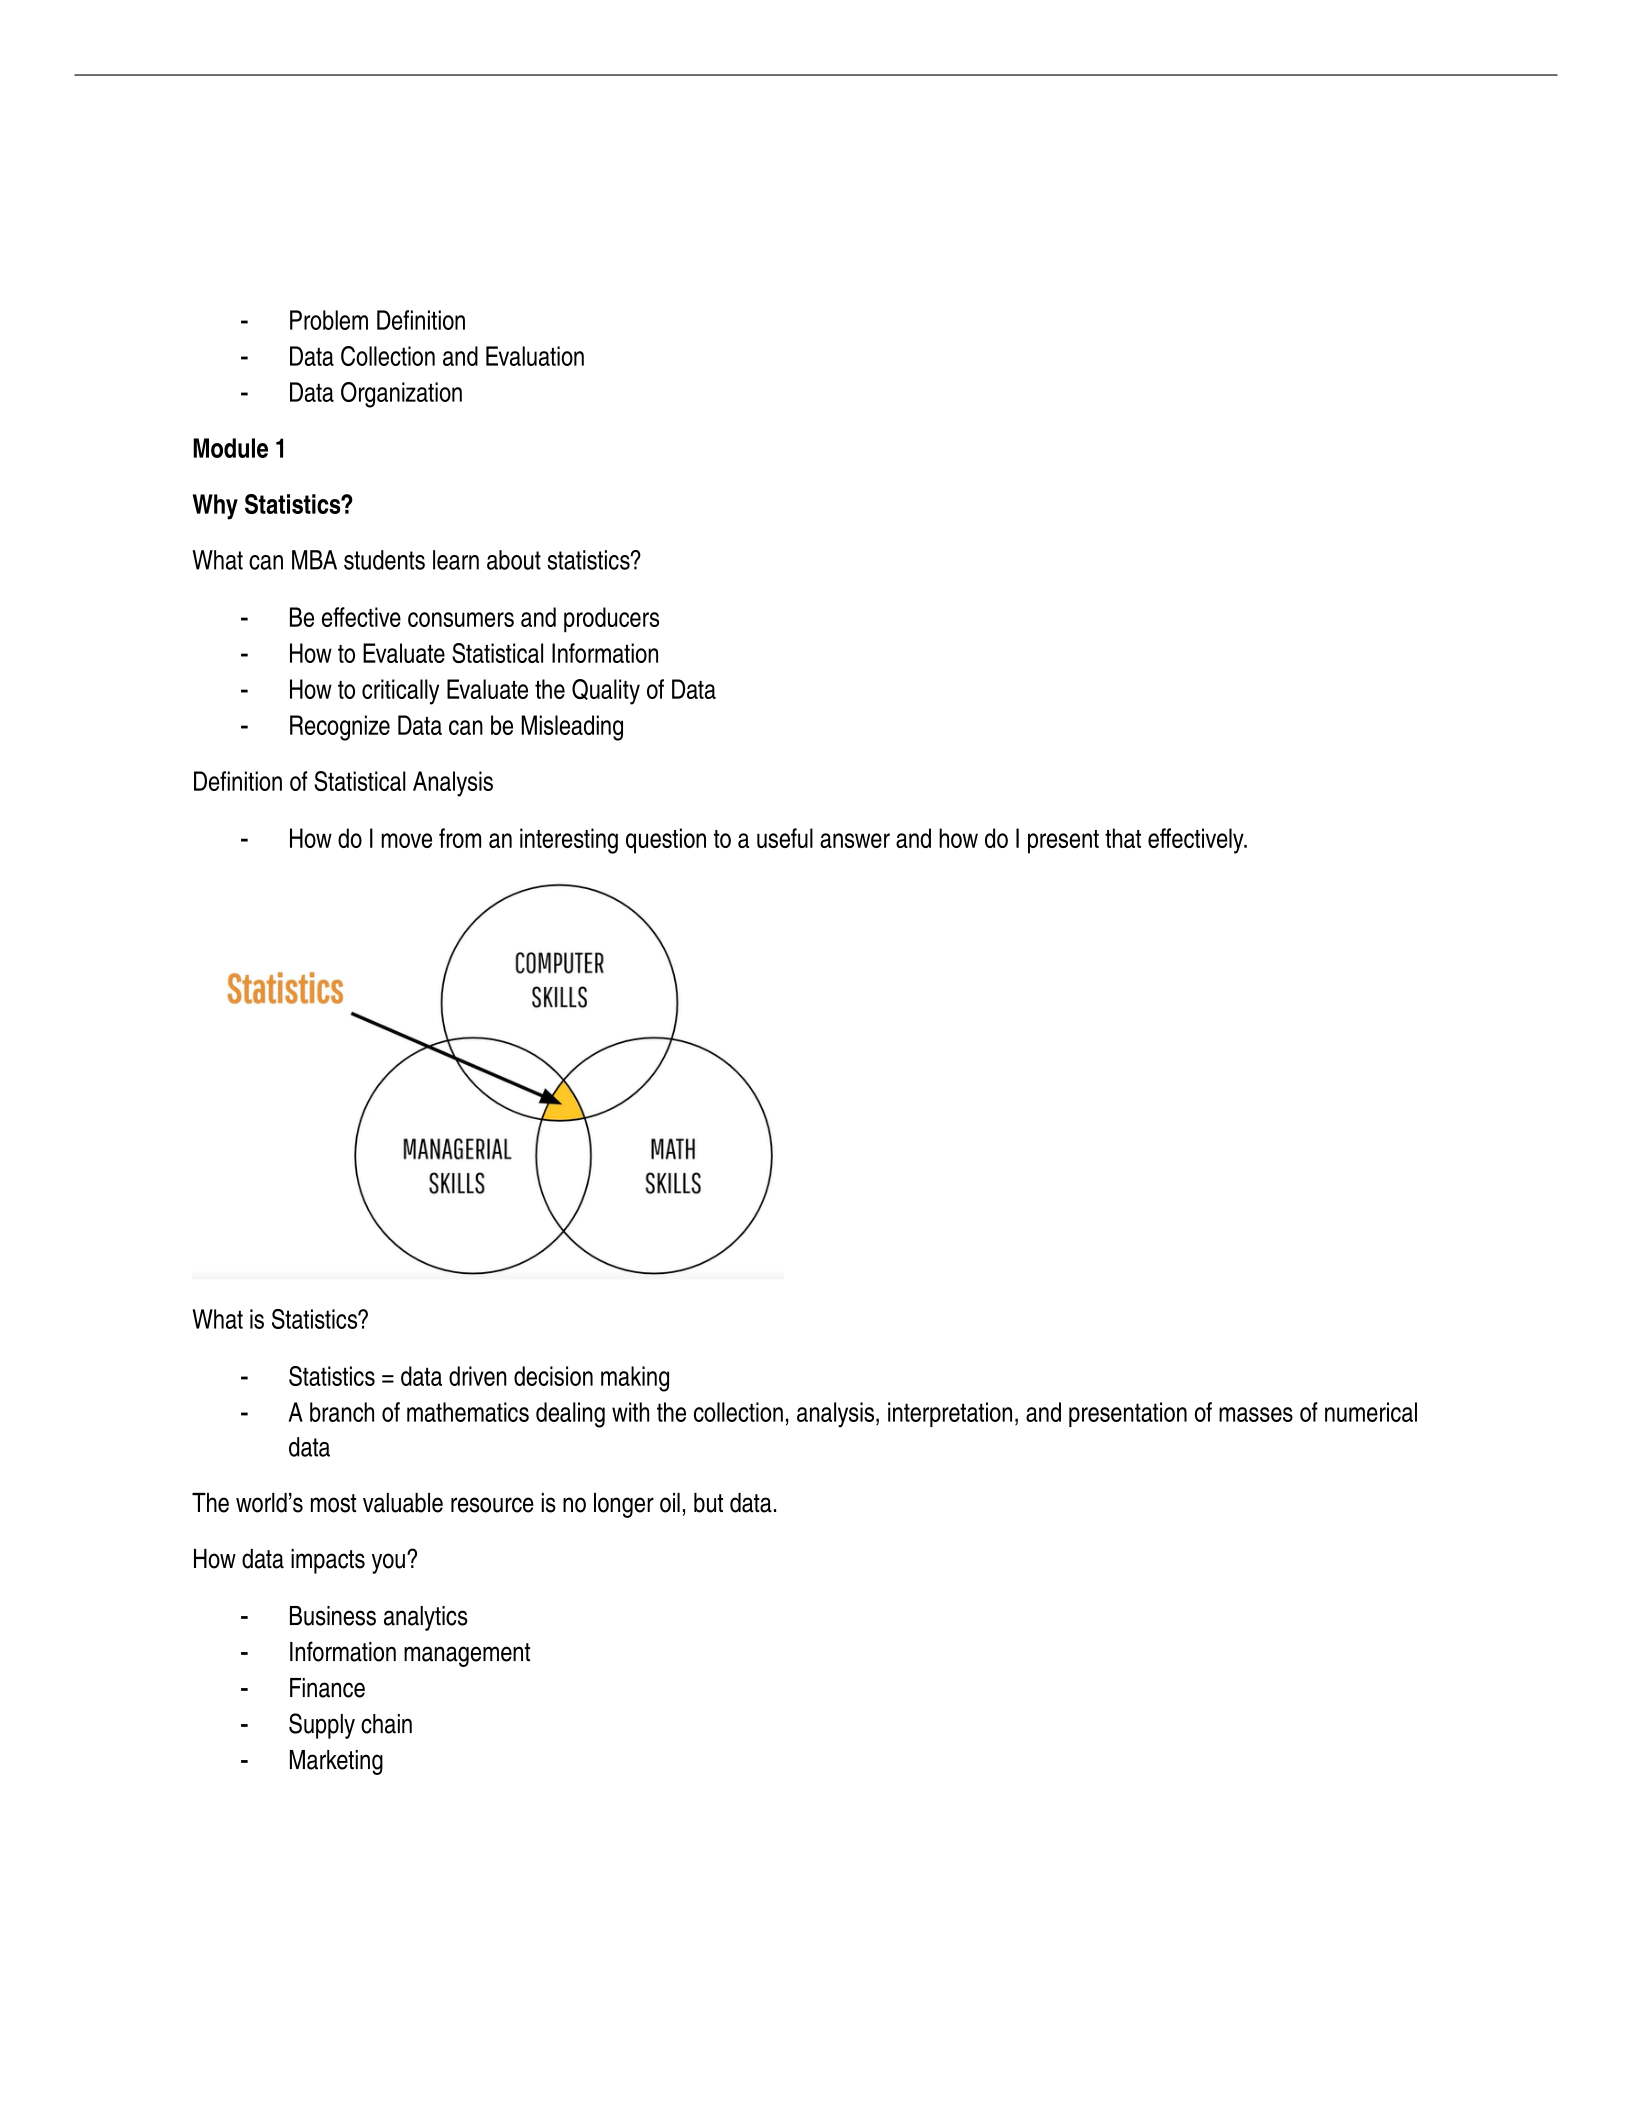
-Statistics = data driven decision making
-A branch of mathematics dealing with the collection, analysis, interpretation, and presentation of masses of numerical
data
The world’s most valuable resource is no longer oil, but data.
How data impacts you?
-Business analytics
-Information management
-Finance
-Supply chain
-Marketing
WPC 501 - Statistics for Managers
5 step method DCOVA
What’s The Point?
-To make the most important statistical concepts more intuitive and more accessible
-Statistics are everywhere, but the discipline itself has a reputation for being uninteresting and inaccessible.
-The intuition makes the math and other technical details more understandable – but not necessesarily the other way
around.
The Gini Index
-A measure of wealth inequality
-Each country is assigned a number (ie 0-100), and the higher the value, the less equal the society is in terms of wealth
distribution.
Interesting questions
-How can we catch school that are cheating on their standardized tests?
-How does Netflix know what kinds of movies you like?
-Does praying for surgical patients improve their outcomes?
-Is there really an economic benefit to getting a degree from a highly selective university?
What’s the Point? (The Three Uses)
How will we use statistics?
-Description and comparison
-Accessing risk
-Identifying relationships
Description and Comparison
-Bowling score
-Batting average
What are the problems with the GPA metric?
-Take courses that don’t really matter – getting an A can drastically increase GPA in comparison to someone taking
extremely difficult courses.
Three Key Concepts
-Make an inference – draw conclusions
oInference
Using the known world to make educated guesses (inferences) of the unknown world.
-How are we getting a sample – representative
oSampling
Gathering data from a small area and using that to infer about the general population.
-Sampling Errors
oWhat can go wrong if we ask a biased group of the population.
Assessing Risk
-Risk management are all about thinking in terms of probabilities
oIs anyone planning to get into a car accident?
oIs anyone planning to stop driving because they could get into an accident?
Identifying Relationships
-Correlation does not mean causation!
oHow do we establish causality?
oWhat would it take to prove smoking causes cancer?
The approach is not like long division or multiplication. There is no “right” answer most of the time.
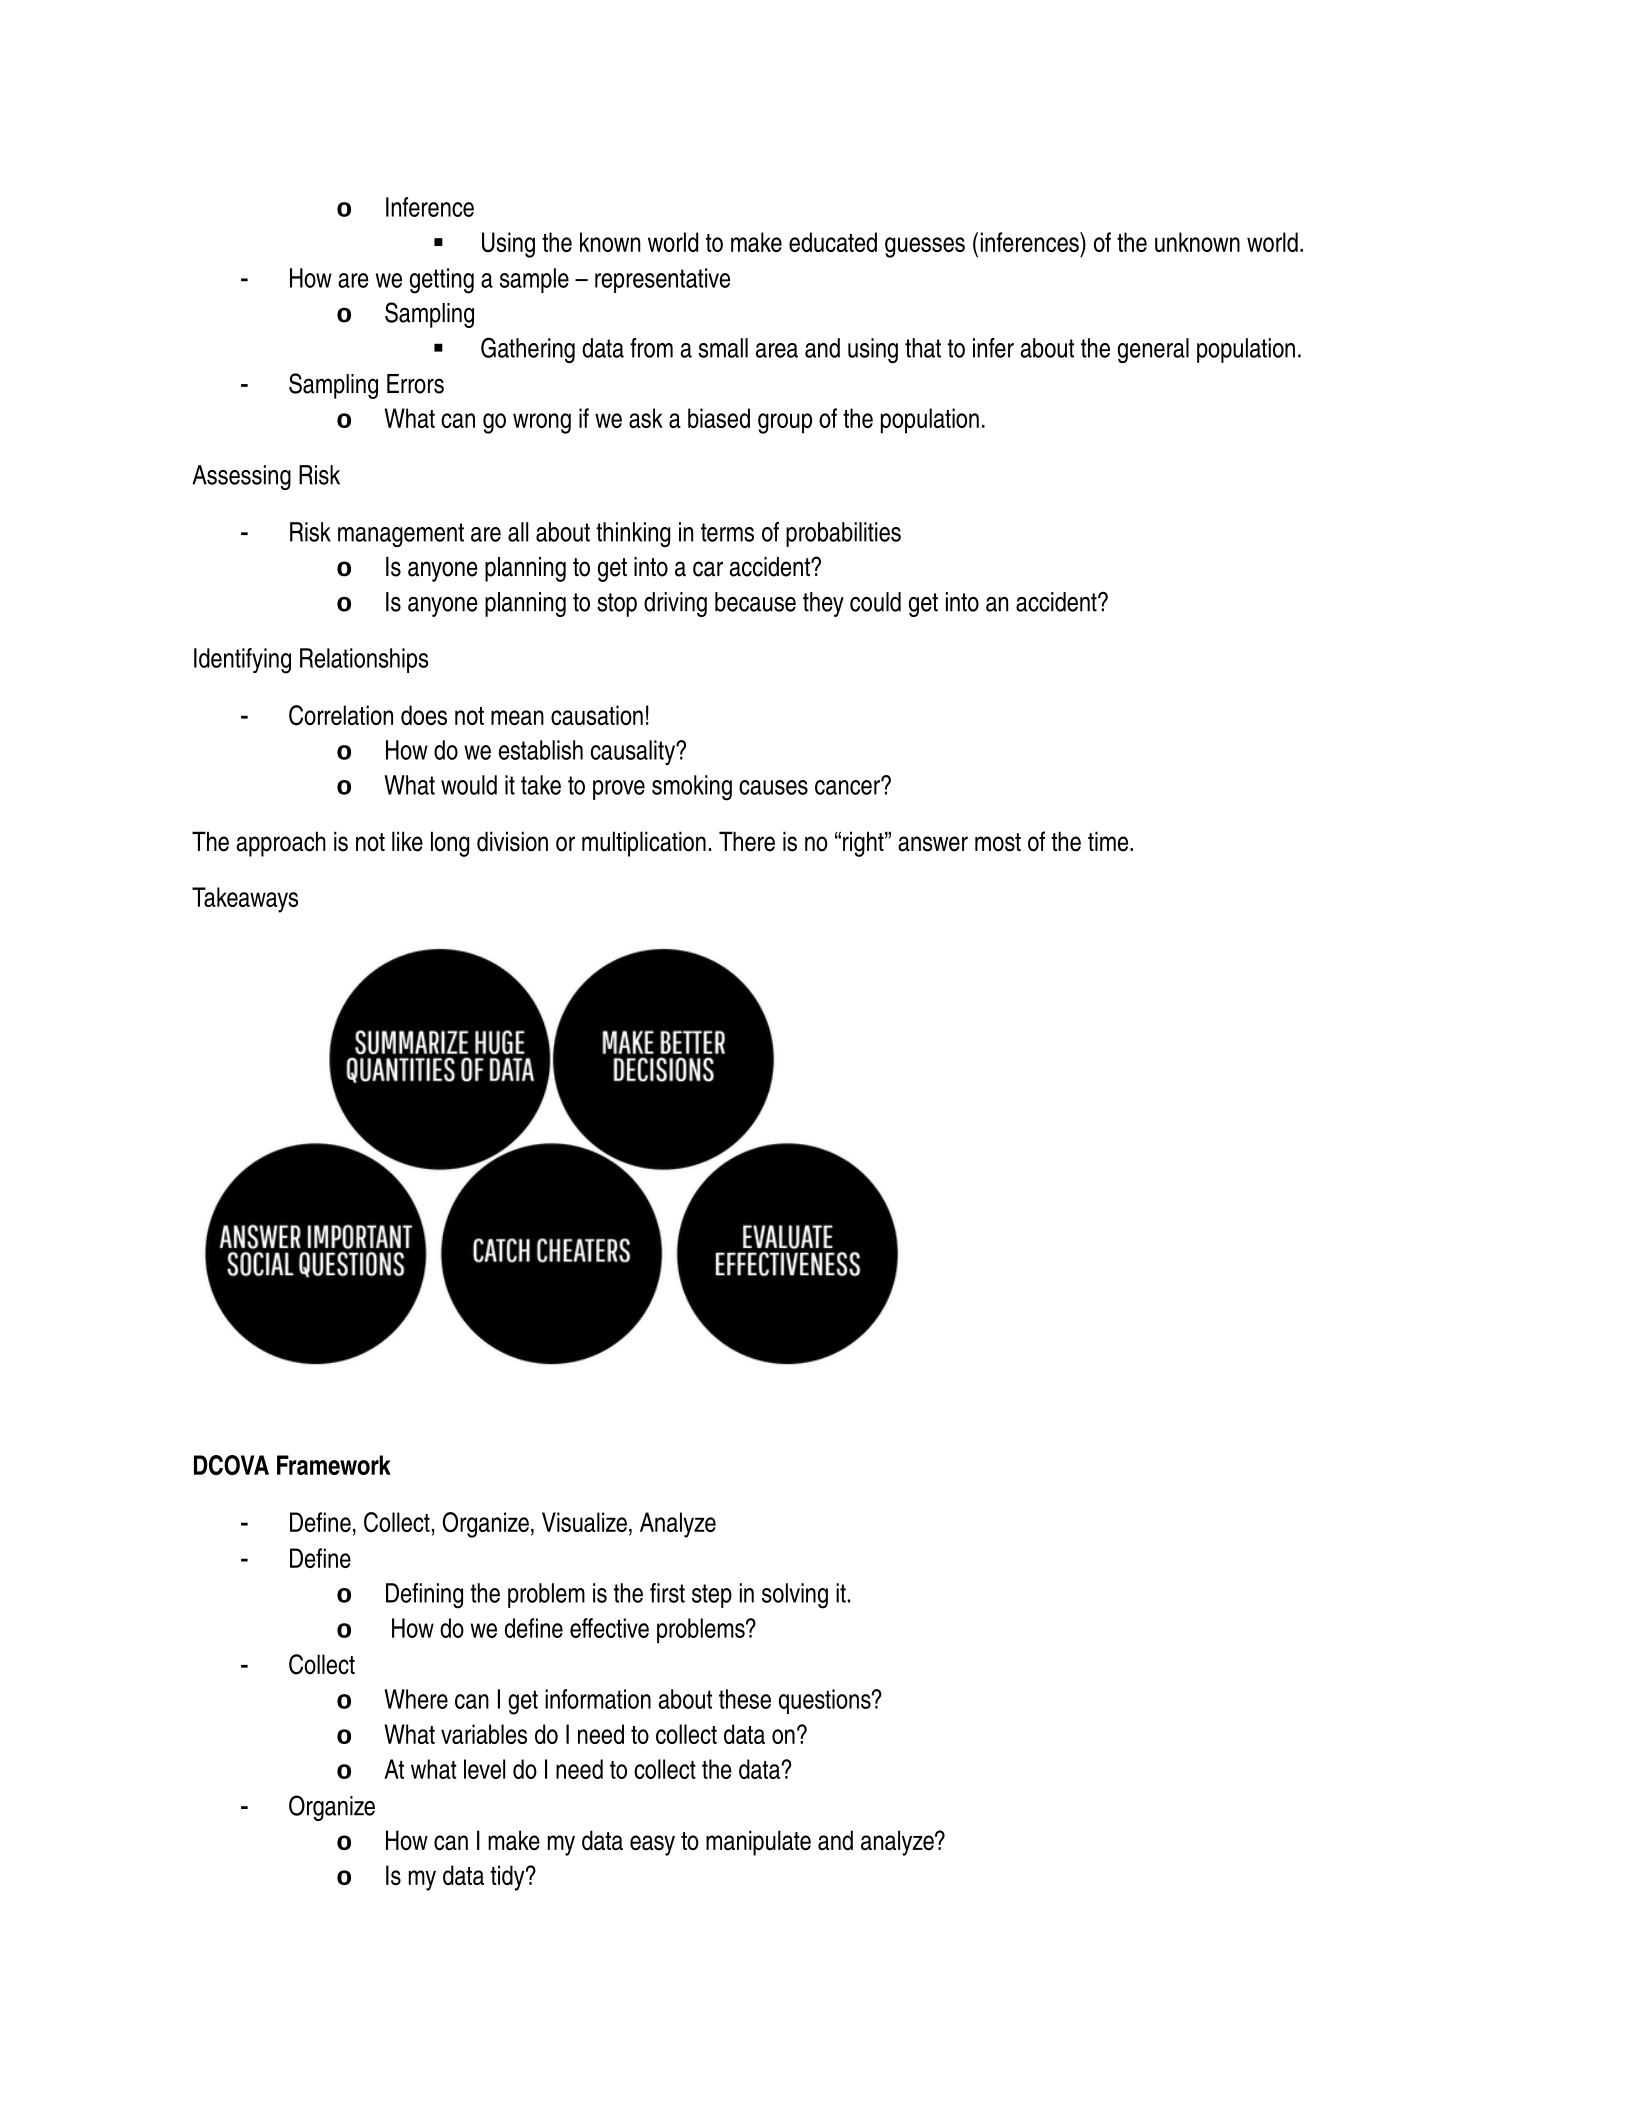
Takeaways
DCOVA Framework
-Define, Collect, Organize, Visualize, Analyze
-Define
oDefining the problem is the first step in solving it.
o How do we define effective problems?
-Collect
oWhere can I get information about these questions?
oWhat variables do I need to collect data on?
oAt what level do I need to collect the data?
-Organize
oHow can I make my data easy to manipulate and analyze?
oIs my data tidy?
One observation per row, one variable per column, one unit of observation per table
-Visualize
oPatterns in data can be really hard to find
oVisualizing is important before and after analysis
-Analyze
oWhat types of analysis exist?
oWhen is one type of analysis preferred over another?
oWhen is one type of program preferred over another?
oTypes of analysis
Descriptive, exploratory, inferential, predictive, causal
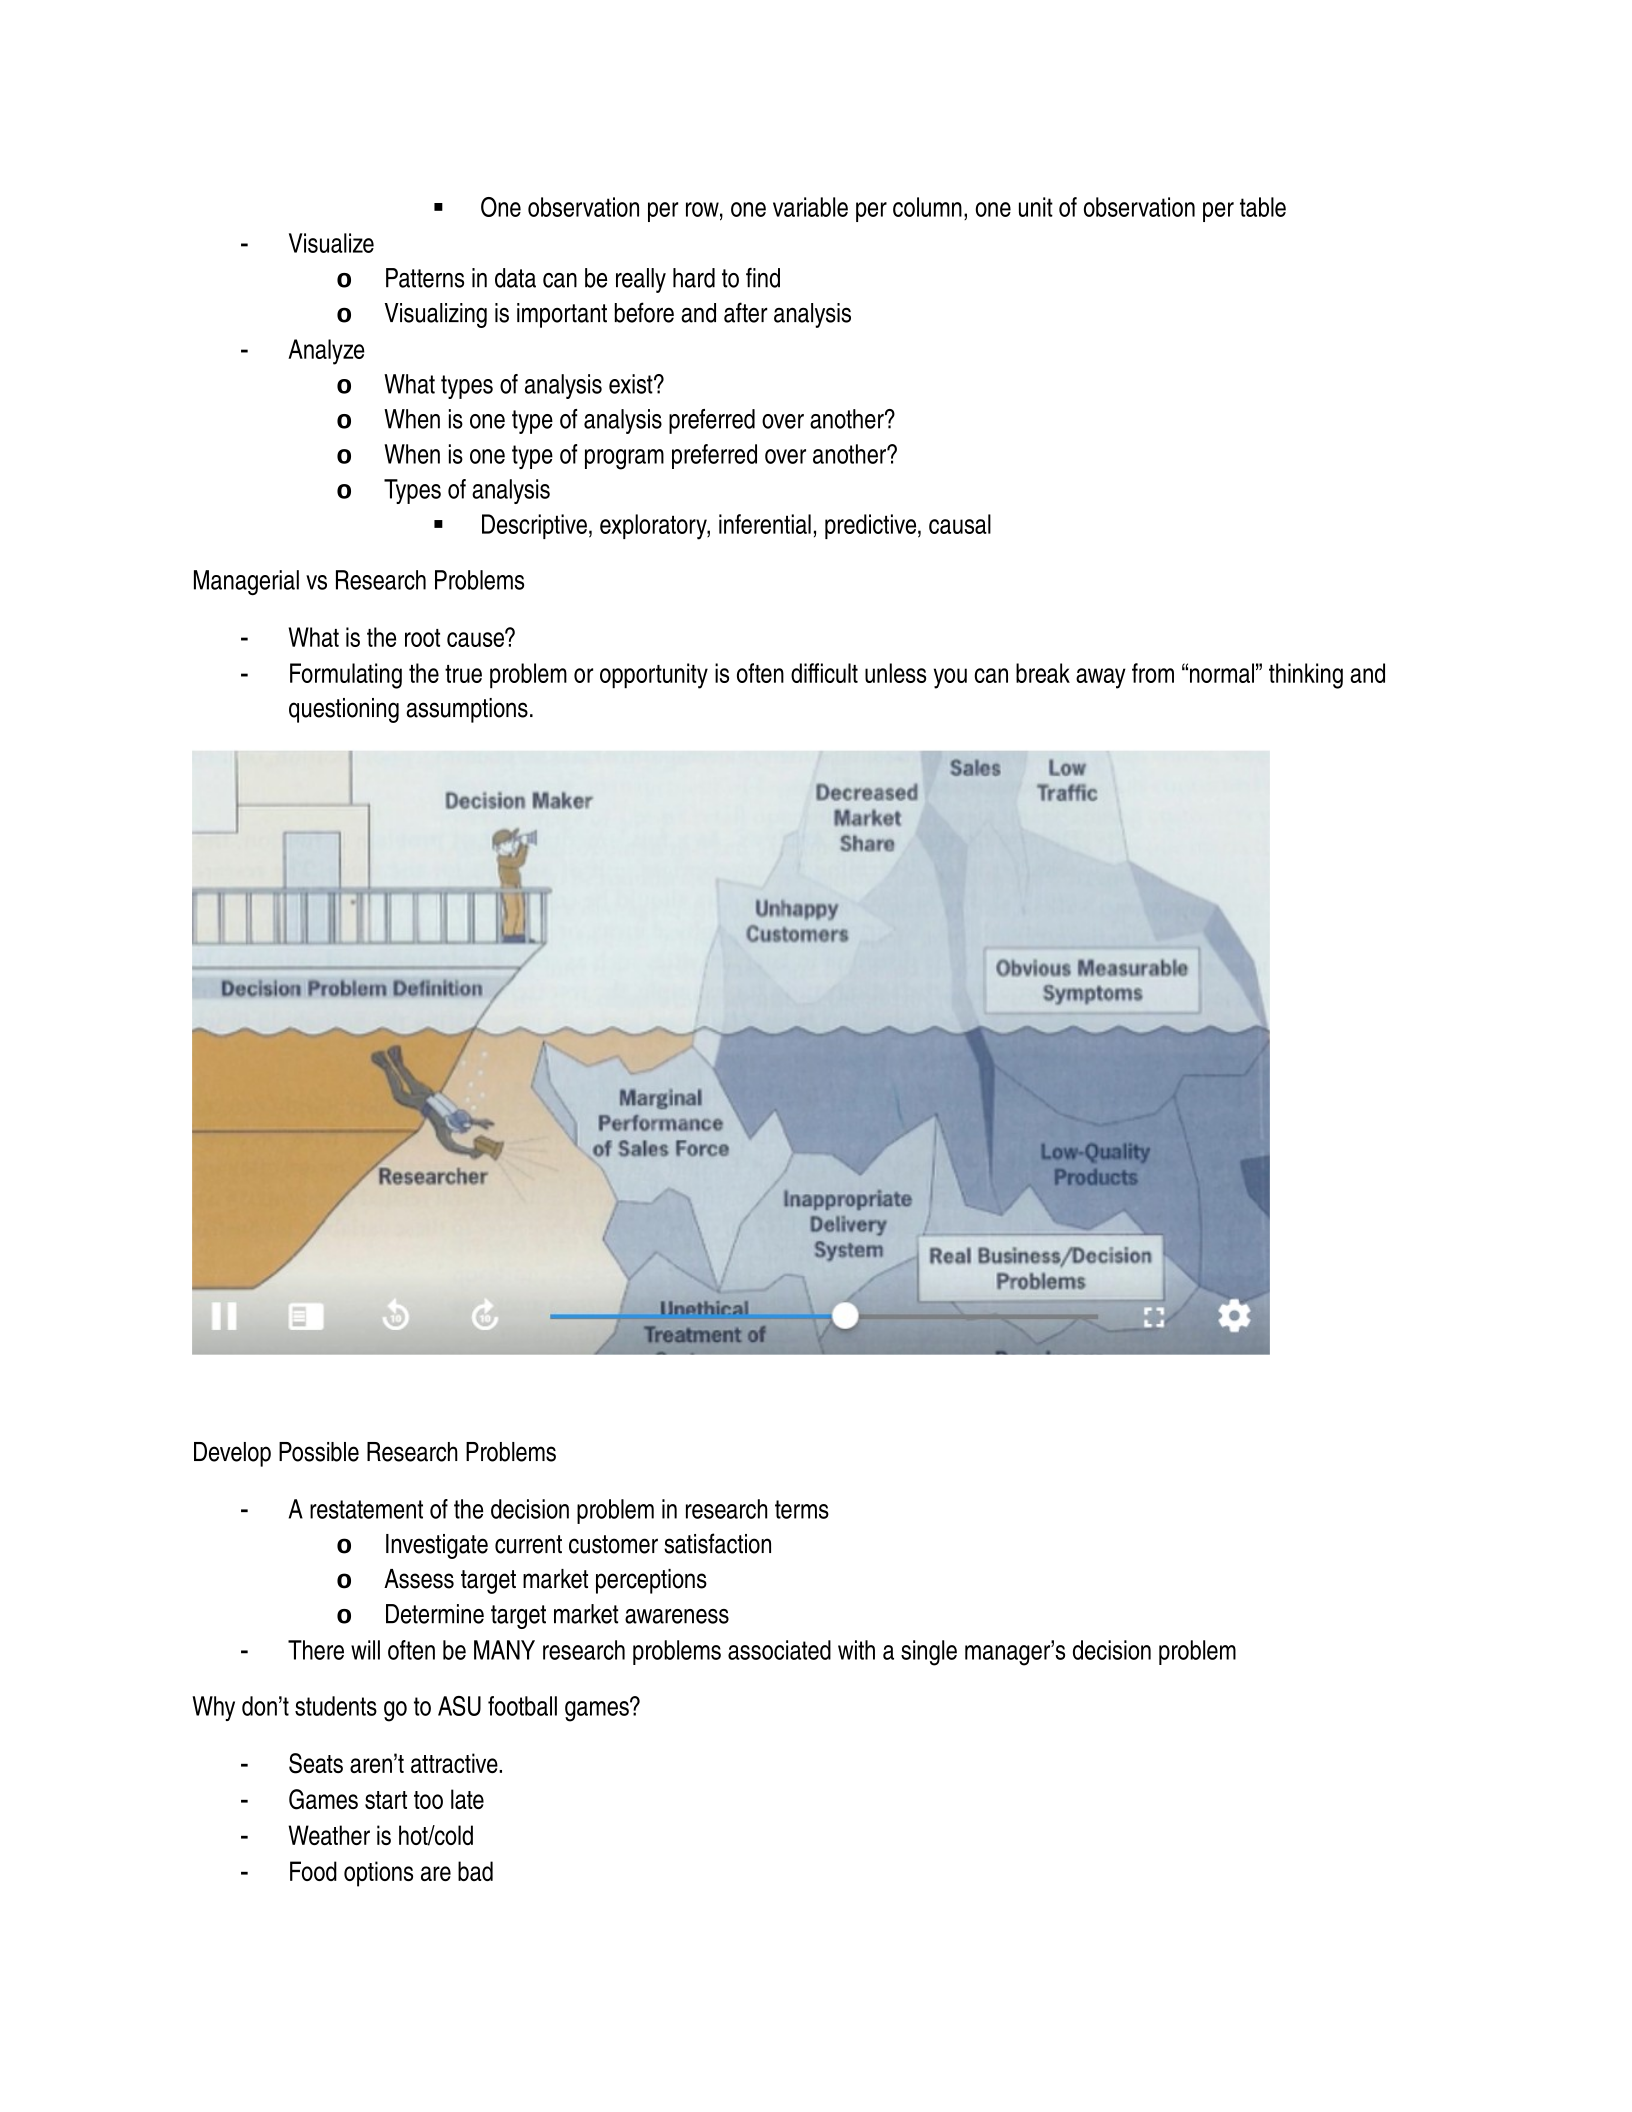
Managerial vs Research Problems
-What is the root cause?
-Formulating the true problem or opportunity is often difficult unless you can break away from “normal” thinking and
questioning assumptions.
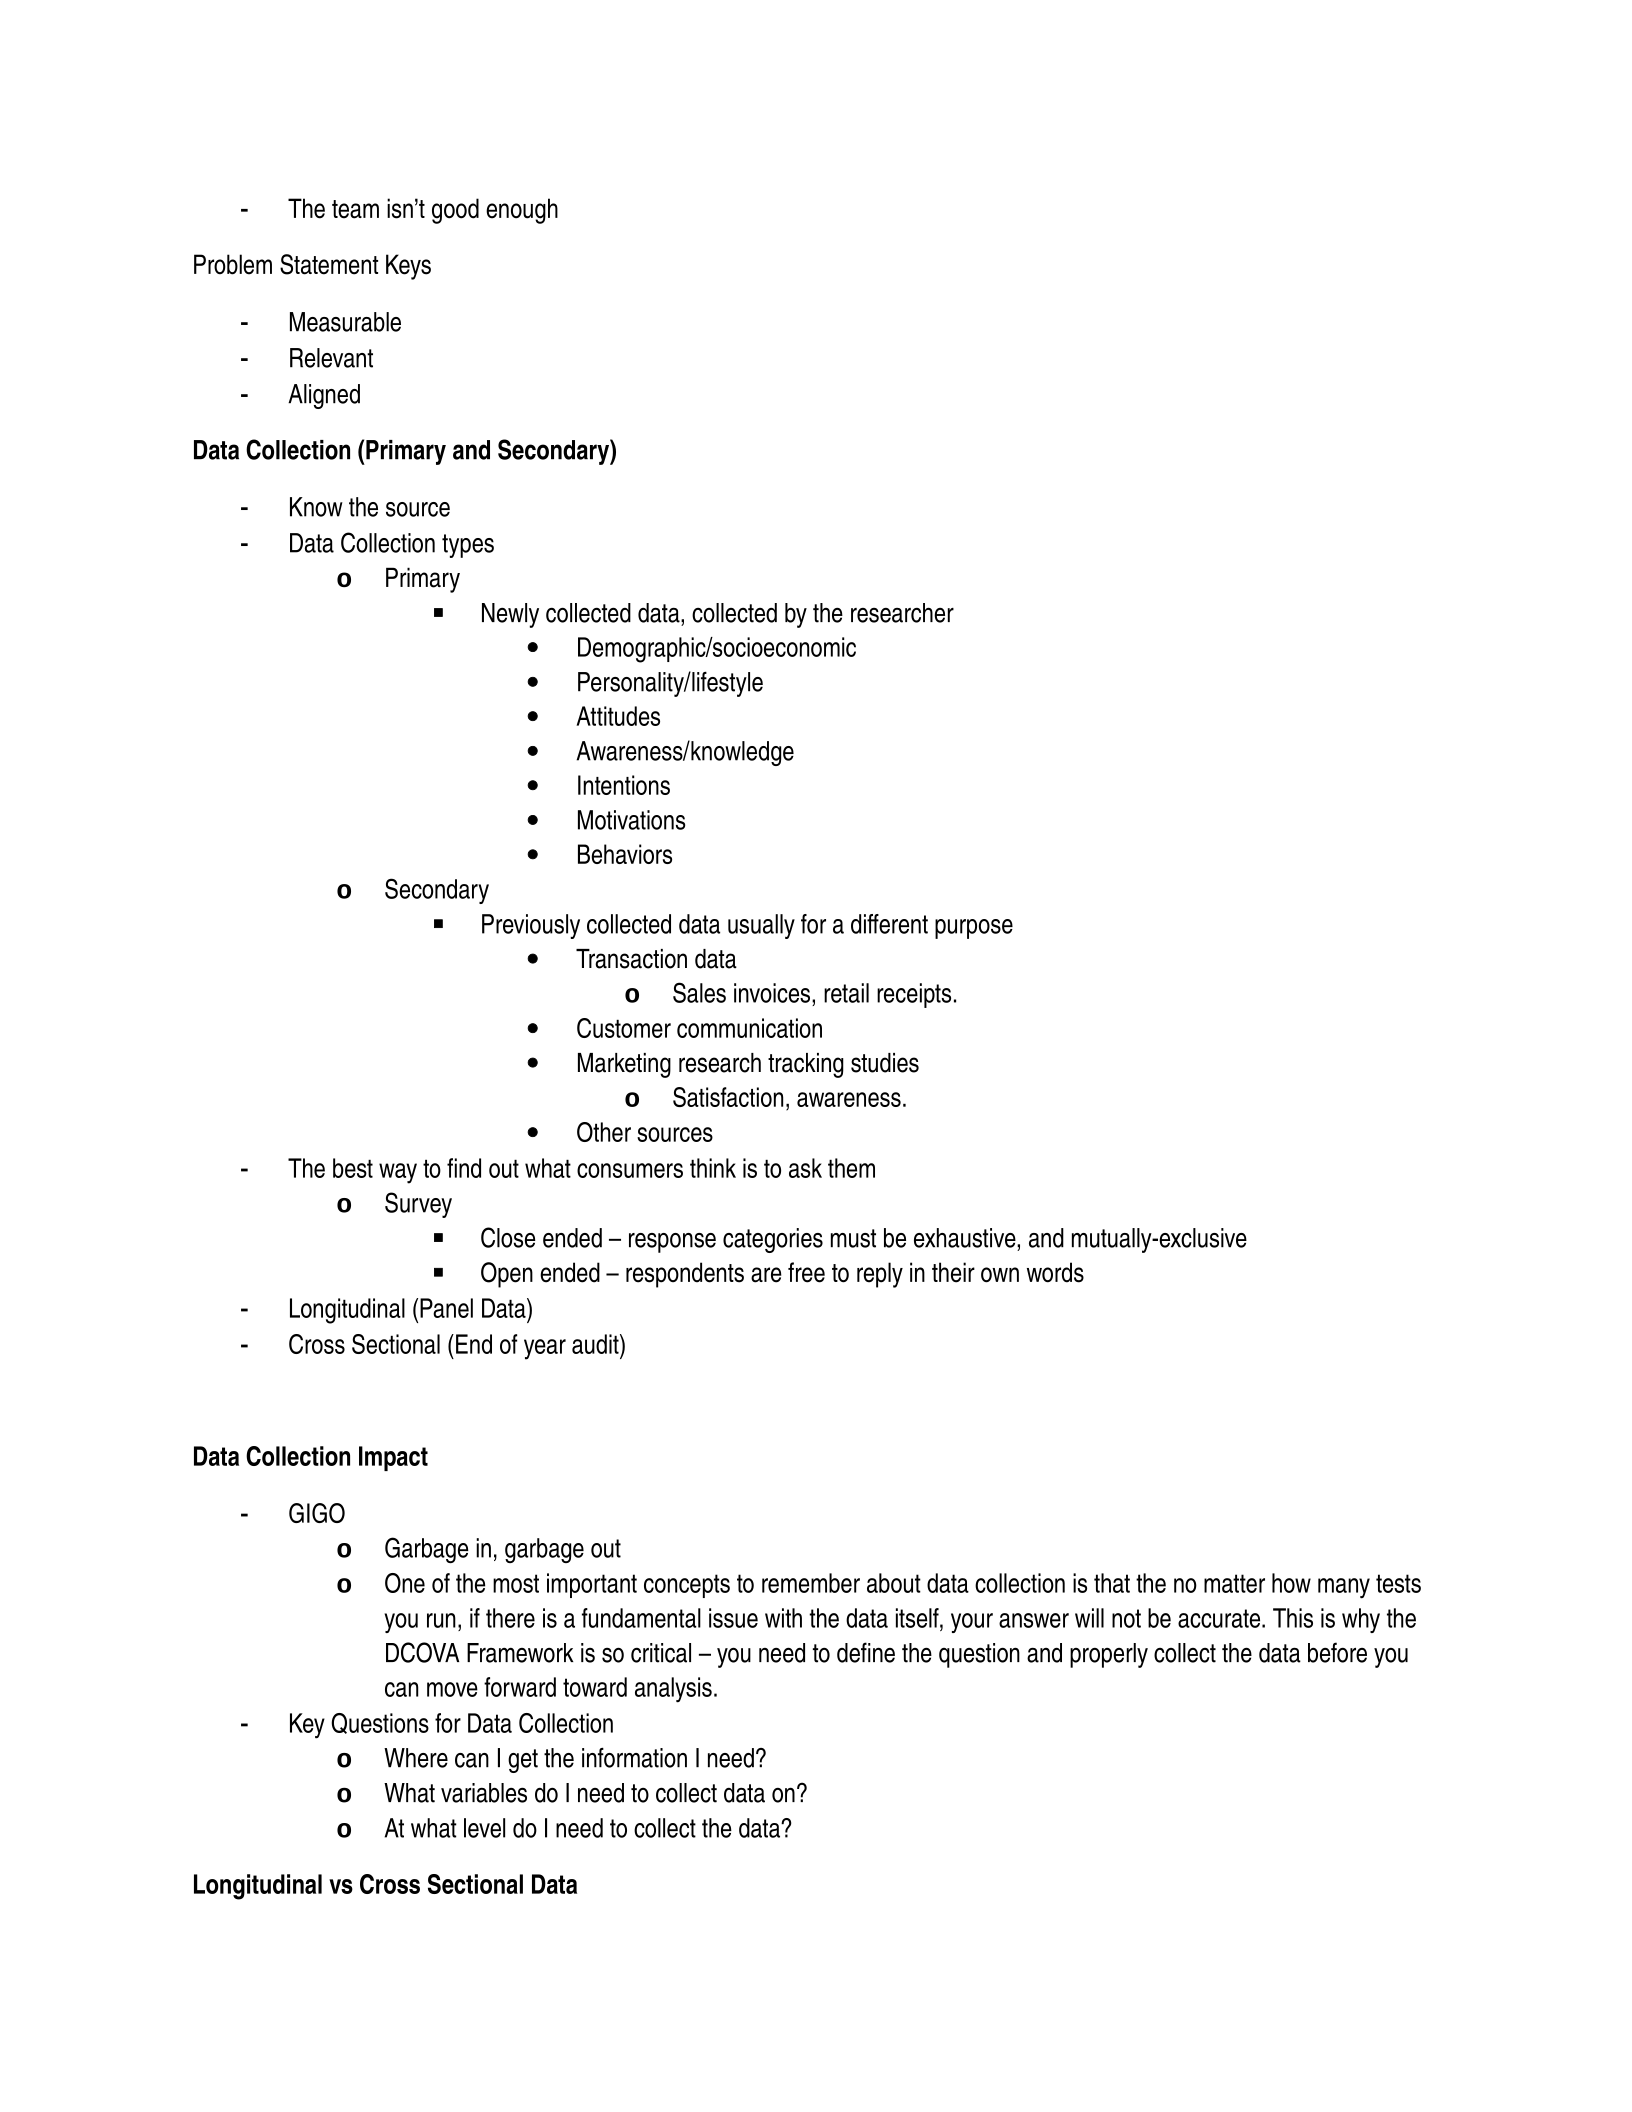
Develop Possible Research Problems
-A restatement of the decision problem in research terms
oInvestigate current customer satisfaction
oAssess target market perceptions
oDetermine target market awareness
-There will often be MANY research problems associated with a single manager’s decision problem
Why don’t students go to ASU football games?
-Seats aren’t attractive.
-Games start too late
-Weather is hot/cold
-Food options are bad
-The team isn’t good enough
Problem Statement Keys
-Measurable
-Relevant
-Aligned
Data Collection (Primary and Secondary)
-Know the source
-Data Collection types
oPrimary
Newly collected data, collected by the researcher
Demographic/socioeconomic
Personality/lifestyle
Attitudes
Awareness/knowledge
Intentions
Motivations
Behaviors
oSecondary
Previously collected data usually for a different purpose
Transaction data
oSales invoices, retail receipts.
Customer communication
Marketing research tracking studies
oSatisfaction, awareness.
Other sources
-The best way to find out what consumers think is to ask them
oSurvey
Close ended – response categories must be exhaustive, and mutually-exclusive
Open ended – respondents are free to reply in their own words
-Longitudinal (Panel Data)
-Cross Sectional (End of year audit)
Data Collection Impact
-GIGO
oGarbage in, garbage out
oOne of the most important concepts to remember about data collection is that the no matter how many tests
you run, if there is a fundamental issue with the data itself, your answer will not be accurate. This is why the
DCOVA Framework is so critical – you need to define the question and properly collect the data before you
can move forward toward analysis.
-Key Questions for Data Collection
oWhere can I get the information I need?
oWhat variables do I need to collect data on?
oAt what level do I need to collect the data?
Longitudinal vs Cross Sectional Data
-Longitudinal (or Panel Data) provides a level of granularity to the data, allowing you to recognize changes such as
customer behaviors or retention performance.
-Cross Sectional Data leads to more high-level conclusion, such as End of Year Store Audit Data.
Tidy Data
-Data that is easy for a computer to consume and is very different than data that a human consume
-One observation per row, one variable per column, one unit of observation per table
Excel Layout
-Select Adjacent Data
oshift + arrow
-Select & jump to next blank cell
octrl + shift + arrow
-Cycle Absolute/Relative Cell References ($)
oF4
-Undo
oCtrl + Z
-Redo
oCtrl + Y
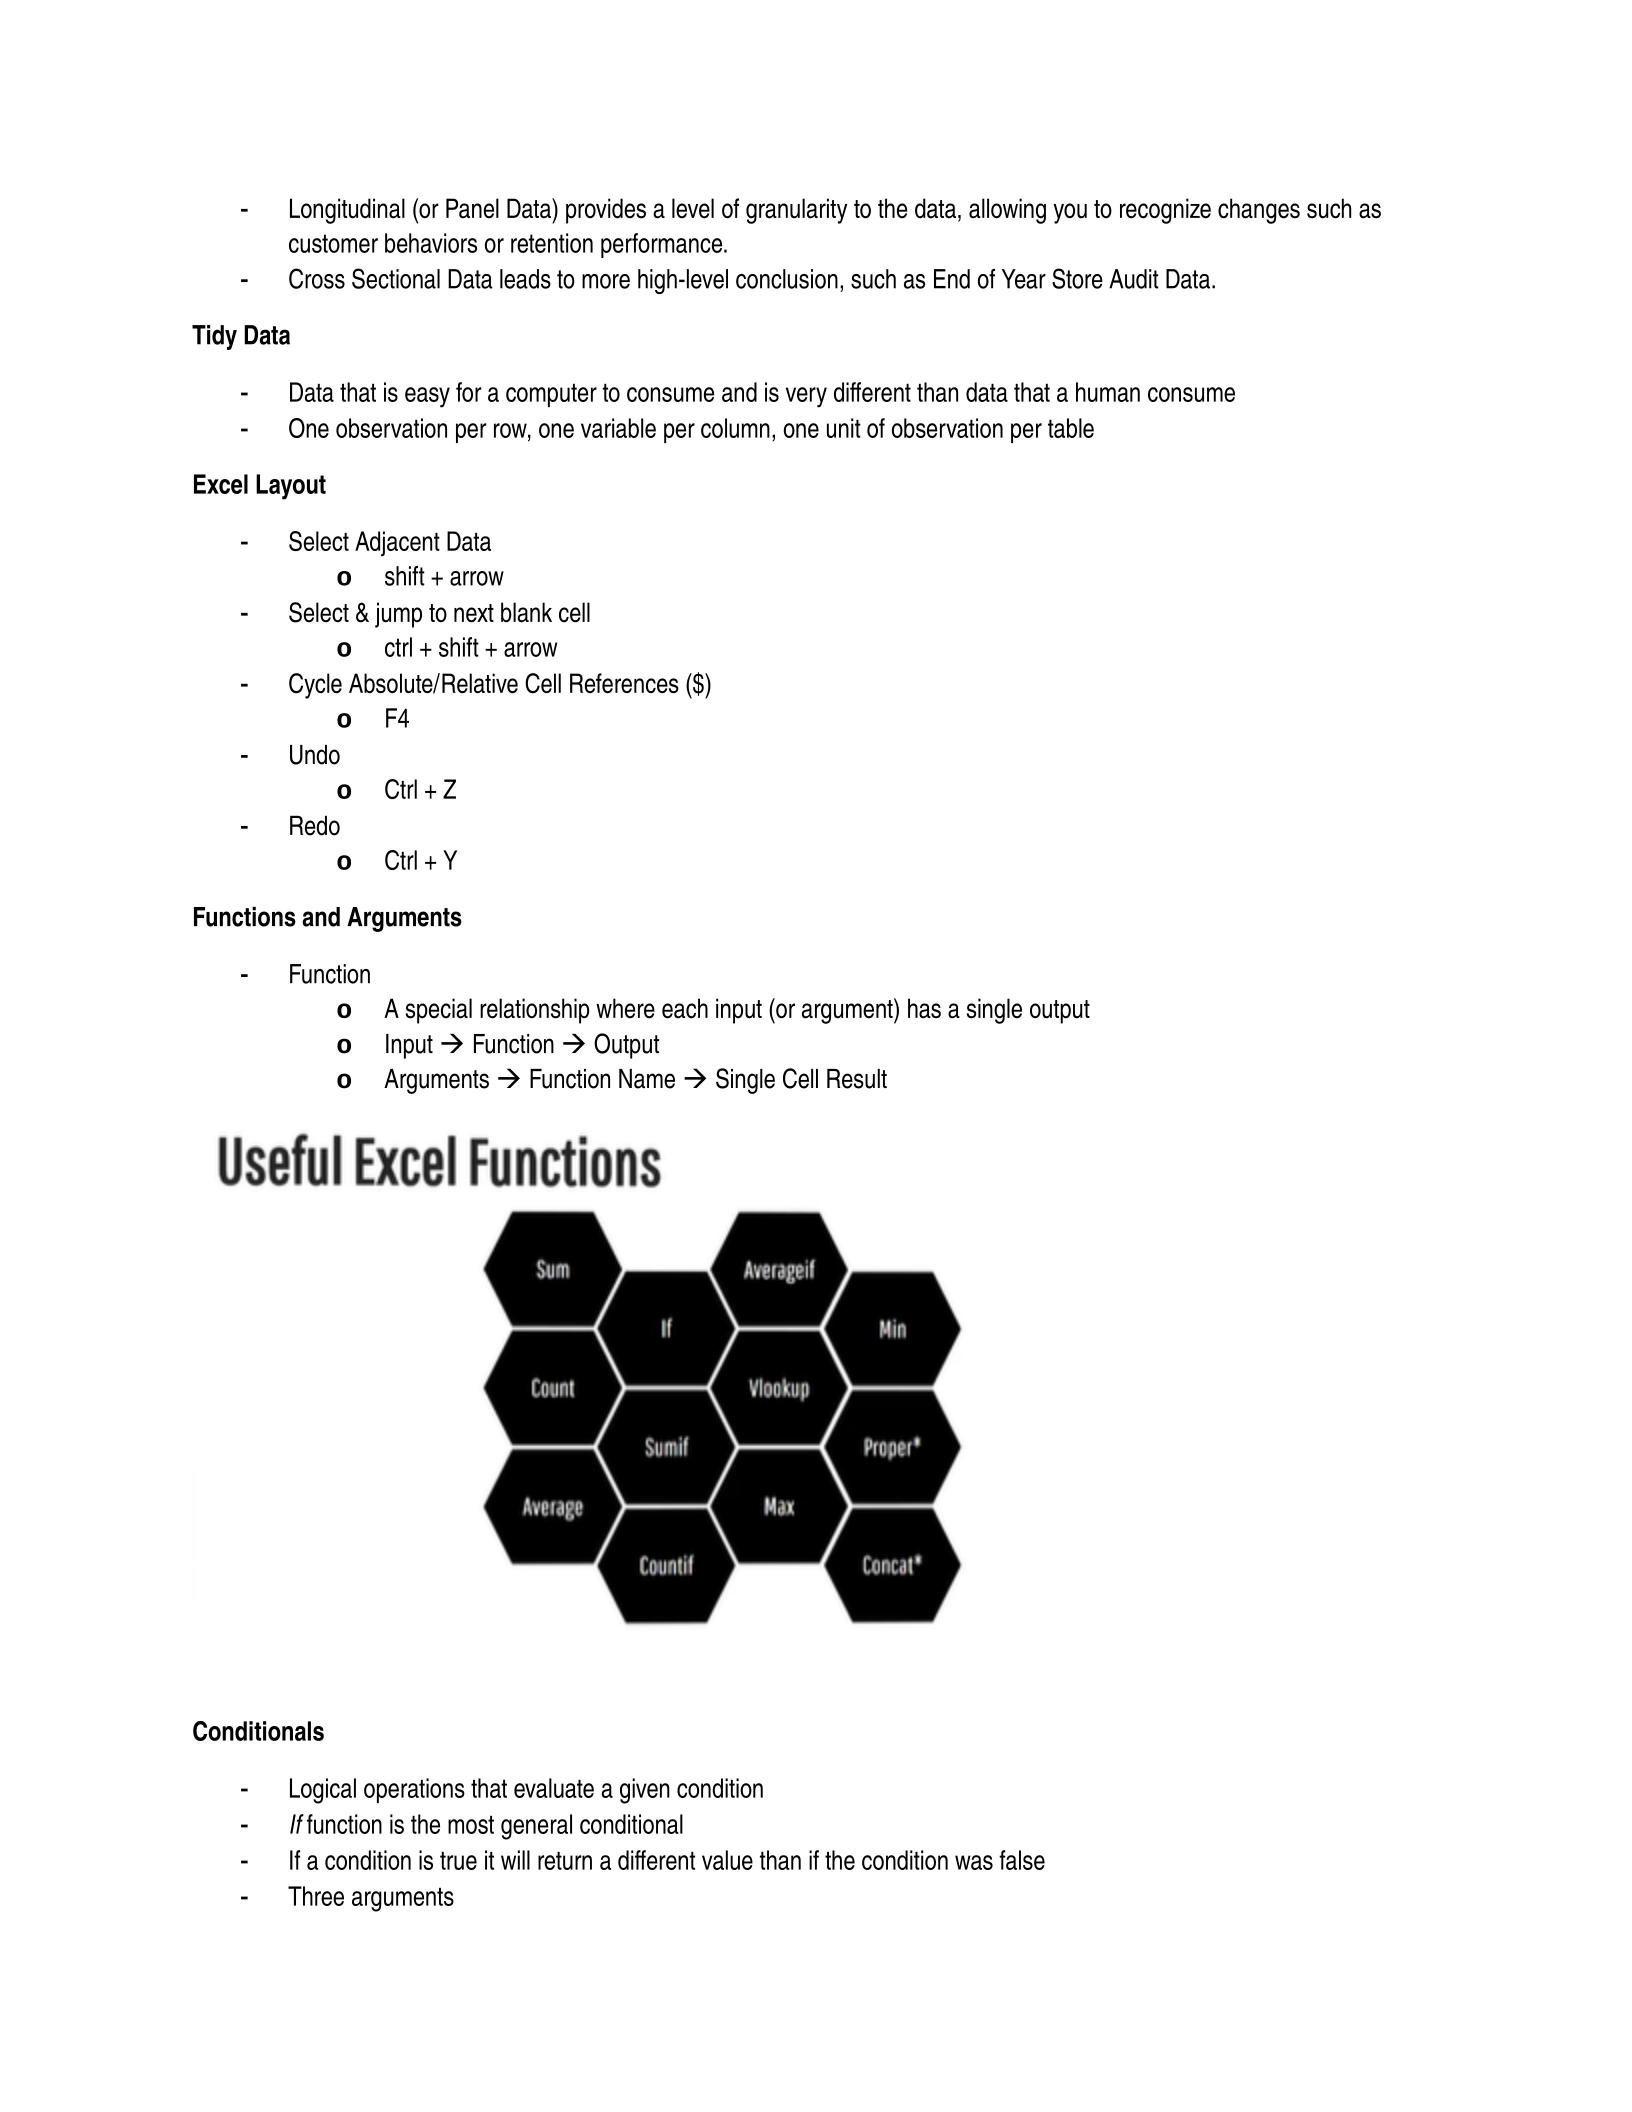
Functions and Arguments
-Function
oA special relationship where each input (or argument) has a single output
oInput Function Output
oArguments Function Name Single Cell Result
Conditionals
-Logical operations that evaluate a given condition
-If function is the most general conditional
-If a condition is true it will return a different value than if the condition was false
-Three arguments
oThe condition we want to test
oThe value of true
oThe value of false
-Conditional Sums
-Conditional Averages
-Conditional Counts
oGeneral concept that if the function passes the logical test we will apply sum, count or average
Conditional Formatting
-Enables to format a workbooks cells based off of given conditions
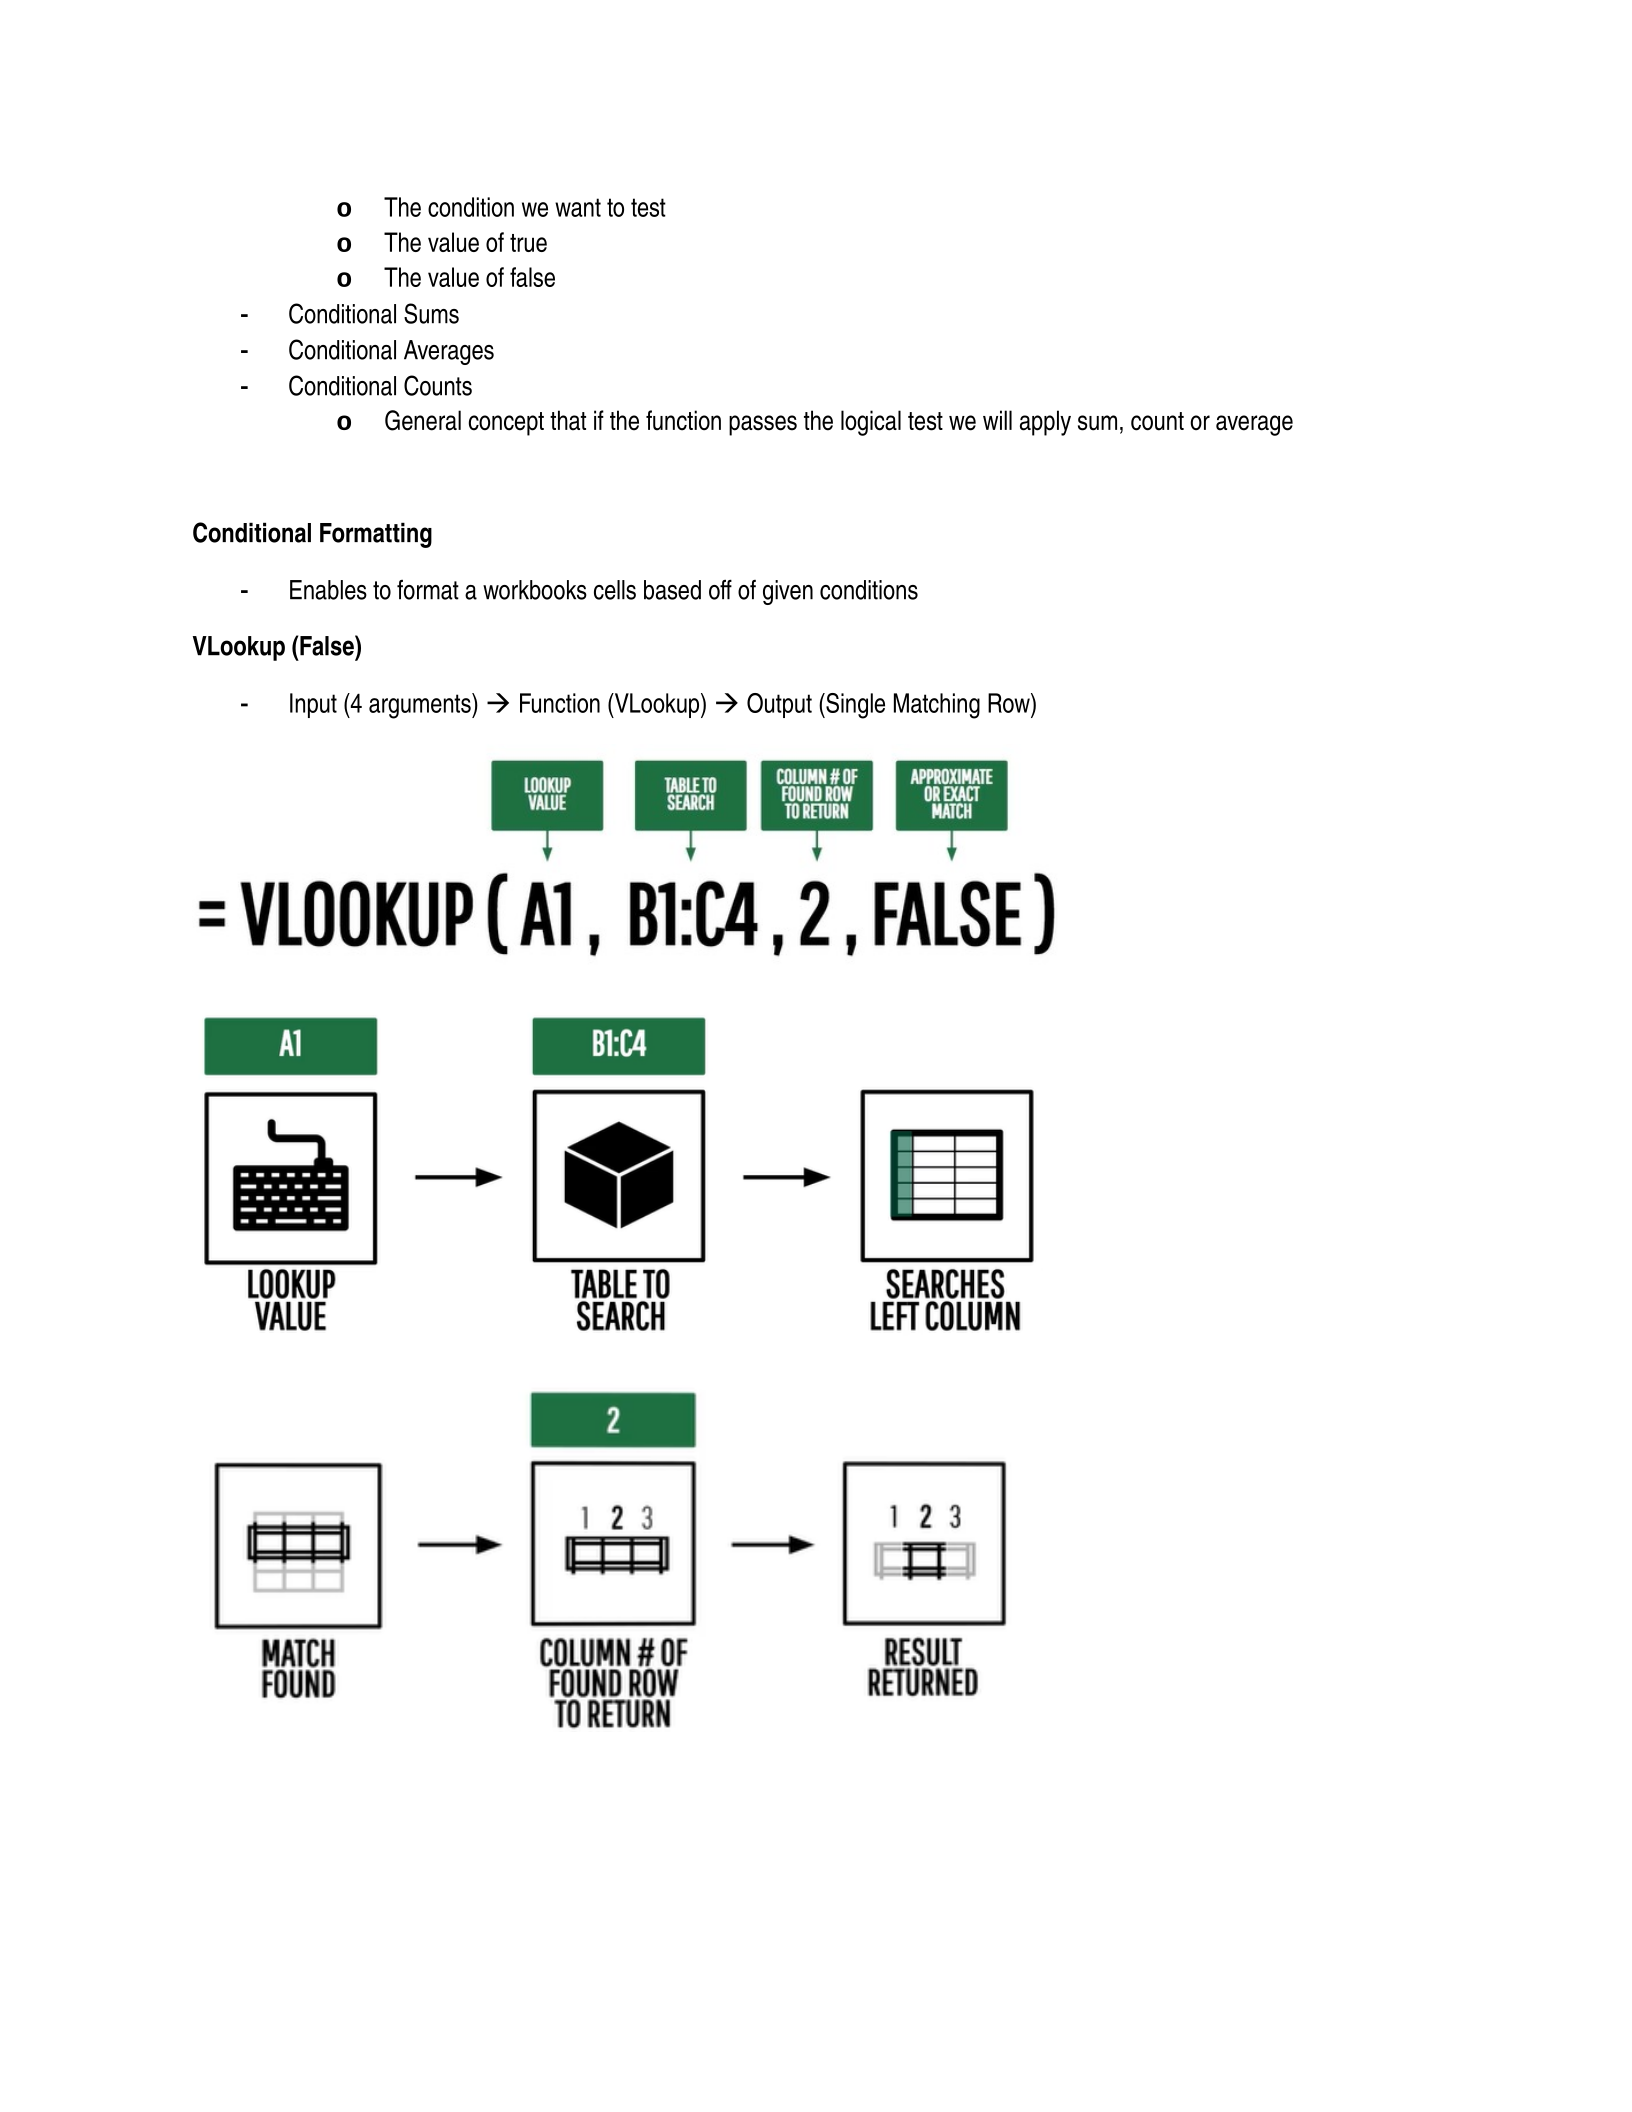
VLookup (False)
-Input (4 arguments) Function (VLookup) Output (Single Matching Row)
Powered by TCPDF (www.tcpdf.org)

