Week 8: Unsupervised Data Mining
Data Mining
- Identifying valid, novel, potentially useful and understandable
patterns in data stored in structured databases
- Process, nontrivial, valid, novel,
- Increase rev, reduce risk, cut cost
Data mining - confluence of multiple disciplines
- Quantify data
- MIS = provide and receive feedback
- Artificial intelligence = data driven knowledge/solution
- Database = data available in right format
- Mathematical modeling = implement theory better understanding
data
- Pattern recognition = structure in data using machine learning
algorithms
Methods
- Descriptive = general properties of data
- Identify patterns/relationships
- Not based on underlying theory (simple description of observed)
- EX: clustering, association, summarization
- Predictive = predict value of unknown using already known with other
set
- Accuracy and usability of results depend on level of data
analysis and quality of assumptions
- EX: classification, prediction, neural network
Classification analysis
-Unlabeled (unsupervised) = not labeled with outcome category
-Find cased that are similar to each other based on provided data
-Clustering helpful
-Labeled (supervised) = labeled with outcome
-Predict outcome with other variables
-Apply to new data
-Accuracy, limited to variables and categories in original data,
subjective
-EX: spam
Data mining usages/applications
- Insurance and Banking (fraud and risk), Retail (product placement,
coupon offers, Churn analysis), Federal Gov (IRS, Justice department,
Homeland security), Medicine, Pharmaceutical firms
Challenges
- Hard to interpret
- Data outliers and missing data
- Patterns found uninteresting and may have subjective interpretation
- Huge database could be a challenge
Examples
- Predict behaviors on network - see if person depressed
- Father and daughter shop at target with coupons
- Target tells father that daughter is pregnant based on her
buying patterns
Clustering
- Like goes with like
-Grouping objects in group (cluster) are similar or related and different
from objects not in group
- Not natural grouping (group of convenience)
- Greater similarity and greater difference = most distinct clustering
- Unsupervised learning
K-means clustering
- Step 1: randomly generate k-random points as initial cluster center
- Step 2: distance from each data point to the nearest cluster centroid
is computed
- Step 3: re-compute new cluster centroid (average)
- Repeat step 1 and 2 until assignment of points to the centroid is
stable
-High dimensional data = parallel plot show number of records and
profile of cluster across variables
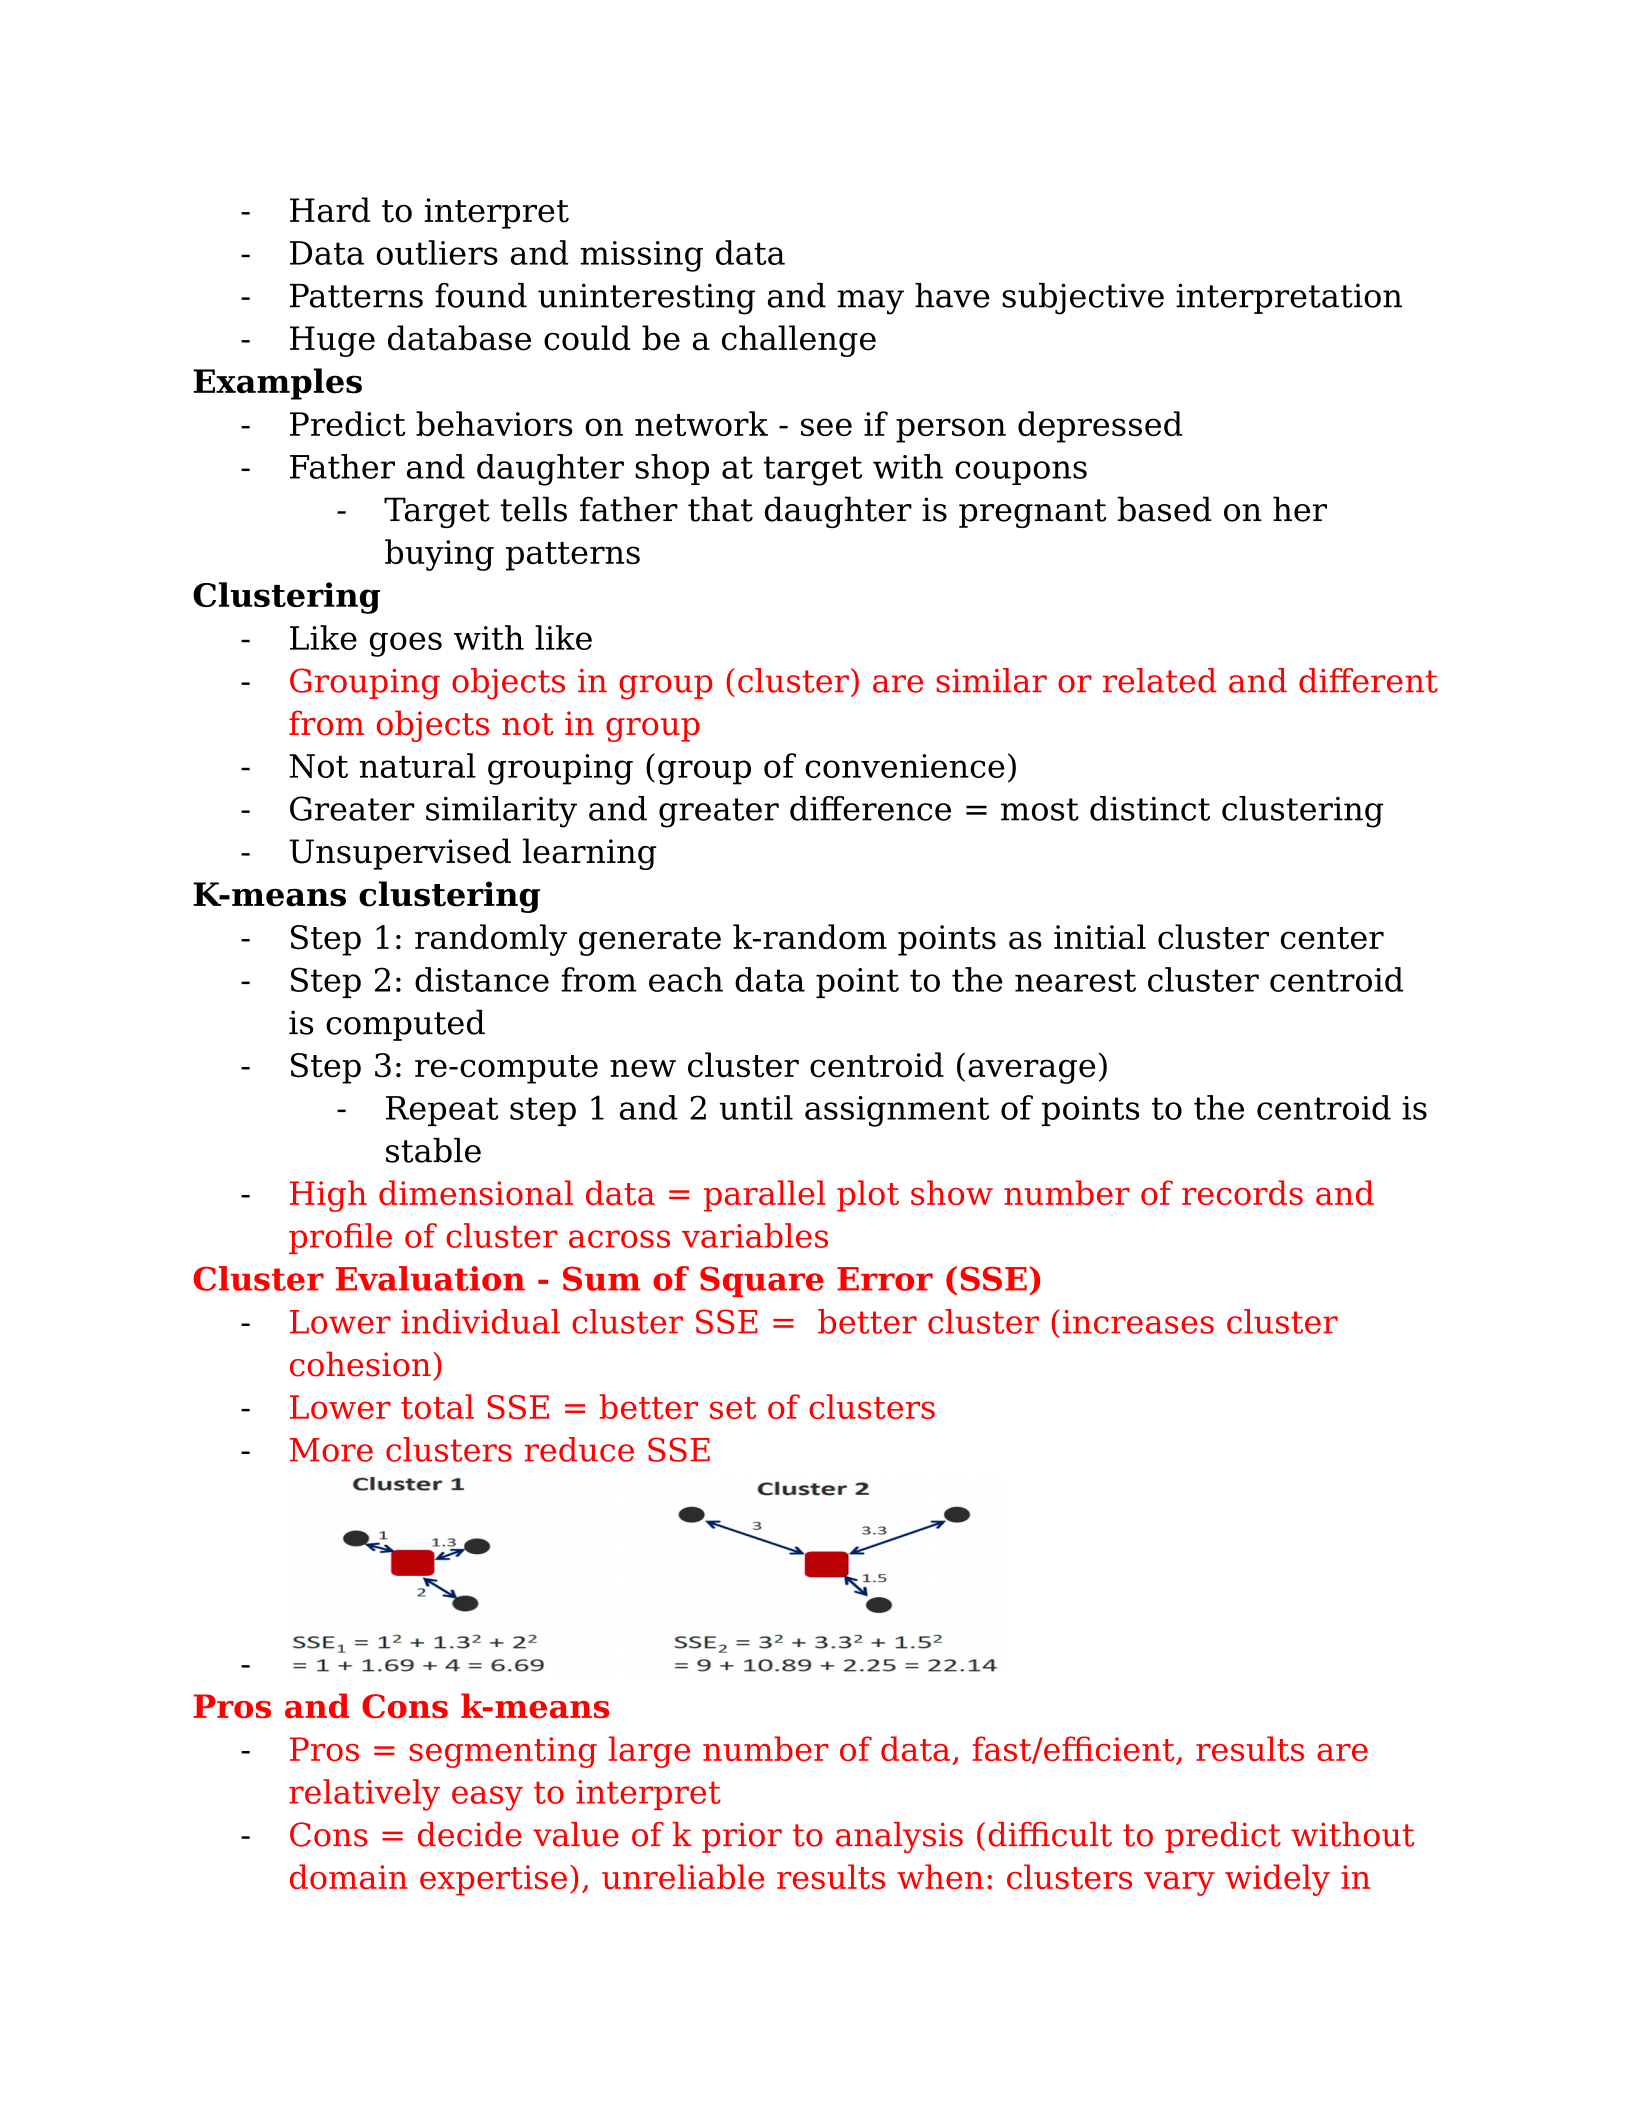
Cluster Evaluation - Sum of Square Error (SSE)
-Lower individual cluster SSE = better cluster (increases cluster
cohesion)
-Lower total SSE = better set of clusters
-More clusters reduce SSE
-
Pros and Cons k-means
-Pros = segmenting large number of data, fast/efficient, results are
relatively easy to interpret
-Cons = decide value of k prior to analysis (difficult to predict without
domain expertise), unreliable results when: clusters vary widely in
size, vary widely in density, not in rounded shapes, set has a lot of
outliers
Hierarchical clustering I
-Agglomerative = begin with n-clusters (each record its own cluster),
merge 2 closest records in distance into 1 cluster, join records into
clusters until one cluster is left
-Dendrogram illustrates process
-Stop joining cluster using some stopping criteria to get an optimal
solution
-Don't assume # of clusters, desired # of clusters from cutting
dendrogram, visual representation of different levels of clustering
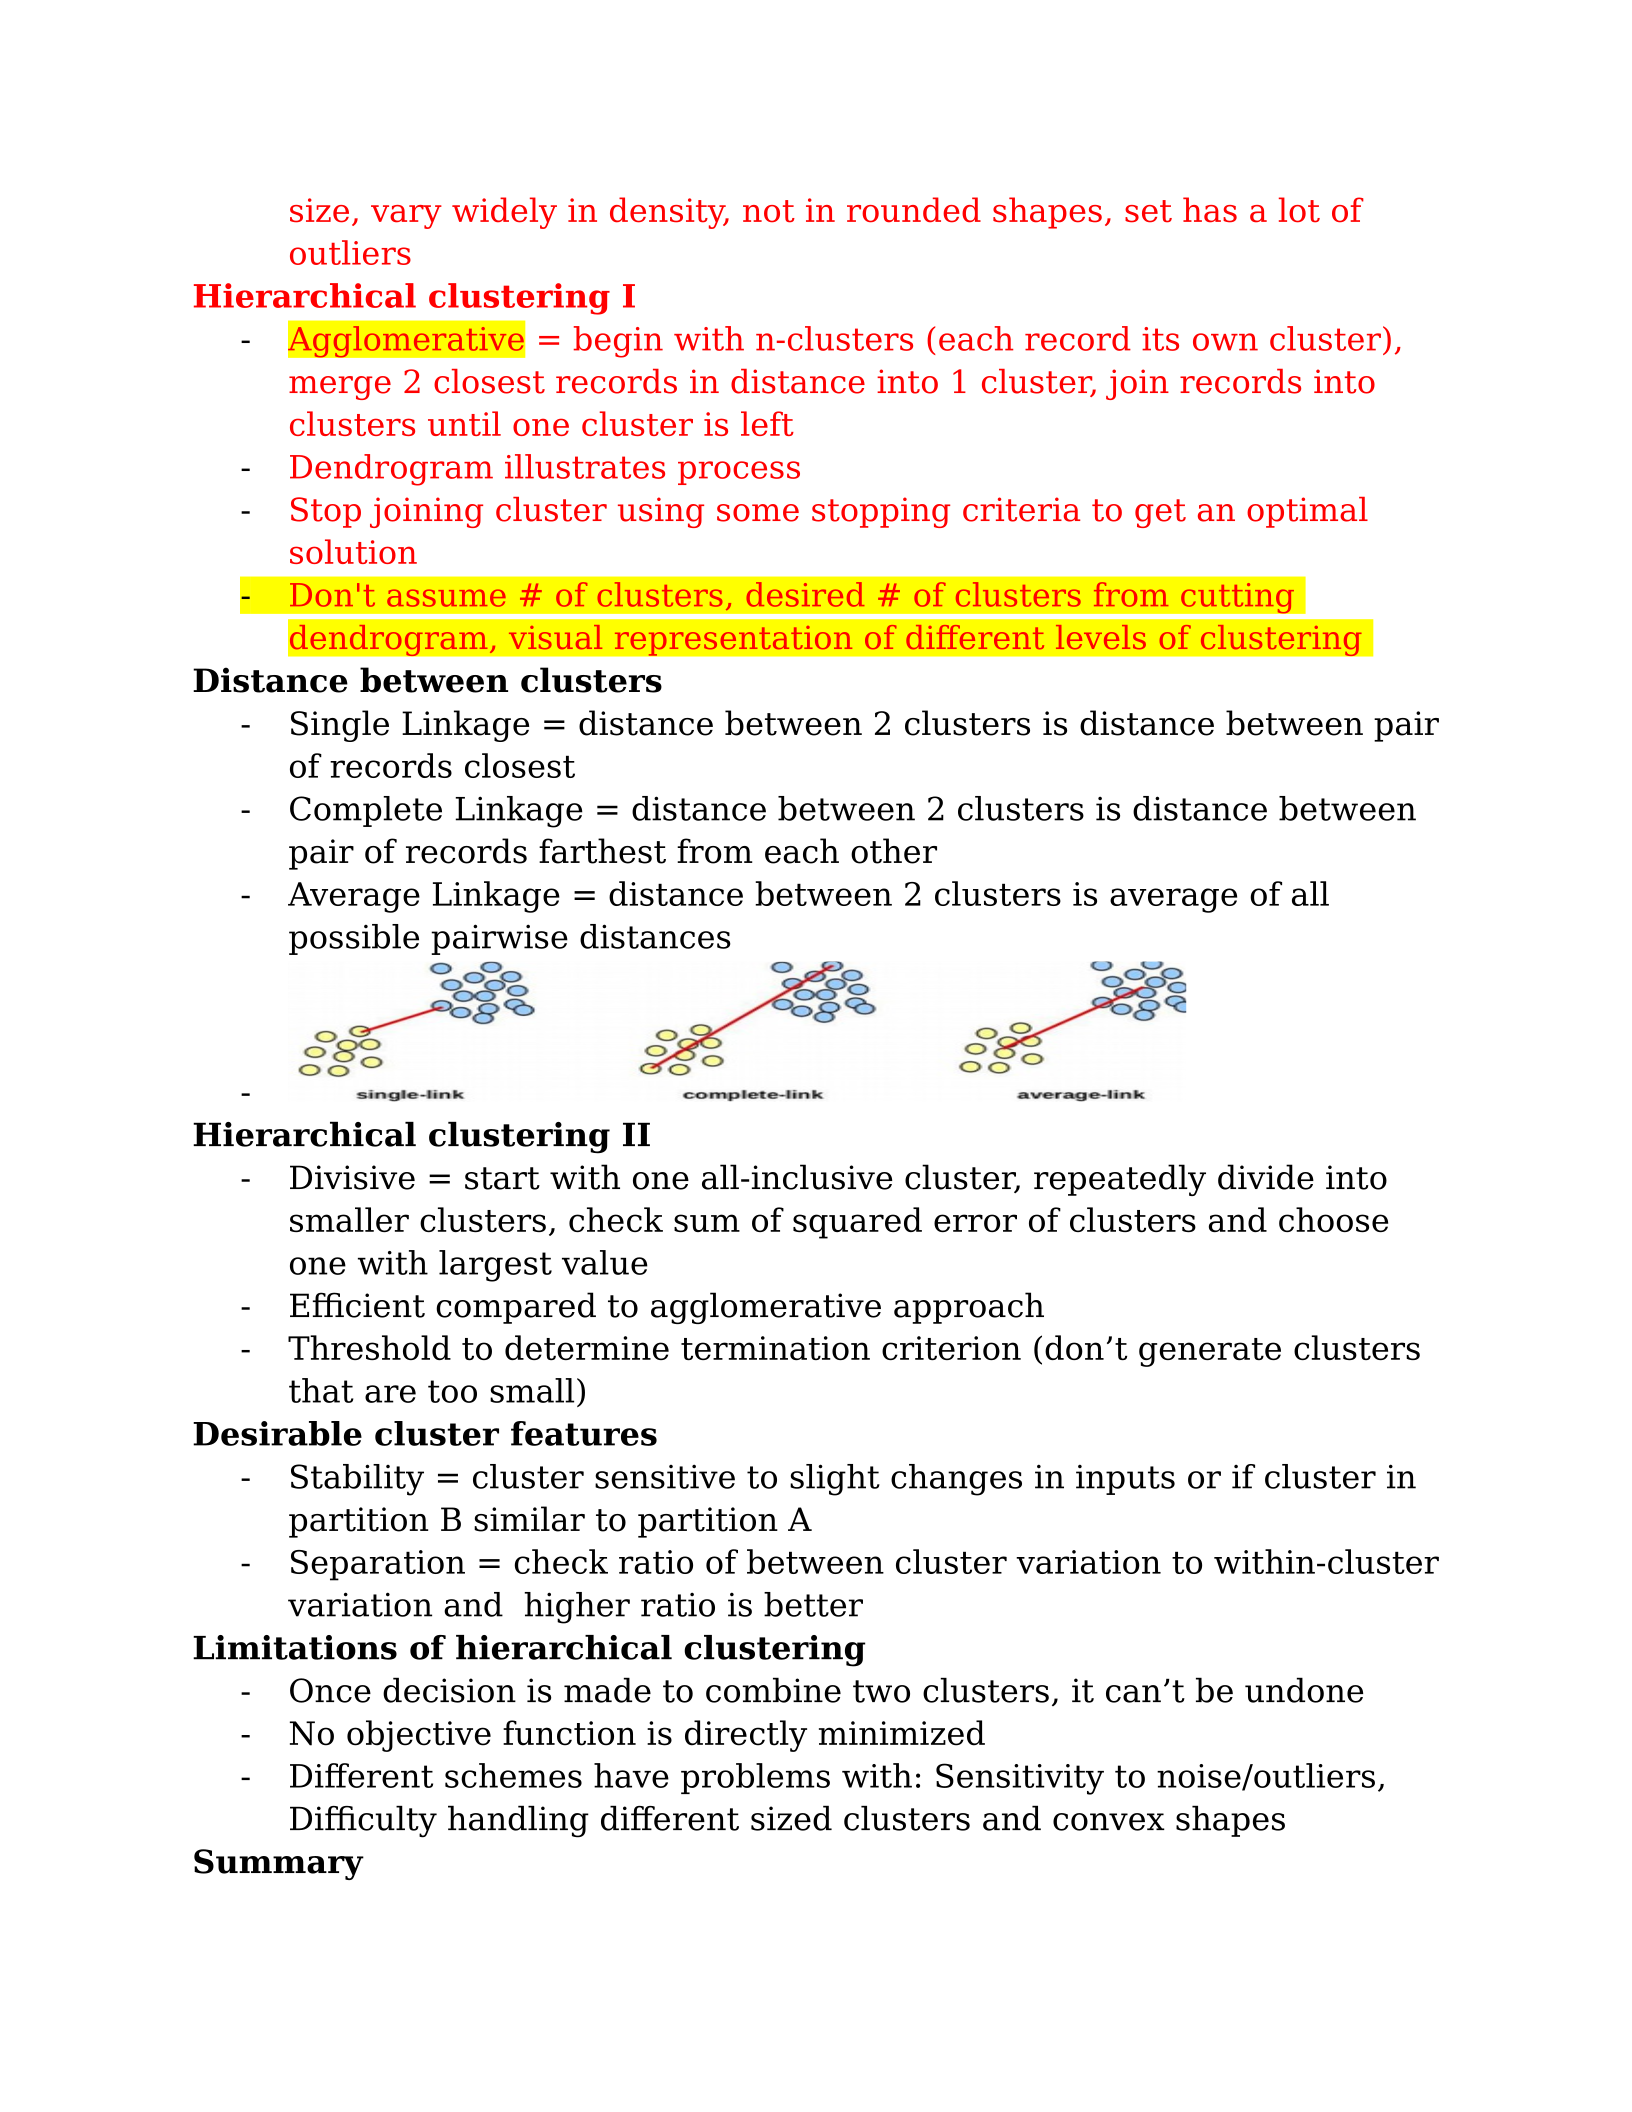
Distance between clusters
- Single Linkage = distance between 2 clusters is distance between pair
of records closest
- Complete Linkage = distance between 2 clusters is distance between
pair of records farthest from each other
- Average Linkage = distance between 2 clusters is average of all
possible pairwise distances
-
Hierarchical clustering II
- Divisive = start with one all-inclusive cluster, repeatedly divide into
smaller clusters, check sum of squared error of clusters and choose
one with largest value
- Efficient compared to agglomerative approach
- Threshold to determine termination criterion (don’t generate clusters
that are too small)
Desirable cluster features
- Stability = cluster sensitive to slight changes in inputs or if cluster in
partition B similar to partition A
- Separation = check ratio of between cluster variation to within-cluster
variation and higher ratio is better
Limitations of hierarchical clustering
- Once decision is made to combine two clusters, it can’t be undone
- No objective function is directly minimized
- Different schemes have problems with: Sensitivity to noise/outliers,
Difficulty handling different sized clusters and convex shapes
Summary
- Cluster = exploratory tool
- Useful only when it produces meaningful clusters
- Hierarchical clustering = visual representation of different levels of
clustering (small table of data; ~2000 rows)
- Non-hierarchical clustering = cheap and more stable (larger data
sets)
- Requires user to set k
Data compression
- Vector quantization
- Applied to image, sound and video data (data objects highly similar,
loss of info is acceptable, substantial reduction in data size is desired)
Customer segmentation
Variety of different customer characteristics
Geographical region, demographics, psychographics, and purchase
behavior
- Reduce cost of marketing, customer reach is more effective/efficient,
upselling, attract additional customers that match a certain group
criteria, communication, innovation
Collaborative filtering
- Recommendations only based on how user rated products in the past
- EX: Amazon, Netflix, LinkedIn, etc.
- Guess rate for user (u) for an item (i), find which cluster the user
belongs to
- Assign rate based on the cluster characteristics
- Score most popular for item (i) in the cluster
Dynamic trend detection
- Clustering stream data and detecting trends and patterns
- EX: network traffic, web click streams, video surveillance, sensor
networks
- Find host with similar usage pattern, video streams with similar
activities, web click with a certain web traffic behavior
- Data quality not important to answer a question
Applications of clustering
- Document classification, insurance fraud detection, IT alerts,
earthquake study
Questions
-Min # variables required for clustering =
-Quality of cluster measured by size of cluster vs distance between
cluster
-Single linkage, complete linkage, average linkage = distance between