


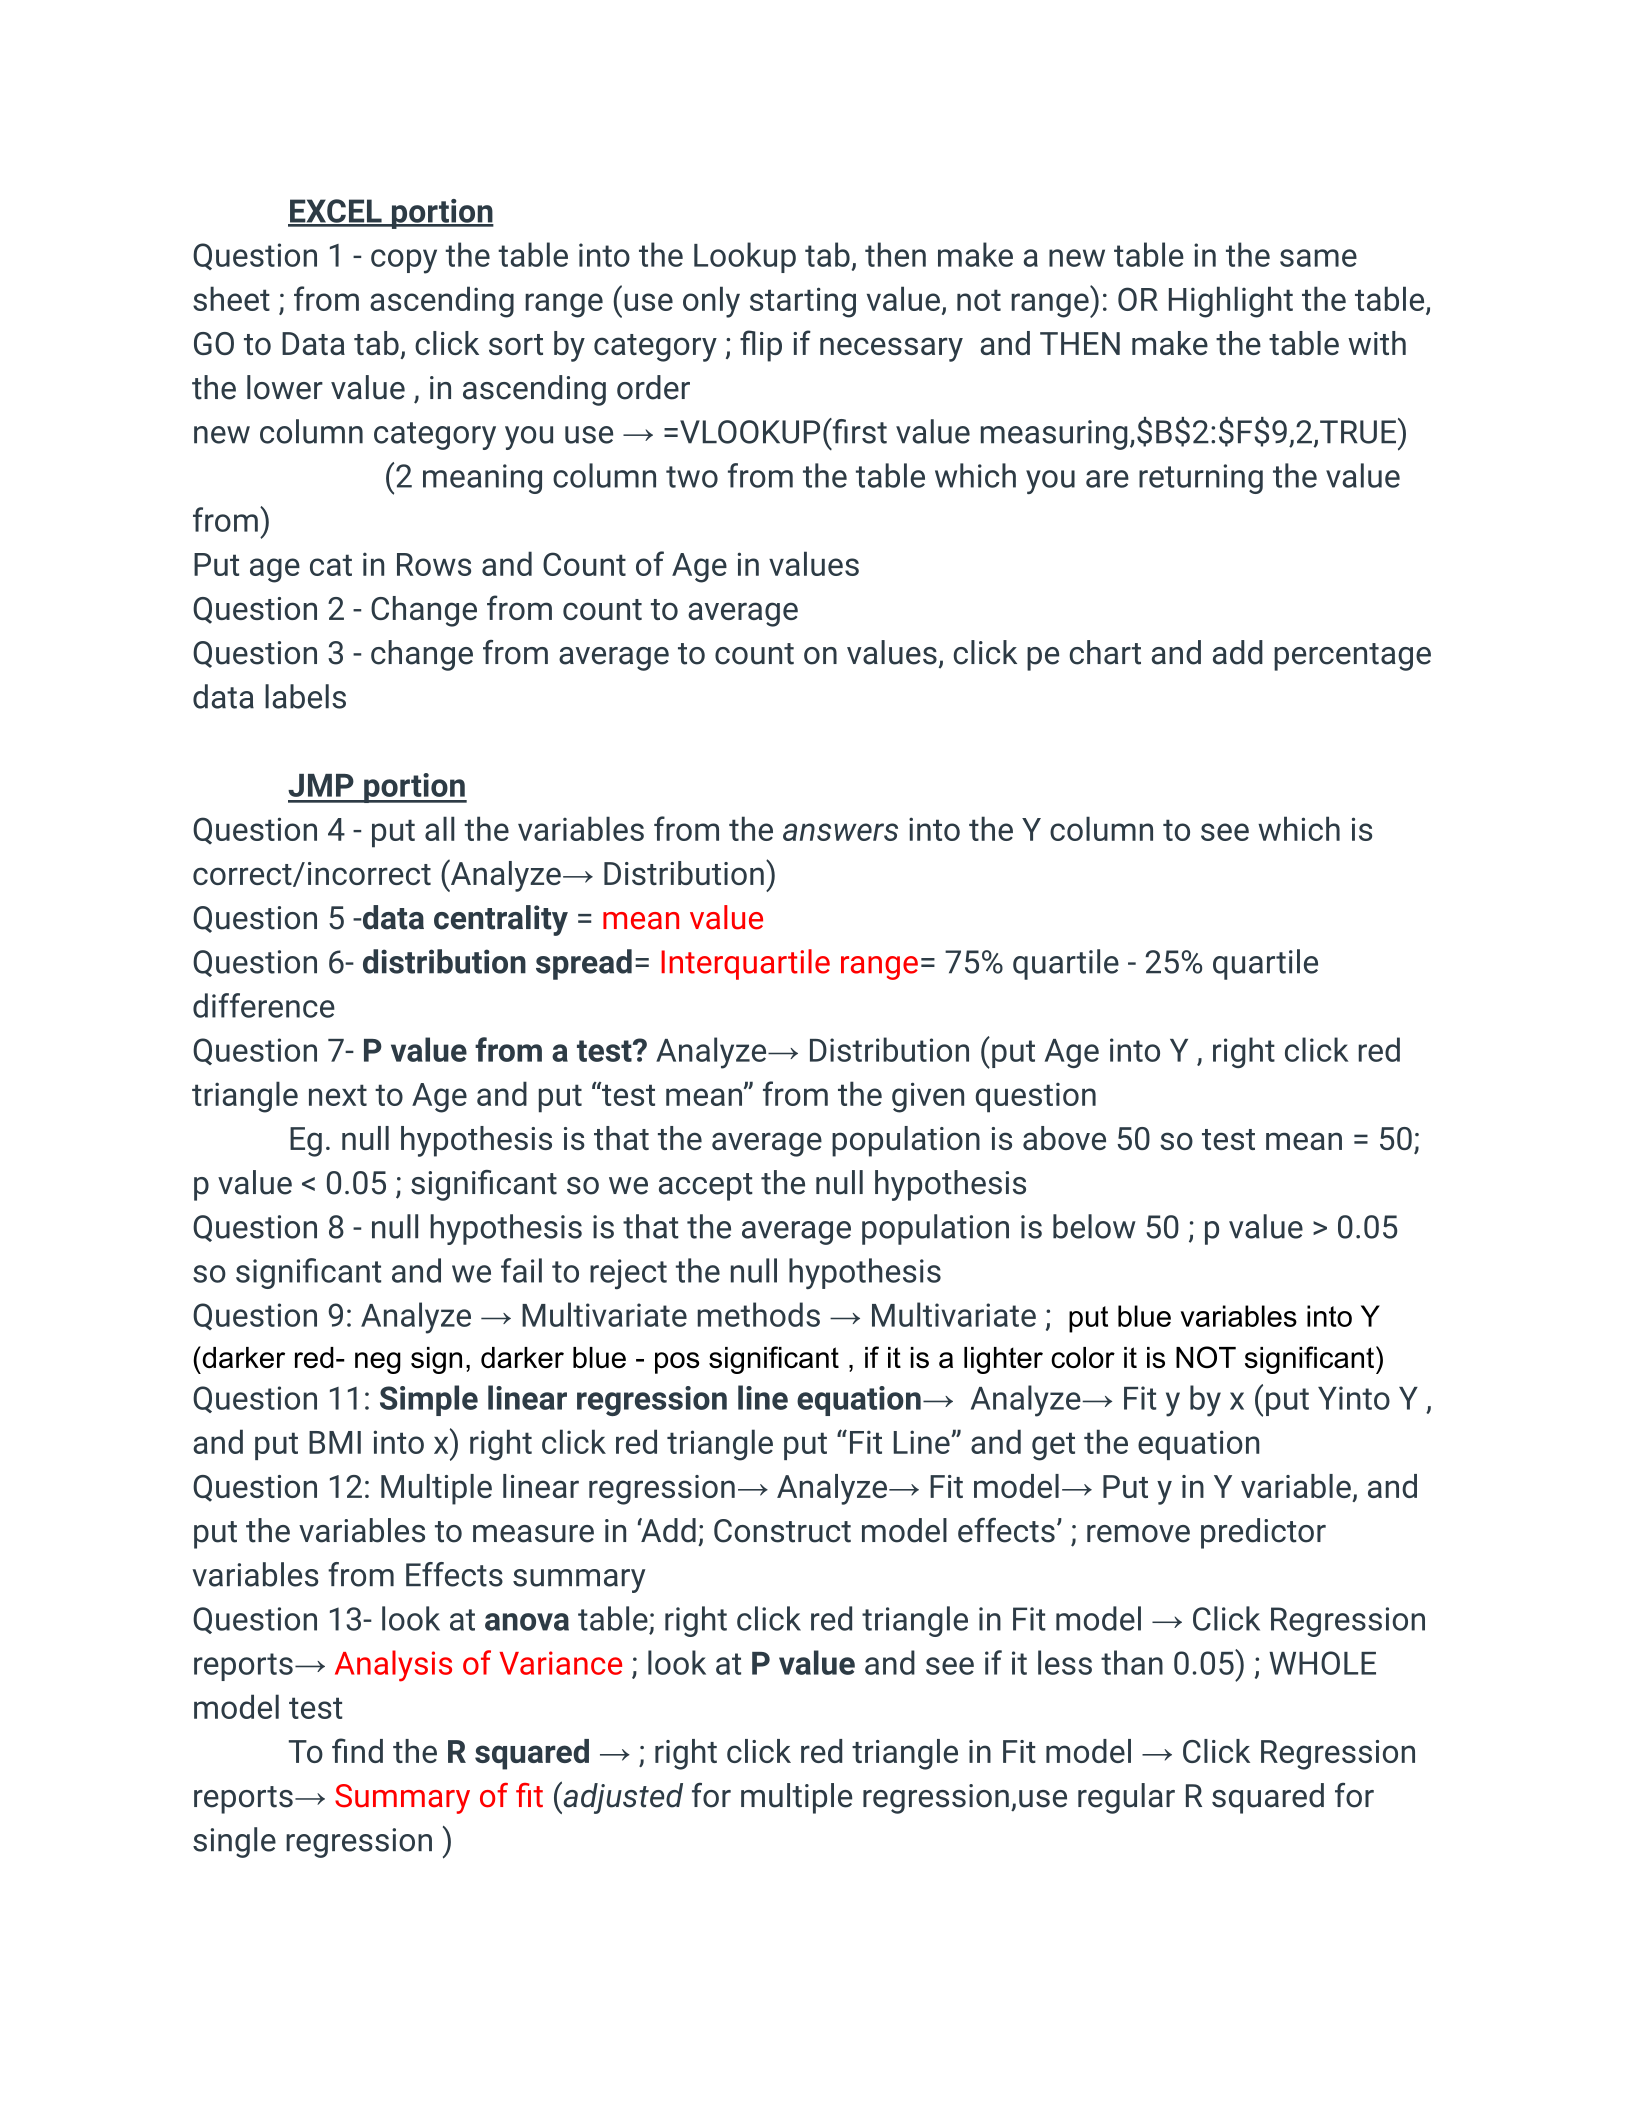
EXCEL portion
Question 1 - copy the table into the Lookup tab, then make a new table in the same
sheet ; from ascending range (use only starting value, not range): OR Highlight the table,
GO to Data tab, click sort by category ; flip if necessary and THEN make the table with
the lower value , in ascending order
new column category you use → =VLOOKUP(first value measuring,$B$2:$F$9,2,TRUE)
(2 meaning column two from the table which you are returning the value
from)
Put age cat in Rows and Count of Age in values
Question 2 - Change from count to average
Question 3 - change from average to count on values, click pe chart and add percentage
data labels
JMP portion
Question 4 - put all the variables from the answers into the Y column to see which is
correct/incorrect (Analyze→ Distribution)
Question 5 -data centrality =mean value
Question 6- distribution spread=Interquartile range= 75% quartile - 25% quartile
difference
Question 7- P value from a test? Analyze→ Distribution (put Age into Y , right click red
triangle next to Age and put “test mean” from the given question
Eg. null hypothesis is that the average population is above 50 so test mean = 50;
p value < 0.05 ; significant so we accept the null hypothesis
Question 8 - null hypothesis is that the average population is below 50 ; p value > 0.05
so significant and we fail to reject the null hypothesis
Question 9: Analyze → Multivariate methods → Multivariate ; put blue variables into Y
(darker red- neg sign, darker blue - pos significant , if it is a lighter color it is NOT significant)
Question 11: Simple linear regression line equation→Analyze→ Fit y by x (put Yinto Y ,
and put BMI into x) right click red triangle put “Fit Line” and get the equation
Question 12: Multiple linear regression→ Analyze→ Fit model→ Put y in Y variable, and
put the variables to measure in ‘Add; Construct model effects’ ; remove predictor
variables from Effects summary
Question 13- look at anova table; right click red triangle in Fit model → Click Regression
reports→Analysis of Variance ; look at P value and see if it less than 0.05) ; WHOLE
model test
To find the R squared → ; right click red triangle in Fit model → Click Regression
reports→Summary of fit (adjusted for multiple regression,use regular R squared for
single regression )
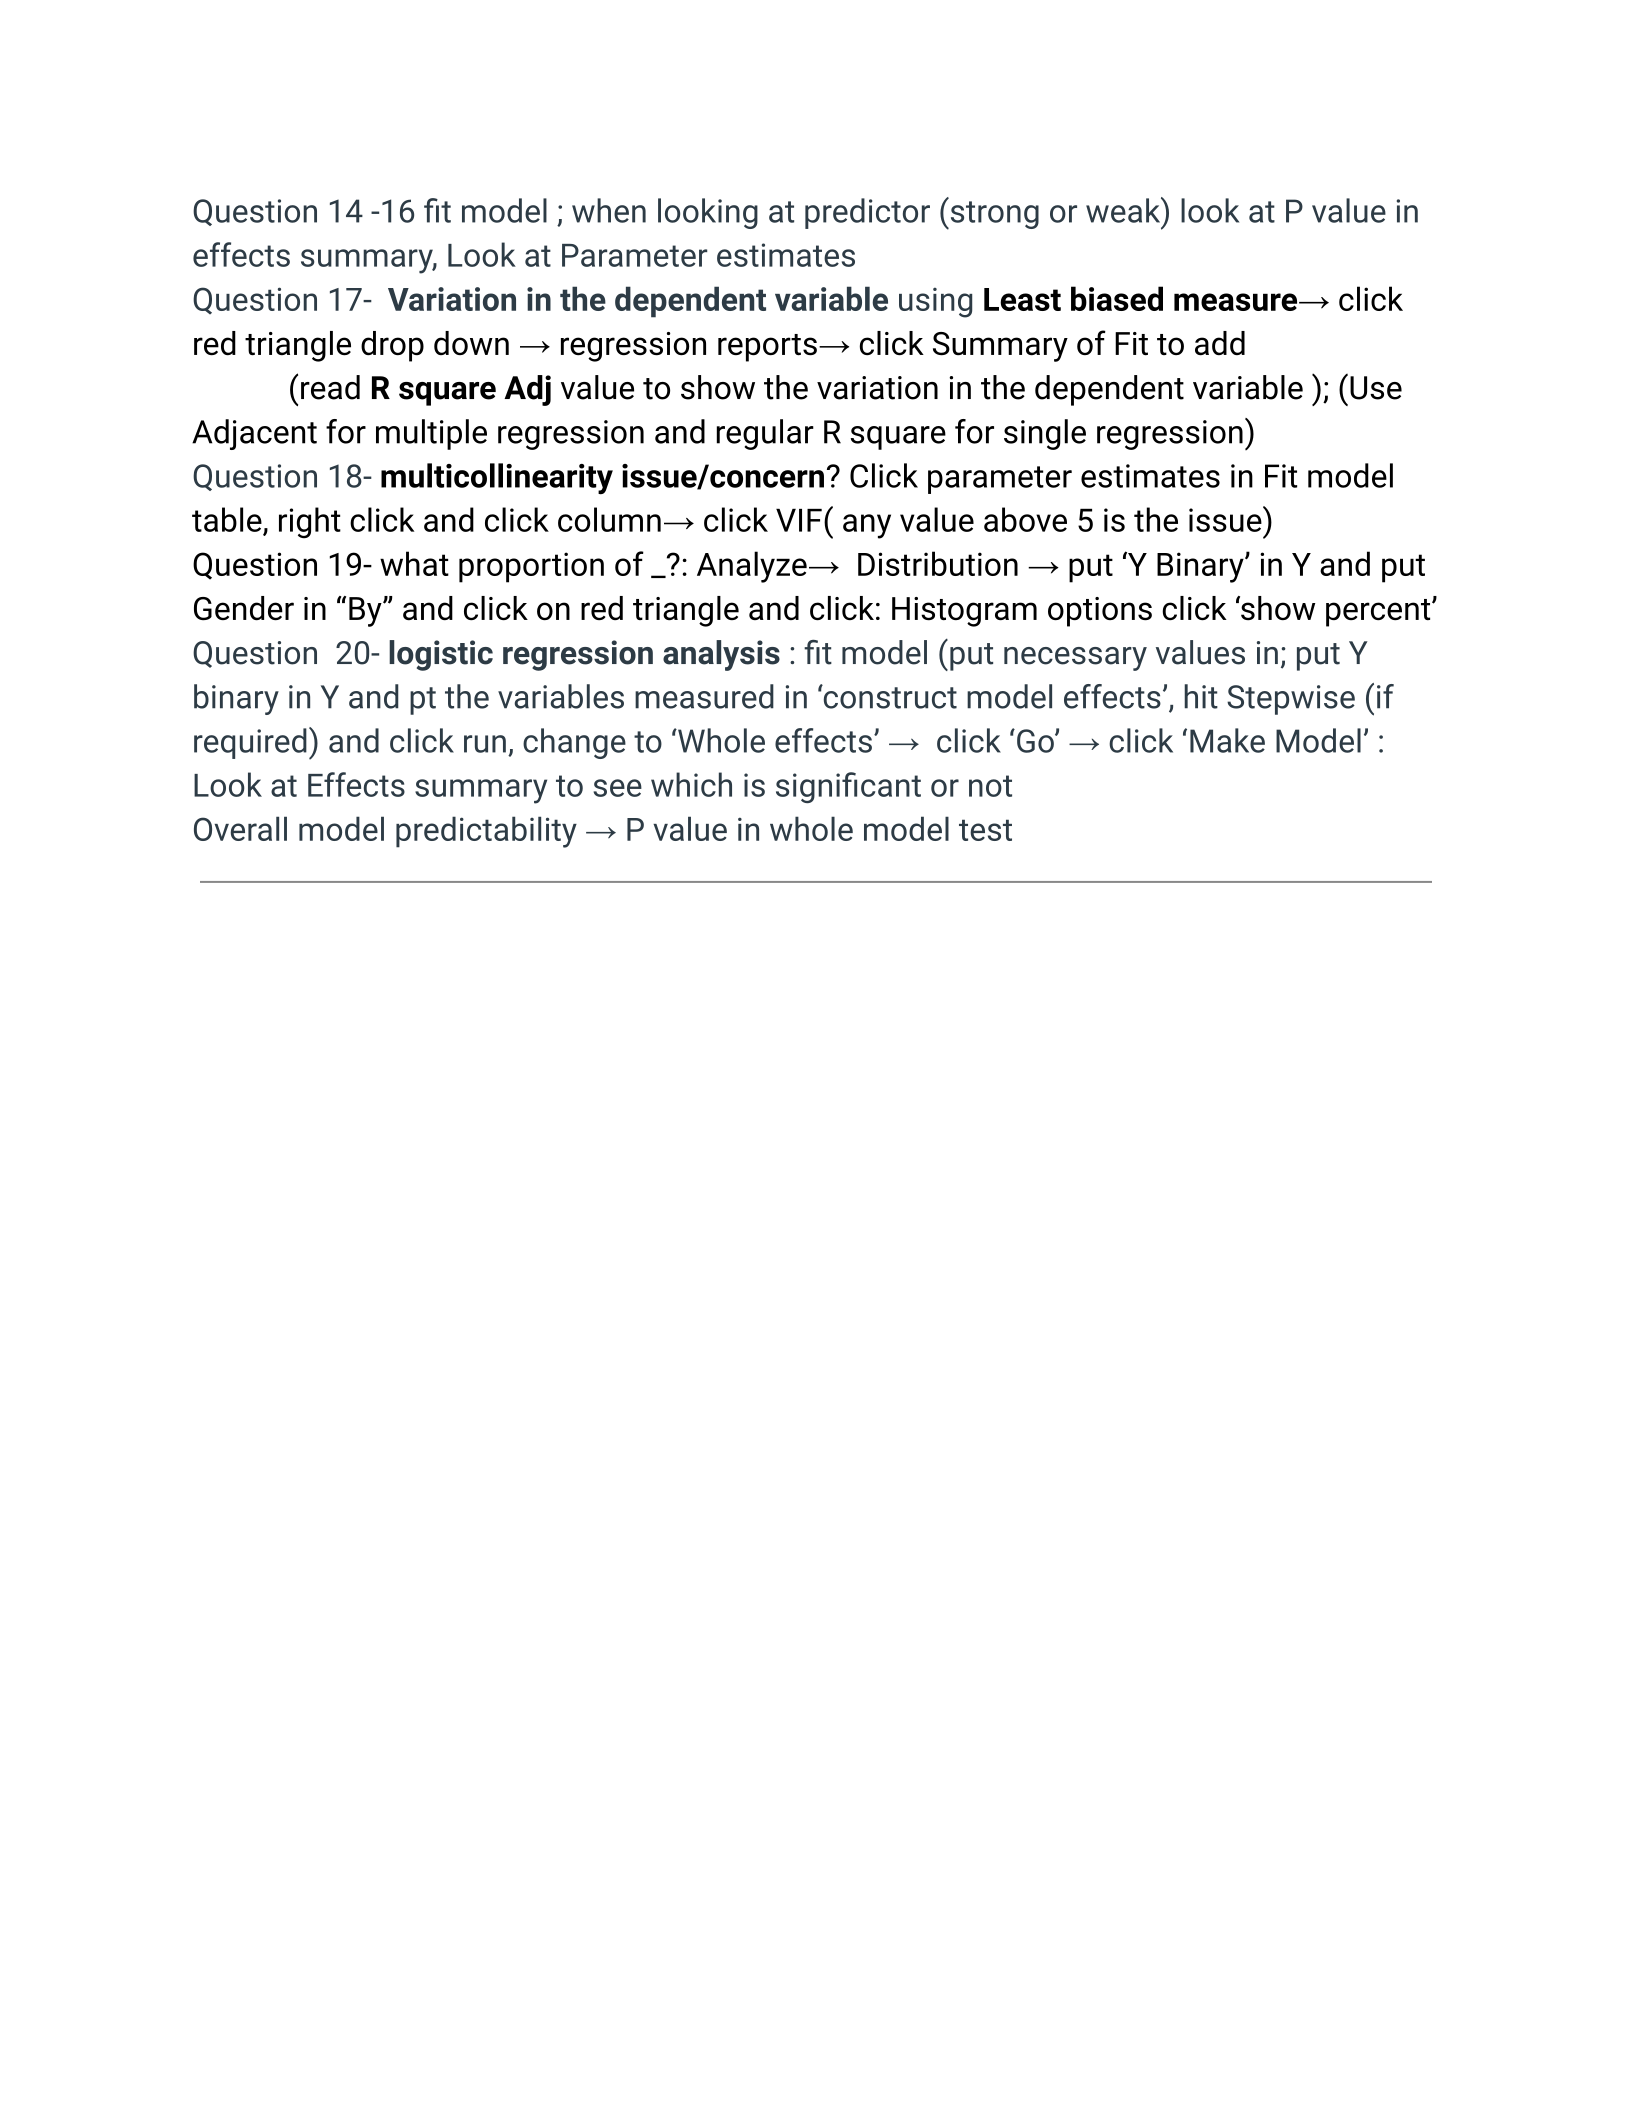
Question 14 -16 fit model ; when looking at predictor (strong or weak) look at P value in
effects summary, Look at Parameter estimates
Question 17- Variation in the dependent variable using Least biased measure→ click
red triangle drop down → regression reports→ click Summary of Fit to add
(read R square Adj value to show the variation in the dependent variable ); (Use
Adjacent for multiple regression and regular R square for single regression)
Question 18- multicollinearity issue/concern? Click parameter estimates in Fit model
table, right click and click column→ click VIF( any value above 5 is the issue)
Question 19- what proportion of _?: Analyze→ Distribution → put ‘Y Binary’ in Y and put
Gender in “By” and click on red triangle and click: Histogram options click ‘show percent’
Question 20- logistic regression analysis : fit model (put necessary values in; put Y
binary in Y and pt the variables measured in ‘construct model effects’, hit Stepwise (if
required) and click run, change to ‘Whole effects’ → click ‘Go’ → click ‘Make Model’ :
Look at Effects summary to see which is significant or not
Overall model predictability → P value in whole model test
Powered by TCPDF (www.tcpdf.org)

