


1
Chapter 1: Introduction
Mathematics provides the necessary foundation for many science, technology,
engineering, and mathematics (STEM) careers and is essential to many careers outside of STEM
(Wang, Ye & Degol, 2017). The United States Bureau of Labor Statistics (BLS) (2017) reported
that occupations in the mathematical sciences are projected to grow the fastest during the 10-year
period from 2014 to 2024. Across the board in mathematics and other STEM related fields, the
BLS reported that employment in these occupations grew by more double the rate of non-STEM
occupations over a six-year period from May of 2009 to May of 2015 (2017). With the increased
demand in careers that involve mathematics, having a strong understanding of mathematics is
critical. However, in colleges and universities across the United States, as many as 38% of
students fail a first semester college calculus course (Bressoud, 2015). There are multiple factors
which may account for the student struggles in first-year math courses such as calculus; one
possible factor might be lack of conceptual understanding in prerequisite skills needed to do well
in calculus. Even students who considered themselves “good” at calculus concepts because they
are able to define calculus terms, struggle to make any conceptual connections between general
calculus concepts and any other mathematical concept (Petterson & Scheja, 2008).
Statement of the Problem
The purpose of this study is to describe the conceptual mathematical understanding of
students in a first semester calculus course at a large community college in the Southwest area of
the United States. This will help to refine a possible list of prerequisite concepts and skills
needed for students to succeed in a calculus course. A first semester course in calculus is being
used as this is a foundation course for all other higher level mathematics courses, courses in
other STEM fields, and in other math intensive non-STEM fields such as economics and

2
business. The BLS data (2017) shows that demand for people with excellent mathematical skills
is increasing.
For the purpose of this research, conceptual understanding is knowledge that is connected
to other pieces of knowledge, and the possessor of this knowledge is aware and understands the
connection (Mahir, 2009). In other words, conceptual knowledge must be learned with meaning
(Hiebert & Lefevre, 1986). Procedural understanding is knowing the formal language, rules,
algorithms, and procedures used to solve mathematical tasks (Mahir, 2009; Hiebert & Lefevre,
1986). Conceptual knowledge is extremely important because it represents the ability to make
connections among various representations of the procedural steps used to arrive at a solution
(Byrnes, 1992). As a field of study that heavily relies on knowledge learned in prior years,
having a strong conceptual knowledge of mathematics is necessary because conceptual
knowledge provides an understanding of the principles and relations between pieces of
knowledge (Jukić & Dahl, 2012). In mathematics, particularly calculus, students are required to
have an understanding of different branches of mathematics such as algebra, geometry, and
trigonometry and be able to relate them together to understand calculus concepts, perform
calculus procedures, and connect the mathematical concepts from calculus to prior math
knowledge.
Rationale for the Study
There is a need for this study because technology has drastically changed the way we use
mathematics on a daily basis, however the way in which mathematics is taught in the classroom
has not changed much as many educators still believe that mathematics is simply a set of
procedures with the goal of teaching students to properly execute those procedures (Stigler &
Hiebert, 1997). As a result, traditional calculus courses tend to focus on algebraic drills and the

3
practicing of rote calculus problems without much attempt to get students to generate an
understanding of the underlying concept (Leng, 2011). This style of instruction does not promote
conceptual understanding or a transfer of the mathematical concepts to other fields of study.
While the Common Core State Standards in the United States are helping to guide a common set
of pre-requisite skills in the lower levels, it has not yet reached the calculus level. Procedural
understanding is still important, but procedures that are connected with the concepts leading to
the procedure provide students with more ability to apply the procedure in a different context
(NCTM, 2014). Procedures in different contexts are normally considered application problems in
calculus. Most application problems in calculus rely on students having conceptual knowledge in
order to solve the problems. The reason for needing conceptual knowledge is that students need
to be able to take the context of the problem and successfully translate it into calculus terms at an
abstract level (White & Mitchelmore, 1996). This study can help to gather insight into students’
conceptual understanding of calculus, prerequisite skills, and their ability to transfer this
knowledge to real world applications.
Another reason for this study is that it is often not clear whether students have conceptual
understanding of the mathematical material based on instruction in school. Too often in math
classes, students can develop algorithmic knowledge but may not conceptually understand the
concepts. Students may memorize algorithmic steps and be successful on problems in exams, but
lack conceptual understanding (Petterson & Scheja, 2008). In the education system in the United
States today, student progress in mathematics is often assessed by national and state assessments
that students take every year. These assessments may provide valuable information about
achievement in mathematics. However, the data cannot inform teachers on effective teaching
strategies or how students are learning mathematics.

4
One possible way to make mathematics instruction more effective is to look at students’
emerging understandings and how they arise (Heid, Blume, Zbiek, & Edwards, 1999). This is
needed as much of the depth of knowledge taught in math courses is mostly at the procedural
level and taught in a teacher centered method (Heng & Sudarshan, 2013). As a result, many
students either are not taught concepts or simply do not bother to learn concepts. Results from
the third Trends in International Mathematics and Science Study (TIMSS) showed that in the
United States, mathematical instruction primarily focuses on procedures and topics that are
fragmented instead of instruction that focuses on connected central concepts (Schmidt, Houang,
& Cogan, 2002). This type of instruction makes it extremely difficult to develop conceptual
understanding in any course of mathematics. Gathering data from students working on tasks can
provide valuable information about their level of mathematical conceptual understanding and to
take note of any gaps in their procedural and conceptual understanding of mathematical topics.
Theoretical Perspective
My theoretical lens is based off a theoretical model developed by Pirie and Kieren (1994)
which provides a way to describe the processes students go through in constructing
understanding in mathematics. It may be logical to assume that mathematical understanding is a
linear process that builds on each other, but Pirie and Kieren make the argument that the
construction of mathematical understanding is a movement through eight layers of understanding
that are embedded within each other. While the layers of understanding extend outwards, the real
growth in student understanding actually happens as students work within each layer of
understanding and move through the different layers of understanding both forwards and
backwards as they learn and process new mathematical information (Martin, 2008). The
innermost layer of understanding is Primitive Knowing. This layer contains all previous

5
knowledge that a learner brings to the table when learning something new (Droujkova, Berenson,
Slaten & Tombes, 2005). Prerequisite skills students bring to a new mathematical concept would
be characterized as primitive knowing. A lack of prerequisite skills makes any reasonable
movement to the outer layers of understanding described in the Pirie-Kieren model extremely
difficult. This demonstrates the importance of assessing students’ prior knowledge and
developing and building on this understanding through problems that can develop conceptual
understanding. This theoretical model and the eight layers in it will be described in more detail in
chapter 2.
Research Question
The context of the research question addressed by this study focuses on the prerequisite
skills students must possess in order to be successful in a calculus course. These prerequisite
skills will be assessed using task-based interviews involving applications of the derivative.
Task-based interviews are based off of the work done by Piaget who thought actual
understanding occurs when the student is able to make discoveries for him or herself (Assad,
2015). When students are involved in problem solving in mathematics, most students utilize a
“trial and error” approach intent on only finding one solution. As a result, students struggle to
present their solutions in a mathematical manner that is clear, organized, and logical in thought
(Zhu & Tan-Foo, 2004). Interviewing students while they perform a mathematical task is one
way to document the most common student misconceptions and offer an avenue for them to
develop proper conceptual understanding of mathematics and its real-world use (Assad, 2015).
Therefore, task-based interviews provide relevance as a research instrument, but also as a
possible research-based tool for evaluations and assessments used by instructors (Goldin, 1997).
The research question is as follows:

6
To what extent do task-based interviews reveal students’ prerequisite skills and
conceptual understanding for applications of the derivative and how do these skills and
understanding develop for students who have been classified as having low levels of
prerequisite skills upon entering a calculus course?
Organization of the Study
The study is organized into five chapters. Chapter 1 contains the introduction, statement
of the problem, rationale, and the research question. Chapter 2 has a review of the appropriate
literature for prerequisite skills, conceptual understanding, procedural understanding, and
calculus understanding. This chapter also will include the theoretical framework of the Pirie-
Kieren model and the associated reviewed literature of the model. Chapter 3 explains the
research methods of the study. Chapter 4 will provide an analysis of the data and findings.
Lastly, chapter 5 will include a discussion of the findings and implications based on the findings.
The limitations of the study will also be addressed, as well as the significance of this study and
recommendations for future research on this topic.

7
Chapter 2: Review of the Literature
The purpose of this section is to provide a review of relevant literature. First the Pirie-
Kieren (1994) theoretical model will be discussed. This will be followed by a literature review
about students’ conceptual understanding in calculus. Then a literature review on pre-requisite
skills needed to succeed in calculus, pre-requisite procedural skills, as well as information about
students’ understanding of derivative. This section will close out with a discussion on why
having conceptual understanding of calculus is important.
Pirie-Kieren Theoretical Model
The Pirie-Kieren theoretical model views mathematical understanding as a dynamic,
growing, ever-changing process as opposed to a static state to be achieved (Martin & Towers,
2016). The model consists of eight layers of understanding that are nested within each other.
Each layer of understanding describes ways that a learner acts mathematically in a way that
someone can observe.
The first and innermost layer is primitive knowing. This is the starting place for growth
of understanding for any new mathematical material (Martin & Tower, 2016). This layer consists
of everything a learner knows with the exception of the particular concept that is being
considered by the observer (Pirie & Kieren, 1994). It is important to note that primitive
knowledge does not imply “low-level” mathematics, but rather a starting place for the growth of
any particular understanding (Warner, 2008). In other words, primitive knowledge is what the
observer assumes the learner can do initially. In an ideal world the primitive knowledge should
be the prerequisite skills necessary to perform the task, but this is not always the case. So, when
a learner is learning a new concept, all understanding has its roots in primitive knowledge except
for the knowledge they already have on the concept or idea they are learning (Warner, 2008). In

8
mathematics, this stresses the idea of working with familiar problems so new theories can be
learned and practiced with confidence using familiar contexts (Lapp, Nyman, & Berry, 2010). In
a calculus context, if a student is learning about the applications of the derivative primitive
knowledge consists of all knowledge of prerequisite skill they possess as well as any calculus
knowledge on limits, continuity, and derivative rules a student has prior to learning applications
of the derivative.
The second layer is image making. In this layer, the learner engages in activities with the
aim to develop particular representations for the mathematical concept and idea related to the
topic being learned. The representation made by the learner could be visual, pictorial, verbal, or
action-based. Another way to think about this is that students are able to use their previous
knowledge in new ways (Nillas, 2010). This does not imply prerequisite knowledge because
students may not necessarily have the prerequisite knowledge on hand.
In the third layer, image having, the learner is no longer dependent on the activity used in
the image making layer. The learner has a mental plan for the activities used in the prior layer
and is able to use the concept or procedure in new ways (Pirie & Kieren, 1994). In other words,
the learner no longer has the need for particular examples or actions in order to successfully
activate the concept. They have some sort of mental image which they utilize when working on
a mathematical task (Nillas, 2010).
The fourth level, property noticing, is the ability for one to manipulate or combine
aspects of his or her images to construct context specific, relevant properties (Pirie & Kieren,
1994). This layer of understanding is where students begin to question mathematical images
using the representations they have developed. Students at this level will analyze the similarities

9
and differences of their images and relate them to each other (Thom & Pirie, 2006). In other
words, students can validate their mathematical knowledge with comprehension (Nillas, 2010).
The next layer of understanding is called formalising. This stage involves students
generating a general statement about concepts using the statements they have developed in the
property noticing level (Pirie & Kieren, 1994). Students at this level are able to construct a
mathematical definition of the concept or be able to develop formulas and algorithms about the
topic (Borgen, 2006). At this level, students do not need to relate back to specific mathematical
contexts that allowed them to develop the mathematical understanding at hand (Nillas, 2010).
The sixth layer of understanding is called observing. At this layer, students are able to
observe the meaning they have developed in the prior level and are capable of organizing their
observations. Students are capable to reflect on and coordinate formal activity, take these actions
and express them and as theorems (Pirie & Kieren, 1994).
The seventh layer of understanding is structuring. At this level, students can logically
explain their formal observations, be able to reason and prove theorem-like expressions and
verify ideas that are developed in the observing level (Thom & Pirie, 2006). Students are also
able to decipher a pattern by creating a synthesis of observations they have made (Borgen, 2006).
The eighth and outermost layer is called inventising. At this final level, students observe
their previously developed understanding in new ways and look to ask questions that will lead
them to ask new questions which might grow into a totally new concept (Pirie & Kieren, 1994).
Even though the outermost layer is called inventising, this does not mean that students are
inventing something new. Inventising is the process of taking the current level of understanding
and extending it in a “non-traditional” way based on current knowledge (Pirie & Kieren, 1994).

10
It can be difficult to differentiate between structuring and inventising, but this can be done in a
calculus context. Structuring would be students seeing application of derivative in an
optimization problem as a use of the first derivative that always works for specific functions such
as polynomial functions but needs limitations such as a domain restriction for logarithmic
functions in order to be useful. Inventising would involve students asking how an optimization
problem would work outside of single variable calculus or two-dimensions and begin to question
if the process would be the same in three-dimensions with two variables or even with multiple
variables. Questioning the concept for optimization in three-dimensions is an example of
inventising because the overwhelming amount of mathematics most students will have done
prior to a first semester calculus course will have been in two-dimensions or calculus that has
been performed only with respect to a single variable. A task-based interview by Walters and
Gibbons (2010) demonstrates how a student goes from structuring to inventising in Taylor series
by using the structures developed in constructing a Taylor polynomial and successfully
generating a “short-cut” to generate any term in an infinite Taylor series.
The four innermost levels are often referred to as informal levels of mathematical
understanding and the outermost four levels are described as formal levels of mathematical
understanding (Pirie & Kieren, 1994). Some students may never reach the outer layers of the
Pirie-Kieren model (Codes et al., 2013).
One of the reasons for the layers of understanding being nested within each other is that
growth is not limited to moving in one direction or linear growth, but through back-and-forth
movements between mathematical ideas (Gulkilik, Ugurly, & Yuruk, 2015). Part of the growth
of mathematical understanding occurs through constant moving back and forth throughout
various layers of understanding as learners develop new knowledge and use this new knowledge

11
to reconstruct their current understandings (Pirie, Martin, & Kieren, 1996). This is a key feature
of the Pirie-Kieren model which is referred to as folding back. When a learner folds back, they
are activating their prior understanding of prior concepts in the inner layers, while
simultaneously taking in the new mathematical concepts he or she is learning (Warner, 2008).
However, the prior knowledge is not sufficient to handle the learning of the new mathematical
concept otherwise they would not be learning anything new. Therefore, learners must build on
their prior understanding in a way that will help to understand the new concept. This provides
students with a “thicker” understanding of the concept because they have built on prior
knowledge while using the prior knowledge to learn and develop an understanding for the new
concept being encountered (Martin & Towers, 2016).
It is important to emphasize that folding back from an outer level back to an inner level
should not be seen as a lack of understanding. Instead, this folding back should be viewed as an
opportunity for students to broaden any insufficient understanding and reorganize previously
constructed knowledge. These processes allow students to develop new and appropriate images
about a specific mathematical topic (Pirie, Martin, & Kieren, 1996).
Another aspect of the eight levels of mathematical understanding characterized by the
Pirie-Kieren model are the thicker lines between certain levels called “don’t need” lines. The
eight levels of mathematical understanding along with the “don’t need” boundary lines can be
represented visually in the model shown in Figure 1. The “don’t need” boundary lines convey the
idea that once a person goes beyond the boundary that the person still possesses the
understanding of the prior levels but have progressed to more conceptual understanding that
allows the person to utilize more efficient thinking and methods. (Pirie & Kieren, 1994). These
“don’t need” boundaries represent an increase in abstract understanding (Borgen, 2006) and
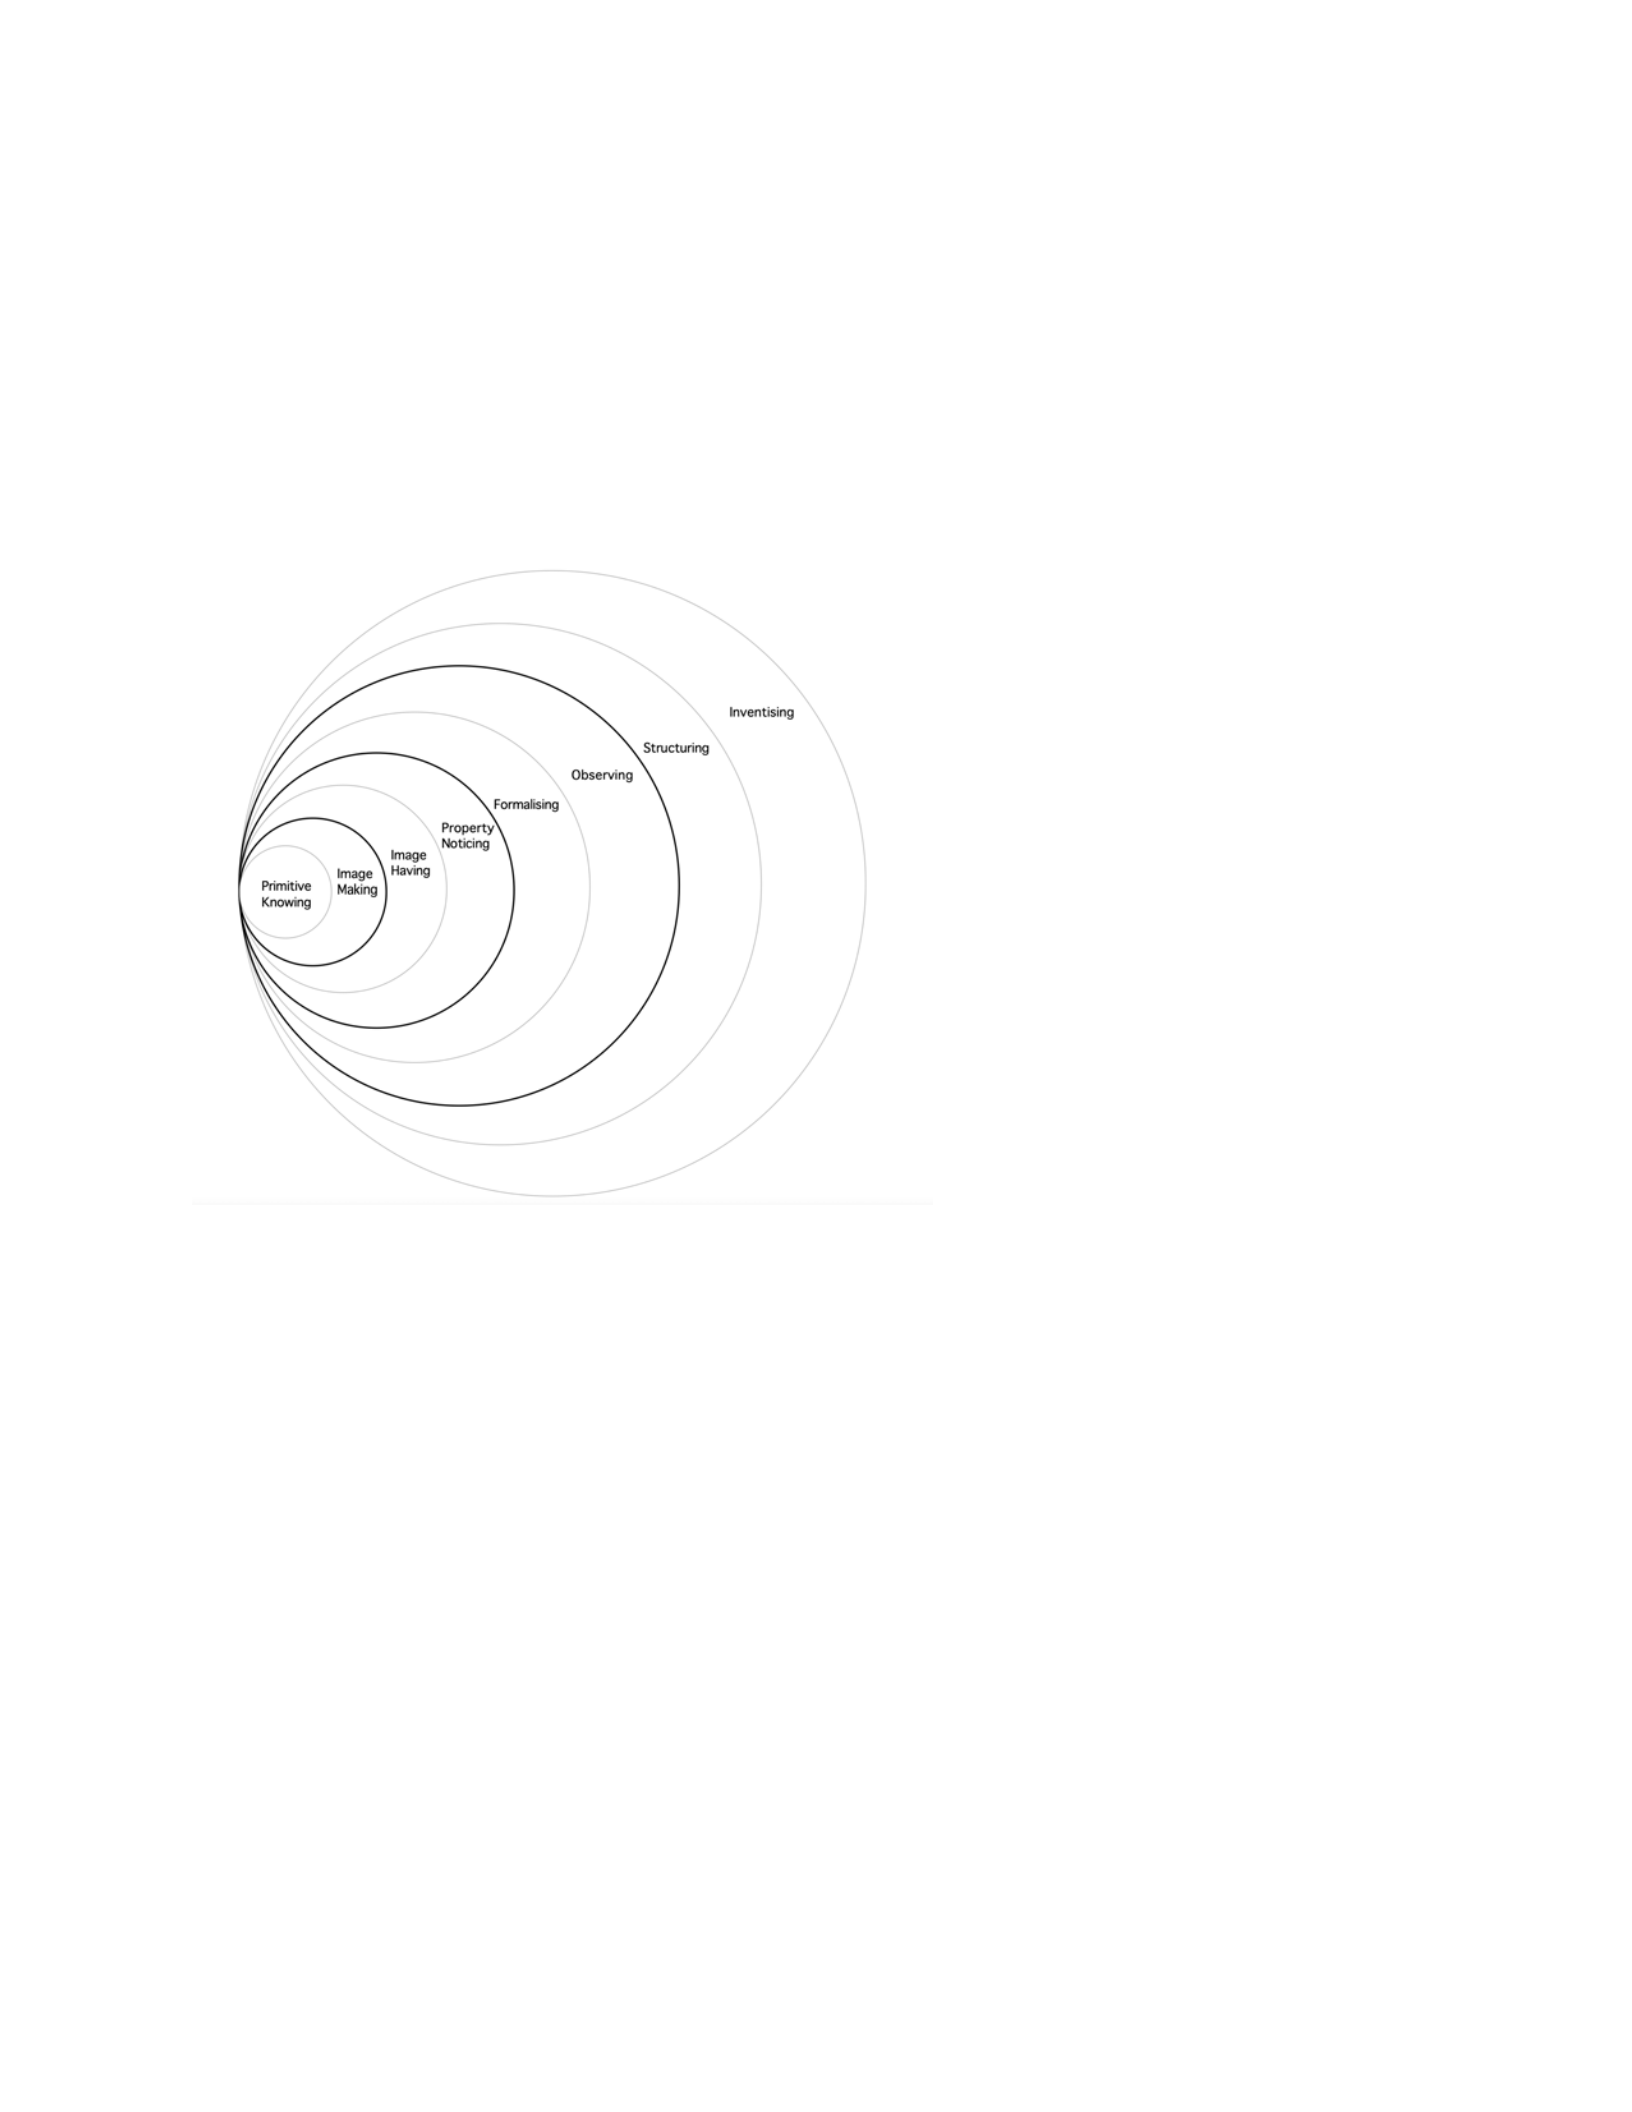
12
represent that a student no longer needs specific actions carried out at levels inside the boundary
lines. As such students are able to work with a more general level of understanding outside of the
boundary lines (Pirie & Kieren, 1994).
Figure 1. Pirie-Kieren Model for the Dynamical Growth of Mathematical Understanding
Pirie & Kieren (1994) stress the fact that the boundary lines do not necessarily mean that
one will never return to the inner levels within the boundary line again because this would
contradict their idea of being able to fold back in order to connect the disjointed pieces of
knowledge together.
The first “don’t need” boundary is between image making and image having (Pirie &
Kieren, 1994). This is reasonable giving that once a student has the image in his or her mind,
they no longer need physical or mental tools to assist in the task. This would relate more to

13
procedural knowledge. In a calculus context, an example of a student who successfully passes
this “don’t need” boundary is one who is able to mechanically compute a derivative without the
need to reference the derivative rules. It is important to note that this “don’t need” boundary is
within the inner levels of understanding, so a student does not necessarily possess the conceptual
knowledge of derivative. It simply implies the student has an idea of how to follow a procedure
to obtain a derivative regardless of whether the procedure is correct.
The second “don’t need” boundary is between property noticing and formalising. The
idea behind this boundary line is a person who has a formal mathematical idea does not require
an image anymore (Pirie & Kieren, 1994). Since this boundary is between the fourth and fifth
layer of the model that separates the informal and formal mathematical understanding, students
at this level are starting to develop an abstract understanding formed by working through the
inner four layers (Borgen, 2006). In a calculus context, a student who successfully crosses this
boundary line is able to compute the derivative of a complex composite function without the
need to decompose the function into separate functions, computing the derivative of each
function separately, and then applying the chain rule.
The final “don’t need” boundary occurs between observing and structuring. The idea is
that a person with a mathematical structure does not need to spend time processing meaning that
is provided by any of the inner levels anymore (Pirie & Kieren, 1994). A calculus example of a
student who is passing this final boundary is one who is able to logically demonstrate and
understand rules regarding derivative such as L’Hopital’s rule or a series representation of a
function without any reference to what a derivative actually represents.
Studies in calculus using the Pirie-Kieren theoretical model as a framework are sparse,
but related studies using the model show the usefulness of the Pirie-Kieren model. A study that

14
used task-based interviews with the Pirie-Kieren theoretical model for the topic of series in a
second semester calculus course found students ventured into the inner-layers of the model
(Walter & Gibbons, 2010). There have been a few studies using the Pirie-Kieren theoretical
model as a framework in secondary math courses. These studies focused on particular areas of
the model or used a particular tool or technique in association with the model. A study by
Gulkilik, Moyer-Packenham, Ugurlu, and Yuruk (2020) focused on one female student as she
progressed from the informal layers to the formal layers of the Pirie-Kieren model using task-
based interviews on geometric transformations. Another study examined the mathematical
understanding of geometry concepts using the Pirie-Kieren model for undergraduate pre-service
teaching students completing task-based interviews with the use of Geometer’s Sketchpad (Yao,
2020).
Lack of conceptual understanding in calculus
Calculus has been referred to as the greatest intellectual achievement of humankind
(Samuels, 2017). While calculus is a fundamental course that contributes to the development of
expertise in STEM (Aydin & Ubuz, 2014), the literature on conceptual understanding in calculus
reveals an overarching theme: conceptual understanding in calculus is severely lacking across the
board. Colleges and universities are finding that the mathematical skills of entering students are
decreasing and that they do not possess a fundamental understanding of key mathematical
concepts (Bingolbali, Monaghan, & Roper, 2007). A body of qualitative research (Dreyfus and
Eisenberg, 1983; Even, Lappan, and Fitzgerald, 1988; Graham and Ferrini-Mundy, 1989; Monk,
1989; Orton, 1983; Tall and Blackett, 1986; Vinner, 1983) suggests an underdevelopment of
fundamental calculus concepts such as function, limit, derivative, and definite integral in college
students (Ferrini-Mundy & Gaudard, 1992). Many high school and college students are

15
somewhat capable to procedurally solve calculus problems but have little to no understanding
about why they have gotten their answer or if the answer is reasonable. This is similar to
instrumental understanding where a student knows a rule without knowing why the rule works
(Skemp, 1976). A calculus course that is taught for instrumental understanding tends to result in
learning that is rote and manipulative (Steen, 1988). Unfortunately, traditional calculus courses
tend to focus on algebraic drills and the practicing of rote calculus problems without much
attempt to get students to generate an understanding of the underlying concept (Leng, 2011). A
reason for the need to develop a conceptual understanding of calculus concepts is that procedural
knowledge without conceptual knowledge to help solidify an idea is fragmented; so, when
students learn something new that does not fit into one of their fragmented ideas, they are
unlikely to store this information into long term memory (Jukić & Dahl, 2012). These
fragmented ideas imply that students are unprepared to tackle the complex concepts that occur in
calculus (Sonnert, Barnett, & Sadler, 2020). If students are not prepared to tackle the concepts, it
is unreasonable to expect them to make connections between the concepts (Dibbs, 2019).
Students often do not develop conceptual knowledge because their preferred ability to
solve problems does not gravitate towards conceptual understanding. Studies indicate that in
general calculus students of all levels have a strong tendency to think analytically rather than
visually (Haciomeroglu, Aspinwall, & Presmeg, 2010). According to their definition, they
consider a student using analytical thinking when the student translates the problem into
symbolic representation or translating a graph into an equation or utilizing a numerical strategy
and they consider visual thinking when the student translates the problem into a graphical
representation or some other visual representation such as the slopes of tangent lines
(Haciomeroglu, Aspinwall, & Presmeg, 2010). A calculus example of analytical thinking would

16
be if a student takes a graph of a function, figures out an equation for the graph, computes its
derivative and critical points, and uses this information to sketch a graph of the derivative. A
calculus example of visual thinking would be using a visual of the changing slopes of tangent
lines to construct the graph of a derivative without the need to analytically compute a derivative
or consider critical points (Haciomeroglu, Aspinwall & Presmeg, 2010). Given the prior studies
and research suggesting that students learn calculus through rote problems and algebraic drills, it
is not very surprising that students will naturally lean towards analytical thinking as opposed to
visual thinking. Students are used to seeing the symbolic representation and procedural
manipulation of problems as opposed to visual representation trying to link conceptual
knowledge to the procedures.
Besides promoting better retention of procedures, procedures that are connected with the
concepts leading to the procedure provide students with more ability to apply the procedure in a
different context (NCTM, 2014). Procedures in different context are normally considered
application problems in calculus. Most application problems in calculus will rely on students
having conceptual knowledge in order to solve the problems. The reason for needing conceptual
knowledge is that students need to be able to take the context of the problem and successfully
translate it into calculus terms at an abstract level (White & Mitchelmore, 1996).
Even though the literature implies a general lack of conceptual understanding in calculus
from students, students are not completely to blame. In the school setting, students develop an
algorithmic context but not necessary because of misconception. Instead, the algorithmic context
is functional for them and has been successful in learning tasks confronted in teaching and exams
(Petterson & Scheja, 2008). In other words, students are not really required to possess conceptual
understanding of many mathematical concepts in order to get through school. As a result, many

17
students simply do not bother trying to learn concepts. This is compounded by the fact that
educational policy in the United States places more emphasis on standardized testing than
conceptual understanding, which can promote teaching topics at the surface only (Dibbs, 2019).
Results from the third Trends in International Mathematics and Science Study (TIMSS) show
that in the United States, mathematical instruction primarily focuses of procedures and topics
that are fragmented instead of instruction that focuses on central concepts that allow a fluid
learning of mathematics (Schmidt, Houang, & Cogan, 2002). This type of instruction makes it
extremely difficult to develop conceptual understanding in any course of mathematics. Going
along with this idea, a reason students are not taught to develop understanding is because
teachers themselves lack conceptual understanding. Nillas (2010) found that many preservice
teachers have a lack of conceptual understanding of mathematics. Yao (2020) used the Pirie-
Kieren theoretical model with preservice math teachers for the topic of geometry and found that
the preservice math teachers struggled to reach the formal outer layers of the model where
conceptual understanding occurs (Yao, 2020). A reason for this is many preservice teachers
understanding of mathematics is based off their experiences learning math in school which is
mainly procedural and using rules to manipulate symbols without having to understand what is
going on and why (Nillas, 2010). As a result, many teachers will place emphasis in their teaching
on the mathematical procedures at the expense of conceptual understanding (Mao, White, Sadler,
& Sonnert, 2017; Tall, 1992).
Another potential issue is the lack of consensus about which topics are central to having a
thorough understanding of calculus. Part of the reason for the lack of consensus is due to the
needs of different classes of students that teachers and professors teach. A study on how
mechanical engineering students learn calculus showed that their mathematical development of

18
concepts is different than how a traditional mathematics student develops concepts (Bingolbali,
Monaghan, & Roper 2007). As a result, calculus instructors are likely to tailor their instruction to
fit the needs of the students they serve rather than adopt a universal approach designed to
develop conceptual understanding of topics that can translate into any field.
Foundations in calculus
There are three main foundations in calculus: limits, derivatives, and integrals. Every
topic in calculus stems from these three main concepts. While a panel of calculus experts
unanimously agreed that derivatives are an important concept to master and nearly everyone
(96%) agreed that integrals are an important concept to master, there was not much unanimous
agreement on the other concepts and skills considered essential to be successful in calculus
(Sofronas, DeFranco, Vinsonhaler, Gorgievski, Schroder, & Hamelin, 2011). Even limits, the
foundation for both derivatives and integration, is considered by many experts as not essential
for success in calculus. Therefore, calculus instruction may not be universal in terms of topics
taught.
Limits is a concept students need to understand since a limit is the foundation in
developing and understanding both the derivative and the integral (Sofronas et al., 2011). But
developing an understanding of limits requires a different level of reasoning not used in algebra
and therefore many students have a difficult time grasping limits (Cappetta & Zollman, 2013). A
study on a unit on limits in a college calculus course revealed that the instructor used only an
algebraic approach to solve 43 out of 64 problems with students and periodically used another
method such as the graphical method only to clear up student confusion with the algebraic
approach (Güçler, 2013). Unfortunately, this reliance on symbolic manipulation and
representation means that students are not encouraged to explore other avenues to solve these

19
limit problems in order to make conceptual connections and develop meaning with the symbols
they are manipulating. Despite the fact that the instructor correctly communicated that the limit
was a number and the limit process of the behavior of the function values, students did not
interpret the limit the same way. The students lack of understanding of limits meant they
interpreted the limit as a process rather than a number and ability to approach but never reach
that number (Güçler, 2013; Tall, 2001). Besides the fact that students are misinterpreting the
limit, notation also confuses many students. Students often mix-up the evaluation of a function at
a point c, f(c), and the limit of a function as x approaches c,
lim
!→# 𝑓(𝑥)
(Juter, 2006). A study of 20
engineering students in calculus showed that even if students did have some sort of conceptual
understanding of limits, their conceptual understanding of limits was fragmented (Petterson &
Scheja, 2008).
The derivative is a critical part of differential calculus and the main concept which
students should understand (Aydin & Ubuz, 2014). While some of the rules of derivatives can be
taught procedurally, three concepts that constitute an important subset under derivatives by
calculus experts is rate of change, graphical representation of the derivative, and derivative
computations (Sofronas et al., 2011). When working with the three aforementioned derivative
concepts, proper use of symbols is crucial in order to properly represent changing quantities, but
students do not use symbols to represent these concepts (Frid, 1992). The first derivative rule
where this can become a real issue is the Chain rule. The Chain rule is the derivative of a
composite function and serves as an important concept in calculus due to its applications and
direct use in related rates (Kabael, 2010). The Chain rule can be written in either Leibniz
notation or function notation. In qualitative study involving 27 students on the conceptual
knowledge of the Chain rule, several students were not aware of the relationship between

20
function notation and Leibniz notation and many also had difficulties applying the Chain rule in
Leibniz notation because they could not use the Leibniz notation meaningfully (Kabael, 2010).
The lack of proper use of symbols also implies that students struggle in applying calculus
because of a lack of development in the concept of a variable (White & Mitchelmore, 1996).
White and Mitchelmore’s (1996) study involved 40 students solving various application
problems involving derivatives: two requiring the use of related rates, and two requiring students
to maximize or minimize a real-world application. Most students were able to solve the easier
problems that simply required manipulation of variables with algebraic symbols without
meaning, but most could not solve the problems that required them to generate a variable on their
own to represent a changing quantity. In other words, students were very good at manipulating a
variable with algebraic symbols but could not interpret any contextual meaning behind the
symbols in the problems they are doing.
The literature on integration is not as rich, but many calculus experts see knowledge of
using area bounded by two curves as one connection to integrals as critical for student
understanding in a calculus course (Sofronas et al., 2011). This representational versatility to
help produce a conceptual understanding is lacking with students because students are often
confined in their knowledge base to the algebraic way students learn about integration (Mahir,
2009). Similar to the result from limits, if students had any conceptual understanding of an
integral their understanding of integration was also fragmented even if they were good at
computing integrals (Petterson & Scheja, 2008). Given that limits and derivatives are often
learned before integrals in the teaching of calculus, some of these concepts are necessary to
understand the concepts in integration. If a student struggles with derivatives, this could
compound their struggles with understanding integration because derivatives can be looked at as

21
a “forward process” while integration can be viewed as the “backward process” (Maharaj &
Wagh, 2016). Students will encounter Riemann sums, limits, derivatives, and area in their basic
introduction to the definite integral of a function (Serhan, 2015). An example of using a prior
calculus concept to understand a method of definite integrals is u-substitution. U-substitution can
be used to integrate composite functions. Therefore, having a conceptual knowledge of the chain
rule and taking a different adaptation of that knowledge can help students to understand how u-
substitution works to compute a definite integral (Lutzer, 2003).
As a result of compounding on other calculus concepts, the conceptual understanding of
integration is very difficult for students to understand; even the best calculus students struggle
with this concept (Orton, 1983). Besides the compounding of concepts in integration, the
difficulties students face with conceptual understanding in integration is more complicated than
the difficulties students face with conceptual understanding of derivatives (Maharaj & Wagh,
2016). The general consensus from the literature is that the knowledge students possess on
integration is limited to procedural knowledge only as students showed the ability to compute
mostly straightforward types of integrals. A possible reason for this is because most exams on
integration will mainly focus on procedural knowledge for integrals (Sonnert, Barnett, & Sadler,
2020). Serhan (2015) found students were generally unable to explain concepts in calculus such
as negative area and could not establish a connection between multiple representations of the
definite integral such as the definite integral computing the area under the curve of a function
and above the x-axis (Serhan, 2015). A study conducted by Thompson (1994) showed that senior
and graduate students in mathematics had a hard time understanding the Fundamental Theorem
of Calculus, which relates derivatives and integrals, because of their lack of conceptual
knowledge of rates.

22
Once students have learned the three key concepts of calculus: limits, derivatives, and
integrals, students need to be able to develop a strong connection between the three major
concepts. However, students view the three concepts as individual bins that are isolated from
each other and whose procedures are not used in other contexts hence blocking any chance they
may have of trying to make a connection between them (Martin, 2013). This confirms the idea of
Petterson and Scheja (2008) that students’ conceptual understanding developed in calculus is
fragmented. If the individual calculus is fragmented, so will any attempt at trying to connect the
concepts together.
Pre-requisite skills needed to succeed in calculus
It would be logical to infer that students who have experienced previous success in prior
math courses should also be successful in a calculus course. The literature suggests that prior
mathematics achievements is the most consistent and strongest factor associated with students’
success in future math courses (Eccles et al., 1983). However, several studies have shown that
students who earn high grades in prior courses including calculus experience difficulties with
certain calculus concepts. Even high achieving students who take AP Calculus in high school
struggle to develop a deep understanding of calculus concepts (Sonnert, Barnett, & Sadler,
2020). These concepts include working with the derivative and antiderivative in a graphical
context and explaining how to obtain the instantaneous rate of change (Aydin & Ubuz, 2014).
This implies the need to look deeper than prior math achievement by also looking at necessary
prerequisite skills a student will need to be successful in calculus.
As noted, mathematics and mathematics education professionals have a difficulty in
agreeing on common calculus concepts that students should know at the conclusion of their
calculus education (Carlson, Oehrtman, & Engelke, 2010). There is also a similar problem in the

23
pre-calculus curriculum. As a result, in many pre-calculus courses, standards for what should be
taught are unclear and inconsistent (Schmidt et al., 2002). While the Common Core State
Standards in the Unites States are helping to develop a common set of pre-requisite skills in the
lower levels, it has not yet reached the pre-calculus or calculus level. However, this work would
not be enough. Even pre-calculus courses in colleges and universities across the country are not
adequately preparing students for success in calculus. Most students do not appear to benefit
from attending a pre-calculus class in college as measured by their performance in a calculus
course when compared to students with similar ability who did not take a pre-calculus course in
college (Sonnert & Sadler, 2014). A possible explanation for this goes back to the fact that in
general, math classes including pre-calculus are traditionally taught with a focus on the
manipulation of symbols rather than on attempting to understand what the symbol represents
(Davis, 1986). More alarming is that research in the field plays only a small role in the
development of many common mathematics curricula used in schools and colleges and this can
also affect the teaching that occurs prior to calculus. This puts students at risk of entering
calculus without the necessary prerequisite knowledge (Carlson, Madison, & West, 2010).
Based on the literature, there are three major ideas students need to be successful in
calculus: a solid understanding of ideas that deal with rate of change and function, a process
view of function as opposed to an action view of function, and being to utilize covariational
reasoning to discern and represent how two related quantities change together (Carlson,
Oehrtman et al., 2010). While these three ideas can be viewed in isolation, the one common trait
all three necessary ideas share is the main prerequisite skill students must have to be successful
in calculus. A successful student must possess a strong understanding of functions as a process
and not as an action. Students who possess an action view of a function are only able to work

24
with a function in terms of symbolic manipulations without conceptual or contextual
interpretation of a function as mapping a set of values to another set of values (Dubinsky &
Harel, 1992). On the other hand, students with a process view of a function are able to see a
function as a continuum of domain values that serve as the input that produce a continuum of
range values that serve as the output values (Breidenbach, Dubinsky, Hawks, & Nichols, 1992).
There have been strong suggestions for pre-calculus courses to place more emphasis on
functions (NCTM, 2000). Adequate knowledge and skills, including algebraic aspects of
functions and their standard form should be a prerequisite to study calculus (Maharaj & Wagh,
2016). Students’ understanding of function is very limited in scope; even high-performing
students possess a very limited understanding of the concepts of a function, its language, and
ability to represent real world applications as function relationships (Carlson, 1997). A common
misconception students have with functions is a narrow view of a variable as something to solve
for. This might be true when students are trying to solve an equation, but the use of a variable in
a function serves as a representation of how two quantities change together (Carlson, Madison, et
al., 2010). This supports the argument of White and Mitchelmore (1996) that students do not
have a solid concept of a variable; they simply treat a variable as a symbol that requires
manipulation. To develop a solid concept of a variable, it is imperative to emphasize what
variables mean in context rather than how a variable is manipulated (White & Mitchelmore,
2016).
With regards to the three main ideas from the literature, a rate of change is often
displayed graphically. A student with an action view of function will associate the graph of the
function as a fixed object in the Cartesian plane. They associate points, slope, and other things
they learn graphically such as the vertical line test as geometric properties of the graph (Carlson,

25
et al., 2010). Students with an action view also struggle to take the graph and interpret it in
context. In other words, students are unable to construct a function of one variable in terms of
another (Carlson, 1998). A student with a process view of function sees a graph as a visual
representation of the mapping or relationship between two varying quantities: one on the x-axis
and its corresponding value on the y-axis. These students are also able to interpret slope as
something that is constantly changing as the corresponding input/output values change and are
able to express the graph as a function of one variable in terms of another variable (Carlson, et
al., 2010). This process view of function will allow students to successfully develop strong
calculus concepts such as interpreting the derivative of a function as a continuum of values that
can also vary as the corresponding input/output values change. Students will also be able to
graphically reason if the rate of change is positive or negative or increasing or decreasing.
Students with a process view of function will also be able to view a graph and interpret the graph
in context; for example, if a student views a distance-time graph he or she will be able to
interpret the graph as a covariation of time and distance of the traveler as the traveler moves
from some starting point (Carlson, 1998).
Students with an action view of functions tend to rely on the things they have seen and
learned through much of their math learning: procedural mechanics and computational
reasoning. For example, students could be given the function f(x) = 3x2 – 5. A student with an
action view of functions will merely see this as a rule with a set of procedural instructions. These
students will square the value of an explicitly given value of x, multiply the resulting number by
3, and subtract 5 to get an answer. But a student with a process view of functions will view 3x2 –
5 as the method of mapping any input value, x, to an output value which is represented by f(x).
These students may compute an individual value of the function if asked to, but they are able to

26
imagine the behavior of the output values as the input values change. Students with a process
view are also able to interpret the input values and method correctly as opposed to a student with
an action view (Carlson, Oehrtman, et al., 2010). Using our same example, f(x) = 3x2 – 5,
Carlson (1998) showed that students with an action view of functions when asked to perform a
more abstract problem such as f(x + c), with no explicit value for x or c given, will give the
solution f(x + c) = 3x2 – 5 + c. The students’ rationale for the solution is their interpretation of “x
+ c” as needing to add c to both sides of the equation. A student with a process view of function
will see x + c as the appropriate input value and must evaluate the mapping rule at x + c to
generate its corresponding output value.
Students also show a difference when asked to find the value of x when they are given
the corresponding output value. Using our same example, if a student was asked to solve the
equation f(x) = 70, a student with an action view would simply divide both sides by f in order to
isolate x because they associate f(x) = 70 as a linear equation they need to procedurally solve.
However, a student with a process view of a function will understand that 70 is the output value
and will correctly set the function 3x2 – 5 = 70 and then proceed to use algebra to solve for x
(Carlson, 1997). This process view of a function will help students in further pre-calculus topics
such as correctly finding the inverse of a function and dealing with trigonometric functions.
Students will also benefit in calculus when they are learning the Fundamental Theorem of
Calculus which connects derivatives and integrals as “inverse” operations.
An action view of functions may also explain why students may struggle with the central
ideas of trigonometry (Moore, 2010). When dealing with trigonometric functions such as f(x) =
sin(x – 3), students with an action view may be able to do a computation for an explicit value of
x but then must go one step further and evaluate the trigonometric function at the given result.

27
This is difficult for students with an action view because they view trigonometric functions as a
fragmented procedure they either learned with the unit circle or right triangles (Moore, 2010). To
make matters worse, the units are in radians, so if students are asked to evaluate sin(x – 3) at x =
5, sin(2) is not one of the nice angles students might be required to memorize so they will not
know how to proceed.
The last idea, covariational reasoning, requires students to determine how two varying
quantities change together (Madison, Carlson, Oehrtman, & Tallman, 2015). A student with an
action view of functions will struggle with covariational reasoning. Using a standard 8.5-inch
wide by 11-inch-long piece of paper, Madison et al. (2015) gave students a scenario. If four
squares were cut from the corners could students generate a formula for the volume of the
resulting box in terms of the side length of the squares cut out. Students with an action view
associated the length as 11 inches, the width as 8.5 inches, and the height as some unknown
variable x and thus incorrectly gave the formula as V(x) = (11)(8.5)(x). Other action view
students may have realized that cutting the squares will decrease the length and width of the
paper but gave an incorrect answer of V(x) = (11 – x)(8.5 – x)(x). A student with a process view
of function would attempt to find other ways of visualizing the problem such as drawing a
picture and could realize that as the height increased, the length and width decreased by two
times the value of the height (2x), therefore leading them to give the correct formula for the
volume. These students correctly utilized covariational reasoning in order to determine the
relationship between the height of the box and the length and width of the box in order to
produce the correct answer. Students with process view of function would also realize that as the
height x increased, not only would length and width change; the output V(x) would also change

28
as well. This type of reasoning is the type of reasoning students should be utilizing to figure out
patterns in functions as well as growth rates (Carlson, et al., 2010).
Many of the topics students encounter in pre-calculus and subsequently in calculus
require students to have a strong conceptual understanding of functions. The literature has shown
that if students do not have a strong process view of functions, they will have difficulties with
many skills learned in pre-calculus involving functions such as performing function composition,
determining if the inverse of a function exists and computing its inverse, and generating a
function to solve application problems (Breidenbach et al., 1992; Dubinsky & Harel, 1992;
Carlson, 1998; Carlson, Oehrtman, et al., 2010). Students without a process view of functions
will also struggle to work with the functions they encounter in pre-calculus such as polynomial,
rational, exponential, logarithmic, and trigonometric functions. If action view students are able to
mechanically compute values of these functions, they would not be able to describe or represent
patterns of changes in these functions (Madison et al., 2015). Students who struggle with these
function concepts will have problems learning key concepts and ideas in calculus such as limits,
derivatives, accumulation, and the Fundamental Theorem of Calculus (Carlson, et al., 2010).
Besides having problems learning key concepts, students with an action view of functions
also find difficulties learning rules and application that stem from function concepts. An example
of this is composite functions. Little has been done in examining student understanding of
function composition, but it was noted that students have a hard time solving problems involving
function composition where the explicit formulas are not given (Sfard, 1992). The reason for this
is that when a function composition is given in explicit form, students can mechanically
manipulate the variables and compute their answer. However, when presented in a different form
such as a graph or a table students do not have the same mechanical device available. So,

29
students who do not have a strong concept of a function will struggle to produce a function
composition solution when presented a problem in graphical or tabular form (Engelke,
Oehrtman, & Carlson, 2005). This struggle with composite functions in pre-calculus will lead to
students having a problem grasping the Chain rule in calculus and the rules and applications that
stem from it: implicit differentiation, related rates, and u-substitution for computing definite and
indefinite integrals. This was confirmed in a study by White and Mitchelmore (2016) where a
student working on a related rates problem with a function V = x3 explained that
$%
$& = 3𝑥'
. This
student did not have a strong concept of functions. Rather, the student simply gave the rate of
change as the derivative of V with respect to x because it is easily manipulated by a procedural
calculus rule.
Procedural Prerequisite Skills
Besides the function ideas students need to understand in order to be successful in
calculus, there are also some procedural prerequisite skills students need to possess. Conceptual
knowledge is extremely important to be successful in calculus and mathematics in general, but
solid procedural knowledge is just as important; particularly having a command of the
algorithms or rules in order to complete mathematical tasks (Hiebert & Lefevre, 1986). In
general, students need to have strong knowledge of algebra, geometry, and trigonometry because
often times procedural algebraic mistakes happen before one is able to determine understanding
of the calculus concept (Agustin & Agustin, 2009). Procedural knowledge requires the ability to
correctly apply rules. Common algebra mistakes include misapplication of rules or liberal
incorrect canceling of terms. Examples of these errors would be students who say that (x + y)3 =
x3 + y3 or students who believe that
()* !
()* +=!
+.
Lack of understanding of facts in trigonometry also
can hinder student assessment of conceptual understanding in calculus. For example, a student

30
may successfully take the derivative of a trigonometric function, but then will be unable to find
the critical values because they are unable to determine when the resulting trigonometric
equation will be equal to 0 (Agustin & Agustin, 2009).
Given the current literature that most math is taught procedurally in the first place, it
would be helpful to narrow the list down to some necessary procedural skills. This partial list of
procedural prerequisite skills necessary stems from the analysis of the studies mentioned earlier.
These are procedural errors that occurred on multiple occasions and these skills appear in
multiple places in the calculus curriculum. In limits, one must have the ability to work with
fractional and rational expressions. Knowledge of these procedures will help students
successfully evaluate problems such as
lim
!→,
!!-'
!!./
. Students who answered this incorrectly often
made an algebra error of simply “cancelling” the x3 from the numerator and the denominator
leading them to conclude that the limit is -2 (Juter, 2006). A student with strong algebra
procedural skills should be able to correctly divide the entire numerator and the entire
denominator by x3 before attempting to evaluate the limit. Even if a student gets the incorrect
answer at this point, it is easier to discern that the error is a conceptual error in limits rather than
a procedural error in algebra.
Going along with the ability to work with fractions by being able to divide terms by x3 or
multiply by
/
!!
, another procedural skill needed by students is to be able to do is work with
negative exponents. While students were good at doing computation with integrals, many
students struggled with definite and indefinite integrals where the use of negative exponents is
necessary (Orton, 1983; Petterson & Scheja, 2008). For example, if a student was asked to
compute ∫
0
!",𝑑𝑥
0
-'
or ∫
3𝑥-1,𝑑𝑥
0
-'
, many students struggled with the form on the left being able
to convert the fractional expression into an expression with a negative exponent which would

31
have helped them begin to procedurally integrate. Or if students could get to the form on the
right, they mechanically carried out the integration process without regard to the fact that the
integrand is not continuous everywhere on the interval because of the discontinuity at x = 0. The
latter issue can be dealt with in pre-calculus helping students develop conceptual understanding
of a function and its domain.
Another key procedure that should be a pre-requisite skill is the ability to factor
polynomials and solve non-linear equations. Factoring polynomials is a recurring skill in every
math course from elementary college algebra on (Beslin & Baney, 2001). However, the literature
suggests that factoring is a procedural skill that students struggle with and often prevents
students from successfully solving problems. While doing optimization problems, students were
able to mechanically compute the derivative of the given function in simpler cases but then
struggled in the analysis because they were unable to factor the resulting polynomial or use
equation solving techniques such as the quadratic formula to find the critical values in order to
proceed (White & Mitchelmore, 1996; Carlson et al., 2010). Factoring polynomials would also
help with limits if given a problem such as
lim
!→'
!#.'!
!#-1
because a cursory inspection of this limit
would have many students assuming the limit is equal to infinity because the denominator is 0.
However, if a student were capable of factoring both the numerator and denominator, they could
reduce the function and make the analysis of the limit easier to carry out (Juter, 2006; Capetta &
Zollman, 2013).
Derivative Knowledge in Calculus
Several calculus textbooks and curriculums lead into the study of derivatives in the
following fashion: working with limits, introducing the limit definition of the derivative, and
then using this definition to prove the derivative formulas students use procedurally (Samuels,

32
2017). While rigorous and mathematically sound, the problem with this avenue of introducing
derivative knowledge is that students do not understand it conceptually (Davis & Vinner, 1986;
Samuels, 2017).
Zandieh (2000) described a derivative framework to analyze students’ conceptual
understanding of the derivative. This derivative framework consists of two components: multiple
representations and layers of process-object pairs. In mathematics alone, the derivative can
possess many meanings. Possible meanings of the derivative in the mathematics context include
the slope of the tangent line, the limit of the difference quotient expression, or a rate of change
(Zandieh, 2000). The multiple representation component of the derivative framework expands on
these meanings to interpret the derivative graphically as the slope of the tangent line, verbally as
an instantaneous rate of change, physically as velocity or speed, and symbolically as the limit of
the difference quotient (Zandieh & Knapp, 2006). With so many meanings of the derivative in a
mathematics context alone, having conceptual knowledge of the derivative is critical to be able
to transfer understanding into applications in other fields besides mathematics. The second piece
of the derivative framework are the layers of process-object pairs which consists of the derivative
of a function as a function whose value at any point is then defined as the limit of a ratio
(Zandieh & Knapp, 2006). The ratio, limit, and function concepts of the derivative are the three
layers of the framework which when combined with the multiple representations piece of the
framework forms a matrix that outlines the structure of the derivative concept (Zandieh &
Knapp, 2006). The derivative framework can be represented visually in the model shown in
Figure 2.

33
Figure 2. The Derivative Framework (Zandieh & Knapp, 2006)
Unfortunately, most teaching techniques on the derivative simply focus on the rote ability
of solving problems by simply finding the derivative of a function or using a sign chart to sketch
a rough graph of the original function (Habre & Abboud, 2006). These types of problems require
students to memorize formulas for the derivative, rules for derivatives, and basic theorems
involving the derivative such as the first derivative test. In order to develop conceptual
knowledge of the derivative, the idea of derivative must be developed such that the main concept
of the derivative is the idea that the derivative is a rate of change (Thompson, 1994; Thompson
and Silverman, 2008). However, rote computations of the derivative for static values of the
variable x, does not induce productive ways of thinking about the rate of change function
(Weber, et al., 2012).
When applications of the derivative are taught in school, most calculus applications are
composed of knowing the derivative as the steepness of a function at a point or the speed at an
instant in time. This allows students to solve most application problems without having to know
the formal derivative or without having conceptual knowledge of the derivative (Zandieh, 1999).

34
Many educators are aware that most applications of derivative taught in a calculus course require
knowledge of derivative at a point or the slope of the curve at a point, so educators spend more
time on these topics which has a negative effect on students’ conceptual knowledge of the
derivative (Habre & Abboud, 2006) as opposed to working on applications that take a more
functional view of mathematics (White & Mitchelmore, 2016).
Another reason calculus students view the derivative as a computation which is evaluated
at a single point is the graphical meaning of slope that dominates the calculus curriculum in most
textbooks used in calculus courses (Jones, 2017). This emphasis on the derivative at a single
point without extending its meaning to continuous functions strengthen the argument made by
Carlson et al., (2010) that students lack covariational reasoning which will develop
understanding of a function as something that is continuously changing as the independent
variable changes rather than as a discrete set of points that are “connected”. Calculus concepts
are encouraged to be taught using multiple representations (Haciomeroglu, Aspinwall, &
Presmeg, 2010). In addition to the graphical meaning of slope, concepts should also be
represented numerically, algebraically, and verbally when possible, which supports the idea of
the derivative framework.
Despite the emphasis of the computation of the derivative at a single point representing
the slope of the tangent line at that point, students struggle to construct tangent lines that were
even close to the correct tangent line which makes it difficult to connect the graphical definition
of derivative to applications such as Newton’s method (Vincent, LaRue, Sealey & Engelke,
2015). A large reason students struggle with tangent lines is due to the misconceptions that
students have about tangent lines from their prior interactions with them in earlier math courses
(Biza, 2008). One of the biggest misconceptions students have about tangent lines is that the

35
tangent line can only have one point in common with the curve and no matter how far away from
the tangency point, the extended tangent line can never intersect the curve again (Biza, 2008).
This misconception was clear in a research study where the students struggled to
construct tangent lines that touched the curve only at the point of tangency and maintained the
correct slope (Vincent, et al., 2015). This implies that even though a tangent line may intersect
the graph more than once, this misconception prevents students from constructing the tangent
line to the curve correctly. Issues of this nature have been studied by Tall and Vinner (1981) in
their research of concept image. The struggles the students in the study experienced are due to
two conflicting parts of the concept image being activated simultaneously (Vincent, et al., 2015).
A straightforward calculus example of this conflict that students encountered would be the curve
f(x) = x3 – x. A student would correctly be able to procedurally compute the derivative of the
function and evaluate the derivative at x = 1 to conclude that the slope of the tangent line to the
curve at x = 1 is 2. However, the student would struggle to construct this tangent line, which
would be the line y = 2x – 2 because this tangent line would not only touch the curve at the point
of tangency (1, 0), but it will also touch the curve at (-2, -6). This intersection of the tangent line
at a second point is a direct conflict to the misconception that the tangent line must only touch
the curve only one time. What compounds the severity of this situation is that research has
shown that many high school math teachers also have this same misconception about tangent
lines which makes trying to get students to understand the concept behind tangent lines even
more difficult (Paez Murillo & Vivier, 2013).
The emphasis on the derivative as a computation evaluated at a single point makes it
difficult to connect this interpretation with other interpretations of the derivative such as a ratio, a
limit, and a function (Zandieh & Knapp, 2006). A qualitative study on the understanding of the

36
derivative concept showed that AP Calculus BC students who were interviewed could not
correctly interpret various meanings of the derivative. One example of this was a student not
knowing whether the derivative could always mean the “slope” even in the context of an
application problem (Zandieh & Knapp, 2006). This lack of ability to think of the derivative as a
rate of change shows the inability of students to connect the different interpretations of the
derivative to the same procedural computation. This makes connecting the concept of derivative
to other mathematical concepts difficult (Dibbs, 2019).
From a procedural point of view, many students struggle with applying the rules of
derivatives for more complicated functions such as composite functions (Maharaj & Ntuli,
2017). In order for a student to correctly differentiate any function successfully, students should
be able to detect different symbolic structures of functions (Maharaj & Ntuli, 2017). This
supports the idea of Carlson et al., (2010) of the need to have a strong conceptual knowledge of
functions. This prerequisite skill makes the procedure of computing derivatives more
straightforward because recognizing the structure of the function allows a student to discern the
correct rule to apply. While not an exhaustive list, the basic forms of functions students need to
be able to recognize to be successful computing derivatives are polynomials, exponential, and
composite functions (Maharaj & Ntuli, 2017). In a calculus context, a polynomial function such
as f(x) = x3 is important to recognize so students can realize that the power rule will be required.
An exponential function such as f(x) = e4x is important to recognize so students know that
applying the rule for the derivative of exponential function will always begin with the
exponential function itself. A composite function such as f(x) = (9x)3 is important to recognize so
students know that in addition to applying a basic rule, the student will also have to apply the
chain rule for derivatives.

37
Why Conceptual Knowledge in Calculus is Important
The review of the literature serves to imply the importance of having conceptual
knowledge in calculus. Calculus is a key transitional course to college mathematics and
combines elementary ideas with abstract ideas (Samuels, 2017). Calculus has many powerful
applications and uses in multiple fields (Jones, 2017). These applications in other fields cannot
happen properly without a conceptual understanding of calculus itself. While studies have
attempted to provide tools and ideas to help develop students conceptual in calculus, many of the
approaches are not successful because students do not possess the prerequisite knowledge to
handle the increased demand to teach calculus for conceptual understanding (Habre & Abboud,
2006). Many skills in calculus requires strong conceptual knowledge of prerequisite concepts. If
a student struggles with a prerequisite concept, the issue snowballs as the student progresses
further in his or her mathematical studies (Maharaj & Wagh, 2016). Using the derivative as an
example, students struggle with the derivative because it requires conceptual understanding of
several other things including function, difference quotient, and limits (Park, 2015; Zandieh,
2000).
The literature implies that we need to consider alternatives to promote conceptual
understanding of prerequisite concepts while promoting conceptual understanding of calculus
concepts. Using the derivative as an example, another approach to teaching the derivative is to
take advantage of the advances in technology and begin with a graphical introduction of the
derivative rather than the limit definition (Samuels, 2017). The main mode of communication in
mathematical activity has been symbolic manipulation whereas the use of graphs has been a
supplement (Guzman, 2002). However, researchers have recognized the potential advantage of
visual representation (Zhang, 1997). Putting graphing at the forefront introduces the idea of

38
derivatives in a less formal way but can allow a student to make sense of the concepts behind the
derivative in a more natural and intuitive way (Samuels, 2017). Not putting so much
mathematical rigor behind the concept right away can help students make reasonable conclusions
at their level. A graphical introduction is a reasonable alternative because graphical reasoning
and understanding helps the development and understanding of prerequisite skills as well as the
rigorous definitions needed to develop the derivative (Samuels, 2017; Tall, 2013).
Conceptual knowledge in calculus can help to battle the reputation that calculus has of
being a barrier for students wanting to pursue STEM careers as well as the high failure rates in
university calculus courses (Dibbs, 2019; Judson & Nishimori, 2005). Much of the literature has
suggested that there are problems with the way calculus is being taught in high schools and
universities which has led to students not having a strong conceptual understanding of calculus
(Maharaj & Wagh, 2016; Judson & Nishimori, 2005). Making an attempt to reverse the lack of
conceptual understanding in calculus can help to strengthen students’ understandings of
prerequisite mathematical concepts and promote stronger procedural knowledge. The increase in
conceptual knowledge of prerequisite material and stronger procedural knowledge can help make
calculus courses more approachable and developing conceptual knowledge of calculus can help
reduce the failure rates calculus instructors see as well as get students to pursue STEM careers.
To help address the issue of prerequisite skills as well as conceptual understanding of
calculus and prerequisite topics, there is a need to take an in depth look at how students approach
application problems in a first semester calculus course. As opposed to most math courses where
instructors usually check if a problem has a correct solution or not, we need to examine how a
student approaches the calculus problems and how the understanding of certain prerequisite
skills and concepts can help or hinder a student from successfully solving a problem. In order to

39
address this need, a qualitative study involving interviewing current calculus students can help to
gather in depth information on how calculus students approach calculus application problems. A
qualitative study allows the researcher to observe the choices and paths students can take to solve
these problems based on their prior knowledge. In theory based on the literature review, more
prerequisite skills and knowledge concepts might provide students with more reasonable paths to
solving calculus application problems when they may not be sure how to begin the problem.
Conversely, lacking a prerequisite skill or concept may hinder a student from solving the
problem because some reasonable paths to solve the problem will not necessarily be available to
them without having the required skill or concept.

40
Chapter 3: Research Methodology
Research Question
The purpose of this study is to examine how prerequisite skills can influence student
success in a calculus course. In particular, the study investigates the thinking of students with
low levels of prerequisite skills through task-based interviews focused on applications of the
derivative. The interviews provided valuable insights into the prior knowledge students need for
success in calculus and how these skills can be developed. The prerequisite skills may be
procedural or conceptual in nature. The following research question guides this study:
To what extent do task-based interviews reveal students’ prerequisite skills and
conceptual understanding for applications of the derivative and how do these skills and
understanding develop for students who have been classified as having low levels of
prerequisite skills upon entering a calculus course?
Methodology
Rationale for Qualitative Methods
The purpose of this study is to describe how prerequisite skills impact students in their
thinking on application of derivative problems. Qualitative research is more in line with the
purpose of this study because qualitative research is appropriate when the study tries to
understand an action or behavior (Bernard & Ryan, 2010). Qualitative research is designed with
the intent to explore, understand, or explain a problem or phenomena (Marshall & Rossman,
2011). This is different than quantitative research as quantitative research is appropriate to
measure the quantity of a particular behavior (Bernard & Ryan, 2010). In this study, the intent is
not to quantitatively measure the amount of prerequisite skills a student has but rather to observe
how prerequisite skills affects the ability of a student to complete challenging first semester

41
calculus application problems. Follow-up questions and interactions further illuminate student
thinking towards completing the problems and what skills may be lacking that could hinder
success. Therefore, a qualitative study is more appropriate in this situation.
Task-based interviews
Task-based interviews are based off the work done by Piaget who thought actual
understanding occurs when the student is able to make discoveries for him or herself (Assad,
2015). In the education system in the United States today, student progress in mathematics is
often assessed by national and state assessments that students take every year. While these
assessments provide broad information about achievement in mathematics, these assessments do
not provide details on useful instruction to target specific math topics that may be of concern.
One possible way to make mathematics instruction more effective is to look at students’
emerging understandings and how they arise (Heid, Blume, Zbiek, & Edwards, 1999). Hearing
how students are thinking about mathematics provides valuable information to teachers. This is
important because the content taught in calculus tends to be more at the procedural level and
often teacher centered (Heng & Sudarshan, 2013). Students need experiences in explaining their
thinking in order to develop their understanding (Zhu & Tan-Foo, 2004). Interviewing students is
one way to pinpoint student misconceptions and offer an avenue for them to develop proper
conceptual understanding of mathematics and its real-world use (Assad, 2015). Therefore, task-
based interviews provide relevance as a research instrument, but also as a possible practical
research-based tool for teachers to use in evaluations and assessments in the classroom (Goldin,
1997). If the task-based interviews help students to develop understanding, it can provide further
support for instructors to implement more student-centered learning in the calculus classroom.

42
Task-based interviews have the potential to identify student misconceptions and help
develop conceptual understanding by providing insight on the different levels of thinking being
used by the students as they perform the task (Hurst, 2008). The modes of thinking are based in
numerate behavior (Morony, Hogan, & Thornton, 2004), but many of the same concepts can also
apply to higher level mathematics and problem solving. The three modes of thinking are
mathematical knowledge, contextual knowledge, and strategic knowledge (Morony et al., 2004).
Mathematical knowledge means students can identify specific items of mathematical information
or recognize examples of mathematical information. Contextual knowledge means students can
interpret mathematical information in context of the specific field or subject and describe in their
own words the main mathematical concepts in the contextual information. Strategic knowledge
means students can develop a method of representing the data that is different than the current
way the data are given or be able to answer questions that demand critical evaluation of the data
(Hurst, 2008). The idea behind these three modes of thinking is that students cycle through these
modes when they approach a problem depending on their experience with that concept. In the
classroom, teachers rarely attempt to look beyond the surface of the incorrect responses from
students and as a result possess little knowledge of the mathematical thinking process of low-
level students (Ginsburg, 1997). But task-based interviews can provide one the best contexts for
assessing and probing the presence of each mode of thinking and determine students
understanding or lack of understanding of the concept (Hurst, 2008). Since the purpose of this
study is to look at the prerequisite knowledge students have and how the prerequisite knowledge
or lack thereof helps or hinders the ability of a student to successfully solve a calculus
application problem, a task-based interview is a reasonable way to conduct this study.

43
A task-based interview using the Pirie-Kieren theoretical model has been done with
calculus students who were higher achieving and able to move in the outer layers of the model
(Walter & Gibbons, 2010). Another task-based interview using the Pirie-Kieren theoretical
model was conducted with students learning geometric transformations (Gulkilik, Ugurlu, &
Yuruk, 2015). Their study conducted a pre-test on prerequisite skills, weekly task-based
interviews with semi-structured questions, and data analysis using the Pirie-Kieren theoretical
model and student progress in the inner-layers of the model. Many of the suggestions for this
study took ideas from the geometric transformations study and its implications for further work.
Interview style
The style of interview can influence the outcome of the interview and is something to
take into consideration. A structured interview is one possible approach. The interviews for each
task would have a set list of questions to ask while the student is performing the task. Structured
interviews have been shown to help prospective teachers develop knowledge on how students
reason in mathematics and any misconceptions students possessed (Jenkins, 2010). Structured
interviews also provide a means of combining educational practices in the classroom with
research (Goldin, 1997). However, a structured interview may not necessarily be the best style to
gather rich and meaningful data from the students. An interviewer with a deep, connected
understanding of mathematics is capable of establishing meaningful on-the-spot probing of
students that can reveal information about how the interviewee is thinking about the task and
mathematics in general (Heid et al., 1999). Having flexibility allows the interviewer to pursue a
wide range of paths to question the learner, is essential for the differences that may arise in
individual learners and helps to avoid “leading” the learner in the right direction for problem
solving (Goldin, 1997).

44
Since each individual student is likely to approach a problem differently as well as
possess different levels of understanding, a structured interview may hinder this study because
the rigid structure may not provide the environment to gather appropriate, accurate information
from each student who participates in the study. In this light, a semi-structured interview is more
appropriate because it provides some structure from structured interviews with the flexibility to
be able to take advantage of key opportunities to probe further into student thinking at an
appropriate time rather than following the rigid structure of structured interviews.
The timing and duration of each interview can also affect the outcome of interviews.
Other studies involving task-based interviews had interviews lasting anywhere from one hour
(Wasserman, 2017) to as long as two or three hours (Koichu & Berman, 2005). In Koichu and
Berman’s study (2005), the participants were high-achieving students who enjoyed mathematics
and were able to work on a series of challenging math problem for an extended period of time
during one interview. Two or three hours for one interview is too long for the participants in my
study because the participants have low levels of prerequisite skills. Also, the participants in the
study were also enrolled in other courses and employed outside of school. Therefore, interviews
that were too long might have deterred potential participants from joining the study. Timing of
the interviews also varied in the other task-based interviews ranging from one single interview
(Wasserman, 2017) to weekly interviews with the participants (Gulkilik, Ugurlu, & Yuruk,
2015). Weekly interviews may be a little excessive whereas one single interview would not be
enough. I decided to see the participants for three hours total, over three separate interviews. This
is more advantageous because it enabled different tasks to be used, made it more likely students
stayed engaged with the tasks, and helped see how the students’ thinking developed over the
course of the study. The participants were interviewed three times over the course of the

45
semester long study: once at the beginning of the study in the first week of the semester, once at
the middle of the study in the seventh week of the semester, and once at the end of the study in
the twelfth week of the semester when the topic of optimization occurs in a first semester
calculus curriculum. The tasks selected had multiple solution methods which enabled students to
demonstrate their thinking and prior skills in the first and second interviews.
Sample size
The sample size for task-based interviews in prior studies has varied. In a calculus task-
based interview, one student was able to provide extremely rich data about his thought process
and shifted his thought from intuition to a more formal solution using the procedural and
conceptual knowledge he possessed (Farmaki & Paschos, 2007). Another geometry-based task-
based interview using the Pirie-Kieren theoretical model involving only one student was also
able to provide detailed and rich data about the mathematical growth of the student as she
progressed through a unit on transformations (Gulkilik, et al., 2020). A task-based interview
study on visual and analytical thinking in calculus that involved two students allowed researchers
to gain valuable insight on the students’ thinking and understanding while being able to make
comparisons between them (Haciomeroglu, Aspinwall, Presmeg, & Knott, 2009). On the other
end of the spectrum, there were studies using task-based interviews and the Pirie-Kieren
theoretical model such as the geometric transformations studies by Gulkilik et al. (2015) that
collected data using the entire class for its sample size.
While most of these studies gathered sufficient data from a very small number of
participants, a wider net needs to be cast to get multiple views on student thought in order to look
for overarching commonalities and differences between the participants. However, attempting to
gather data from an entire class would be unreasonable as students are volunteering to participate

46
in this study. As such, six was the determined sample size to gather sufficient data from multiple
individuals. The interviews were performed with participants on an individual basis. Working in
pairs or small groups was considered as a means to support students’ thinking. A potential issue
that might occur is that one student would do the majority of the talking with the other student
simply agreeing with the other students’ thoughts (Simon, Saldanha, McClintock, Akar,
Watanabe, & Zembat, 2010). This could restrict the interviewer from observing understanding or
lack thereof of concepts or procedures from the subjects because a subject may be able to hide
his or her true ability level behind the ability of another subject.
Traditional versus non-routine problems
Interviewers may gather more insight into student thought by assigning non-routine
mathematics problems with access to multiple tools and representation and by allowing
participants to choose any strategy they feel can help them to make progress towards a
reasonable solution (Heid et al., 1999). The rationale for non-routine problems is to avoid the
participants searching for the one single correct solution method to the problem (Zhu and Tan-
Foo, 2004). In order to gain the best insight into student thinking and development, I selected
tasks with multiple approaches, provided participants with access to multiple tools, allowed
participants to represent problems in a way that makes sense to them, and allowed participants to
choose any strategy to approach the problem.
Choosing the task for the task-based interviews
A concern about choosing the task to be the same topic in each of the interviews is that
the participants’ familiarization with the tasks could turn the task into a trivial task by the time
the second or third interview comes around (Yerushalmy, 2000). It has been found that students
who were relatively low achievers are less likely to see tasks on the same topics as trivial

47
(Yerushalmy, 2000). An important part of developing generalizable knowledge is for students to
see similarities in tasks and be able to identify when prior skills and knowledge can be applied
with new problems. The tasks were selected so that they are not presented in the same manner as
can happen in more traditional problems when just the numbers in the problems are changed. If
students have developed their prerequisite skills and knowledge over the interviews, they should
have been able to apply the understandings in the new tasks. Since the participants for this study
were categorized as having low levels of prerequisite skills, the decision to have the participants
perform a task on the same topic for each of the three interviews was justified and was not likely
to be trivial. Although the participants in the study had low levels of prerequisite skills, they also
possessed different knowledge bases. But this was not a bad thing for this study as differences in
prerequisite skills helped to identify the differences in their ability to solve calculus application
problems.
Using different tasks during each individual interview was considered as each task would
have been genuine and the development of problem-solving skills could be assessed from task to
task. Part of the rationale for choosing different tasks was to see the development of student
understanding of a particular concept and to see if students could make their thinking more
generalizable to be used across tasks (Roh, 2015). Giving the same task during each interview
also generated thorough and rich description of the development of students’ thought process,
procedural and conceptual understanding of a derivative and its antiderivative, as well as any
improvement over time (Haciomeroglu et al., 2009). In the interviews, one task common to all
three interviews was used along with another different task.
The selected problems made it possible for participants to utilize a wide array of
prerequisite skills and concepts. An ideal application of derivative task problem would consist of

48
a function that is cubic in nature such as a volume problem. This type of problem was ideal
because the subjects were required to utilize not only calculus, but also a large amount of
prerequisite skills. The subject needed to understand the geometric formula for volume, a
prerequisite skill. The subjects could also have taken the derivative which is another prerequisite
skill. Upon computing the first derivative, the subjects needed to find the critical values of the
function which required them to set the first derivative, a quadratic function, equal to 0. Solving
the quadratic required knowledge of solving quadratic equations using a variety of techniques
such as factoring or using the quadratic formula which required more prerequisite skills and
conceptual understanding. If the application task also asked about the second derivative,
students’ conceptual knowledge about quadratics would also have be required because the
subjects would have been required to understand that the vertex of the first derivative function
would serve as the point of inflection for the task.
Available resources
The resources that were made available for participants was considered in the design in
this study. Most calculus courses are taught in a procedural manner that does not emphasize
understanding or conceptual knowledge (Leng, 2011). Many problems students are required to
do in a calculus course are often rote and manipulative and hence can be done merely with the
use of pencil and paper (Steen, 1988). Since this study is designed to helping students with low
levels of prerequisite skills develop understanding of procedural and conceptual knowledge to be
able to successfully solve calculus application of derivative problems, I did not want to reinforce
these same ideas in the interviews. Therefore, it was reasonable to provide participants access to
relevant tools that could help promote their understanding of the concepts behind the tasks. A

49
graphing calculator or use of a graphing software and allowing internet access to research
prerequisite or concurrent calculus information was provided for use during the study.
Many of the instructors who teach first semester calculus at the school for this study do
not allow the use of graphing calculators, notes, or textbooks on assessments, but I allowed the
participants to use these tools during the interviews as a way to enhance their understanding of
the material. Providing these tools increased the potential avenues participants could take to
accomplish the tasks during the study. This should have helped students better understand the
concepts as true conceptual understanding is based on being able to demonstrate understanding
through multiple representations (Lesh & Doerr, 2003). If a participant has truly developed
procedural and conceptual understanding of applications of the derivative and can determine
when it is appropriate to use necessary prerequisite skills, then the participants should be able to
solve traditional application of derivative problems on a calculus assessment with and without
the use of a graphing utility.
Participants
The study was conducted at a large public college in the southwestern United States. The
participants for this study were purposefully selected from two classes of students who are
enrolled in a first semester course in calculus. Students who are enrolled in this first semester
calculus course have met the minimum prerequisite requirement for the calculus course in one of
four ways: took the prerequisite Precalculus courses at the college with a minimum grade of C or
better, transferred equivalent Precalculus courses from another institution of higher learning, had
a satisfactory ACT/SAT/Placement test score, or took Advanced Placement (AP) calculus in
high school and scored a 3 or below on the AP Calculus AB exam. At this particular college,
almost all of the students who are enrolled in a first semester course in calculus have a minimum

50
of one semester of calculus required for their degree of interest. In theory, all students enrolled in
calculus should have some of the necessary prerequisite skills for calculus and have some level
of motivation to pass this mathematics course (Sonnert & Sadler, 2014; Bressoud, 2015).
A total of six participants was desired to be selected based in part on demonstrating low
levels of prerequisite skills on an assessment that all students took in the calculus course on the
first day of the semester. Students who chose to volunteer for the study were also given a survey.
The survey consisted of a set list of questions (Appendix A). The purpose of the survey was to
identify characteristics of the participants. On the survey students provided the names of the last
three mathematics courses they have taken, when the courses were taken, and the grade they
received, a self-rating on their mathematics skills, their approach to solving problems when they
do not know how to proceed, information about their study habits, as well as some general
information which included contact information. Due to the pandemic that affected the country
during the time of the study, there were only five students who were classified with low levels of
prerequisite skills willing to volunteer for the study.
Data Collection
The study was one semester in length. Students from a first semester calculus course
were assessed on their pre-requisite skills needed for calculus. The Precalculus Concept
Assessment, which has been found to be a valid instrument, was used to measure prerequisite
skills (Carlson, 2007). The Precalculus Concept Assessment (Appendix B) focuses on the
mathematics needed to move into calculus. To identify a cut off score for students who are
considered to have low levels of prerequisite skills, the data collected from prior work with this
instrument will be used. On the Precalculus Concept Assessment, the critical cut-off score is
50%; 77% of those who scored 13 or above on the 25-question assessment passed with a C or

51
better whereas 60% of those scoring 12 or below earned a D, F, or W (Carlson, Oehrtman, &
Engelke, 2010). The students chose to volunteer to be a part of this study. The Precalculus
Concept Assessment was used to select participants from the pool of volunteers who
demonstrated low levels of prerequisite skills. This assessment was assigned as homework for
students after the first day of class. Students were instructed to work individually on the
assessment, and to do the best that they could on the assessment as this will aid the instructor in
knowing the prior knowledge of students. Having the students complete the assessment in class
would have been ideal, but class time was not available for students to complete the assessment.
Two instructors agreed to work with me on this study to utilize their first semester
calculus class to help gather participants. The first instructor has been teaching college
mathematics for nearly 25 years. This instructor believes in a student-centered approach to
teaching and is very keen on having students collaborate and work in small groups as often as
possible to have students use their prior mathematics knowledge to discover patterns and make
inferences about the new material they will learn prior to teaching the new material. This
instructor has been teaching calculus for over 20 years and is eager to see how the results from
this study can help inform their own teaching of calculus and improve instruction. The second
instructor has been teaching math for 18 years and has taught calculus for 15 years both at the
high school level and at the college level. This instructor is also student-centered in their
teaching and often uses the flipped classroom approach. The idea behind this approach is that
more in-class instruction time can be utilized to work on challenging tasks that require students
to use higher levels of thinking. This way, the instructor can be present to provide guidance and
ask probing questions to develop student understanding.

52
I visited their calculus class towards the end of the first day of instruction to explain the
research and the study. During my visit, I also went over the informed consent process. If a
student was willing to participate in the research, they signed the consent form, provided their
contact information, and gave the form to me. The students were informed that participating in
the study had the potential to help develop their understanding of calculus while simultaneously
providing valuable information that could be used in improving the teaching of calculus. Each
participant was eligible for additional assistance from the researcher with the calculus course at
the conclusion of the interviews for one hour per week as another incentive. The subjects had the
right to accept or refuse the additional assistance from the researcher. Every student gladly
accepted the additional help from the researcher. The five students that were selected to be
interviewed were also sent the student survey electronically (Appendix A) to complete and send
back to me before the first interview.
The selected participants were asked to attend three one-hour task-based interviews. The
interviews occurred at three different points in the semester: the first in the first week of the
semester, the second in the seventh of the semester when students have acquired some calculus
skills, and the third in the twelfth week right around the time students were assessed in class on
application of the derivative.
In each one-hour interview, the participants worked on two applications of the derivative
optimization tasks. The first task was similar in every interview just with a different realistic
context. The same thinking and solution strategies could have been used in these first tasks. This
was a similar approach to the study done by White and Mitchelmore (1996) who looked at
students use of variables in application of derivative problems. Using a similar style structure in
the first task allowed the interviewer to probe the participants into the development of their

53
procedural and conceptual knowledge of optimization, their prerequisite skills, and the strategies
the participants have taken in order to find a solution to the problem. The second task was
different in each interview although the underlying concept was the same: maximization of the
area of a rectangle. Participants were allowed to solve each task in any way they deemed
necessary and were provided with pencil and paper and a graphing utility to graph functions as
they saw fit and to aid with computation. The interviews were semi-structured with a set list of
questions to be asked but allowed opportunities for the interviewer to probe students at key
moments to examine their thinking and probe their understanding or lack of understanding of the
problem. This enabled the identification of any gaps in prerequisite knowledge that may have
prevented the student from successfully solving the problem.
The topic of optimization was selected as the calculus topic for the tasks because students
were exposed to optimization questions in prior math courses. In precalculus, optimization
questions normally appear when students are learning about quadratic functions and serves as an
application to determine if students are able to conceptually understand that the vertex of a
quadratic function serves as the minimum or maximum of the function. These problems also
allow the opportunity to determine if students are able to interpret the vertex of the quadratic
function in context of the problem. This topic allowed the interviewer to gain insight on the
prerequisite skills participants possessed on quadratic functions and their conceptual knowledge
of functions while allowing participants to see application style questions they had encountered
in their calculus class later in the semester. At the time of the first interview, participants have
not learned any procedural rules in calculus, so this also allowed the interviewer to assess how
the participants approached problem solving and the thought process they go through when
solving these problems.

54
For each task, participants were told to solve the problems any way that they would like
and to talk through their thinking out loud as much as possible. Table 1 has the general semi-
structured interview questions that were used across the three interviews. Based on what the
participants describe, follow-up questions were asked in order to clearly understand participant’s
thinking. The questions were also used to probe for any additional understanding that students
had or concepts they were lacking to reach a solution.
Table 1
General Semi-Structured Interview Questions for All Tasks
1. Explain to me what you are thinking?
2. What strategy are you considering using to solve this task?
3. What information do you know that can help you to accomplish this task?
4. What other information do you think is important to know in order to accomplish this task?
Table 2 has the two tasks for the first interview. For each task, just the task was given to
students at the start and not the specific semi-structured questions for each task that follow. The
semi-structured questions were used if students were struggling with how to get started on
solving the problem.

55
Table 2
First Interview Tasks With Specific Semi-Structured Questions
Task 1
A car rental agency rents 200 cars per day at a
rate of $30 per day. For each $1 increase in
rate, 5 fewer cars are rented. For example, if
the rate is $31 per day, only 195 cars would
be rented. At what rate should the cars be
rented to produce the maximum income?
What is the maximum income? (Barnett,
Ziegler, & Byleen, 2003).
1. Find the number of cars that will be rented
if the price of the rental cars is raised to $33
per unit. What will be the rental agency’s
daily income?
2. Compute the income for several different
daily rental rates.
3. Model the income obtained if x dollar
increments are added to the initial price of
$30. That is, write a function to model the
problem.
4. Graph the resulting function from question
3. What does it look like?
5. What should the rental agency charge for
cars to maximize the daily income?
Task 2
The point (x, y) is on the curve y = 24 – 2x2.
Find the positive value for x that makes the
product
A = 2xy a maximum (White & Mitchelmore,
1996)
1. What is the value of x if the length of the
rectangle is 2?
2. What will the height of the rectangle be if
the length of the rectangle is 2?
3. Compute the value of A for various values
of x
4. Model the value of A if the length of the
rectangle increases by 2x. That is, write a
model for the problem.
5. Does it make sense to get a negative value
for x.
6. What value of x will maximize the value of
A?
The second interview with the students involved participants working on a similar set of
two optimization tasks (Table 3). The first task required the maximization of revenue. This is a
different realistic context than the first task on the first interview but could be solved in similar
ways. The second task involved the concept of area, as did the second task from the first
interview. This second interview allowed the interviewer to probe students at opportune times to

56
examine their thinking and understanding of the concepts developed to see if there is any
improvement on the two tasks compared to the first interview. At the time of the second
interview, participants in calculus had learned the procedural rules of derivatives. Placing the
second interview in this time frame gave the interviewer an opportunity to see if the participants
were able to make any conceptual connections between the derivative, the vertex of a quadratic
function, and the minimum or maximum of other polynomial functions such as degree three
cubic polynomials. The interviewer also had an opportunity to see if participants had made any
procedural and/or conceptual gains in prerequisite skills from the first interview and could
determine if the participants had made any improvements in solving the optimization tasks. The
interviewer was also able to gain insight if participants had a conceptual understanding of the
derivative and/or a procedural understanding of the derivative. This was done by probing to find
any gaps the participants may have had in their derivative knowledge and determined if the gaps
were due to the results of their prerequisite skills.
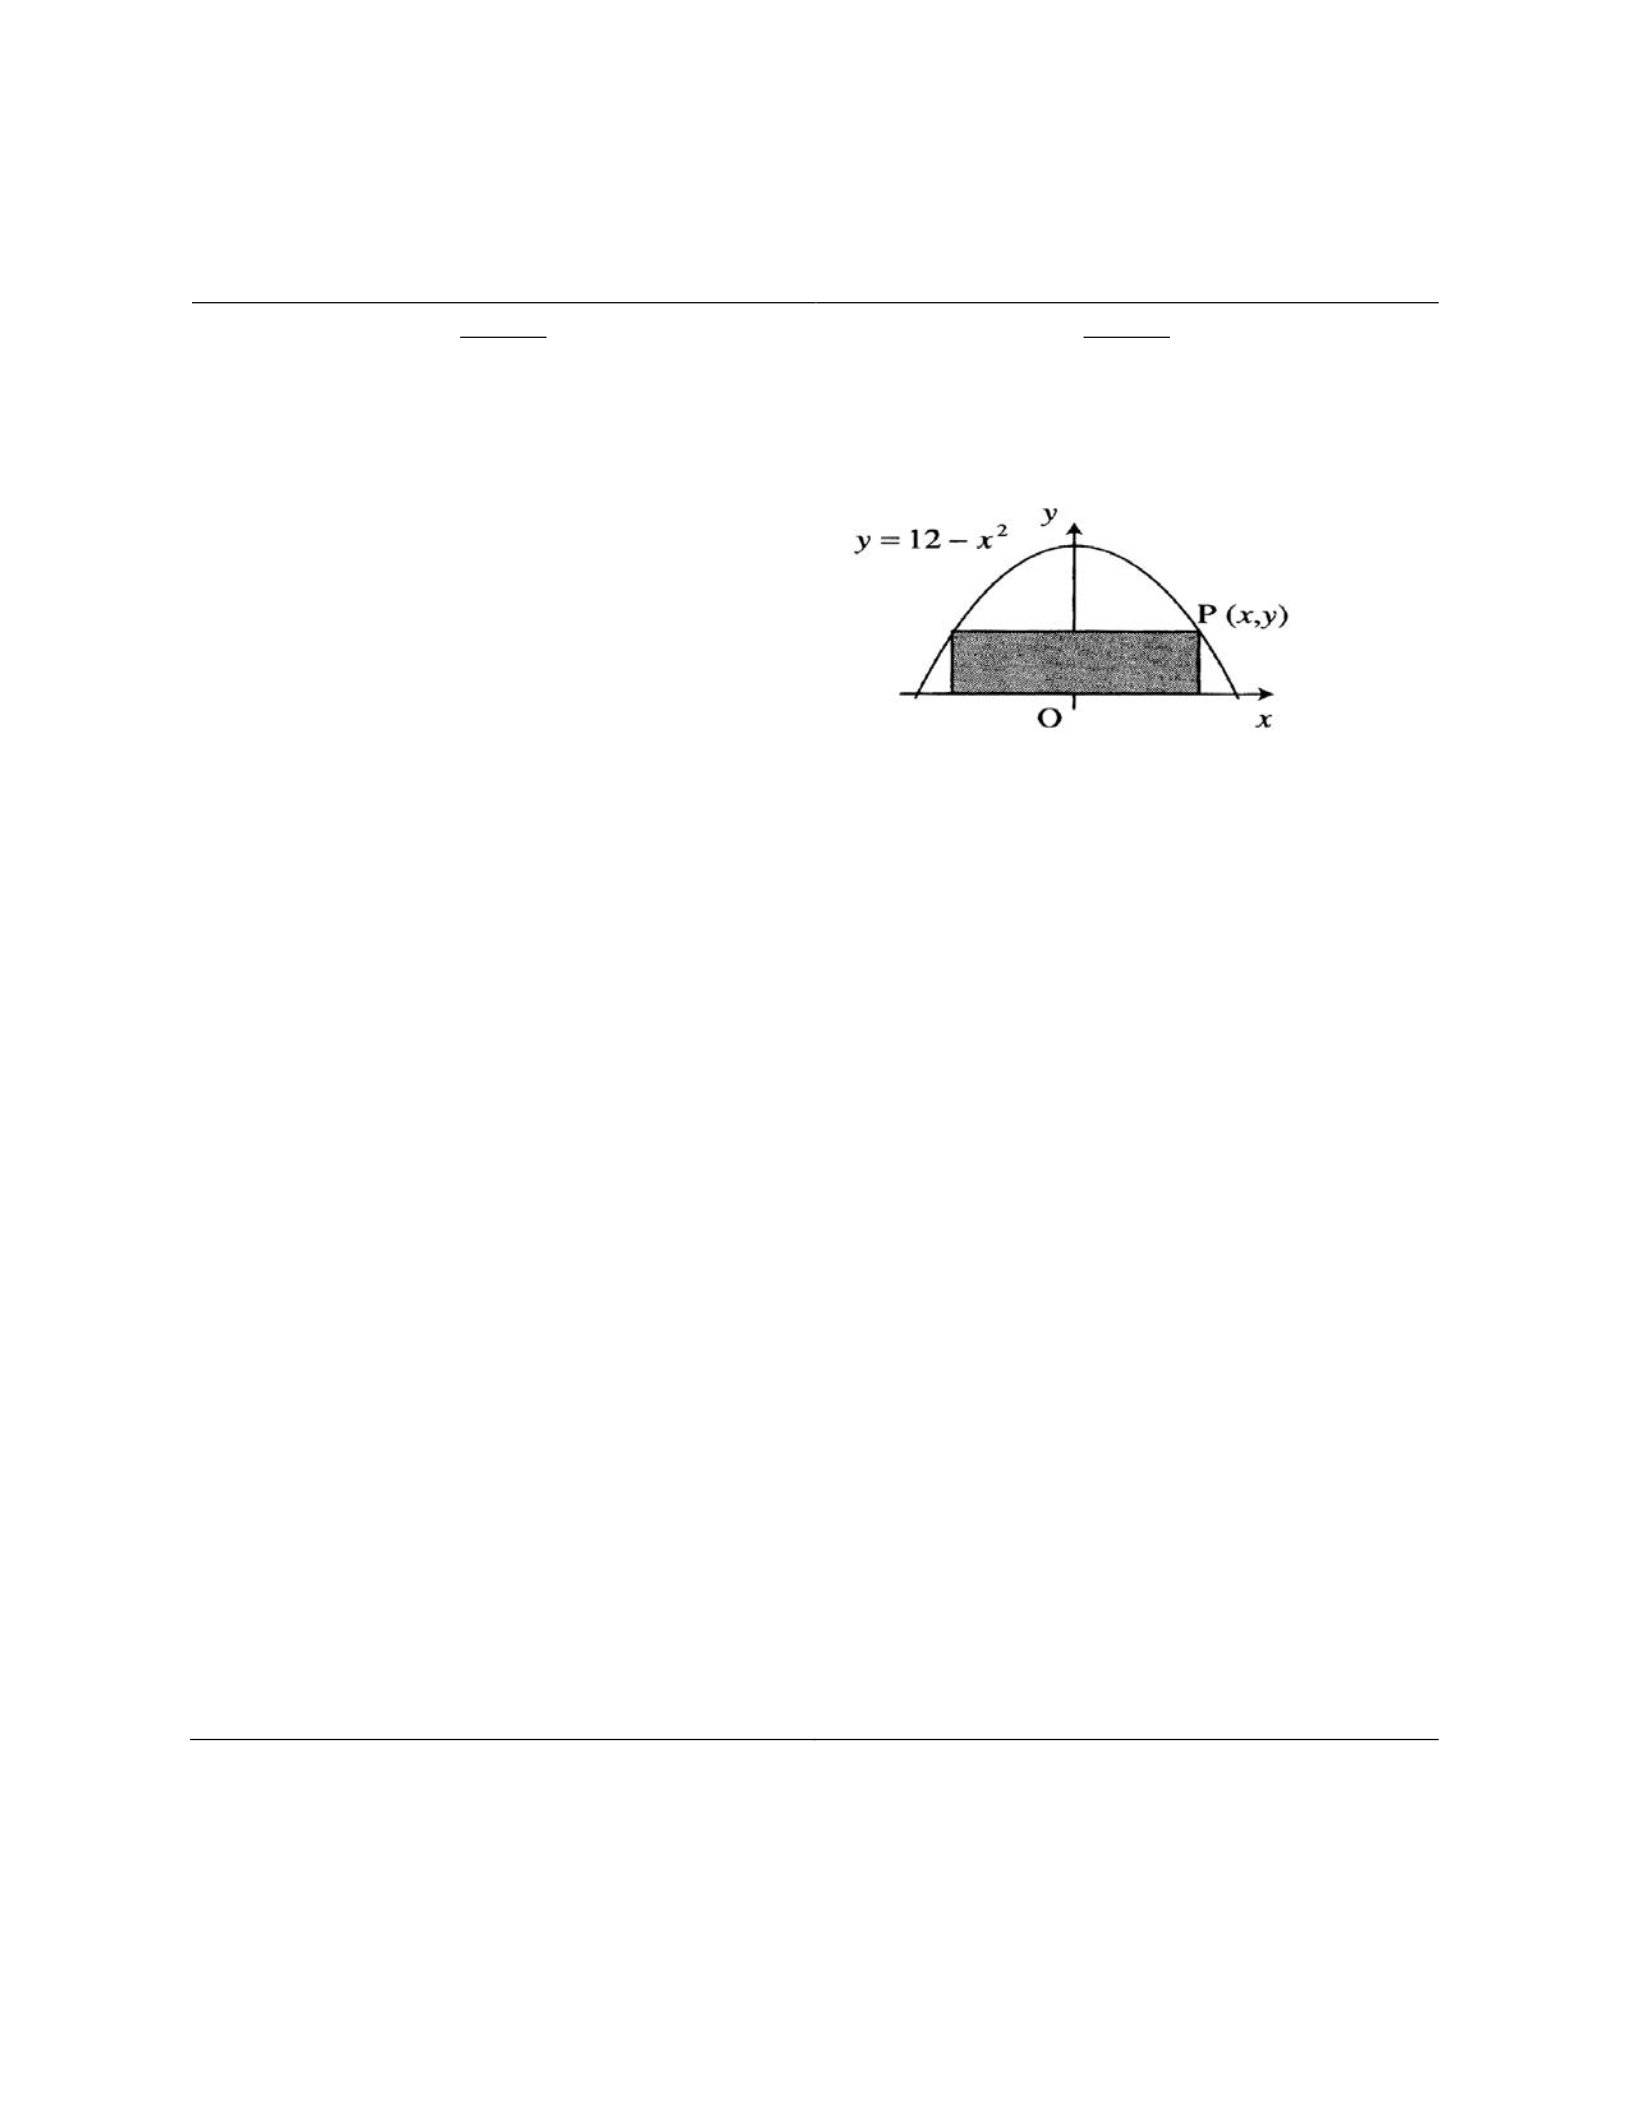
57
Table 3
Second Interview Tasks With Specific Semi-Structured Questions
Task 1
Mr. Yates makes and sells 1,000 of his new
JPads per week at a cost of 350 dollars per
unit. Because the demand is high, he has
decided to raise the price of the JPad, but he is
only considering raises in five-dollar
increments. Market research has shown that
for each five-dollar rise in the price, ten fewer
customers are expected to buy the JPad. Thus,
if the price is 355 per JPad (an increase of
only one five-dollar increment) only 990
customers are expected to buy the item (ten
fewer than 1,000). If the price of the JPad is
set at 360 dollars (going up two five-dollar
increments, then only 980 customers will buy
it. Assuming that the market research is
correct, how much should Mr. Yates charge
for JPads to maximize his revenue? (Gurl,
Artzt, & Sultan, 2012).
1. Find the number of people who will be
expected to buy the item if the price is raised
to $375 per unit. What will be Mr. Yate’s
expected weekly income?
2. Compute the weekly income for several
different prices of the item.
3. Model the weekly income obtained if x
five-dollar increments are added to the initial
price of $350. That is, write a function to
model the problem.
4. Graph the resulting function from question
3. What does it look like?
5. What should Mr. Yates charge for the item
for him to realize his maximum weekly
income?
Task 2
Given the point (x, y) on the curve y = 12 – x2
and a rectangle contained inside the curve as
shown in the figure, find the largest possible
area of such a rectangle.
(White
& Mitchelmore, 1996).
1. What will the height of the rectangle be if
the length of the rectangle is 6?
2. What is the value of x if the length of the
rectangle is 6?
3. Compute the area of the rectangle for
various values of x.
4. Model the values of the area if the length of
the rectangle increases by 2x. That is, write a
model for the problem.
5. Does it make sense to get a negative value
for x.
6. What value of x will maximize the value of
the area of the rectangle?

58
The third one-hour interview involved students working on the final set of two tasks
related to optimization (Table 4). Like the first two interviews, the first task required the
maximization of revenue. The second task revolved around the concept of area but was presented
a different way. The semi-structured interview questions specific to each task are provided in the
table. At the time of the third interview, participants have learned ways to solve various
applications of the derivative including optimization problems. Placing the final task-based
interview in this time frame gave the interviewer an opportunity to see if participants were able
to make any conceptual connections between the minimum or a maximum of a function, the
derivative, and the problem-solving techniques they used in precalculus and how it compared to
the techniques they used in their calculus class. The interviewer also had an opportunity to
extend the concept outside the realm of polynomial functions and see if their concept of function
had improved. This was attempted by giving a different order polynomial such as a cubic or a
quartic polynomial, restricting the domain of the function within bounds, and then asking the
participants to optimize the function in context of the problem. The interviewer was able to see if
participants had made improvements in solving optimization tasks and probe into their strategy
for solving optimization problems. With the knowledge learned in calculus at this point,
participants had the option to choose to abandon their prior methods of solving the problem in
favor of the calculus approach to solving optimization problems. This allowed the interviewer to
determine if participants truly possessed a conceptual understanding of optimization or merely
possessed procedural knowledge on how to optimize a function. The interviewer also probed to
see if participants had made any improvements in their prerequisite skills and if these
improvements were transferring over into their calculus work.

59
Table 4
Third Interview Tasks With Specific Semi-Structured Questions
Task 1
The Golden Gate Casino currently as 102
rooms. Mr. Brandenburg would like you to
figure out how to make the most profit on just
the hotel rooms. On a typical weekend all of
the rooms are usually occupied when the daily
rate is $60 per room. He has found that for
every dollar increase in the daily $60 rate, one
less room is rented. So, for example, if he
charged $61 dollars per room, only 101 rooms
would be occupied. If he charged $62, only
100 rooms would be occupied. Each occupied
room has a $5 cost for service and
maintenance per day. How much should Mr.
Brandenburg charge per room in order to
maximize his profit and what would his profit
be at that rate? (Stohlmann, Maiorca, &
Olson, 2015).
1. Find the number of hotel rooms that will be
rented if the daily rate is increased to $65?
2. Compute the income for several different
daily rates.
3. Model the income obtained if x dollar
increments are added to the initial price of
$60.
4. How does the maintenance fee affect the
model for this problem? Write a function to
model the problem.
5. What should the hotel charge for hotel
rooms to maximize the daily income?
Task 2
Find the largest possible area of a rectangle
with its lower base on the x-axis and upper
vertices on the curve y = 27 – x2. (White &
Mitchelmore, 1996).
1. What will the height of the rectangle be if
the length of the rectangle is 10?
2. What is the value of x if the length of the
rectangle is 10?
3. Compute the area of the rectangle for
various values of x.
4. Model the values of the area if the length of
the rectangle increases by 2x. That is, write a
model for the problem.
5. Does it make sense to get a negative value
for x.
6. What value of x will maximize the value of
the area of the rectangle?

60
Each of the one-hour task-based interviews were video and audio recorded and
transcribed to detect any themes that occurred over the course of the three interviews for each
participant and across each of the participants from interview to interview. The written student
work from the study was collected as well in case the video did not clearly capture this.
Data Analysis
The data analysis involved scoring the Precalculus Concept Assessment, summarizing the
survey data, and analysis of the task-based interview data. The preassessment the participants
took was scored as the number of questions correct as the Precalculus Concept Assessment is a
multiple-choice assessment. The survey data, as well as a brief initial discussion with each
participant in the first interview, was used to provide background and context for each of the five
participants in this study to provide rich description.
The task-based interview data was coded using a deductive coding strategy utilizing a
preset list of categories (Corbin & Strauss, 2008). The categories that were used for the coding
were the eight layers of understanding from the Pirie-Kieren Theoretical Model (Pirie & Kieren,
1994). The participant thought process for each task were described in detail. Using the Pirie-
Kieren Theoretical Model, the layers from the model were used to demonstrate participant
understanding of the tasks and how the participants moved throughout the various layers as they
progressed through the task. A preliminary coding framework for mathematics understanding of
prerequisite and calculus skills (Table 5) was constructed in a manner similar to a mathematics
study using the Pirie-Kieren model done by Yao (2020). The prerequisite skills demonstrated for
each task as well as the prerequisite skills that were lacking were described and how these skills
may have helped or hindered the participants as they navigated through the layers of the Pirie-
Kieren model. After describing each participants’ thought process on each task, comparisons

61
were made across participants for commonalities and differences. Emerging codes that may not
necessarily fit the Pirie-Kieren theoretical model were also explored and noted. Having a
preliminary coding framework and emerging codes helped to strengthen the mapping used in the
Pirie-Kieren model to better determine student understanding (Gokalp & Bulut, 2018).
Prerequisite skills for each task are now described.

62
Table 5
Coding Framework About Layers of Prerequisite and Calculus Understanding
Layer of understanding
Example student actions associated with each layer
Primitive Knowing
• Search for background knowledge related to
application of derivative.
• Retrieve prerequisite knowledge needed to progress
on task.
Image Making
• Graph curve in the stem of the problem.
• Interpret information from task stem to perform
basic computations and make conjectures on how
to proceed.
Image Having
• Generate a formula needed to proceed in the task
without assistance.
• Notice patterns through multiple computations.
• Describe the function, visually or analytically.
• Perform basic calculus procedures without
assistance.
Property Noticing
• Describe properties of functions with calculus.
• Interpret patterns in context of the task.
• Connect calculus procedure with function behavior.
Formalising
• Connect prerequisite concept with calculus
concept.
• Generalize the tasks as mathematically similar.
Observing
• Connect the use of the calculus concept in the task
in a different mathematical context.
Structuring
• Develop a theory that connects multiple calculus
concepts and prerequisite skills demonstrated in the
task.
Inventising
• Create a new concept due to understanding of the
calculus concepts and prerequisite skills shown in
the task.

63
For the first task in each of the interviews, the calculus concept of optimization is applied
through the context of maximization of revenue. In order to complete the first task in each
interview, there are necessary prerequisite skills that are important. These are important for
participants to understand the problem and a possible solution. The participant needs to have
knowledge of quadratic functions. For any quadratic function, another prerequisite skill that is
important for this task is knowing how to find the vertex. An important prerequisite concept that
is critical to accomplishing this task is understanding that the vertex is the extremum of any
quadratic function. The participant also needs to know the formula for revenue being equal to the
price per unit times the number of units sold. Not knowing this formula would likely prevent the
participants from being able to accomplish the task.
In the second task of each interview, the optimization problem dealt with the same
concept of maximizing the area of a rectangle inscribed under the graph of a quadratic function.
However, the task was presented in three different ways. In the first interview, the task was
presented in the most explicit way. The participants were given the explicit area function they
were trying to maximize. The function was geometrically the area of the rectangle, but the
participants may not have recognized the geometric meaning. As a result, this second task in the
first interview required the least amount of prerequisite skills. The most critical skill needed, in
line with the one of the key concepts needed to succeed in calculus, was covariation (Carlson,
Oehrtman et al., 2010). The participants needed to be able to use the quadratic function and be
able to understand that the value of y in the quadratic function changed continuously as the value
of x changed. This allowed students to use the area function and substitute the quadratic function
in for y to produce the area function as a function of a single variable x.

64
In the second interview, the second task was theoretically more difficult as the
participants were not given the area function for the rectangle. In place of the explicit function,
the participants were only given a graph of the quadratic function as well as an image of the
rectangle the participants were required to maximize inscribed under the curve and above the x-
axis. This required more prerequisite skills from the participants. In line with the covariance
concept required in the task from the first interview, this task required the participants to be able
to generate the function for the area of a rectangle on their own. In addition, this task required
participants to have a geometric understanding of distance in the coordinate plane. Looking at
the graph, participants could view the horizontal distance between the y-axis and a point left of
the y-axis as -x because they learn that x-values left of the y-axis are negative. This would result
in the participant concluding that the base of the rectangle will be 0 because they would add x
and -x together to obtain the length of the base. Another prerequisite skill the participants needed
to understand was that geometrically the value of the distance is positive. Participants needed to
consider the horizontal distance from the y-axis to a point left of the y-axis as positive or be able
to compute the distance analytically by subtracting x and -x to obtain the length of 2x.
The second task for the last interview was theoretically the most difficult because they
were not given the image of a rectangle inscribed under the graph of the quadratic function. This
should have been more challenging for the participants because they did not have the graph to
assist them in figuring out the area function of the rectangle. Therefore, the participants needed
to geometrically sketch a graph of the quadratic function and rectangle to assist them in
accomplishing the task. This was in addition to the other prerequisite skills they needed for the
second task in the first and second interview. If needed participants were able to use the graphing
utility they were provided for the interview.

65
One of the reasons for selecting the area of a rectangle under the curve of a quadratic
function as the second task is also to make a connection between the first and the second task.
Both tasks required finding the maximum value of a quadratic function. A student who has
developed conceptual understanding of optimization should have been able to see that at the core
of each task, the tasks are mathematically similar. This allowed the researcher to see if the
participants were able to make this conceptual connection or if the participants viewed the two
tasks as separate tasks that have nothing in common. Being able to make this connection was one
way the participant could have moved into the formal inner layers of the Pirie-Kieren theoretical
model.
The results of this study can inform mathematics instructors on key prerequisite skills
that should be emphasized in STEM track mathematics courses to get students prepared to
succeed in calculus. The results can also provide mathematics instructors an avenue to emphasize
problem solving skills and the development of conceptual knowledge students can use in
calculus and other mathematical based disciplines.

66
Chapter 4: Data Analysis
The purpose of the study was to examine to what extent task-based interviews reveal
students’ prerequisite skills and conceptual understanding for applications of the derivative and
how these skills and understandings develop over the course of the three interviews. Each
participant in the study was classified as having low levels of prerequisite skills at the beginning
of the study, as determined by the Precalculus Concept Assessment (Carlson, 2007).
This chapter presents an analysis of the 15 individual interviews that took place at three
different points during the semester. Each of the five participants participated in three task-based
interviews. The first interview took place in the second week of the semester. The second
interview took place in the seventh week of the semester after students learned procedural
derivative rules. The third interview took place in the twelfth week of the semester after students
learned about applications of the derivative in their calculus course. Each interview included two
tasks for the participants to work on.
The first section of this chapter presents the analysis of the first task-based interview for
each participant. The analysis is presented by describing the results for each participant on the
first task of the interview. Then the analysis is presented for each participant on the second task
of the interview. At the end of each task analysis, an overall analysis of the participants is
presented which highlights the similarities and differences between the participants in terms of
prerequisite skills shown and their paths along the Pirie-Kieren theoretical model. The second
section of this chapter presents the analysis of the second task-based interview for each
participant separated by task. The layout is similar to the first section, but additional analysis is
provided to highlight if students demonstrated an improvement in prerequisite and/or calculus
skills. The analysis describes how the additional skills or lack thereof helped or hindered

67
students procedural and conceptual knowledge on the applications of derivative tasks. The third
section of this chapter presents the analysis of the third task-based interview for each interview
separated by task. The layout is the same as the second section, but additional analysis is
provided to address if students used a similar approach to how they solved the first two task-
based interviews or if they ignored the procedural and conceptual knowledge acquired in the first
two interviews in favor of the techniques learned in their calculus course.
Interview 1 Task 1
The first task in this interview required the participants to maximize the income of a
rental agency. The keys to succeeding in this task is to be able to understand how the price of the
rental car and the amount of cars rented out change together and that the covariational
relationship the product of these two quantities have with the income generated by the rental
agency. The first task in each of the three interviews requires similar keys to succeed. The only
difference is the application context of the maximization problem. The first task of the first
interview is below.
Task 1
A car rental agency rents 200 cars per day at a rate of $30 per day. For each $1 increase in rate, 5
fewer cars are rented. For example, if the rate is $31 per day, only 195 cars would be rented. At
what rate should the cars be rented to produce the maximum income? What is the maximum
income? (Barnett, Ziegler, & Byleen, 2003).
James:
After reading the stem of the task, James tried to recall knowledge from his Precalculus
course dealing with rate and income but was unable to recall the knowledge of how it was used
in context. Not knowing where to begin, he started by “dividing the cars that they rent 200 and

68
since it is 5 cars every dollar, I would divide 200 by 5.” Using the calculator, he correctly got 40.
James is image-making. He did not know how to proceed with the task, so he used the
information in the stem of the task to try and develop a way to complete the task.
James concluded that if he adds $40 to the current rate of $30 given in the stem of the
problem, then the rate that will maximize the income is $70. Confident in his answer, James
believed that in order to proceed with the problem he needed to know how many days each car is
being rented for, stating that “I need a duration. If I know it’s a week, I can multiply seven by the
$70 I got by adding the $40 and the $30.” Knowing that the duration will not affect the outcome
of this task, the researcher told him to “assume that regardless of the rate, all cars that are rented
will only be rented for one day.” The idea behind giving James this piece of information was to
keep things simple so he did not go down avenues that would not get him closer to completing
the task.
Taking the suggestion, James said that “the first 5 would be . . . it would be different after
5 for the next 5.” Unclear of what he is saying, the researcher asked him to elaborate. James told
the researcher that “I mean that the first five would be $30, the next 5 would be $31, and so on.
So, I think that there is a pattern.” At this point, the researcher was aware that James was
misinterpreting the information presented in the stem of the task. The researcher asked him “May
you please reread the task and tell me what you think the information is telling you?”
He reread the task and said “I’m right. The rate of the rental cars increase after every 5
cars. That would be from 6 to 10 because right after 5 that’s when the cars break into the $31
rate.” Certain that he had misinterpreted the stem of the task, the researcher asked James to
provide him with more details about his pattern. James told the researcher that “my pattern
means that the next 5 cars would be rented at $32, the next five at $33, all the way until the last

69
five cars would be rented at a rate of $70 per day.” He was no longer image making. James was
folding back into the primitive knowledge layer because he needed to be able to interpret the
knowledge presented to him in the stem correctly in order to go back to try and create an image
to complete the task.
The researcher told him “Please reread the task once more and I’m going to ask you a
question once you finish. Let me know when you are ready for my question.” He reread the task
and told me “I’m ready.” The researcher asked him a modified part of question 1 of the
structured questions. The following dialogue starting with the researcher asking the question and
James demonstrated his clear misunderstanding of the task.
Researcher: “If the rate of the rental cars is raised to $32 per car, how many cars would
be rented out at this price?”
James: “That would only be from cars 11 to 15.”
Researcher: “So you mean only five cars would be rented at $32 correct?”
James: “That’s right. So now I need to find a pattern that will compute the income the
next five cars that are rented out will be because the rate will be $1 higher than the rate of
the previous five cars.”
After some thought, James seemed to throw out his own pattern but reverted right back to
it in the dialogue that followed. However, he still did not yet understand what the stem of the
problem is asking.
James: “Really I should just graph the $70 and multiply that by the 200 cars that they
have. That would be their maximum income.”
Researcher: “So you mean that at $70, the rental agency would still rent out all 200
cars?”
James: “Well no. At the point where the rate is $70, it would be from 195 cars to 200
cars, but the previous five cars from 190 to 195 cars, the rate would only be $69.”
Based on this misinterpretation, the researcher had to question whether James’ issue was
with prerequisite skills as he has not demonstrated any yet or if his issue was with reading
comprehension because he was still misinterpreting the information despite the stem giving an

70
explicit example. To help him along, the researcher decided to break down the stem of the task
and we had the following conversation,
Researcher: “The rental company is only going to charge one rate for all the rental cars
on the lot and the number of cars the agency will rent out will depend on the rate the
company charges.”
James: “What do you mean?”
Researcher: “The stem of the problem says that if the company charges $31 per car, only
195 cars will be rented out. This means that the remaining five cars that would have been
rented out if the company charged $30 per car will be sitting on the lot unrented.”
James: “So those five cars will make no income?”
Researcher: “That is correct.”
Wanting to check his understanding of the stem of the task now, the researcher decided to
break down structured question 2 into very small chunks. Starting only with information from
the stem, the researcher asked James, “If the rental car company rents out all 200 cars at $30 per
car, how much money would the rental car company make?” He quickly grabbed his calculator
and multiplied 200 by 30 and answered, “the income would be $6000.”
In hopes of keeping James on task, the researcher continued to only use the information
in the stem, and they had the following dialogue.
Researcher: “If the rental company charges $31, how many cars would they rent out?”
James: “Well, you told me only 195 would be rented out with the other five sitting on the
lot.”
Researcher: “Good. So based on this information, how much money would the rental car
company make?”
James: “That would be 195 times 31 which is $6045. That means they’ll make more
money charging $31 even though they only rent out 195 cars.”
At this stage, it was likely James was making his way back into the image making stage.
But to make sure the researcher asked James “If the rental agency were to charge $32 per day for
each rental car, how many cars would they rent out?” James thought about this and told me “That
would be 190.” The researcher was now convinced that he was back in the image making layer
as he was beginning to know how to approach this task. After asking James to compute the

71
income the rental car company will make, he used his calculator and provided the researcher the
correct answer of $6080. At this point James stated, “I can figure a way to try and make a
formula to get that maximum income. There has to be another way.” Based on this context,
James did not want to continue computing incomes to try and complete the task. He just wanted
to get an answer.
Not wanting to sway his motivation, the researcher asked him, “when you computed the
amount of money the rental car company made when they charged $30, $31, and $32, what
calculation did you do?” James replied, “we multiply the x rate by the y amount of cars. So, to
get my pattern, I need the rate and the amount of cars.” This told the researcher that he still was
image making but had not connected that these two quantities are being multiplied to get the total
income.
Trying to keep him moving along the researcher asked James to “compute the number of
cars the agency would rent out if they charged $33 per day?” He responded by telling me, “Oh I
think I found a pattern. I tried to figure out this formula.” Showing the researcher his paper,
James told him, “What I wrote down is 200 minus 5x times 30 plus x and that would equal the
income no matter what at any rate.” While he came up verbally with what might be the correct
model, the researcher knew he had a prerequisite skill issue because on his paper he wrote 200 –
5x • 30 + x. Now the researcher knew that his verbal model was not the correct model. At this
stage, his time for task 1 had expired and we needed to move on to task 2.
In this interview, James only stayed in the first two layers of the Pirie-Kieren model with
most of the time spent in the Primitive Knowledge layer (Figure 3). James remained in this layer
for an extended period of time because it took him quite a while to finally interpret the stem of
the task correctly. The only prerequisite skills James demonstrated was his ability to multiply the
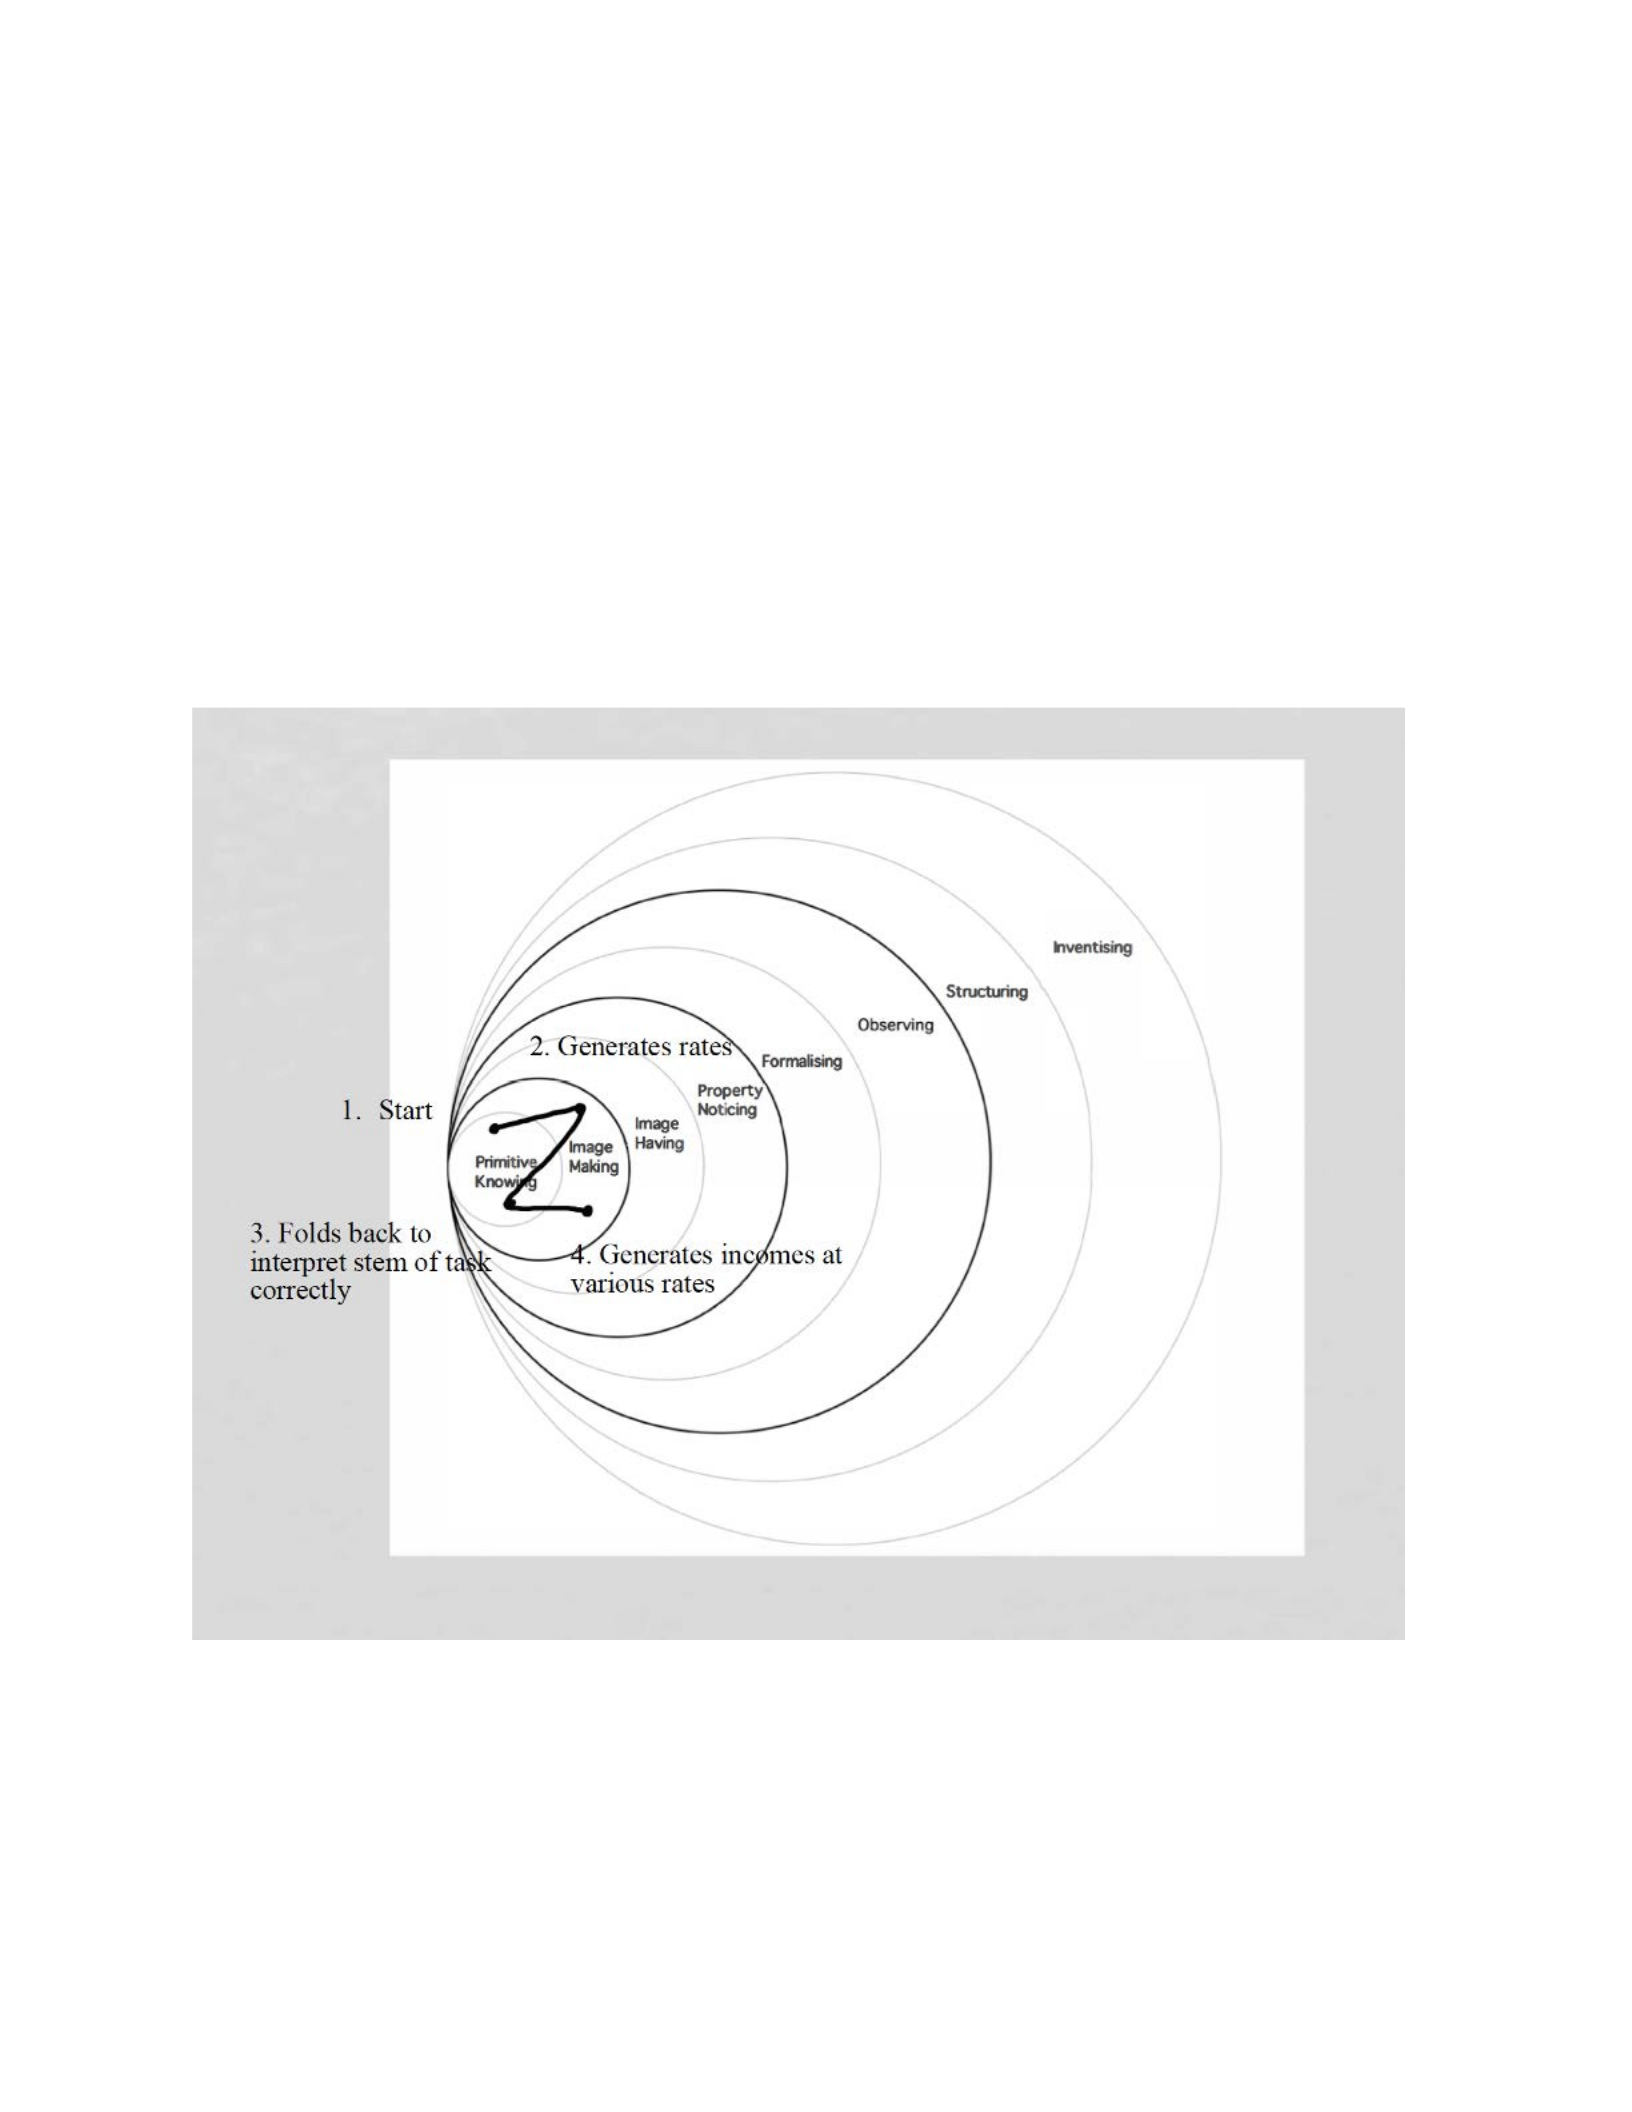
72
rate and number of cars rented out to obtain income. He was not able to translate this into a
formal model as he was missing the parentheses needed to separate the “number of cars rented”
and the “rate”. Lack of correct notation was a prerequisite skill he was missing. While he might
have verbally given the correct model, his mathematical writing of the model was not consistent
due to the parentheses.
Figure 3. Pirie-Kieren Model for James Task 1 of Interview 1

73
Ashley:
After reading the task, Ashley began by using the fact that the rental car company has
200 cars and the detail that 5 fewer cars are rented out for each $1 increase in the rental rate by
dividing 200 by 5 to get 40. She stated that, “this represents the maximum amount of increase
rate you can get.”
Going back to the stem of the problem for more information, she used the fact that all 200
cars are rented out if the rate is $30 per day per car telling me that, “using these numbers I sort of
got 30 over 200.”
The researcher was confused by her intent of using 30 over 200.
Researcher: “What does 30 over 200 represent?”
Ashley: “I don’t know. I’m sort of fiddling with fractions a little bit. Since for every $1
increase, 5 fewer cars are rented, I’ve got 1 over -5 since it decreases.”
Researcher: “So how are going to use these two fractions to help you with the task?”
Ashley: “That’s what I’m trying to figure out. I’m like I just can’t figure out a formula to
get there.”
It was evident from the first exchange between Ashley and the researcher that Ashley did
not know how to approach this task and was finding any combination of numbers and was using
division to try and make sense of them. This placed her in the image making layer.
A few moments pass as she continued writing the fractions on her paper and Ashley told
the researcher that, “I think I’m going to try and create a little graph to see how they would
look.” Because she only had these fractions written on her paper, the researcher asked her, “What
are you going to graph?” Her response was, “I’m treating the fractions like slopes, so I’m going
to use Desmos and try and put in a line with 1/-5 as the slope and the y-intercept as 200.”
Ashley went onto the computer to the Desmos website. She inputted two equations in the
equation toolbar: y = -(1/5)x + 200 and y = 30/200. Looking at the two lines that had been
graphed on the screen, Ashley zoomed the graphs out until she saw what she wanted. Ashley told

74
the researcher, “I have found where the lines intersect so this must be the answer. Looking at the
intersection, for the money at 571.429 and the cars at 85.714.”
Knowing that Ashley did not have the correct answer, the researcher had a dialogue with
her to help her see her answer was not reasonable.
Researcher: “You have the price of cars as $571.429 and the number of cars rented out as
85.714. Is this answer reasonable in the context of our problem?”
Ashley: “That’s what I’m trying to figure out.”
Researcher: “Would it be reasonable to rent out a fraction of the rental car?”
Ashley: “No, not at all.”
Researcher: “So then can your current answer be reasonable?”
Ashley: “I don’t know because I don’t know what else to do. I’ve graphed the slopes and
used the 200 as the y-intercept.”
It is evident that Ashley did not want to move away from the concept of slope in trying to
complete this task. This was not completely incorrect as both the rental rate for the cars and the
number of cars rented out individually have a linear relationship. But Ashley was not aware that
it was needed to consider the product of these two linear components which will produce a
quadratic function. Her biggest issue at this moment was she was using the rental rate of the cars,
$30, and the number of cars rented out, 200, to create one of her lines which is incorrect.
Up to this point, Ashley had not mentioned anything about income. Unfortunately, the
task is asking the student to find the rental rate for the cars that will maximize the income. In an
attempt to get her on track without revealing what she needs to do, the researcher asked her to
read the stem of the problem and tell him what she needs to be able to compute in order to
complete the task. After reading the stem again, she stated, “we need to know the rate, but my
confusion is doesn’t it already tell us the rate?” The researcher was convinced that Ashley did
not know that she needed to compute the income. In an effort to see what she did understand
about the task, the researcher had the following dialogue with Ashley:

75
Researcher: “You are right. The stem does give you a couple of rates. So, what does the
stem tell you about these rates?”
Ashley: “Well, at $30 per day the rental agency rents 200 cars per day. But it says that at
$31 per day the rental agency rents 195 cars per day. I’m just going back and forth about
what is going on.”
Researcher: “That’s true. Based on this information, what are you able to conclude about
the rental agency?”
Ashley: “Wouldn’t that be like if you went down couldn’t you go up to like $70 for
renting 0 cars?”
Researcher: “How did you come to that conclusion?”
Ashley: “Well, the $40 I got by dividing 200 by 5 means I can add $40 to the rate. That’s
how I got $70. But if for each $1 the price goes up, I rent 5 less cars, at $70 they would
rent 0 cars.”
Researcher: “That sounds reasonable. How can you use this information to push
forward?”
Ashley: “Wouldn’t you meet in the middle where you would rent half the amount of cars
for like $50 a day. I cut the $40 in half to get $20, which would make the price $50.”
Based on this dialogue, she demonstrated an understanding about the linear relationship
of both the price of the cars and the number of cars rented out by the rental agency. She just had
not made the connection of putting them together to get the income. Her reasoning was
roundabout, but it is mathematically sound and convinced the researcher that she has some
mathematical understanding of what is going on.
On her paper, Ashley worked on her idea. She told the researcher that, “dividing in half
means 100 cars per day. Does $30 per day means that each car rents out at $30 per day?”
Confirming her question, she continued, “ugh, so EVERY car gets rented out at the same price. I
totally missed that.”
The researcher wanted to see if Ashley was finally on board with what the task is asking.
He asked Ashley, “What can you conclude if the rental rate charges $30 per day?” She quickly
used her calculator and answered, “well at $30 per day, the rental agency rents out all 200 cars.
So, the rental agency would make $6000. Let me keep going.”

76
Using her “middle” numbers, she computed the product of $50 and 100 cars rented out to
get the correct answer of $5000. She then used the other piece of information from the stem and
multiplies $31 by 195 to correctly get $6045. Ashley told me that “this number goes higher. It’s
higher than 200 cars and higher than 100 cars. I’m going to try a number that’s in the middle;
150 cars. Yeah, that really cleared it up that it is $30 per car.”
At this point, the researcher was convinced that she understood what the task was asking
and had a definitive strategy to go about it. On her paper, Ashley wrote down and correctly
multiplied $40 by 150 cars with the calculator to get an income of $6000. Realizing that this
income is the same as the income at $30 per day, she told the researcher, “it doesn’t make sense
to go higher in price, so I’m in the middle again.” She then wrote $35 and 175 on her paper, the
halfway point between $30 and $40 and 200 and 150 cars. Using her calculator, she got the
correct income of $6125. She gave a confused look, and the researcher inquired what was wrong.
Ashley answered, “well I don’t know what direction to go in. So, I guess I’ll go a little bit in
each direction to see which one makes sense.”
With that, she tried $34 times 180 cars and obtained $6120. She then tried $36 times 170
and also obtained $6120. Realizing she had the same income for both rates, she told the
researcher, “These are both lower than the $6125 I just got when I did $35 and 175 cars.
Therefore, the most amount of money they can make is by charging $35 per car.”
In this interview, Ashley was originally stuck in the first two layers of the Pirie-Kieran
model because she did not understand a couple of important things: each car gets rented out at
the same rate and the income was needed to be able to complete the task (Figure 4). Once she
realized these things, Ashley was successfully able to get to the fourth layer, property noticing.
Ashley had a definitive middling strategy about finding the highest income which moved her into
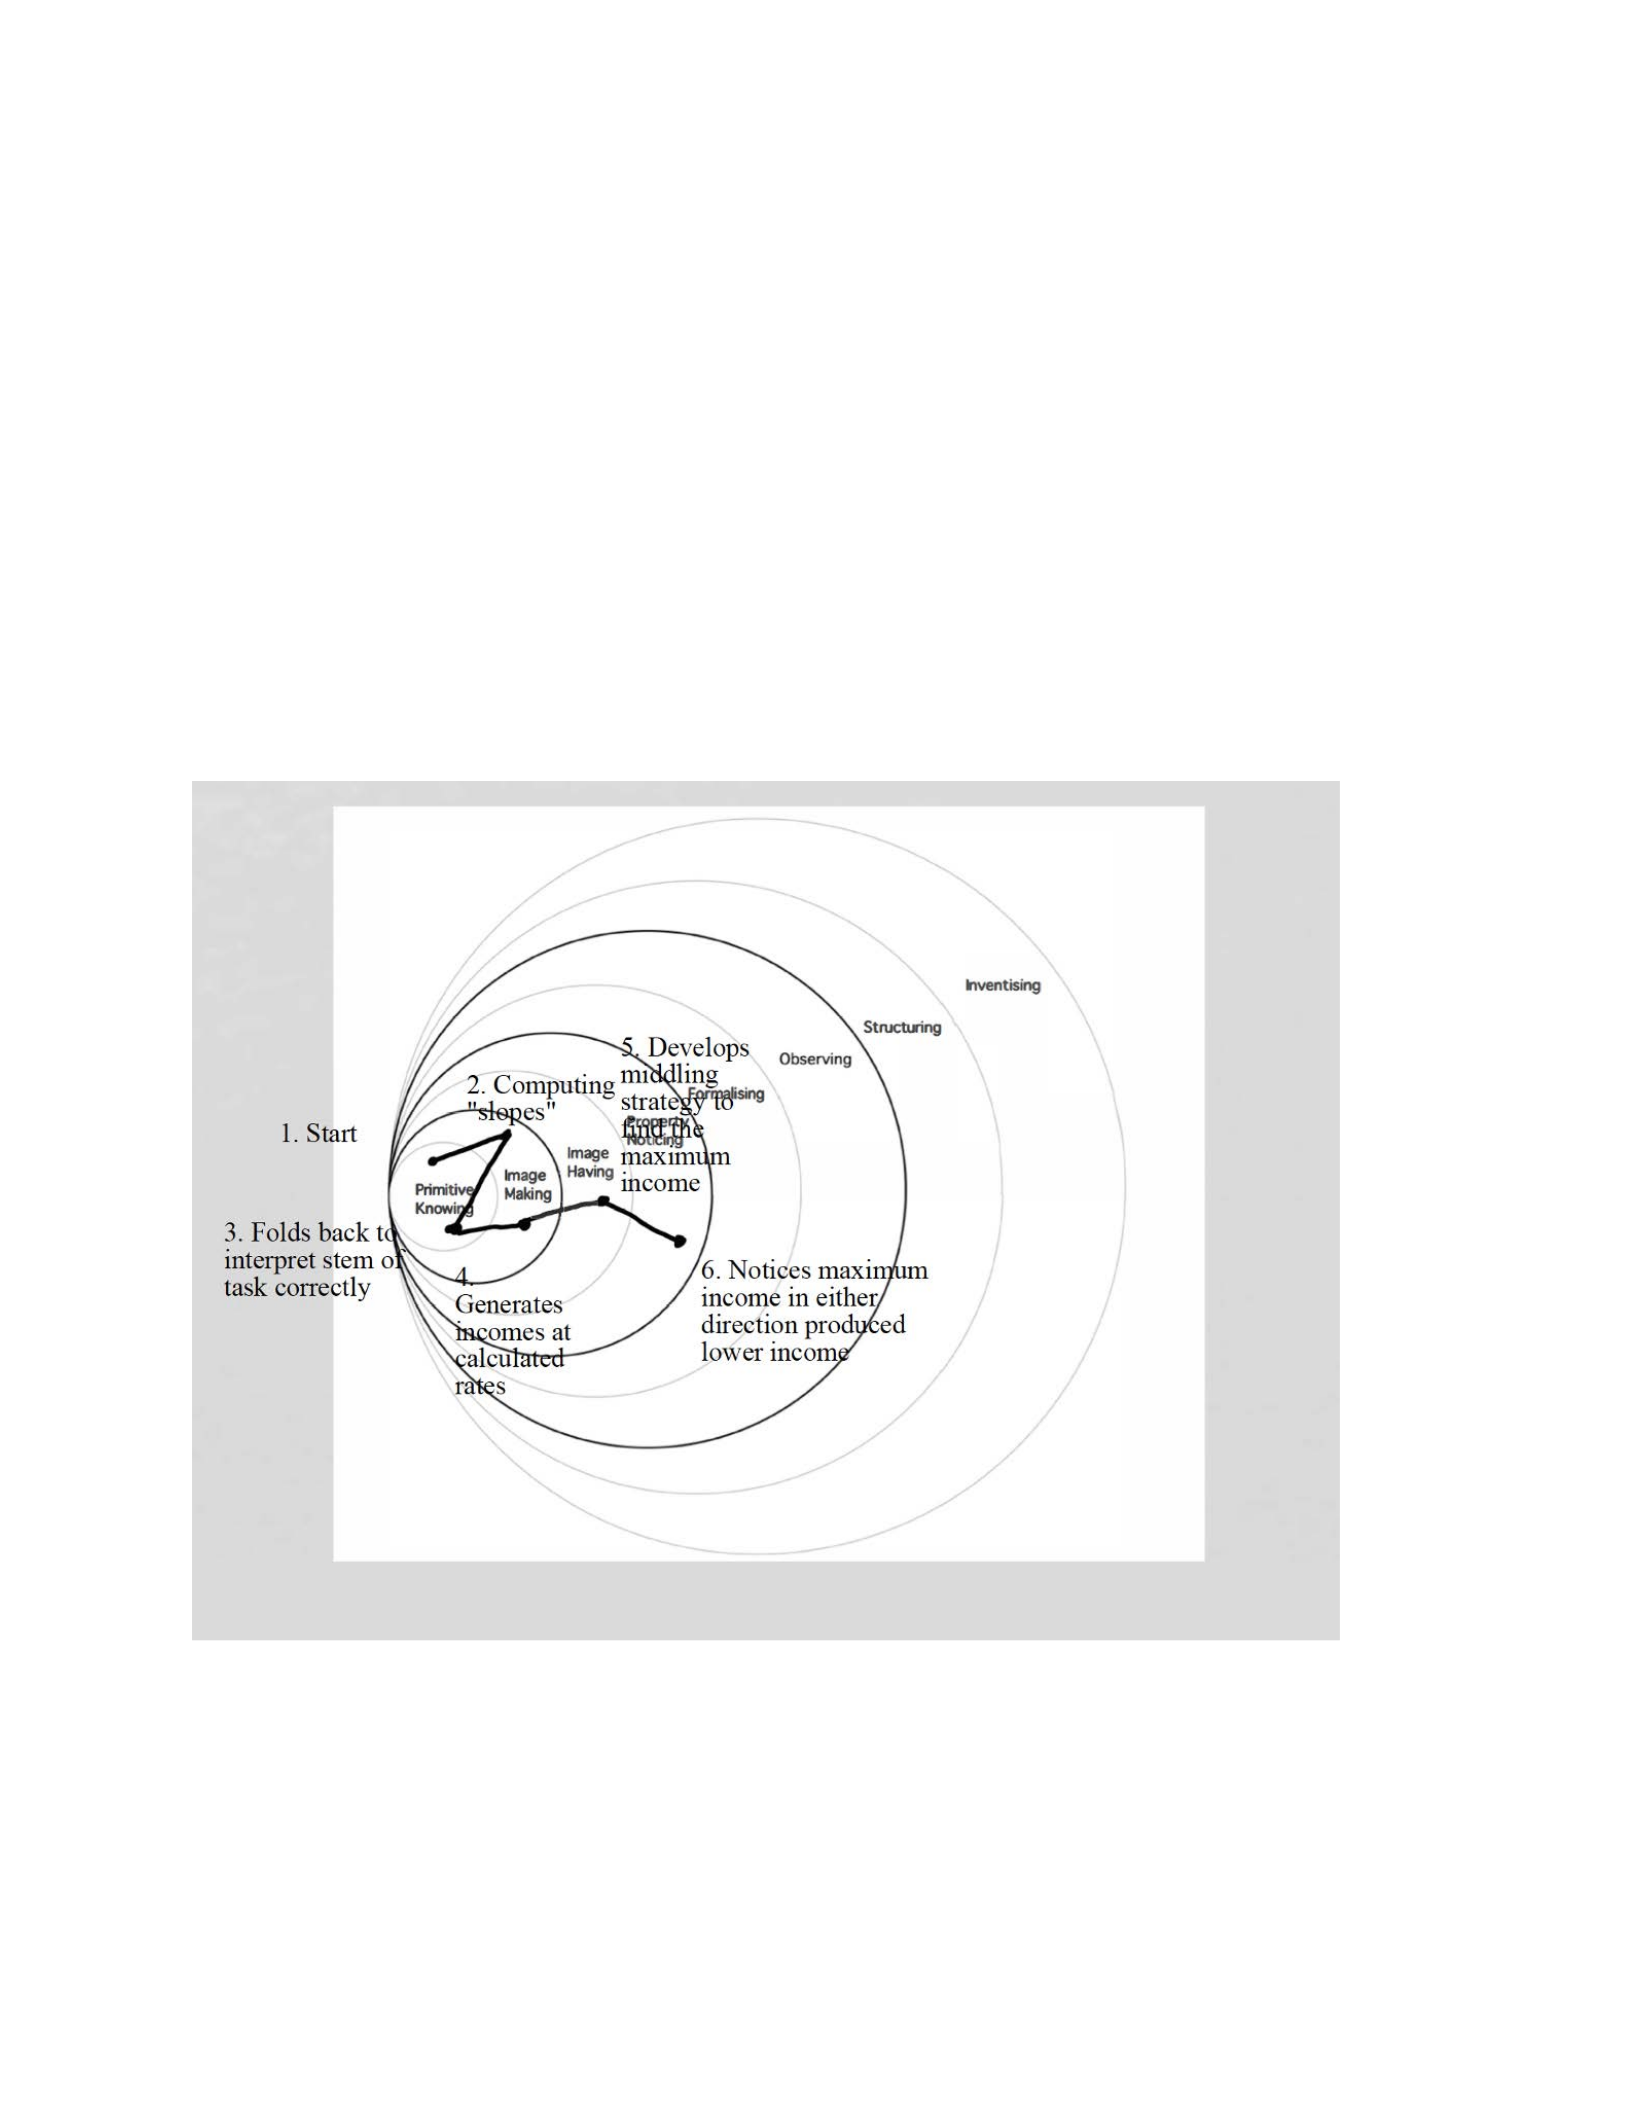
77
the image having layer. At the end, when Ashley was able to correctly notice that at $34 and at
$36 her income was lower than her income at $35 pushed her into the property noticing layer.
Ashley correctly understood that it did not make sense to continue with other rates because the
income in both directions from $35 was lower. Her middling strategy and moving in both
directions when stuck demonstrated her understanding of increasing and decreasing functions
without explicitly mentioning it to the researcher.
Figure 4. Pirie-Kieren Model for Ashley Task 1 of Interview 1

78
Charlie:
After reading the task, Charlie wrote down information from the stem of the problem
onto his paper. Charlie wrote 200 cars and $30 per day. Underneath the $30, he wrote $1
increase, a line and connected it with 5 fewer cars.
Charlie told the researcher, “I think I have found a pattern. Let me write it down on the
paper.” On his paper, Charlie wrote in two columns the following: 32-190, 33-185, 34-180, 35-
175, 36-170, 37-165, 38-160. Charlie continued this pattern until he reaches 44-130. The left
number in the pair represented the price and the right number in the pair represented the number
of cars rented out at that price. Seeing his pattern, it was clear that Charlie did understand the
relationship between the price of the car and the number of cars the rental agency rents out. This
is a key concept needed to complete this task.
After writing out 44-130, Charlie told the researcher, “There has to be a simpler way for
me to solve his problem.” After a period of silence, the researcher engaged in the following
conversation with Charlie beginning with the first general question:
Researcher: “What are you thinking?”
Charlie: “I know if I can find a formula, I can solve this problem really fast.”
Researcher: “What do you need a formula for?”
Charlie: “Since I am trying to find the max income, I need to find a formula for the
income. I just don’t know how to do it.”
Researcher: “Do you know how to compute the income from the rental agency?”
Charlie: “Yeah, I have to multiply the price of the rental vehicles and the number of cars.
That’s why I wrote them in pairs.”
Researcher: “So, how much would the agency earn if they charge $30 per day?”
Charlie: “Let me see . . . I would get $6000. But this does not help me find a formula.”
At this point, the researcher was convinced that Charlie did not really understand that he
was able to complete the task without an explicit formula. Based on prior courses, Charlie was
used to applying given formulas so maybe he believed that he was unable to accomplish the task
without a formula. He stayed in the image making layer while he searched for a formula.

79
Charlie continued to write other numbers and numerical computations down on his paper
in an attempt to find a formula to complete the task. After doing a few more income
computations, he told the researcher, “I guess I have to do this the long way and just compute
incomes.”
On his paper, he did three computations by hand using long multiplication: 175•35,
150•40, and 155•39. His computations yielded the products 6125, 6000, and 6045 respectively.
After getting the third product, he told the researcher, “The rate would be about $70 with the
increase.”
Confused about where $70 came from, the researcher asked him for clarification in which
he said, “I did 200 divided 5 to get 40 which is the price increase of the cars. So, this must be the
price that maximizes income.” This informed the researcher that while Charlie could write down
the price of rental cars and respective number of cars rented out based on the stem, he could not
extrapolate all of his pairing to realize that at $70 the rental agency will not rent out any cars.
Wanting to confirm this suspicion, the researcher asked Charlie, “How many cars would
be rented out if the agency were to charge $70/day?” Charlie was stumped by this question as a
long period of silence follows as he tried to write down possible solutions and think about the
answer to this question. The following dialogue occurred to try and gauge his understanding of
the pattern:
Researcher: “How many cars did the rental agency rent out when the price is $30/day?”
Charlie: “200 cars.”
Researcher: “How many cars would the rental agency rent out when the price is
$40/day?”
Charlie: “Let me see, I wrote that down. 150 cars.”
Researcher: “What if the rental agency charges $50/day?”
Charlie: “Well based on my pattern it would be 100 cars.”
Researcher: “What about $60/day?”
Charlie: “They would only rent out 50 cars.”
Researcher: “How about $70/day?”

80
Charlie: “Well, no cars will be rented out. Oh wait, that means $70 cannot be the rate that
maximizes income.”
The researcher was aware that Charlie has pieces of correct information that were
currently fragmented such as the idea that as price increases, the number of cars rented
decreases. Charlie did not know how to put the pieces together to correctly complete the task.
These fragmented pieces were preventing him from moving further out on the Pirie-Kieren
model.
Charlie began looking at his pairs as well as his hand computation on his scratch paper to
see what he could try to do. After analyzing his work, he told the researcher, “I know the agency
makes more money charging $35/day compared to $30/day, but less money charging $40/day. I
need to try more numbers.”
On his paper, Charlie wrote down and then computed 50•100 on the calculator. He then
drew a line through these numbers on his paper. He repeated the same step using 60•50 and drew
a line through these numbers.
Based on this action, it was apparent that he knew the income was not maximized at these
prices. However, Charlie had not realized he was moving in the wrong direction as the income
was decreasing. Wanting to see what Charlie’s strategy was, the researcher asked him, “What do
you notice based on your current calculations?” Looking at his calculations on his paper, he told
the researcher, “I see that at $30 and $40, the income is the same. It’s higher at $39 and even
higher at $35. So, I’m going to check $34 and $36.”
Using the pairs on his scratch paper, Charlie computed the income at $34/day and
$36/day and realized that each produced an income lower than that obtained at $35/day, Charlie
concluded, “the maximum income is obtained when the rate is $35/day. But I want to find a
formula to solve this problem.”

81
Charlie spent about eight minutes verbalizing his pairs and attempting to generate a
formula to model the income of the rental agency at any price. However, Charlie never defined a
variable to help him out and did generalize that his formula needed to also be a product given
that he computed a series of products in order to complete the task. He finally told the researcher,
“I can’t find a formula, but $35/day produces the maximum income.”
In this interview, Charlie was primarily in the second layer of the Pirie-Kieren model
(Figure 5). Charlie spent considerable time trying to come up with a method to complete the task.
Although he did have many correct pieces of information, Charlie was not able to piece them
together in a meaningful way to push him into the outer layers of the model. Similar to Ashley,
he did figure out that $35/day was the maximum rate by computing the income at both $34/day
and $36/day. However, Ashley had a definitive strategy to get there without needing an image or
folding back to get there and was able to logically reason why $35/day produced the largest
income. In contrast, Charlie stumbled across his answer more by luck trying various approaches
rather than having a reasonable strategy and logically making his way to the solution.
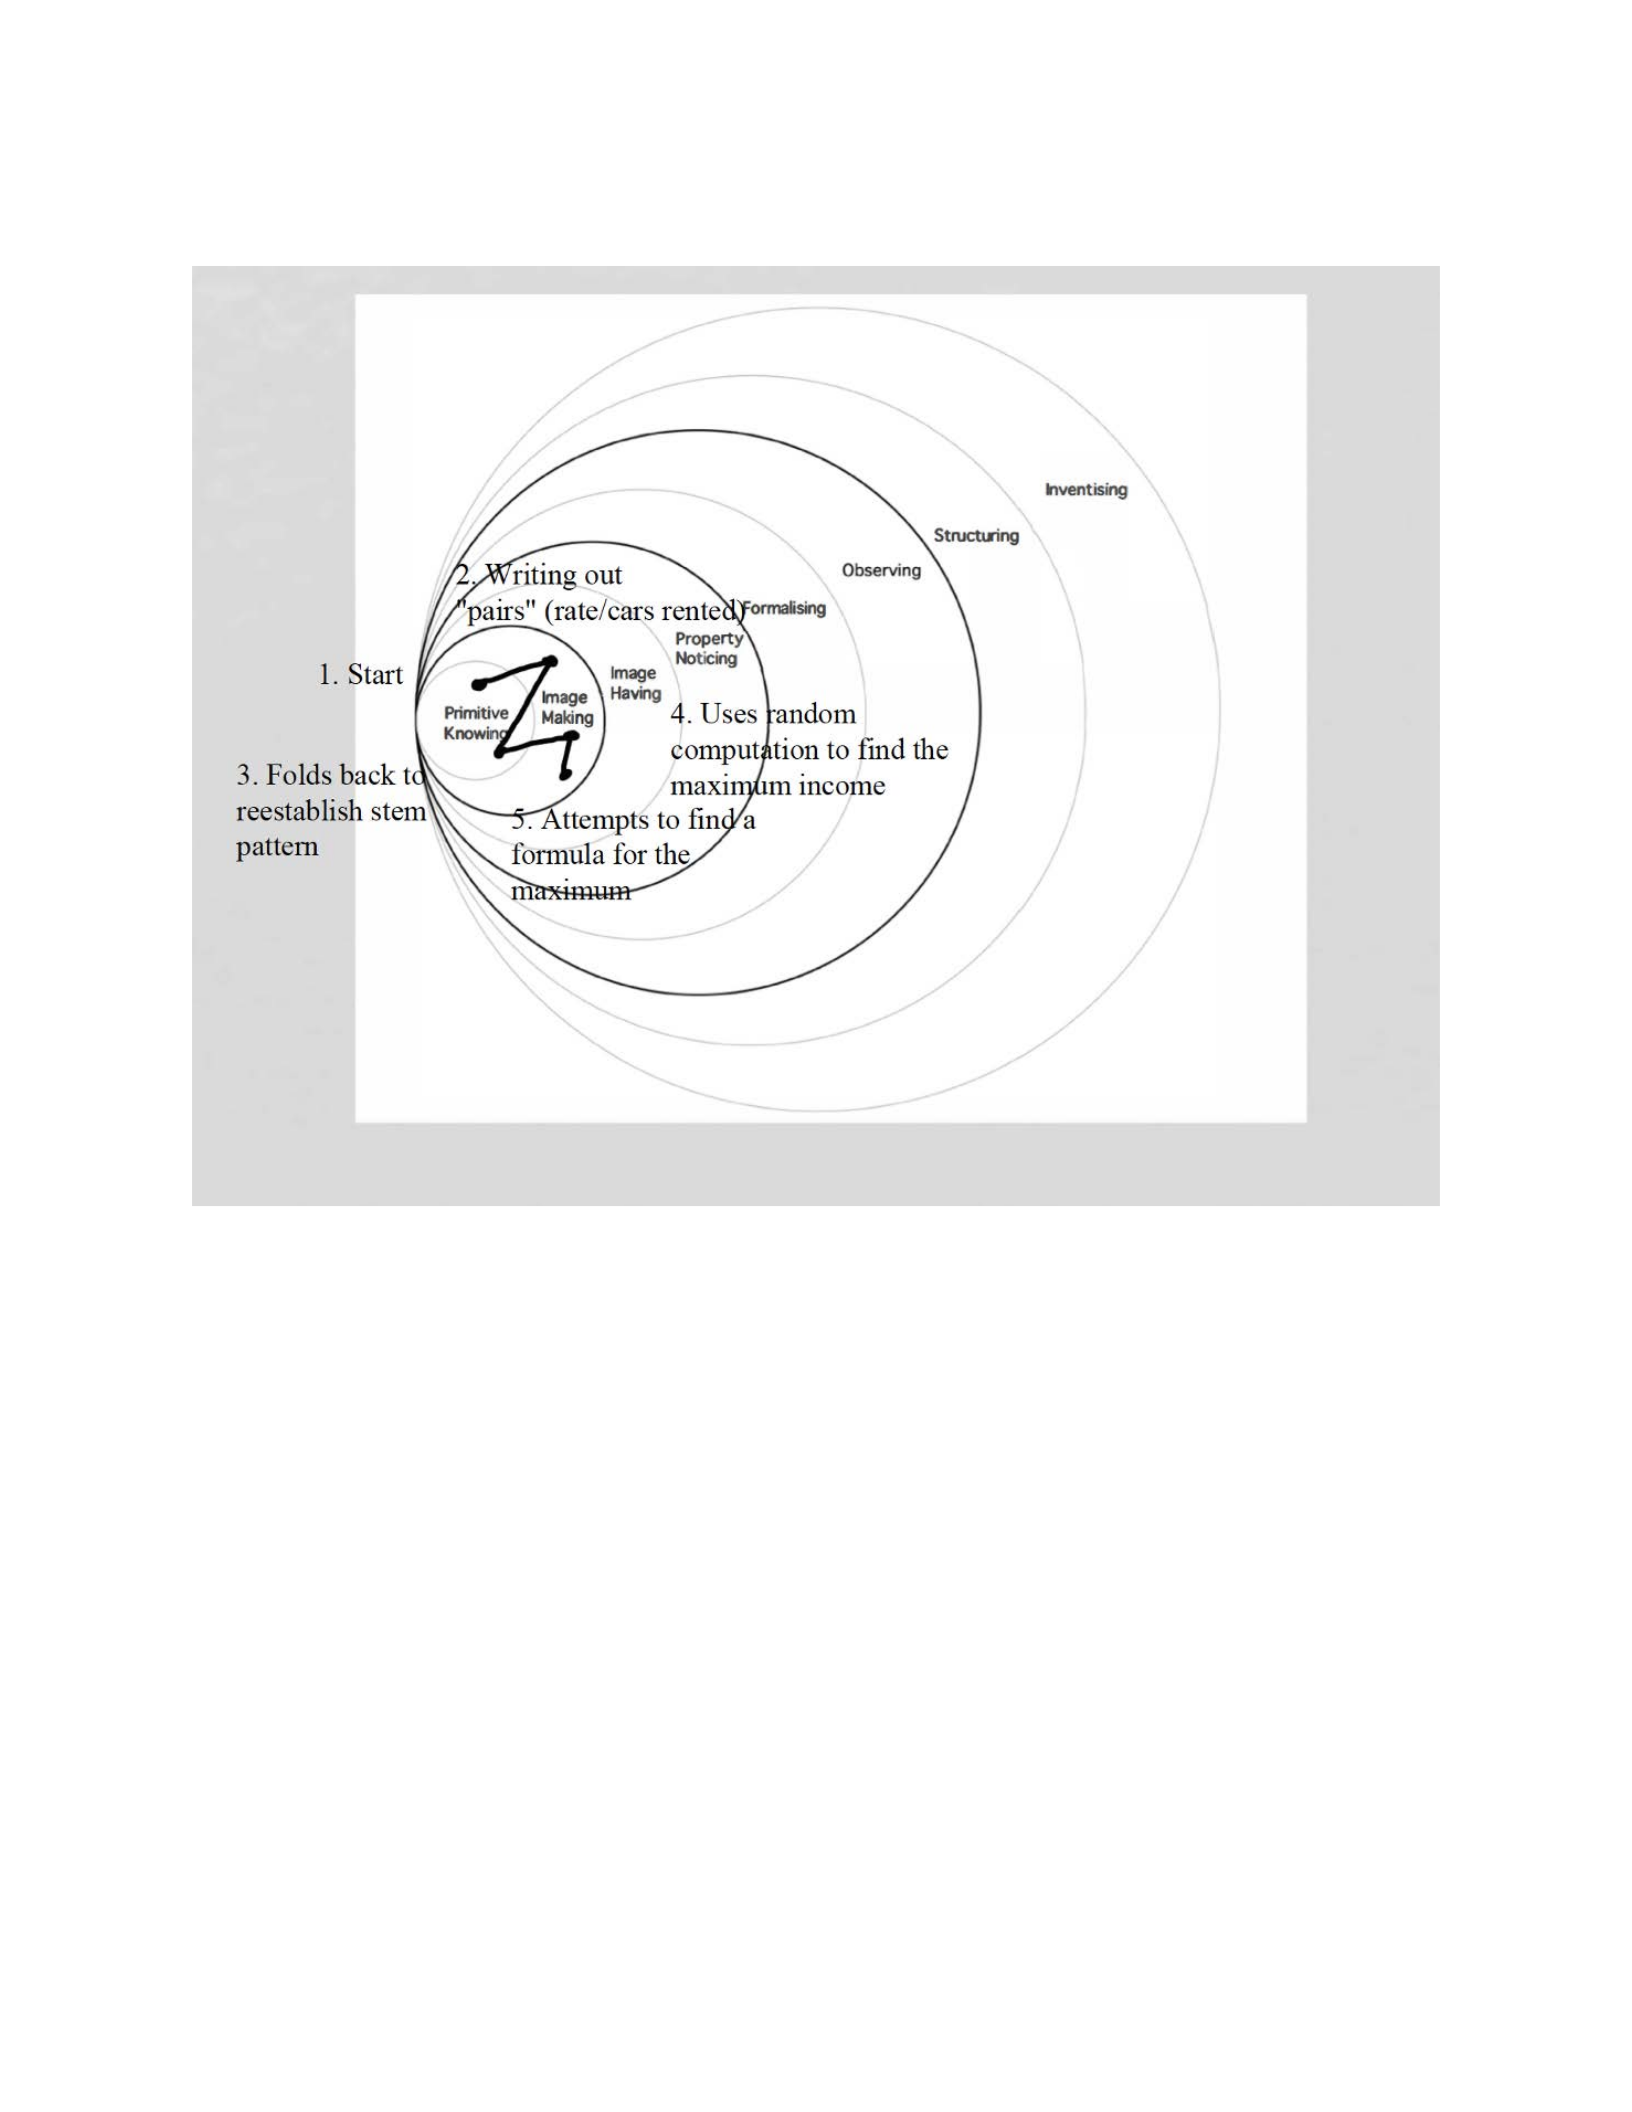
82
Figure 5. Pirie-Kieren Model for Charlie Task 1 of Interview 1
Manuel:
After reading the stem of the task, the first thing Manuel used his calculator to multiply
200 by 30 and wrote this and his product of $6000 on his paper. Manuel told the researcher,
“Since the problem says the rental agency rents out 200 cars when the rate is $30, the company
would make $6000 in income.” This showed that Manuel had an initial understanding of the
information presented to him in the stem of the problem.

83
Manuel spent some time contemplating what to do when the researcher asked him, “What
are you thinking?” Manuel told the researcher, “I can individually go through it until I find the
highest income, but I know I can figure out an equation. I’m just can’t figure it out right now.”
Manuel decided to go through the individual calculations because he did not yet know how to
model the problem. He wrote down some prices, cars rented out, and their associated products
using his calculator to compute the incomes. After computing the first four incomes using the
correct rates ($30, $31, $32, and $33) and number of cars rented out (200, 195, 190, and 185),
the following dialogue between Manuel and the researcher occurred:
Manuel: “I found a pattern. From 200 to 195, they went up $45. From 195 to 190 they
went up $35. And then they went up $25. I can assume that at 180 it will go up $15.
Researcher: “Just to clarify, what do you mean by ‘they’ and ‘it’?”
Manuel: “Oh sorry, I am talking about the income for the rental agency.”
Researcher: “Oh okay.”
Manuel: “After 180, it will go up $5. Finally, it starts to go down.”
Researcher: “Can you please clarify that?”
Manuel: “Yes. So, when 175 cars are rented out at $35, the income will increase by $5.
But when the price goes up to $36, the income will go down by $5. Let me make sure.”
He used his calculator to make the calculations and wrote the results on his paper. Once
he was certain he told the researcher, “Yes I was correct. At $35 and 175 cars rented out, the
income is $6125. But at $36 and 170 rented out, the income is $6120. Therefore, the rental
agency should charge $35.”
I was very surprised how quickly he was able to complete the task. He was able to
complete this task in just over 10 minutes, which was the fastest of all the participants. However,
Manuel was not satisfied with this and told the researcher, “I want to find an equation that will
prove my conjecture.”
He began by writing down work on his scratch paper and after a period of silence, the
researcher asked Manuel, “Can you please elaborate what you are trying to do?” Manuel told the

84
researcher, “I know that I need the price of the cars and how many cars are sold I order to create
an equation.”
At this point, the researcher was convinced that Manuel understood what was going on in
the task and had a strategy to try and generalize it with a model. He began writing out various
ideas and defined n to be the number of cars. On his paper, he wrote (200 – 5n)(30 + n). Manuel
had the correct model but did not realize it because he was defining n to be the number of cars
rather than the amount of the increase in the rental rate.
Looking at his model, he told the researcher, “I know you can do something where you
can take one equation and stack it on another equation. But I don’t retain that knowledge to do an
equation like that.” While he did not know the name of the technique (solving systems of
equations), he did correctly describe what he needs to do. The researcher asked Manuel, “How
many equations will you need to solve a system of equations?” Manuel thought about it for a bit
and said, “I need two equations which I have: 200 – 5n and 30 + n. But oh wait, they’re together
as one so I only have one equation. Never mind.”
After looking at the information on his paper, he told the researcher, “I think I’m going to
see if the incomes I got with the rental price and number of cars rented out works in my
formula.” Using the first four pairs, Manuel realized that he is getting the same income from his
formula that he did multiplying them out. But he did not understand why his pattern he
discovered works. To try and make sense of it, he wrote out the cars rented out on the white
board and the respective rate next to them to see if he can figure out his rate of change pattern.
While Manuel had intuitive knowledge of the second derivative, he had not explicitly learned
about this.

85
The researcher asked Manuel, “So how did you know that your formula worked?”
Manuel told the researcher that, “Well I got the same income come out as what I got when I
multiplied the rate and number of cars together. But that means n is not talking about the number
of cars.” As he wraps his head around this trying to figure out why his model works, he told the
researcher, “I guess I can get a visual to see if I can find out why my pattern works. If I multiply
the two terms together, I’d get a parabola and then we would figure out where the tallest point
is.”
Manuel proceeded to multiply the two quantities together and told the researcher, “So
now my model is y = -5n2 + 50n + 6000, where y is the price.” After graphing the model on
Desmos and setting an appropriate window, Manuel realized that his interpretations of “y” and
“n” are incorrect and told the researcher, “Y cannot be the price. That doesn’t make sense. Y
must represent the income which means n must represent the increase in price.”
With the correct interpretation of the variables in the model, he used Desmos to check his
reasoning. He plotted the points (0, 6000), (1, 6045), and (5, 6125) on the graph and noticed that
all three points are on the parabola confirming his suspicion. Doing some quick computation on
his paper, Manuel definitively told the researcher, “The tallest point is at (5, 6125) confirming
$6125 is the maximum income. If I substitute 5 in for n, then that means the price is $35 and the
number of cars rented out is 175.”
During this task, Manuel spent most of his time in the image having and property
noticing layers of the Pirie-Kieren model (Figure 6). Manuel was able to make a lot of
connections which helped him to find multiple ways to complete the task while demonstrating a
good amount of prerequisite skills. Manuel noticed that the rate of change of the income
followed a pattern which demonstrates his intuitive knowledge of the second derivative despite
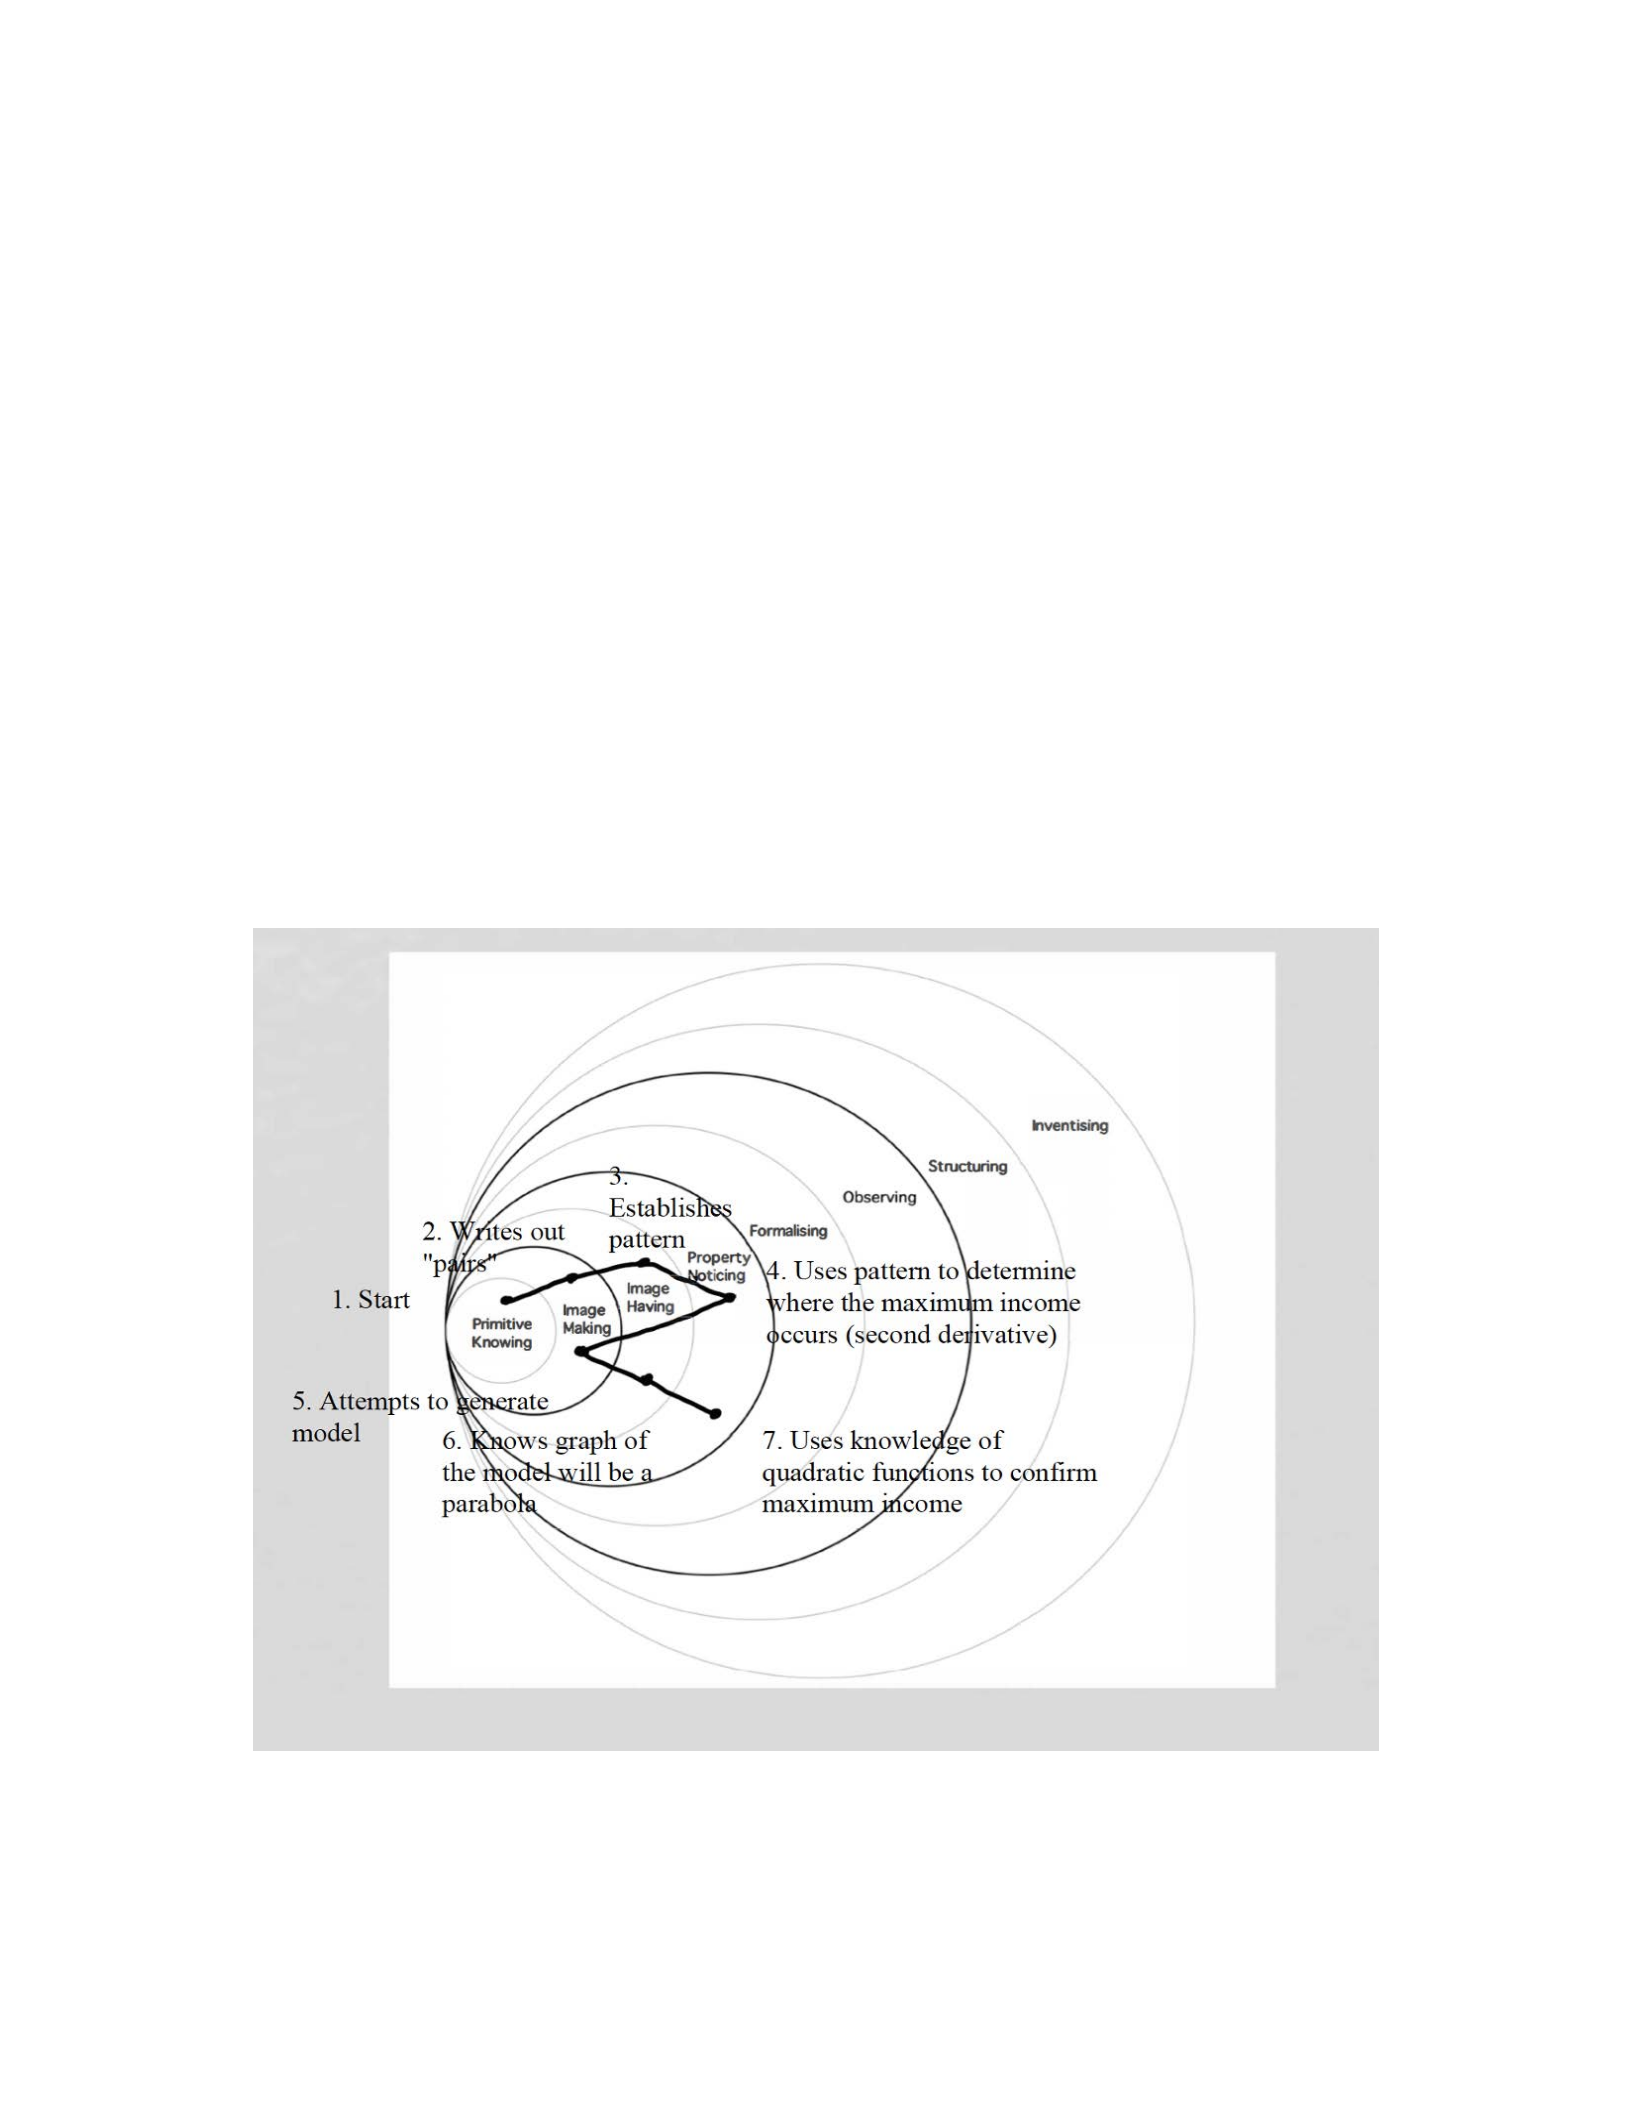
86
not knowing about the meaning of second derivative. This enabled him to make a logical
conclusion about when the maximum income would occur demonstrating his knowledge about
increasing and decreasing functions. In the second solution, Manuel folded back to the second
layer trying to create a more generalized model. However, he showed knowledge about
generating a model from the information, solving systems of linear equation despite now needing
to use it, and critical properties of quadratic functions including its general form, its graph, and
the existence of an extremum (vertex) on all quadratic functions pushing him back into the
property noticing layer of the Pirie-Kieren model.
Figure 6. Pirie-Kieren Model for Manuel Task 1 of Interview 1

87
Lamar:
After reading the stem of the problem, Lamar wrote down all of the numerical
information presented in the data and the fact that he wanted to find the maximum income.
He jotted down some ideas on his paper and verbally told the researcher some of his ideas and
thoughts which led to the following dialogue:
Lamar: “I need two equations and the intersection of the two equations will provide the
maximum income.”
Researcher: “Where are your two equations going to come from?”
Lamar: “I can generate an equation of a line using the information. Let’s see the first
equation will by y = 30x where x represents the number of cars rented out and it’s capped
at 200 cars.”
Researcher: “So, what does your equation y = 30x compute?”
Lamar: “It computes the income the rental agency will bring in.”
Researcher: “What would happen if the rental agency only rents out 195 cars?”
Lamar: “Well then I would plug in 195 for x. Wait this equation will not work because I
don’t know what will happen when the price goes up to $31. Now I’m confused and
don’t know what to do.”
Knowing that Lamar was aware that the daily rate of the rental car and the amount of cars
are changing simultaneously during the problem, the researcher let Lamar write more ideas down
on his paper before interjecting. Lamar told the researcher, “Well at $31, the agency rents 195
cars so that means at $32, the agency rents 190 cars. That’s a pattern and I can find an equation
for this.”
Determined to find this pattern, Lamar wrote down pairs of numbers on his paper: 30 and
200, 31 and 195, 32 and 190, and so forth. Lamar did not compute a single income throughout
this process as he continued to write down correct pairs on his paper. Lamar then told the
researcher, “I think that my equation will have to be a parabola and I’m going to have look for
the peak of the parabola because the peak of the parabola will be the maximum which is what I
want.”

88
Lamar wrote down all the possible integer pairs until he got down to 70 and 0 and
stopped. Wanting to know why he stopped, the researcher asked Lamar, “Why did you stop at
$70?” Lamar responded, “I have written out all the possibilities because at $71 the agency would
rent out -5 cars which doesn’t make sense.” This demonstrated his knowledge of the implied
domain of the function in context of this problem.
Still interested in finding an equation to complete this task, Lamar wrote the equation y =
(30 + n)x on his paper. Because of all the variables on his paper, the researcher asked Lamar,
“What do your variables represent?” Lamar told the researcher, “n is the increase in the price of
the rental cars, x is the number of cars rented, and y is the income. But I’m confused about how
to handle this equation because I have three variables.” Lamar was aware of what his model
should look like but could not yet form it into a model he could mathematically manipulate.
Lamar finally focused his attention on the income and told the researcher, “I know I have
to make the income as large as possible and larger prices should make the rental agency more
money. I’m going to start at $57.”
Lamar began using his calculator to compute incomes on his paper and after computing
three incomes: $57 times 65, $58 times 60, and $59 times 55, he told the researcher, “I see a
pattern of decreasing as the price increases. This means that the income should increase as I
move backwards.” This showed the researcher that Lamar had knowledge of increasing and
decreasing functions.
Going the other way, he computed three more incomes: $56 times 70, $55 times 75, and
$54 times 80. Looking at the three values Lamar informed the researcher, “I was right. Income is
increasing as I go backwards, so I’m going to continue until I see decreasing again because I
know this is a parabola type equation.”

89
Lamar continued using his calculator to compute the incomes by decreasing price until he
computed $34 times 180 to correctly obtain $6120. At this point Lamar explained that, “At $34,
the income is decreasing again. That means that the maximum income must occur at $35 when
the agency rents out 175 cars making the max income $6125.”
After the researcher congratulated Lamar for his reasoning to provide a solution for the
task, Lamar told the researcher, “I have all of these points and I know I can make a parabola
from this. I’m going to figure it out.”
He went back to his original equation of y = (30 + n)x, and substituted in some of the
values from his pairs of numbers. He told the researcher, “At the maximum income, y is $6125,
n is 5, and x is 175. I just don’t know how to tie these together.” The researcher was aware that
Lamar had a reasonable model, but needed to make the connection between the simultaneous
behavior of rate and cars rented out so the model only has one variable.
Researcher: “Can you tell me the relationship between the price of the rental car and the
number of cars the agency rents out?”
Lamar: “Yeah, when the price of the cars go up by $1 the rental place rents out 5 less
cars.”
Researcher: “Could you use that piece of information to try and tweak your equation a
little bit?”
Lamar: “I have an idea. I’m going to do write something similar to what I did with 30 + n
which is the price. If I do the same thing with the cars, it’s going to be 200 – 5n since we
rent out 5 less cars.”
Researcher: “So what would your new equation be?”
Lamar: “Well it doesn’t make sense to have n as the variable. I’m going to write it in
terms of x so I can do algebra with it.”
Lamar proceeded to change the equation so it was in terms of x and wrote y = (30 +
x)(200 – 5x) on his paper. He explained to the researcher that the x-axis represented each $1
increase in the rate. Lamar then multiplied the two binomials on the right side and after
simplifying got the equation y = -5x2 + 50x + 6000. To confirm that his equation was correct, he
substituted a couple of values from his numerous pairs and got consistent answers. Finally, he

90
told the researcher, “I plugged in 5 for x into my equation and got $6125 come out for y, so
$6125 is definitely the maximum income and the rate is $35. Now I know my answer is correct.”
In this task, Lamar spent most of the time in the image making and image having layers
of the Pirie-Kieren model (Figure 7). Lamar did make his way into the property noticing layer
during his analysis of the pairs and making a connection to the increasing/decreasing behavior of
quadratic functions. Lamar did fold back into the image making layer in his second solution
when he worked to create a model. But he successfully made it back to the property noticing
layer to confirm his initial solution with the correct quadratic function model. Lamar did use a lot
of prerequisite skills in this task. He knew how to compute the income to the rental agency, had
knowledge about quadratic functions, could talk about implied domain by knowing the price
could not exceed $70 in context, and showed great algebra skills in multiplying out the two
binomials in his equation and simplifying correctly to confirm his answer to the task.
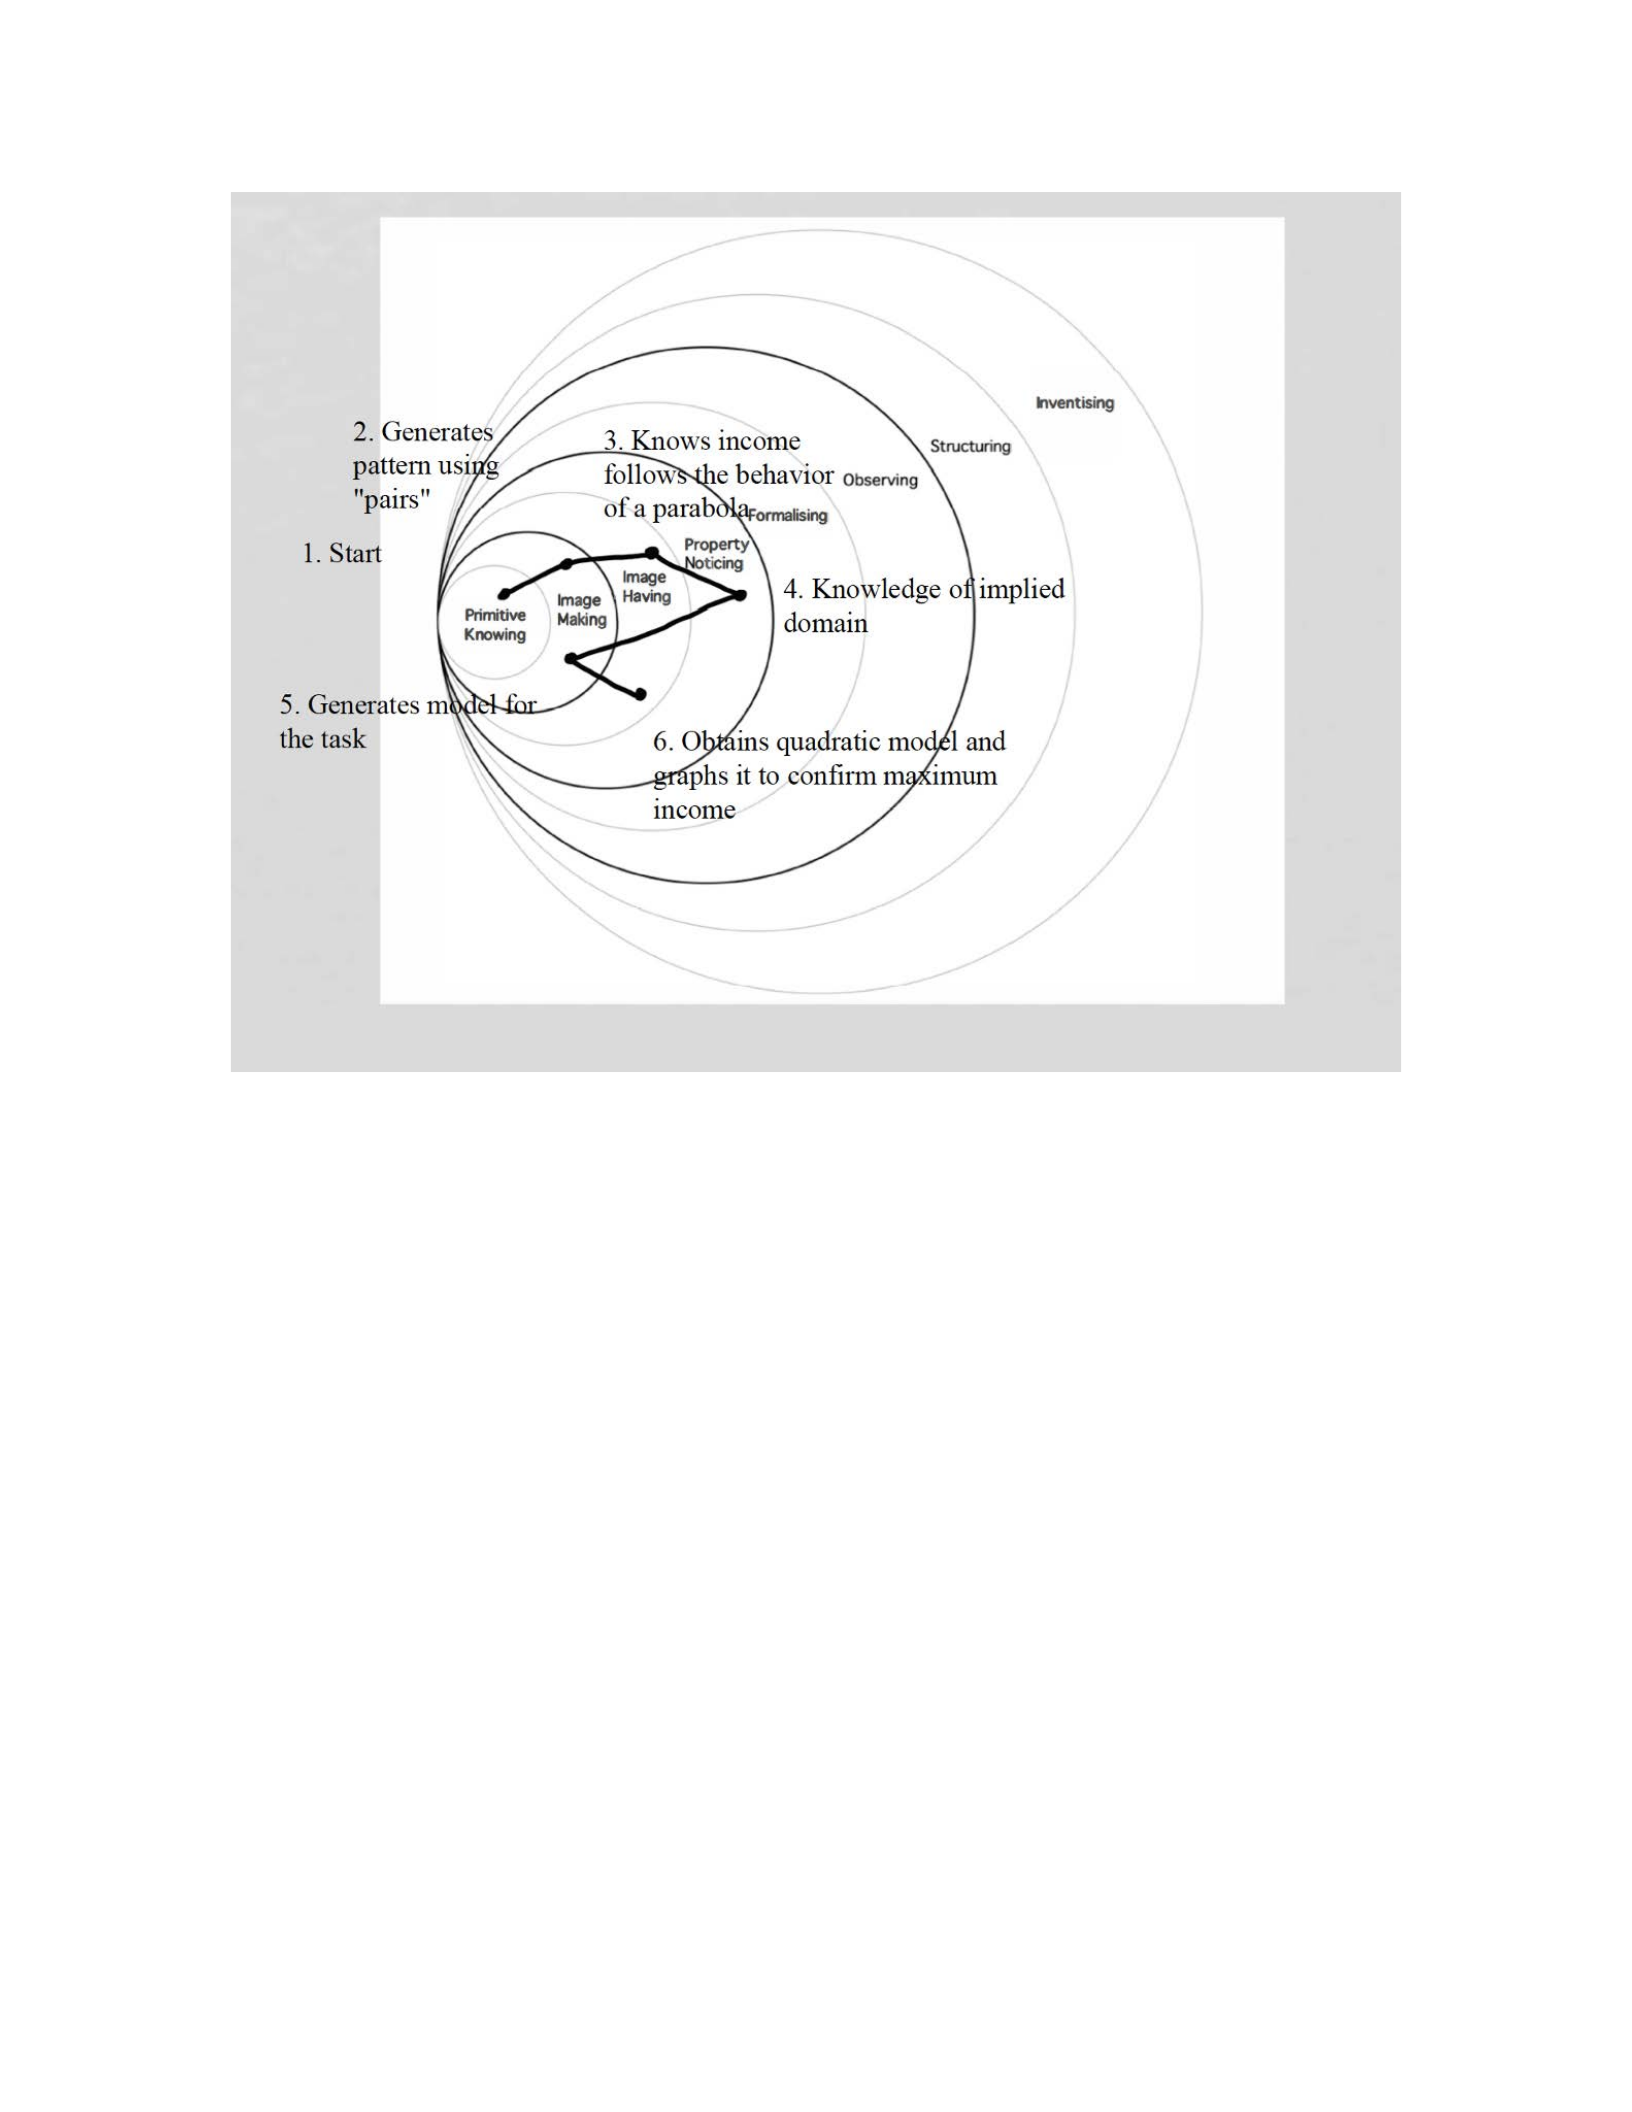
91
Figure 7. Pirie-Kieren Model for Lamar Task 1 of Interview 1
In this task, each participant eventually demonstrated the prerequisite skill of computing
income as the product of the rental rate and the number of cars rented out. Two of the five
participants, James and Charlie, did not really demonstrate any other prerequisite skills in this
task. James struggled with comprehending the stem of the task. Charlie possessed many correct
pieces of information, but the pieces were fragmented in his mind and his lack of conceptual
knowledge prevented him from putting the pieces together to make progress. The other three
participants demonstrated more prerequisite skills and conceptual knowledge. Each of the other
three participants clearly demonstrated an understanding of increasing and decreasing functions,

92
although each had a different way of showing this understanding. Ashley used a “middling”
strategy to demonstrate this understanding. Manuel used intuitive conceptual knowledge of the
second derivative to demonstrate this understanding. Lamar took a more brute force approach
computing several incomes, but he knew to “change direction” when the overall income was
decreasing and to keep going in the same direction when the overall income was increasing.
Their knowledge of increasing and decreasing functions allowed each of them to develop a
successful strategy to complete this task. On the other hand, James and Charlie struggled because
they did not have or failed to demonstrate their knowledge of increasing and decreasing
functions. This missing prerequisite skill hindered their ability to come up with a strategy to
complete the task. Charlie was able to provide an answer, but he stumbled on the right answer by
chance as opposed to him reasoning his way to the correct answer.
Interview 1 Task 2
The second task in this interview required the participants to maximize a function A
subject to the point (x, y) associated with the function being on a given parabola. The only
prerequisite skill the participants needed to successfully complete this task was the covariational
behavior between x and y on the parabola and that this behavior affects the function A. Once
they understood that the value of y on the parabola continuously changes as x changes and
depends on x, participants should be able to complete the task. All the second tasks in each of the
three interviews require participants to maximize the area of a rectangle, but the amount of
prerequisite skills required increases in later interviews. The first interview requires the least
amount of prerequisite skills because they were explicitly given the area formula. In the other
two interviews, the participants were required to generate the area function on their own. The
second task of the first interview is below.

93
Task 2
The point (x, y) is on the curve y = 24 – 2x2. Find the positive value for x that makes the product
A = 2xy a maximum (White & Mitchelmore, 1996).
James:
Upon reading the stem of the problem, James went to the computer, accessed Desmos,
and began by graphing y = 24 – 2x2. Looking at the graph, James correctly concluded that the
graph is a parabola. As he read information from the stem out loud, he told the researcher, “It
should be on the right side here so I shouldn’t even look on the left side.” This is a correct
conclusion which led the researcher to conclude he had a basic understanding of how he should
use the parabola in the task. As he continued to try and find a strategy to tackle this task, James
was stuck because he did not “understand how to make the product A = 2xy a maximum.”
To try and gauge his understanding, the researcher engaged in the following dialogue
with James:
Researcher: “What can you conclude if you know that x = 1?”
James: “Well . . . , if x = 1, then y would be . . . wait let me get my calculator. Um, it
would be 22.”
Researcher: “Okay, so if you know that y would be 22 what can you tell me about A?”
James: “Wait let me do my calculation. So, 44 would be A.”
Researcher: “That is reasonable. What can you tell me about the value of A if x = 4?”
James: “Um, let’s see y would be negative. So what I would be obviously thinking is that
at the tip-top of my parabola that should be the maximum of A.”
Researcher: “So, what is the value of A if you use the tip-top of your parabola?”
James: “Well, x is 0 and y is 24. So that means that if I were to 0 into my equation for A,
I’d get 0.”
Based on this conversation, the researcher knew that James could correctly apply the
formula for A given an explicit value of x. James realized he needed to use the right side of the
parabola because he needs a positive value for x. But James showed a lack of understanding in
two spots: indicating that getting a negative value for y would result in A being negative, and

94
that using the vertex of the parabola (0, 24) is not reasonable because x = 0 is not a positive value
of x.
James was figuring out what was going on and zoomed the graph of the parabola in and
out while telling the researcher, “What would be the peak be?” The researcher was not sure if
James was referring to the parabola in the stem or to the function A. To clarify, the researcher
asked James, “What do you mean by the peak?” James responded, “Well, the peak of the
parabola didn’t work because A was 0, but I got A as 44 earlier.” This indicated to the researcher
that James was referring to A when he talked about the peak because he knew the vertex of the
parabola would not maximize the value of A.
After some thought, James stated, “I’m going to figure out if there is any other value of x
I can put in that could increase the value of A to find the maximum. I’m going to start with x =
0.2.”
Before the researcher could interject, James inputted x = 0.2 into Desmos and used the
graph to correctly get the y-value of 23.992. Using his scientific calculator, he correctly
computed the value of A as 9.5968, which James told the researcher, “This is nowhere near the
44 we got when x was 1. So, based on this x = 1 would be the maximum.”
Confused about why James all of a sudden declared x = 1 as the maximum with testing
only one additional reasonable value for x (x = 4 and x = 0 are not positive), the following
exchange occurred:
Researcher: “Why are you concluding that x = 1 yields the maximum value?”
James: “Because it is the highest of all the values of x that I computed.”
Researcher: “So, there are no other reasonable values of x you could try?”
James: “I guess there are, but they’ll be lower than the 44 I got for x = 1?”
Researcher: “How can you be so sure?”
James: “Because all the other values I got are nowhere near 44.”
Researcher: “So, you are not going to consider any other values of x to try then?”
James: “It will be pointless because they will all be smaller than 44.”

95
This exchange confirmed to the researcher that James does not really understand the
possible x-values that make sense at the current moment. While the researcher asked the semi-
structured questions to help James realize that only values between x = 0 and x = 4 can make
sense, James failed to make the connection.
Picking up his calculator and using the parabola he had graphed on Desmos, James
hesitantly decided to try x = 2 still believing that the value of A would be smaller than 44. Using
Desmos, he correctly got the value of y as 16. James then used the calculator and told the
researcher, “So now it’s 2 times the 16 I get from the graph and the 2 in the formula. I get 64.
Hey, that’s a higher maximum.” Now that he is finally convinced that he should try other values
to look for the maximum value of A, James decided to try x = 3. Using his Desmos graph and his
calculator, he correctly computed the value of A to be 36 which he told the researcher, “can’t be
right because it’s way smaller than 64. So x = 2 must be my maximum.”
The researcher presses James by asking, “How can you be sure that x = 2 will yield the
maximum value?” James responded, “It’s the largest value I got.”
At this stage, the researcher concluded that James did not have a strong understanding of
increasing and decreasing continuous functions. Rather, James was making conclusions using a
very sparse set of discrete points. This led the researcher to ask James, “If you are certain that x
= 2 will produce the largest value of A, what should happen if you try x-values around x = 2 that
are not far away?” James thought about this for a brief period and told the researcher, “I’m not
sure.” This confirmed the researcher’s suspicions and the researcher asked James to try values of
x that are very close to x = 2.
Thinking about this for a bit, James decided to try x = 1.9. Using his graph and his
calculator, he correctly computed the value of A to be 63.764. He then decided to try x = 2.1 and

96
correctly got the value of A to be 63.756. James quickly concluded that “around x = 2, the values
of A were smaller. So, x = 2 must produce the largest value of A. But now I’m confused.”
Wondering what James was confused about the researcher asked James to explain why he
was confused. James answered, “Well the unit between 64 and what I got between these two
answers should be exactly the same because I only moved by 0.1 in both directions. But anyway,
x = 2 is largest so that’s my answer.” James quickly closed Desmos from the computer screen
and closed the calculator satisfied with his work.
Explaining his confusion, James showed he did not know that A is actually a cubic
function and believed A is a quadratic function. He correctly explained that the change in the y
value should be the same if you move the same horizontal distance in either direction from the
vertex, but he did not get those results.
While James did complete this task, he spent most of his time in the first two layers of the
Pirie-Kieren model (Figure 8). While James demonstrated his ability to use a formula correctly,
graph the given function on Desmos, and get the correct value of y using the graph for the
formula, he did not clearly demonstrate how to use the pieces of information together to help him
complete the task. Instead, James resorted to a “guess and check” strategy of trying to find the
maximum value. This is why he incorrectly concluded for a while that x = 1 yielded the
maximum value since the other guesses he tried got him nowhere near the A value of 44 when x
= 1. Other than intuitively knowing that the value of y came from the parabola, James
demonstrated no other relevant prerequisite skills that would have helped him to complete this
task.
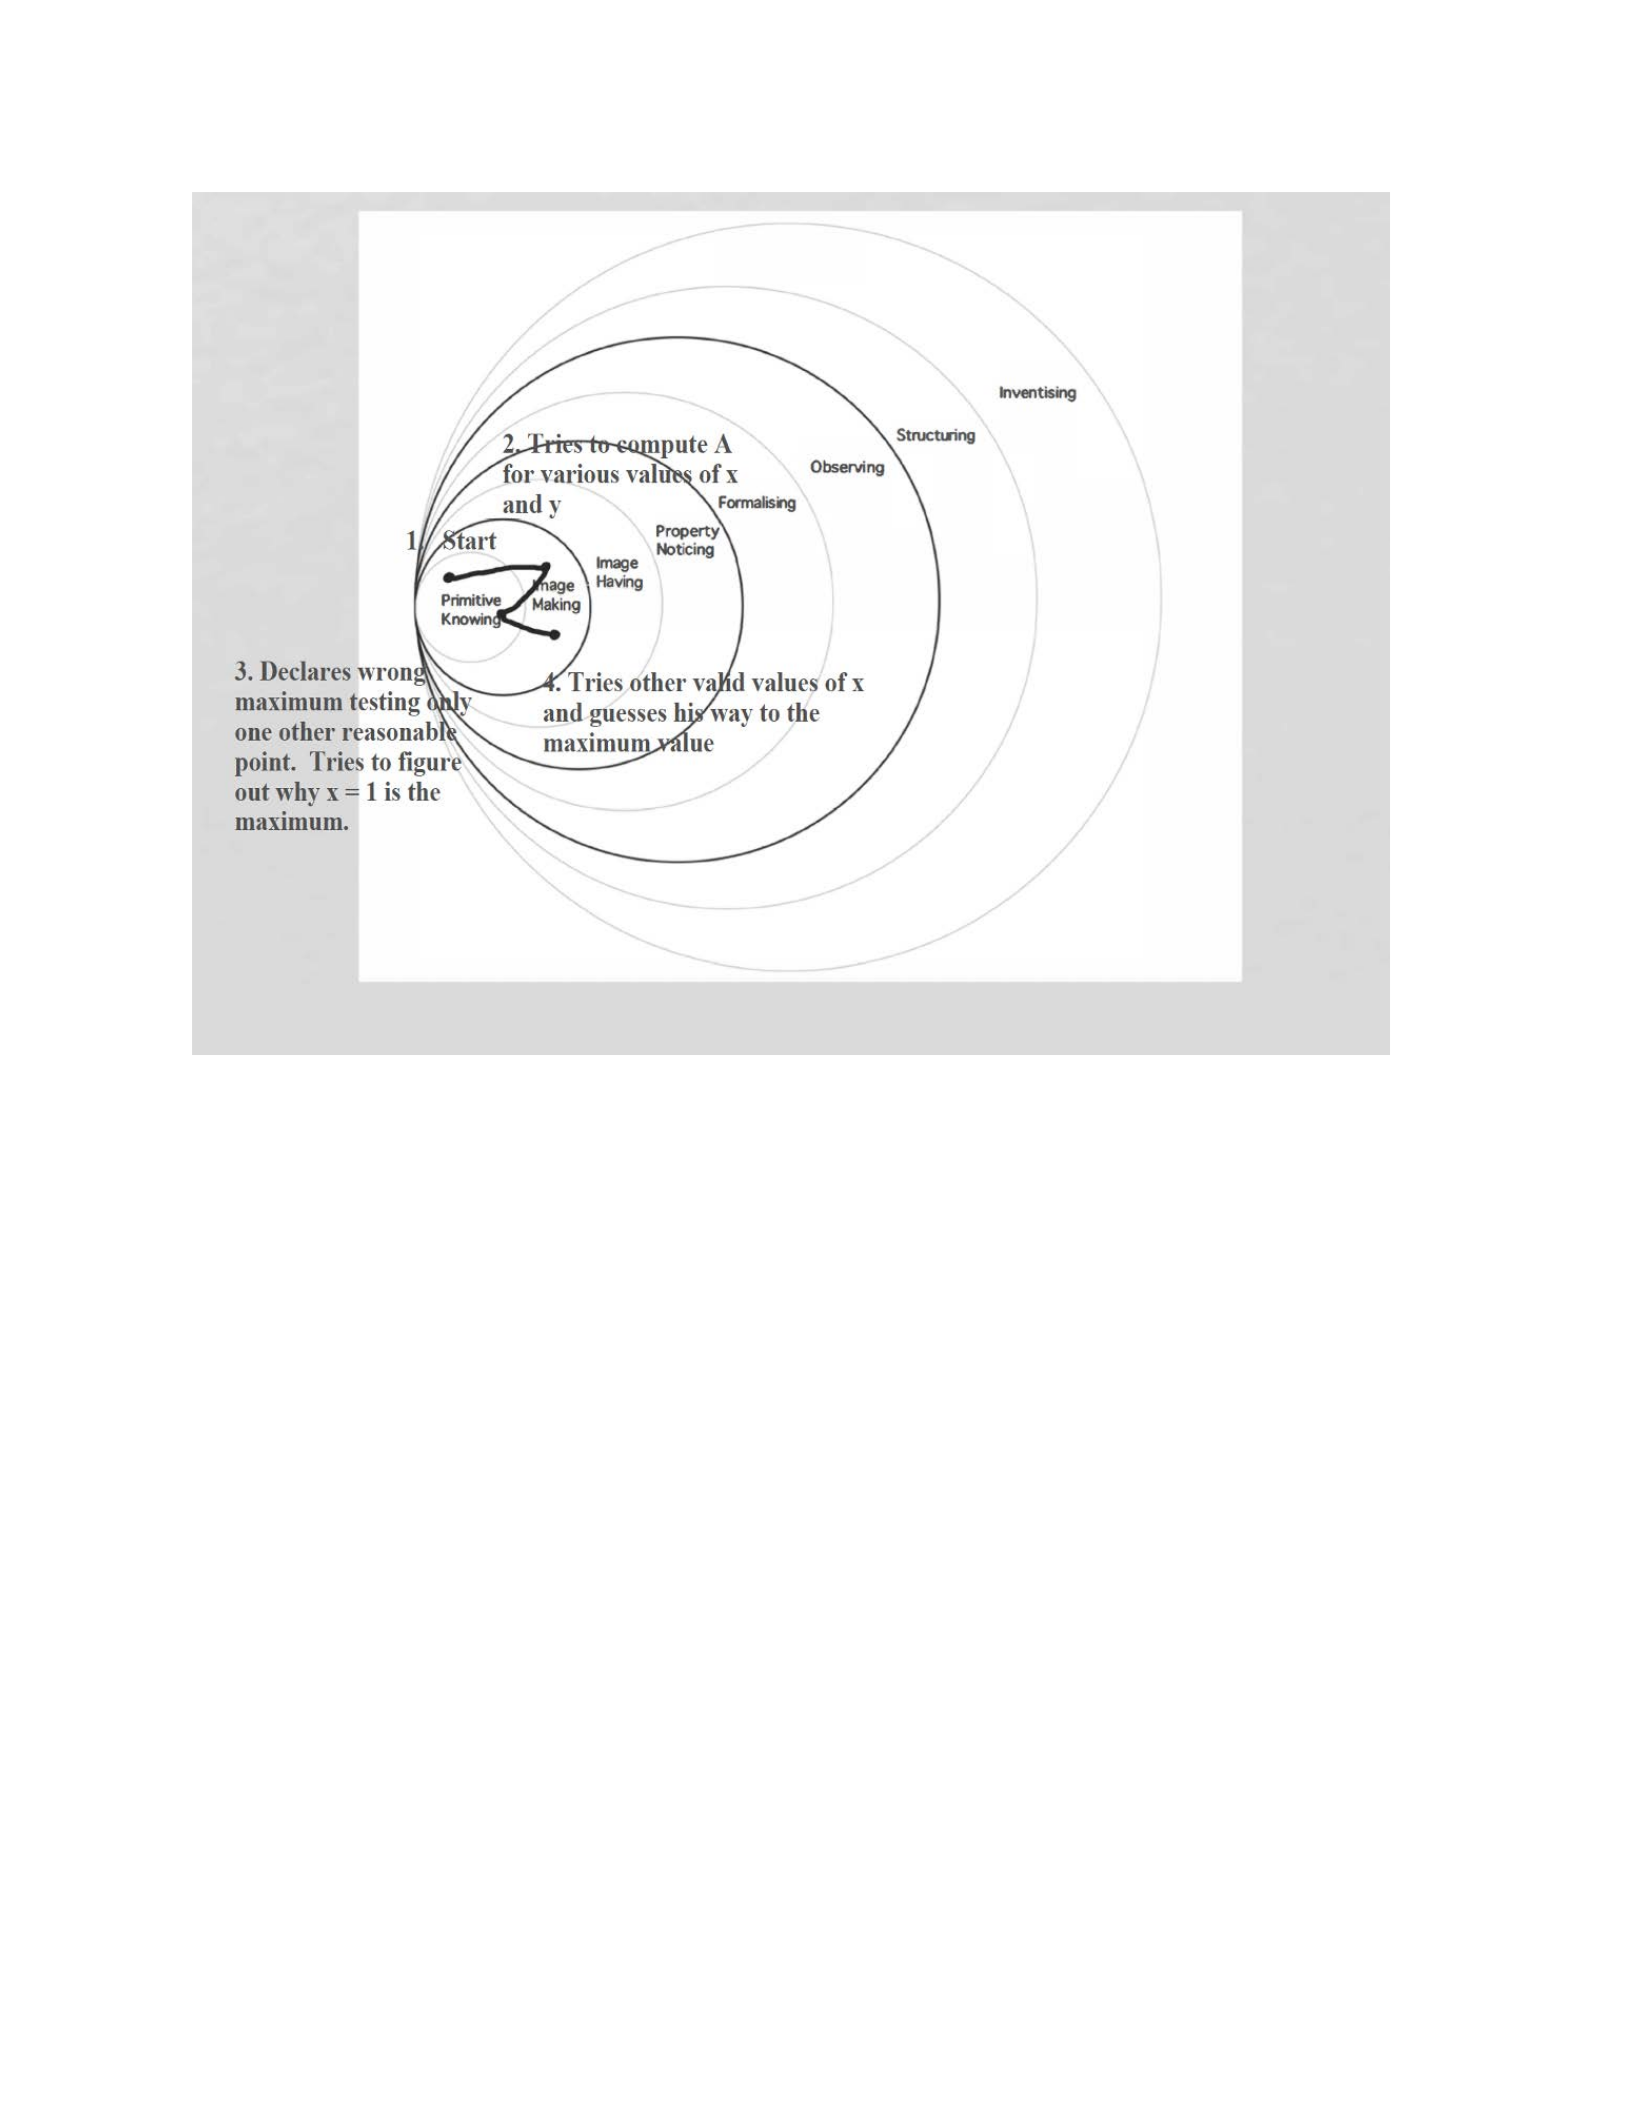
97
Figure 8. Pirie-Kieren Model for James Task 2 of Interview 1
Ashley:
After reading the stem of the problem, the first thing Ashley did was write the equation y
= 24 – 2x2 on her paper. Looking at the given formula for A, she told the researcher, “The A is
throwing me off.” She reread the problem and decided to pull up Desmos on the computer and
graph the curve y = 24 – 2x2. Inspecting the graph, she quickly jumped to the conclusion that (0,
24) must be the maximum which she correctly identified as the y-intercept of the curve. At this
stage, Ashley was interchanging A and y and believed that the maximum of the parabola was the
maximum of function A.

98
Thinking about what is going on, she told the researcher, “I’m confused. What’s the
maximum? Am I finding the maximum of the graph? I don’t really know what A is.” At the
moment, Ashley showed that she did not know what to do with the formula for A despite the
fact that the formula is explicitly given to her in the problem.
Doing some scratch work on her paper, she told the researcher, “Here’s my problem. The
maximum point on the graph I see is (0, 24) and if I plug in those values, I get 0. So, wouldn’t
that just get me A = 0. I just don’t know what else to do.” At this stage, I was aware that Ashley
could correctly apply the formula with the value of x = 0 and y = 24, but she was fixated on the
parabola as opposed to trying to maximize the formula for A.
Using the semi-structured questions, the researcher asked her the first question in a more
explicit fashion to help Ashley get back on track. The researcher asked, “What would happen to
the value of A if x = 4?” Ashley brushed off the question and responded, “The last task was more
guess and check, so I think I’m going to try the same thing here.” The researcher did not know
what to think because Ashley was not even being receptive to an explicit question.
Ashley went through with her “guess and check” strategy and used the graph she had on
Desmos to generate additional values to help her with the task. She correctly used Desmos to
figure out that when x = 1, y = 22 on the parabola. She then repeated the process for x = 10 and
got the value of y = -176 on the parabola. After seeing this value, she told the researcher, “It
doesn’t matter if it’s positive or negative because if I square it, it’s going to be positive.” This
showed a complete misunderstanding of the formulas because in function A, y is not being
squared. On the given curve, y is not being squared; x is being squared. The researcher
considered this a fold back to the first layer because Ashley was now very confused about what

99
to even do with the given curve and formula. In other words, Ashley did not completely
understand what the stem of the problem was asking.
In an attempt to see where Ashley’s thinking was at, the researcher engaged in the
following dialogue:
Researcher: “What are you thinking?”
Ashley: “Well, I know the maximum of the parabola is (0, 24) which makes sense
because it is the highest point on the curve (she points to the graph).
Researcher: “So, what does this tell you about A?”
Ashley: “That’s what I don’t get. What does A represent?”
Researcher: “You can think of A as a formula given to you in the stem. You do not need
to be concerned with what A represents.”
Ashley: “Well in that case, I’m just going to set 2xy = 0 and see where I can go from
there.”
Ashley attempted to isolate y on her paper and correctly gets
𝑦 = 2
'!
. Using this result,
she went to Desmos and on the next entry put in her result. Looking at the result she told the
researcher, “I got a straight line at y = 0 and I don’t know why?” Understanding why Ashley got
a straight line at y = 0, the researcher asked, “What were you expecting to get?” Ashley was
quick to respond with “a graph that goes up and down.” From the exchange and her attempt to
set A = 0, the researcher knew that Ashley was not completely lost on this task. While she was
taking an approach that was not helping her to complete the task, her awareness that she should
obtain “a graph that goes up and down” indicated her awareness of the type of graph she knew
she needed to see in order to complete the task.
The researcher decided to be a little more direct and asked Ashley, “Tell me what you are
able to compute if you know that x = 4 explicitly?” She responded, “I don’t know. I guess I can
just plug it in and find out.” Using Desmos, she correctly got the value of y = -8 from the
parabola. Then, she finally used the values of x and y together and plugged them into the formula
for A. This is critical because when Ashley computed y for x = 1 and x = 10, she never attempted

100
to compute the value of A. After using her calculator to compute, she told the researcher, “I got
A = -64 by plugging in x and y which makes no sense. I guess I should try x = 1 again.”
Working with her Desmos graph and her calculator, she correctly figured out that when x
= 1, y = 22 again. But she then used the formula for A to obtain A = 44. She then decided to use
x = 2 and correctly obtained the value of y as 16 and used these values correctly to get an A
value of 64. Wanting to make sure Ashley understood what was going on the researcher asked
her, “What would happen if x = 3?” Working in a similar manner, she told the researcher “y
would be 6 and then A would be 36.”
After a period of silence where Ashley was not communicating with the researcher, the
researcher had the following conversation with her:
Researcher: “What are you thinking?”
Ashley: “Well, I got all these values of A and need to figure out what to do with them.”
Researcher: “Think about what you want to accomplish for the task. Which value of A
would make the most sense?”
Ashley: “Well, it’s odd because I cannot find a pattern. When x = 1, you get 44. When x
= 2, you get 64. When x = 3, you get 36. When x = -4, you get -64. OOOH!”
Researcher: “Do you see something?”
Ashley: “Yeah. Let me show you.”
Ashley shared her screen with the researcher and opened a whiteboard app so she could
show me what she was thinking. She drew a rough Cartesian plane and sketched four points on
the plane with no labeling on the x- or the y-axis. Confused about what she was doing the
researcher asked her, “What do these points represent?” Ashley answered, “Remember how I
needed to see something that goes up and down. This goes up and then down. So, the second
point represents my maximum.” She pointed to the second point of the four, which was the
highest point on her rough graph and traces her hand across the four points almost like she was
“connecting the dots” to create a continuous graph. See Figure 9.

101
Figure 9. Ashley’s graph to describe the values of A for various values of x.
Ashley never explicitly mentioned the ordered pairs (1, 44), (2, 64), (3, 36), and (4, -64)
in her description or that she was graphing the x-values on the x-axis and the A values on the y-
axis. However, the researcher implied that Ashley was referring to these values because these
were the four values of A that she computed prior to sketching her graph. Ashley then told the
researcher, “This point is the maximum which is the 2 and 64. That answers the question.” This
confirmed the researcher’s suspicions.
In this task, Ashley eventually came around to complete the task. However, she spent her
time in the task in the first two layers of the Pirie-Kieren model (Figure 10). Ashley spent much
of her time on the task trying to understand what A represented in context as opposed to simply
trying to find the maximum value of A. Her confusion of not knowing what A represented led
Ashley to go all over the place mathematically trying to figure out what to do. Once she figured
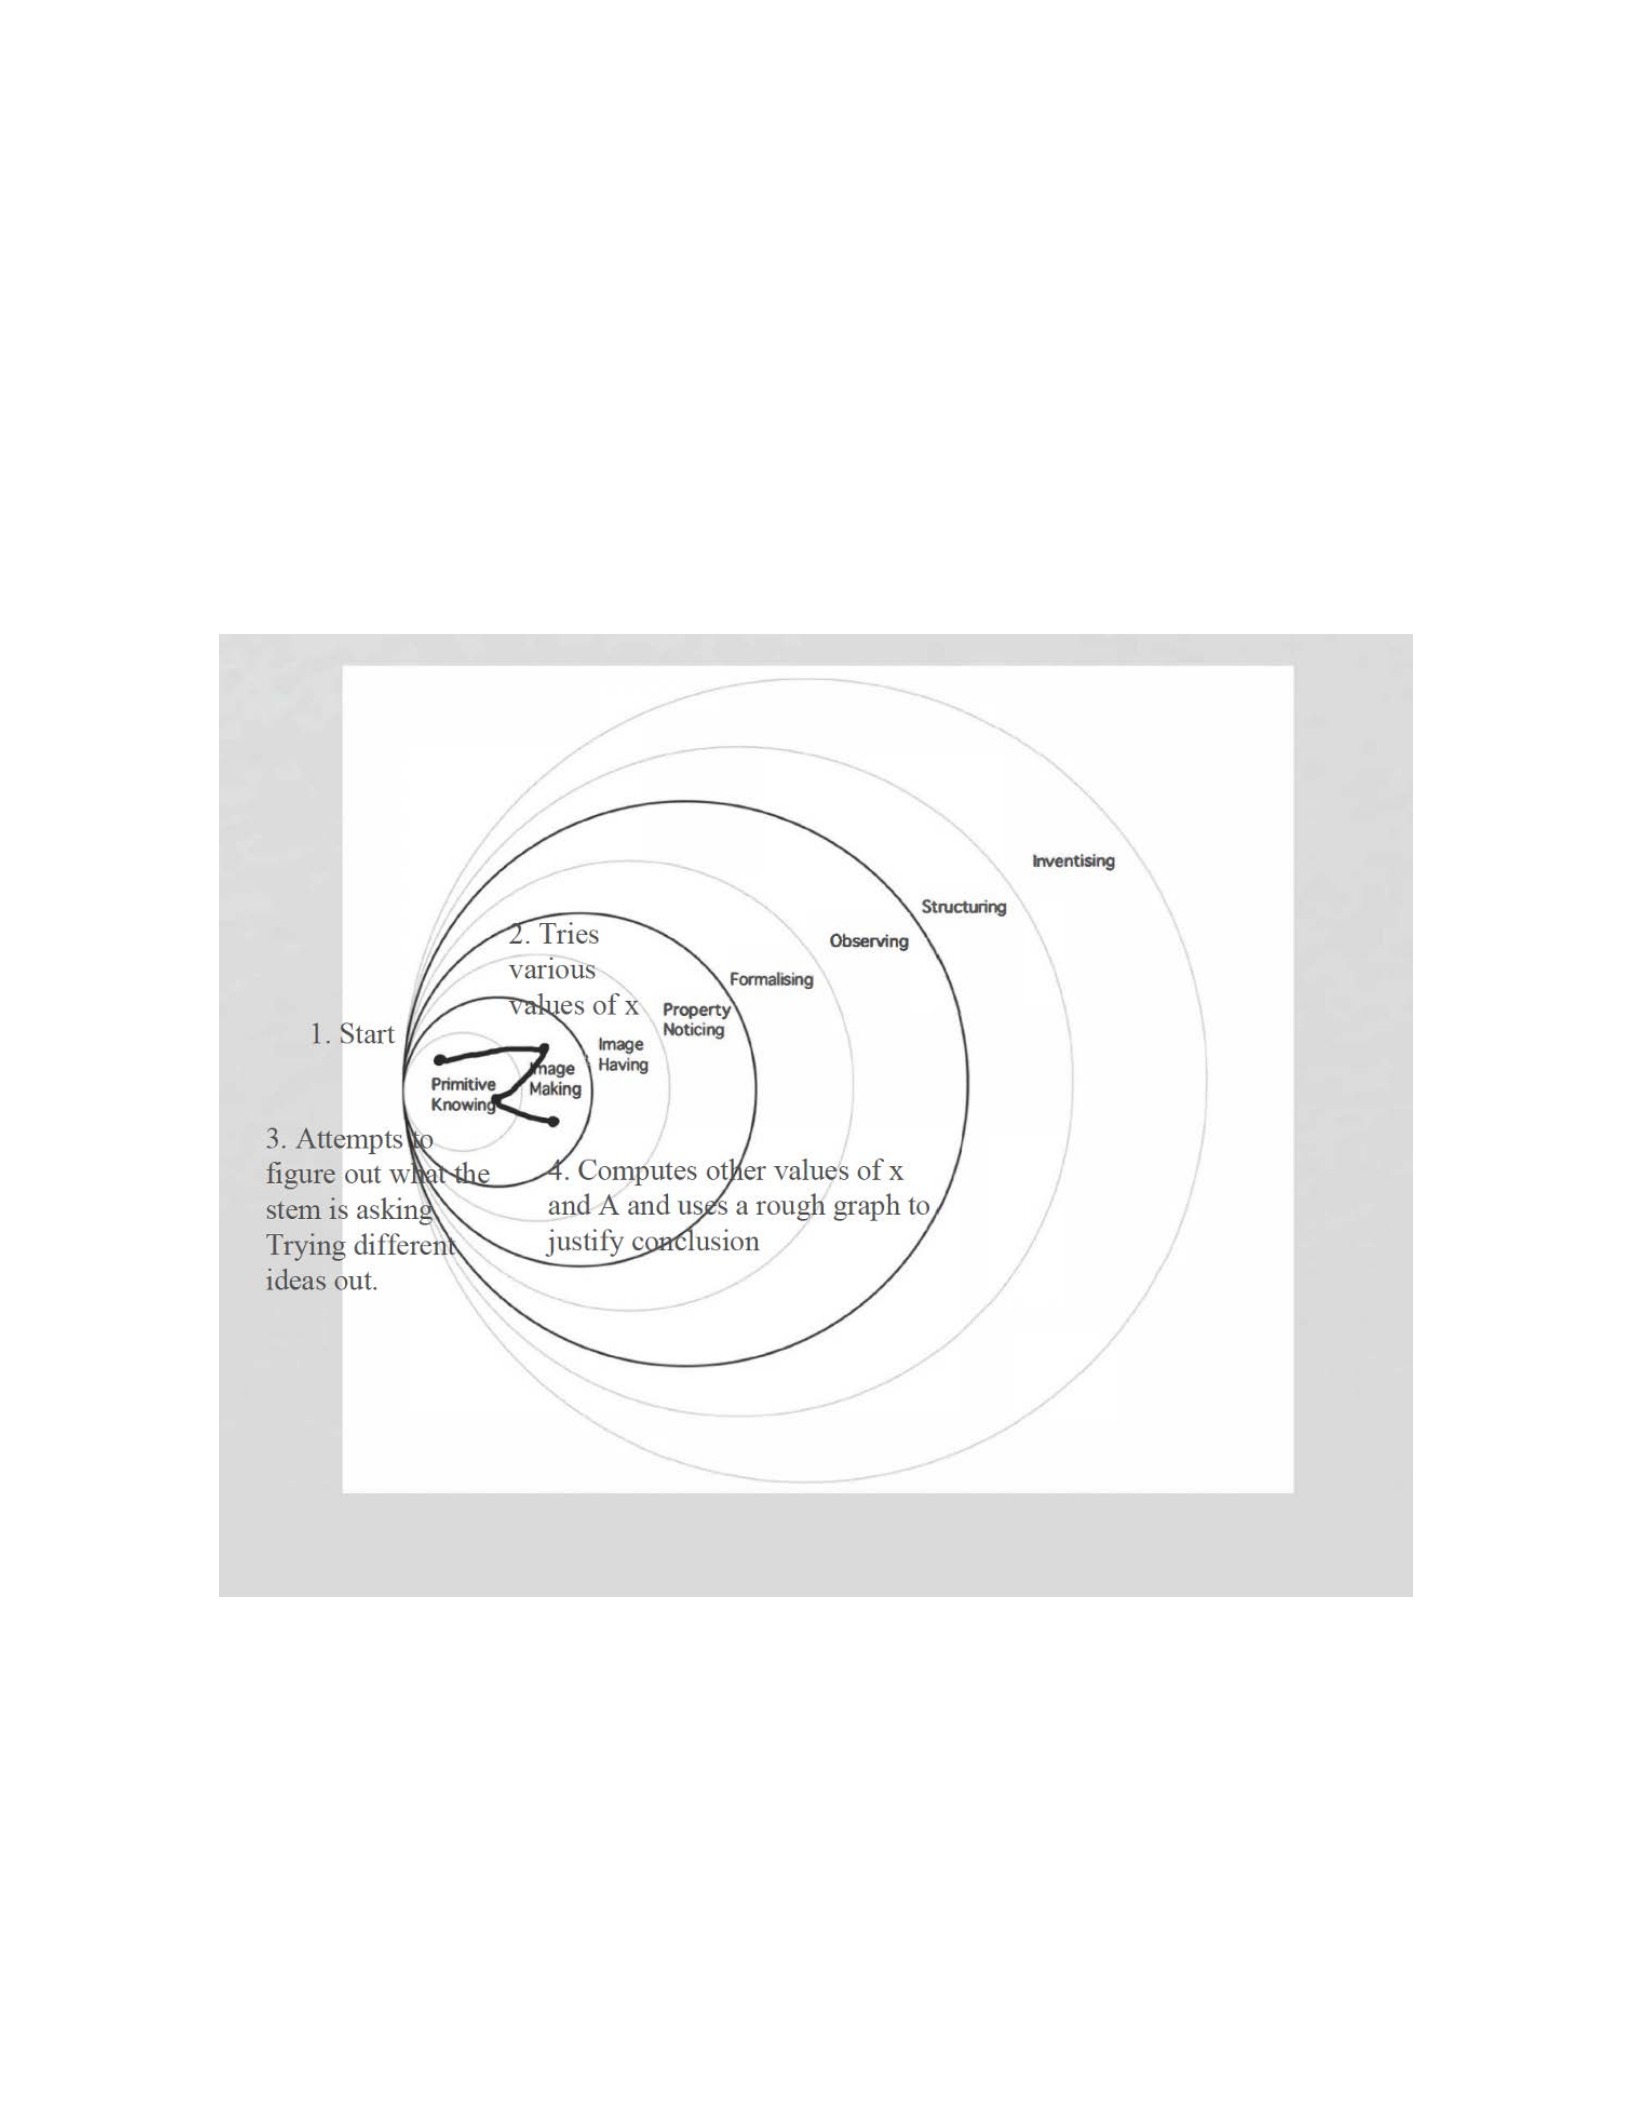
102
out what to do, Ashley did demonstrate her ability to utilize the formulas correctly, compute the
y-value off the graph and apply it to the formula. Ashley also showed some intuitive knowledge
about how function A behaves with her rough graph and hand tracing even though she only used
a limited set of discrete points.
Figure 10. Pirie-Kieren Model for Ashley Task 2 of Interview 1
Charlie:

103
After reading the problem, Charlie was not really sure how to start this task. He told the
researcher that he was aware that there is a curve on the graph and the product A = 2xy needs to
be maximized. However, he told the research that he did not know how to proceed.
Charlie pulled out his notebook containing old notes from his precalculus course and
began flipping through his notes. When he found what he needed, he told the researcher, “I know
that y = 24 – 2x2 will be a parabola that opens down. So the vertex will be the highest point or
max of the parabola.” At this stage, Charlie was aware of the behavior of the curve but has not
mentioned anything about A yet.
His focus was still on the quadratic function, but then Charlie told the researcher, “The
slope of this function is -2 over 1.” Taking a quick glance at his notebook, the researcher noticed
that the information about linear functions and quadratic functions are on the same page in his
notebook. Unfortunately, he was currently mixing up the slope from linear functions with the
tasks given quadratic function. This led the researcher to have the following exchange with
Charlie:
Researcher: “What are you looking for in your notes?”
Charlie: “Right now, I’m looking for the notes I can find about graphing. I know there’s
an h, k, something like that.”
Researcher: “Okay. So, how are you planning to graph the function?”
Charlie: “Well, I want to graph it on my paper. Oh wait, can I use the computer?”
Researcher: “Of course you can.”
Charlie: “I guess I won’t need my notebook after all.”
Charlie puts his notebook away, goes onto the computer, opens Desmos and graphs the
curve. Looking at the graph on Desmos, he correctly identified the vertex as (0, 24) to the
researcher. But, looking at the stem of the problem and rereading the information he told the
researcher, “I am not entirely sure what the product of A = 2xy is the maximum of.”

104
Wanting to see if Charlie understood what the task is asking, the researcher asked him to
“tell me what you can conclude if you know that x = 0?” Charlie quickly responded, “If x = 0,
then y = 24 on the graph and oh I just have to plug in the points.” It was clear that Charlie at least
mechanically understands what needed to be done. Charlie correctly substituted the values of x
and y into the function A and got A = 0. Charlie quickly realized that A = 0 is probably not going
to be the maximum value.
The researcher asked Charlie the semi-structured question regarding seeing what would
happen at various values of x. Charlie decided to try x = 2 first. Using his Desmos graph, he
correctly computed the y-value of 16 and then computed the correct value of A by hand to get a
value of 64. Once he found this value, Charlie told the researcher, “I’m not sure if this is right,
but I think I need A to be 24 because the maximum when you graph it is 24. That’s the vertex.”
Charlie’s statement was mixing up his knowledge about the function A and the curve given in
the problem. The y-value of the vertex on the parabola is 24. Charlie had not yet realized the fact
that his computed value of A as 64 is already larger than 24, so making A = 24 would not make
sense.
In an effort to get Charlie back on track with my original question, I asked Charlie,
“What can you tell me if you know that x = 5.” Using his Desmos graph, he correctly computed
the value of y as -26 and told the researcher, “I don’t think it can equal 5 because I got y as -26
which would make A negative.” The researcher was convinced that Charlie did have an intuitive
sense of the implied domain of x values that make sense.
Going along with his thought, the researcher asked Charlie, “Are there certain x-values
that make sense to try?” Charlie looked at his graph and told the researcher, “I think I need the x-
intercept because the x-intercept is the furthest I can reach for it to be positive.” Charlie looked at

105
his Desmos graph and correctly identified the x-intercept as 3.464 since Desmos rounds to three
decimal places. He then used his calculator and the formula for A to correctly obtain A = 0.
Charlie then told the researcher, “Well, I guess it only makes sense to try values of x that
have point that are in the first quadrant.” Using this piece of information, he decided to try the
value x = 1. With the help of his graph, Charlie correctly got the value of y to be 22 and then
used his calculator to get the value of A to be 44. With only two reasonable values of A
computed (64 and 44), Charlie told the researcher, “The maximum value of A is 64 when x = 2.”
This sudden conclusion led the researcher to have the following dialogue with Charlie:
Researcher: “How can you be so certain that you have the maximum value of A?”
Charlie: “Well, 64 is the largest value I got, and I don’t know if I’m able to make a new
formula for A.”
Researcher: “I do not think that you need to come up with a new formula for A, but you
only have two values of A. How have you been able to make a conclusion based on these
two values?”
Charlie: “I know that x and y have to both be positive, but I’m not sure if I can use these
values to find another formula for A.”
Researcher: “Is there a way you can be definitive that the maximum value of A will occur
when x = 2?”
Charlie: “I don’t really know. Make a formula?”
From this exchange, it was clear that Charlie was not thinking about function properties
and testing positive x-values near x = 2 to confirm his suspicion. Charlie was very determined to
make a new formula for A. He attempted to graph A = 2xy on Desmos and received an “error”
from Desmos. The researcher asked Charlie what the issue was. Charlie was quick to inform the
researcher that he cannot sketch a graph that has two variables. With the remaining few minutes
of the interview time, Charlie scribbled attempts to try and find a formula for A that only
contained one variable. Thinking he had the correct formula, Charlie told the researcher, “I use
the x value in the curve and the formula. So, I think I can write it as A = 2x + 24 – 2x2 because
that only be one variable twice.” This showed that Charlie had some understanding of

106
substituting the value of 24 – 2x2 in for y in function A. However, he made the substitution under
addition rather than multiplication. Before Charlie had a chance to make a correction, the one-
hour timer went off indicating the end of the interview.
Charlie did get the correct answer to the task. However, he was not able to definitively
show that the value of A is maximized when x = 2. Charlie spent most of his time on this task in
the first two layers of the Pirie-Kieren model (Figure 11). Charlie did have many fragmented
pieces of correct information but could not connect the information together in a meaningful
way. Charlie’s prerequisite skills included showing properties of quadratic functions, applying a
formula correctly, and an understanding of the implied domain of x-values showing that after
passing the x-intercept of the given curve the values of A would not make sense. He confirmed
his understanding with x = 5 showing that A would be negative.
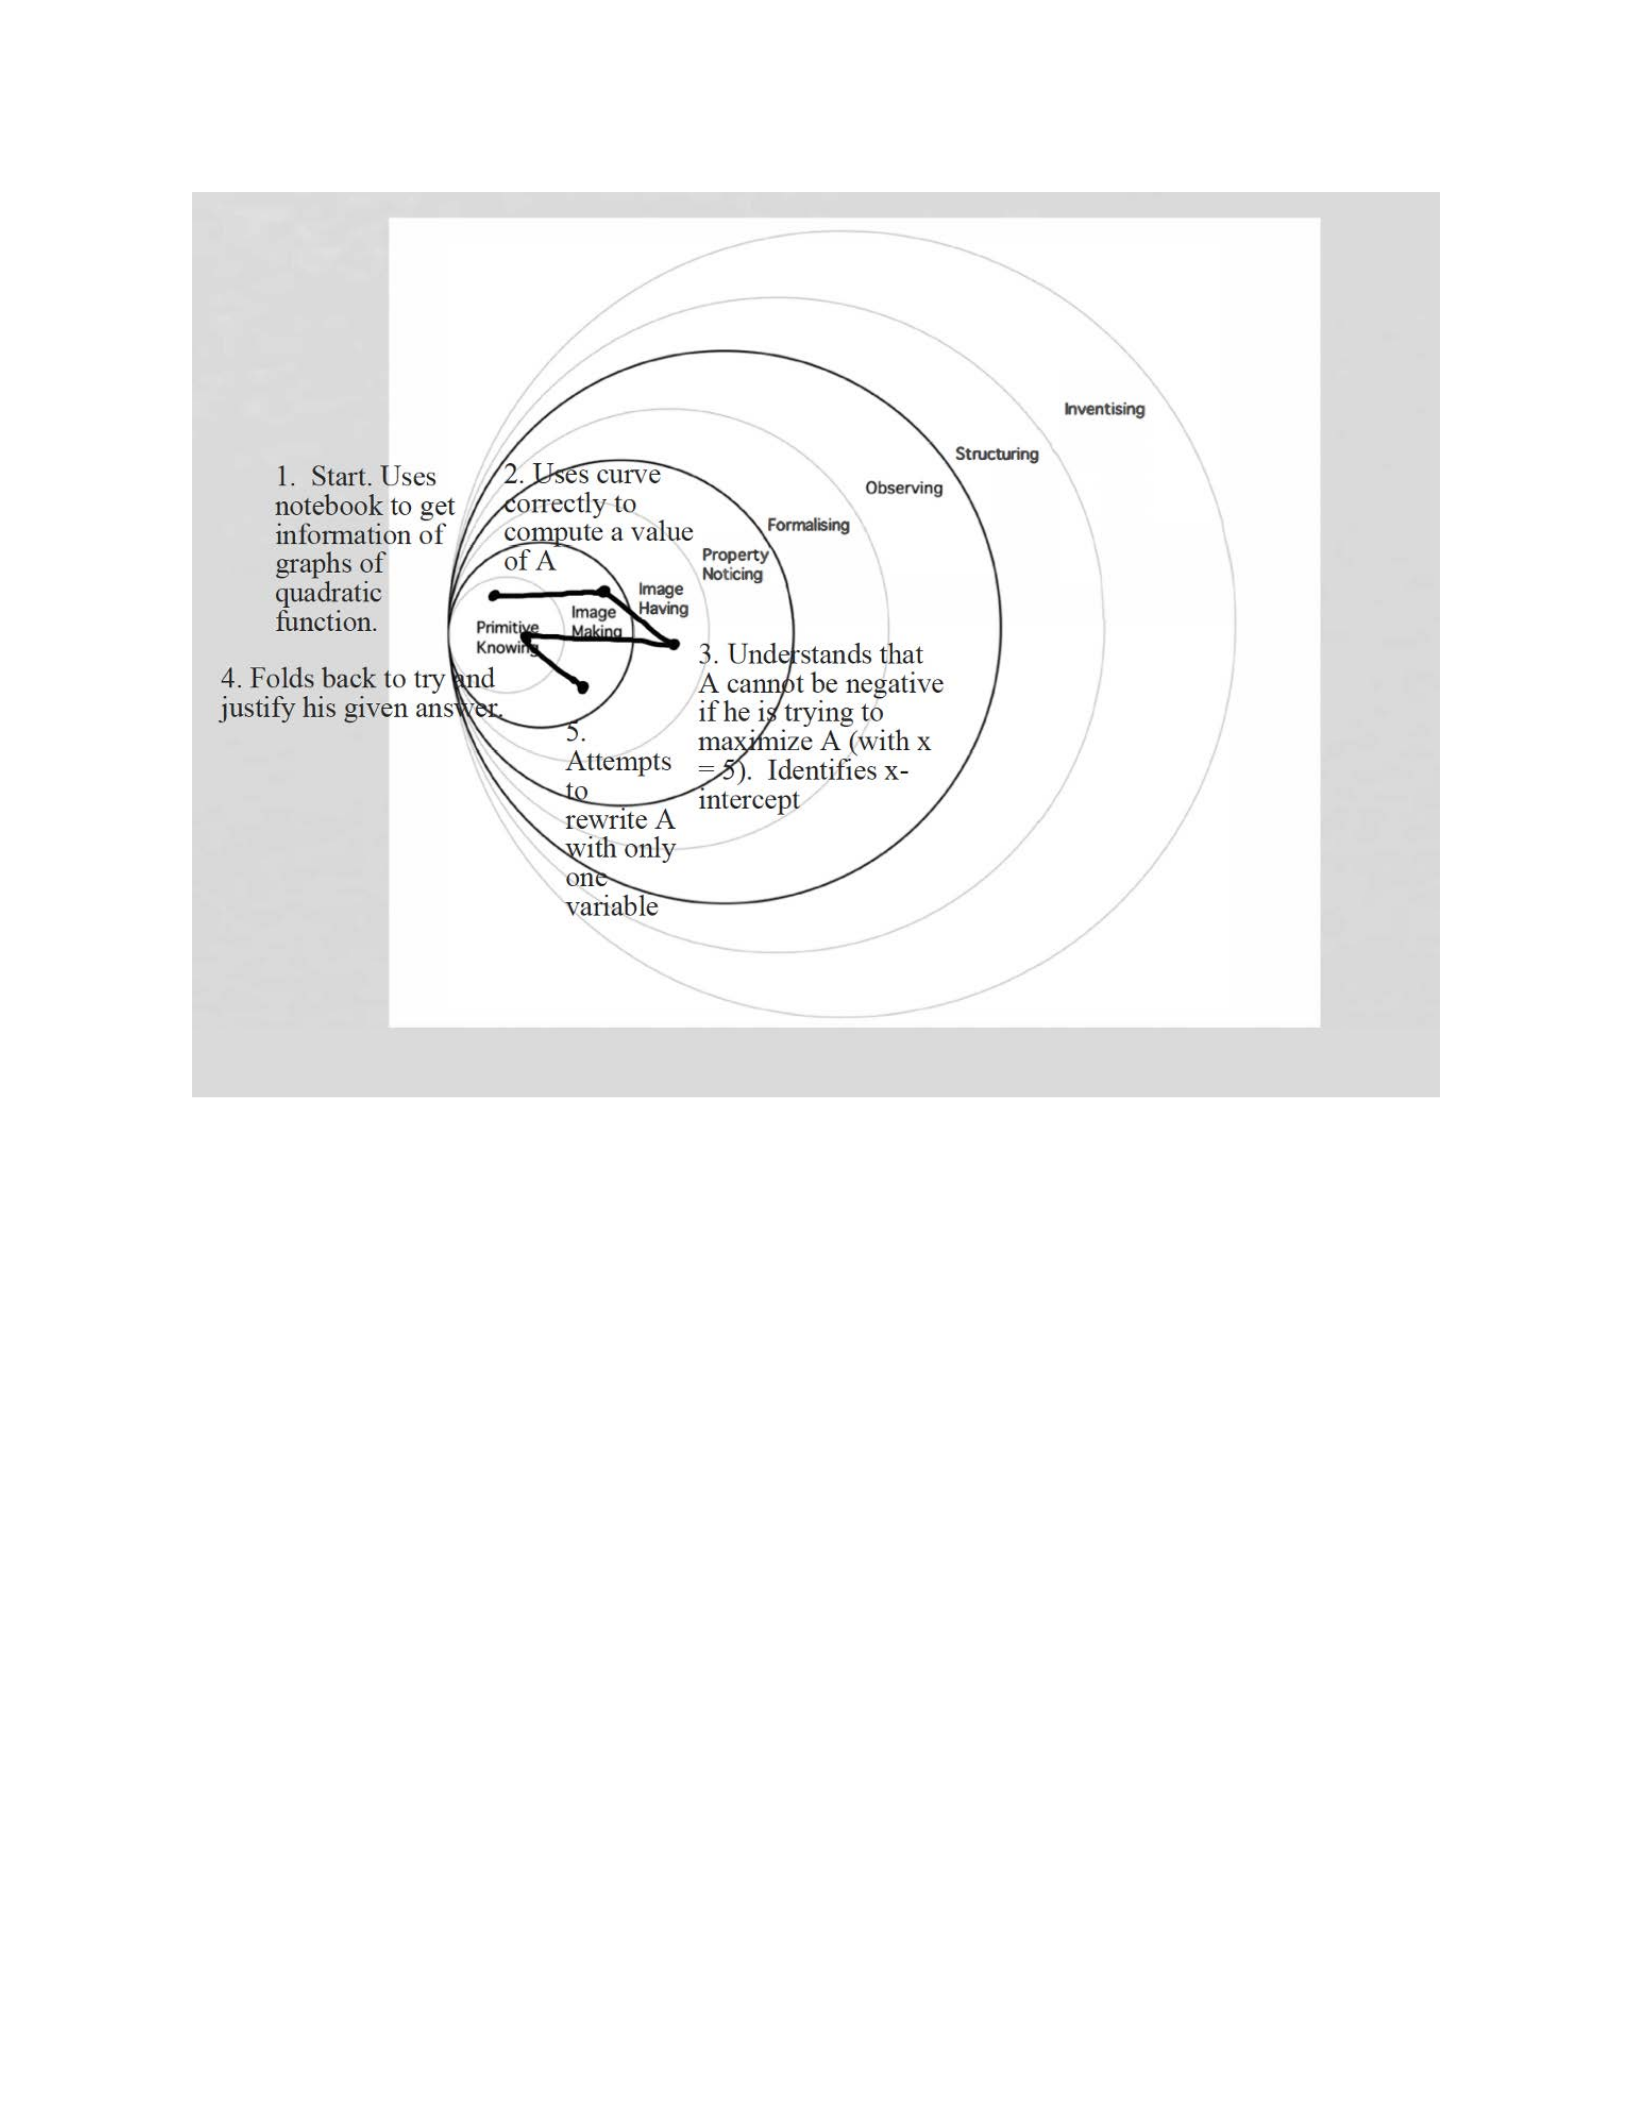
107
Figure 11. Pirie-Kieren Model for Charlie Task 2 of Interview 1
Manuel:
Upon reading the stem of the problem, Manuel was confused about function A and
originally thought it is the same as the y in the curve y = 24 – 2x2. He quickly concluded that the
curve and A are not the same and then told the researcher, “My first instinct is to set the 24 – 2x2
equal to 2xy and try to algebra it from here.” While incorrect, Manuel was the first participant to
consider setting y = A.
Manuel proceeded to work on his scratch paper to isolate y because he believed that he
could find the x-values that are solutions to the task this way. After complaining to the researcher

108
that the algebra is a lot more complicated than he anticipated, Manuel eventually solved the
equation correctly and told the researcher, “My answer is
𝑥 = -!+./'
!
. This is mathematically
correct, but Manuel did not isolate y. He was confused about his result and told the researcher, “I
have x isolated, but I have x on the other side of the equation. That does not make sense. Oh, I
meant to isolate y.” This showed that Manuel is aware of what went wrong, and he went on to
correctly isolate y and obtain a simplified answer of
𝑦 = /'-!#
!
.
Using his new isolated value, Manuel went to Desmos on the computer and graphed the
solution he just obtained. Looking at the graph, Manuel mentioned that he is not happy to see
this graph which led the researcher to have the following exchange with him:
Researcher: “What are you thinking? Why are you not happy with what you see?”
Manuel: “Well, I was expecting something that would be going up and down. You know,
increasing and decreasing. But this graph is only decreasing.”
Researcher: “What’s wrong with that?”
Manuel: “If the graph is only decreasing, how can I find the maximum value?”
This showed Manuel’s understanding of function properties; particularly the fact that in
order to have a maximum, the function must go from increasing to decreasing. While Manuel
never explicitly stated this, he implied this fact when he asked the researcher how a maximum
can be found if the function is only decreasing.
Using the first semi-structured question with a different x-value, the researcher asked
Manuel, “Tell me what you can figure out if you know that x = 1?” Manuel manually computed
the value of y using the curve and then correctly used the formula for A to get values of 22 for y
and 44 for A. Initially thinking that Manuel understood what is going on, he told the researcher
“So, I need to find out what times 2 and times x equals itself. This means x has to be the inverse
of 2 to cancel out. So, x has to be 1/2.” Manuel proceeded to correctly put x = 1/2 into the
equation of the curve and correctly get 23 1/2 for y. He used this value in the formula for A and

109
correctly get A = 23 1/2. Based on this, Manuel did know how to compute A using different
values but was still confused about what the task was asking him to do.
In an effort to confirm this, the researcher asked Manuel to elaborate on why using the
value of x = 1/2 makes sense even though the value of A he obtained is lower than the 44 he got
when x = 1. He quickly told the researcher, “Well I need the product A, which is y, to equal 2xy.
So, setting y = 2xy means that 2x = 1. That means x = 1/2 must be the answer.” This confirms
his current misunderstanding of the task which is the fact that Manuel believes that A and y are
the same variable. However, to get x = 1/2 Manuel is setting A = y.
Certain of Manuel’s misunderstanding, the researcher asked him to reread the task once
more and explain what he needed to do to accomplish the task. Upon reading the task again,
Manuel hit himself on the head with his hand and told the researcher, “Oh! I misunderstood the
question. I thought the product A was the answer to the question and we had to set it equal to the
curve, y.”
I asked Manuel about his new strategy, and he explained that “The y is 24 – 2x2 and we
need to multiply that by 2x. From there, we would get another parabola where we can find out
where the maximum would need to be.” Manuel is now on the right track and has clearly figured
out a strategy to solve the problem that is similar to the first task. The only minor
misunderstanding Manuel had not realized yet is his belief that the product of 2x and 24 – 2x2 is
another parabola rather than the graph of a cubic.
On his paper, Manuel distributed 2x into the 24 – 2x2 and correctly got -4x3 + 48x. He
went to Desmos on the computer and proceeded to graph his result. He zoomed out so he could
see a more complete picture of the graph. Looking at the graph, he told the researcher, “The
graph is cubed so it’s on both sides, but it says a positive integer which does have a peak at 2.”

110
The researcher asked Manuel what he means by “it’s on both sides.” Manuel clarified that he
means the graph is on both sides of the “bold vertical line”, without ever mentioning the y-axis
explicitly. This showed his clear understanding of the task, the function A, and the restriction of
x which allowed him to focus on the appropriate piece of his Desmos graph to come to his
conclusion. Manuel stated to the researcher that, “The peak is a x = 2 and the product A is 64
which has to be the maximum value of A given the conditions.”
Wanting to see the depth of Manuel’s understanding the researcher asked him, “Are there
positive values of x that would not make sense for the model of A?” Looking at the function and
the given curve, Manuel answered, “You’re subtracting the 2x2 from the 24. So, anything over a
certain point would just make it smaller.” Looking at his Desmos graph and dragging the mouse
over various x-values, he correctly stated to the researcher that “after 3.464, it starts going
negative. So, if it starts going negative, y is negative, which results in A becoming negative.”
Despite Manuel not understanding what he needed to do in the first half of this task, once
he understood Manuel eventually moved out to the property noticing layer of the Pirie-Kieren
model (Figure 12). His main issue in the task was reading comprehension. Even though Manuel
had a misunderstanding of the task at the beginning, he showed a lot of prerequisite skills
throughout the task. Manuel was able to successfully isolate one variable given two expressions
with two variables. He also showed his ability to correctly distribute an algebraic expression into
a binomial, graph the function in an appropriate viewing window, identify the maximum of the
function graphically, and correctly describe the implied domain of the function in context of
what the task was asking for.
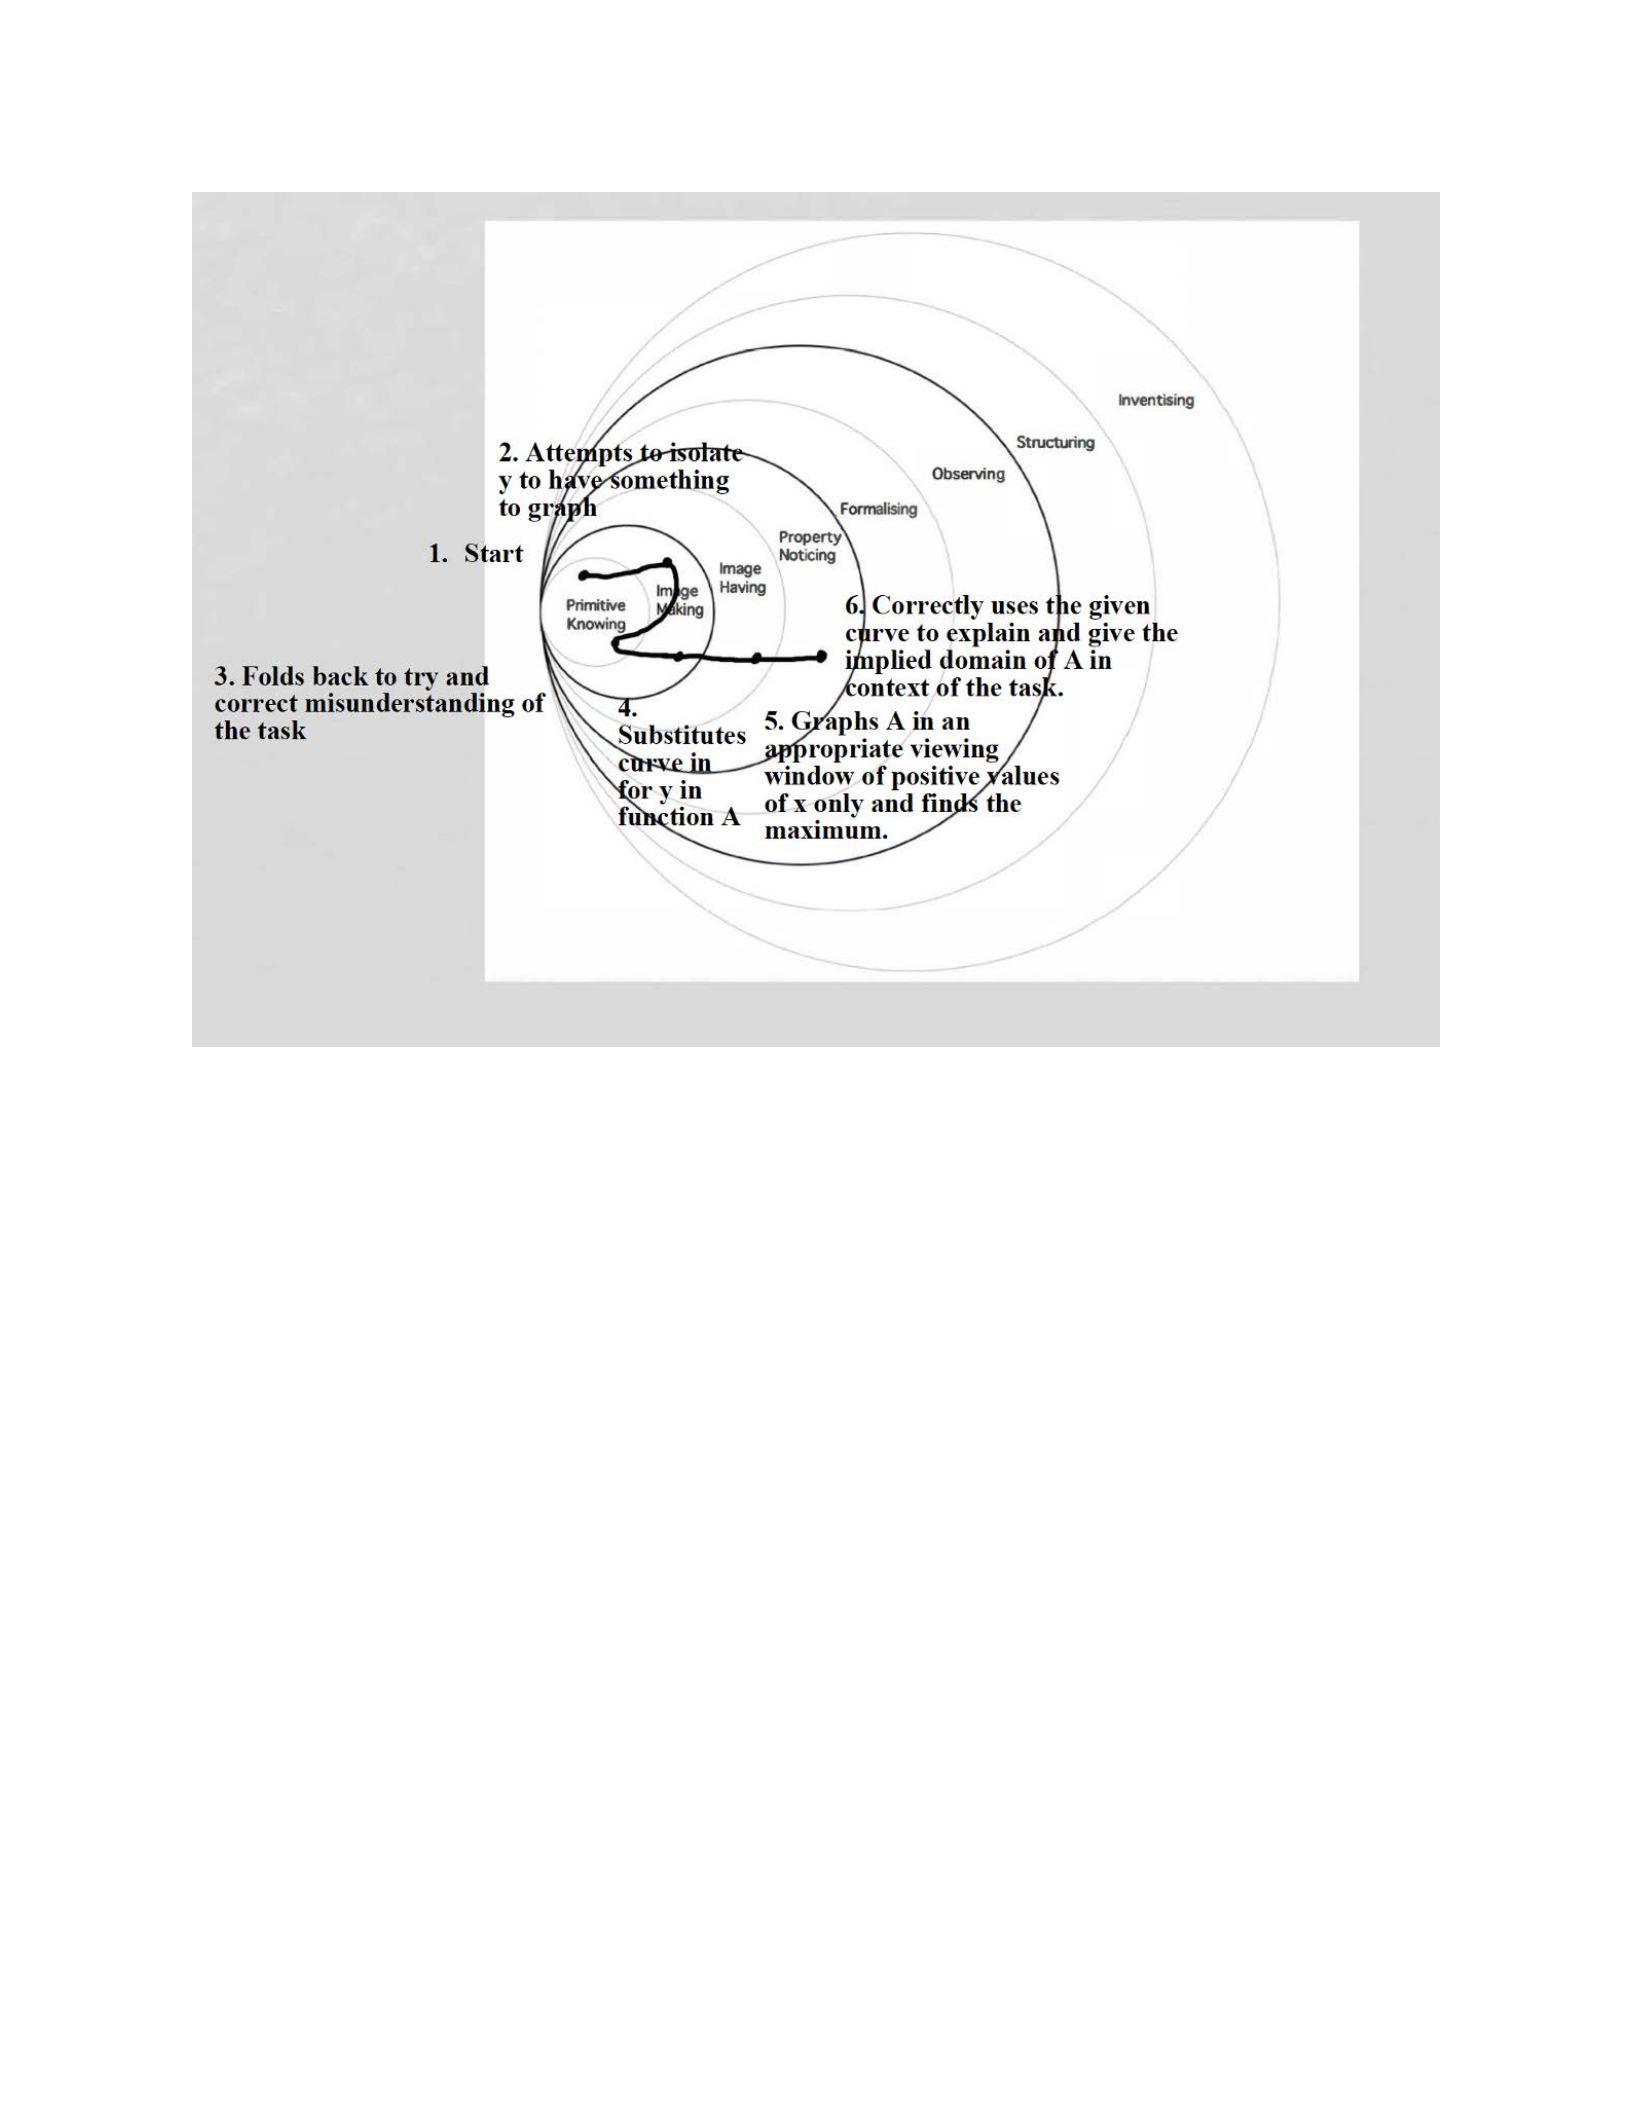
111
Figure 12. Pirie-Kieren Model for Manuel Task 2 of Interview 1
Lamar:
When Lamar finished reading the task, he noticed something right away. He told the
researcher, “I believe we’re looking for the maximum of the parabola again. Similar to how we
were looking for the maximum from the last task, we’re looking for the maximum in a different
way.” He was the only participant to verbally make the connection that the technique required to
solve this task was similar to the first task in the interview.
Lamar went to the computer and goes to Desmos. Once there, Lamar graphed the
equation y = -2x2 + 24 and correctly identified the curve as a parabola with a maximum of (0,

112
24). He went to his scratch paper and substituted x = 0 and y = 24 into A = 2xy, and correctly
computed the value of A to be 0. He told the researcher, “Based on this, I am interpreting the
question correctly.”
The researcher probed Lamar and asked him about his strategy to solve this task. The
researcher was interested in the fact that Lamar is using Desmos to graph in this task because he
did not use Desmos at all to complete the first task. Yet, Lamar told the researcher that the
technique would be similar. Lamar responded, “By my interpretation we’re trying to find where
2xy, which is equal to y at the equation 24 – 2x2 equaling each other. In other words, I’m finding
the x-value that makes -2x2 + 24 = 2xy the same.” This interpretation implied that Lamar is
going to set A = y, which is not correct.
Lamar proceeded to set 2xy = -2x2 + 24 on his scratch paper and worked on isolating y
by itself. He correctly got the result
𝑦 = -!#./'
!
. At this stage, Lamar told the researcher that he
was going to set y = 24 and find that value of x. While incorrect, this did show consistency in his
current reasoning because he knew the maximum value of the given curve has a y-coordinate of
24. He graphed his result on Desmos and adjusted the viewing window to look at only positive
values of x. He graphed the horizontal line y = 24 on his graph and began to search for the
intersection of this line and the curve he recently graphed. Using Desmos, Lamar obtained a
rounded x-value of 0.49. Wanting to make sure he had the correct value Lamar used his
calculator and inserted 0.49 in for x in his result and told the researcher, “I’m slightly off because
I get 23.99 and so forth; it’s very close. But Desmos isn’t giving me the exact value of x. So, x =
0.49 must be the value of x that gives the maximum.”
Lamar’s declaration of the maximum led to the researcher having the following dialogue
with him:

113
Researcher: “Does your answer make sense?”
Lamar: “Yes, because it gives me a y-value equal to 24.”
Researcher: “What would the value of A be?”
Lamar: “Let me see . . . 2 times 0.49 times 24. That is 23.52. Well, now looking at it that
would be incorrect because A would not be equal to 24. That’s weird. I set them equal to
each other.”
Researcher: “What are you setting equal to each other?”
Lamar: “I’m setting A = y, but I’m getting contradicting information.”
Researcher: “Can you tell me what you need to do to complete this task?”
Lamar: “Yeah, I’m trying to find the maximum of the parabola, the maximum of the
equation 24 – 2x2. Looking at my graph, I can see the maximum is (0, 24) so I believe the
maximum is 24.”
The “contradicting” information has really thrown Lamar off. His rounding error is
leading to the difference in values, but he was completely changing gear and declared the
maximum of the given curve to be the maximum because its value is 24.
The researcher asked Lamar the semi-structured question of what values he can figure out
if he knows the value of x = 1. Lamar correctly described to the researcher that he needed to
substitute x = 1 into the curve to obtain the value for y and then substitute the values into A. He
told the researcher, “I’m going to try and rearrange the product here, the A = 2xy into y = x type
of format. Therefore,
𝑦 = 3
'!
.” While algebraically correct, this did not help Lamar move any
further in the task.
This algebra move led the researcher to have this conversation with Lamar:
Researcher: “When x = 1, what is the value of y?”
Lamar: “Let me see . . . I get y = 22.”
Researcher: “Based on this y value, what would be the value of A?”
Lamar: “Um, that would be 2 times 1 times 22, which is 44.”
Researcher: “You have a value of A that is 44. So does your current value of 24 for A
make sense?”
Lamar: “No. Having x = 1 makes more sense because A is larger. So, basically I can do
another similar thing that I did last time and make that sort of chart again and look for a
pattern.”
Lamar had finally taken the statement he told me about the two tasks in the interview
being similar and was going to apply it. Keeping this idea in mind, Lamar let x = 2. He correctly

114
computed the value of y as 16 and the value of A as 64. He told the researcher, “Eventually the
x-value will cause the product to change so I will find the maximum that way.”
Not sure of what he meant by this, I let Lamar continue. He let x = 3 and got the correct
value of y to be 6. Lamar then correctly computed the value of A to be 36 and he told the
researcher, “See the product has changed. So, the maximum value is either between 1 and 2 or
between 2 and 3.” The researcher was now aware of what Lamar meant by the product changing.
Lamar decided to try the two middling values of x: x = 1.5 and x = 2.5. Using his Desmos
graph and his calculator, Lamar got the correct value of 58.5 for A when x = 1.5 and 57.5 when
A = 2.5. Based on these two extra points, Lamar told the researcher, “Both of the points are
smaller than the value of 64 for A I got when x = 2. Therefore, I am certain that x = 2 will give
me the maximum value of A.”
During this task, Lamar spent a considerable amount of time in the inner two layers of the
Pirie-Kieren model (Figure 13). The main reason for this is because he spent a considerable
amount of time confused about how he needed to approach the task. Lamar also thought that y =
A which added to the confusion. Once Lamar finally figured out how to approach the task, he did
make his way into the image having layer of the model because he did utilize a strategy similar
to the strategy he used in Task 1 without having to refer back to it. Even though Lamar was
confused about how to approach the task, he did demonstrate a considerable amount of
prerequisite skills. Lamar was able to successfully isolate y as a function of x when he set y = A,
and when he isolated y in the formula for A. Lamar was able to correctly use the formula for A
correctly. Most importantly, what helped him complete the task is Lamar had an intuitive
understanding on increasing and decreasing functions as his “middling” strategy allowed him to
deduce the maximum value of A as 64.
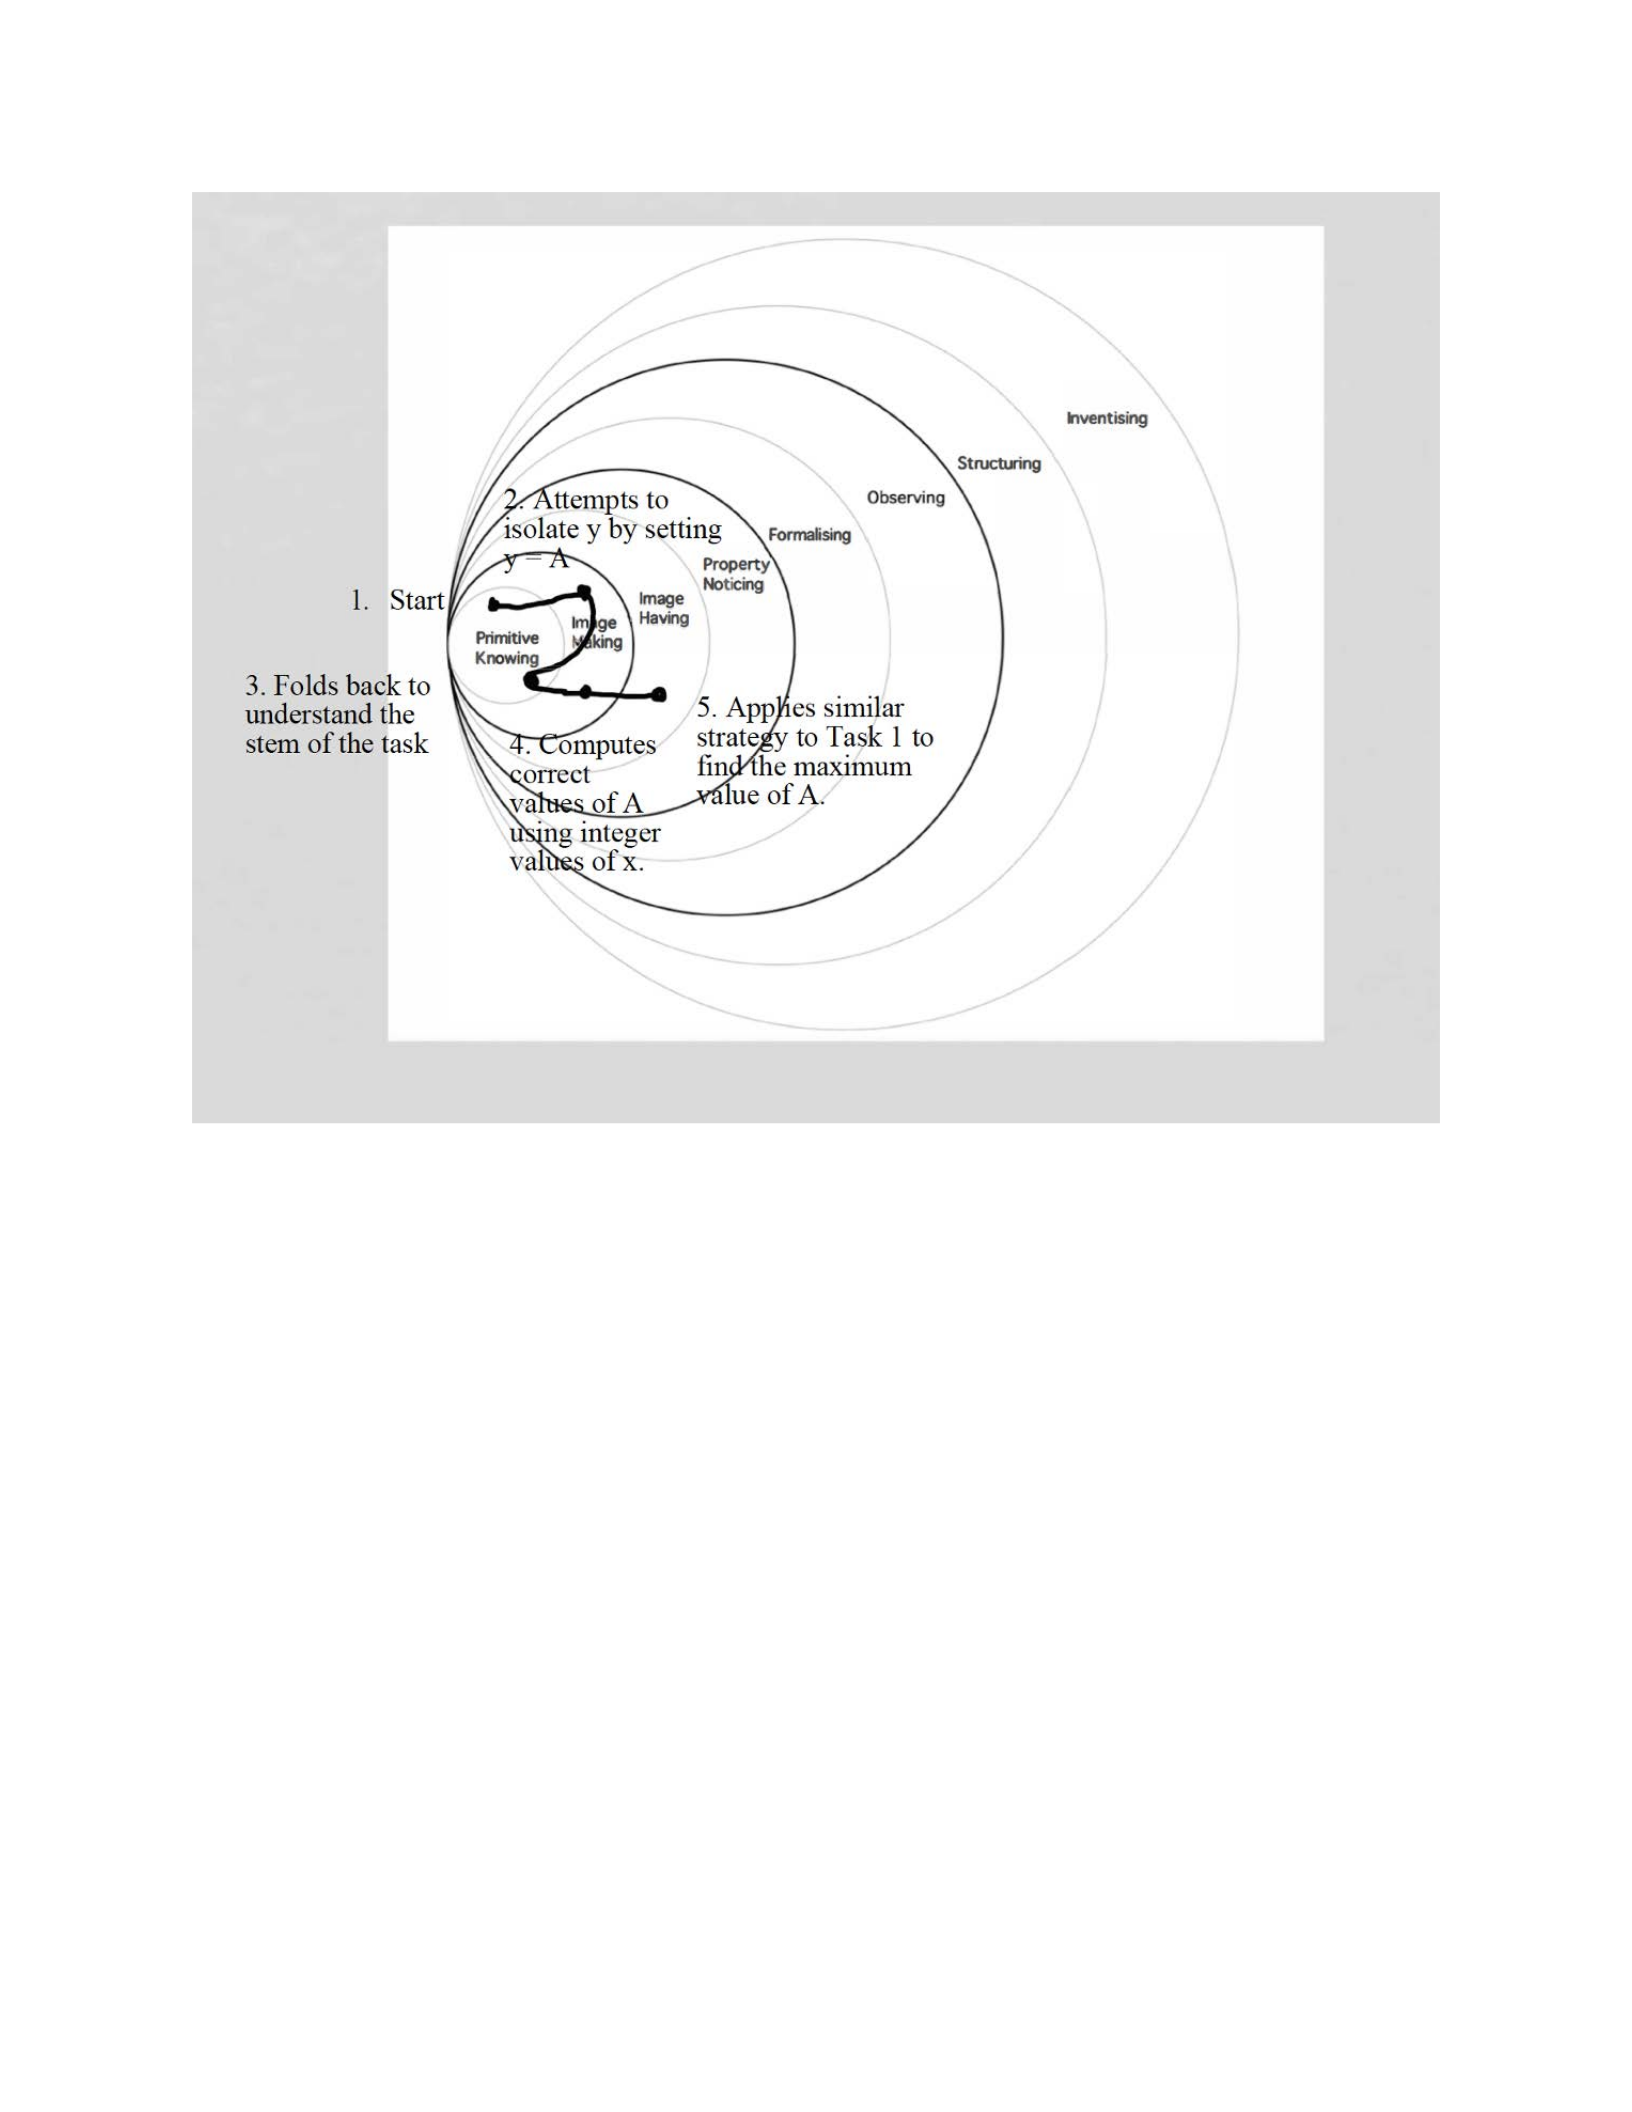
115
Figure 13. Pirie-Kieren Model for Lamar Task 2 of Interview 1
In this task, every participant demonstrated a few prerequisite skills. All were able to use
the formula for A correctly, graph the given curve in the task in an appropriate window, and
identify the vertex of the given curve. Unfortunately, all the participants also made the same
error at some point along the task of assuming that A = y, despite the fact that A was dependent
on y. Even though every participant made this mistake, each one was able to successfully
complete the task and gave the researcher the correct maximum value of A and the x-value
where the maximum occurs.

116
There was a divide about the understanding of the maximum value. James and Charlie
made the conclusion after only trying two different integer values of x. As a result, both were not
able to meaningfully justify why x = 2 would produce the maximum. While they provided the
correct answer, if the maximum occurred at a decimal value of x, both would have given an
incorrect answer. Ashley demonstrated a little more understanding despite also using only
integer values for x only. She was able to plot for four ordered pairs and describe to the
researcher when the graph of A may look like to justify her answer. Lamar and Manuel both used
their skills to present a better justification for the maximum. Lamar used a “middling” strategy
similar to Ashley’s strategy in Task 1. But this technique showed his understanding of increasing
and decreasing functions. Manuel was the only participant who was successfully able to
substitute the curve in for y in the formula for A and sketch a graph of A. Manuel then used his
graph of A to justify his answer. Charlie did make an attempt at this, but not knowing that he
could substitute the curve into the formula for A hindered his progress.
Interview 2 Task 1
The first task in the second interview required the participants to maximize the revenue of
a businessperson makes selling “JPads”. The keys to succeeding in this task is to be able to
understand how the price of the JPad and the amount of JPads change together and that the
covariational relationship the product of these two quantities have with the revenue generated by
the businessperson. While the approach to solving this task is exactly the same as the first task of
the first interview, what makes this task slightly more difficult is that both quantities are
described as changing in increments other than 1. The first task of the second interview is below.
Task 1

117
Mr. Yates makes and sells 1,000 of his new JPads per week at a cost of 350 dollars per unit.
Because the demand is high, he has decided to raise the price of the JPad, but he is only
considering raises in five-dollar increments. Market research has shown that for each five-dollar
rise in the price, ten fewer customers are expected to buy the JPad. Thus, if the price is 355 per
JPad (an increase of only one five-dollar increment) only 990 customers are expected to buy the
item (ten fewer than 1,000). If the price of the JPad is set at 360 dollars (going up two five-dollar
increments, then only 980 customers will buy it. Assuming that the market research is correct,
how much should Mr. Yates charge for JPads to maximize his revenue? (Gurl, Artzt, & Sultan,
2012).
James:
When James completed reading the task, he told the researcher “this is exactly like we
did last time.” Based on this, the researcher asked James what he was thinking. James explained
that because this task was similar to the first task from last time, he wanted to use a similar
strategy of generating a formula like he did last time. In the first interview, he attempted to
generate a model for the task, but missing parentheses were his undoing.
Writing down the information from the stem on his paper, James was very determined to
come up with a formula right away to complete this task. After verbalizing information and
thinking of possibilities, James came up with the suggestion of using (350 + 5x) to represent the
price of the Jpads and wrote this quantity with parentheses on his paper. Just before the
researcher was about to probe James, James told the researcher, “In this equation, x is the
number of Jpads Mr. Yates sells.” James continued to write down random numbers that involved
the price of the Jpads but had not referenced the amount of JPads that are sold at each price

118
point. In an effort to see where James’ thoughts were in approaching this task, the researcher had
the following conversation with him:
Researcher: “What are you trying to compute with all the numbers you have written
down?”
James: “I need to compute the profit, but the 350 plus 5x is as far as I have gotten so far.”
Researcher: “Ok, so what else would you need to know in order to find the ‘profit’.”
James: “Well, the increments of 10 customers that he will lose so I can try to formulate
this formula to maximize the profit.”
Researcher: “How are you planning to utilize the increments of 10 customers?”
James: “That’s what I’m trying to figure out here.”
This series of questions told the researcher that James understood that the 10 customers
piece of information needed to be utilized somewhere in the task. However, James was missing a
fundamental prerequisite skill that revenue is computed by multiplying the price per unit times
the number of units sold. The researcher wanted to see if James understood the revenue
computation, which he referred to as profit, if he tried to use the explicit numbers given in the
stem of the task. The researcher asked James, “How many JPads would Mr. Yates sell if the
price of the JPads is $350?” James incorrectly answered that Mr. Yates would sell 990 JPads. As
a follow up, the researcher asked James, “How much ‘profit’ would Mr. Yates make?” James
used his calculator and correctly multiplied $350 and 990 to get a total of $346,500.
The researcher probed James to try and compute the ‘profit’ for various prices of the
JPad. James brushed the researcher off and continued to fiddle with finding a formula to
“simplify the task.” After a minute of writing down information that got James no closer to
accomplishing the task, the researcher intervened, and the following dialogue occurred:
Researcher: “James, can you tell me how you got your original profit of $346,500?”
James: “I took the $350 price of the JPad and the 990 JPads sold and multiplied the
numbers together.”
Researcher: “Okay, so then what would this imply about what your formula would have
to look like?”

119
James: “Let me think about this. So, I think that the formula is (350 + 5x)•990 and I’m
trying to figure out the increment of 10 less customers every 5 increments we go up. So
far that’s all I have.”
Researcher: “Maybe we should try another explicit value. Could you tell me how many
Jpads Mr. Yates would sell if the price of the JPad is $375?”
James: “Oh, my formula would be (350 + 5x)(990 – 10x).”
Despite brushing off the researcher’s last question, James came up with a formula that
was consistent with his current error. He had believed from the beginning that at $350, Mr. Yates
sold 990 Jpads despite the stem clearly stating otherwise. Using this formula, James went on to
answer the researcher’s last question. He figured out that if the price is $375, then x = 5 in his
formula. James substituted 5 in for x in the “quantity” portion to get that Mr. Yates sold 940
Jpads. This is a consistent incorrect answer. Even though the researcher was aware that James
was giving incorrect quantities, he wanted to see if James understood how to go through and
complete the task with the incorrect values.
After writing down the price $375 and the quantity 940 on his paper, James told the
researcher, “I am stuck on how to find the maximum.” The researcher asked James if he had a
strategy to find the maximum revenue. James told the researcher, “I could try one by one, but
that is going to take a long time.” James used this strategy of trying one by one in the first task of
the last interview.
Convinced that James was not going to stray away from his formula, the researcher asked
him, “What can you do with the current formula that you have given me?” James thought about
this question for a bit and said, “I can simplify further.” Not understanding what James meant by
this, the researcher watched as James factored 5 from (350 + 5x) and factored 10 from (990 –
10x). He did factor correctly and wrote down 5(70 + x)10(99 – x) on his paper. “See I simplified
5 and 10 out,” he told the researcher.

120
James did not consider trying to expand his two binomials or trying to graph his formula
to help complete the task. The researcher wanted to see what his thought process was. Using
James’ simplified formula, the researcher asked James “If you see an expression such as (70 +
x)(99 – x), what would you do?” James responded, “I would set the expression equal to 0.”
James then proceeded to set his simplified expression equal to 0 and got x = 99 and x = -70.
While x = 99 was incorrect, it was consistent with the formula he believed was correct. The
researcher asked James if these two x-values meant anything. James told the researcher, “I
realize setting it to 0 is an option, but the answers don’t really . . . I feel like I did this for nothing
because it’s not like an answer I’m looking for.” James missed an opportunity to gather useful
information. Setting his equation equal to 0 would give him the values of x where Mr. Yates
would not make any revenue (profit to James). But James did not realize this.
As James continued to talk his way through his formula, he told the researcher, “The
most that he could sell is 99 because if you plug that in for x, you would end up with 990 so it
would be 990 – 990 which is 0. So that’s 0 customers.” James wrote down 99 and 0 on his paper
to indicate that that at x = 99, there would be no customers. After thinking about this, James told
the researcher, “Maybe if I figure out the middle ground between 0 increments and 99. Let’s say
the middle is 50.” James proceeded to substitute x = 50 into his formula and then said, “I’m
going to try two other x-values to see which direction the maximum is in.”
When James substituted x = 50 into his formula, he got the correct revenue of $264,500.
He quickly concluded that this was not the maximum because he knew that when x = 0, 350•990
gave him $346,500. James explained to the researcher that, “I’m going to try x = 25.” James had
adopted the “middling” strategy used by some of the participants in the first interview. James
used his calculator and correctly computed the revenue to be $351,500 when x = 25. James

121
explained, “My current ‘profit’ is higher than the initial price of 350 and higher than when x =
50. So, I can go lower and try x = 20.”
Continuing with his current strategy, James used x = 20 and correctly obtained a revenue
of $355,500. He told the researcher, “This is closer because it is higher than when x = 25. I know
this is the long way, but I know it will work. So, I’m going to do it as 15 now.” James used x =
15 in his formula and correctly got a revenue of $357,000.
James then changed course and began to analyze the amount of change in the revenue
based on the amount of decrease in x hoping to find a pattern to help him find the maximum
faster. James subtracted 355,500 from 357,000 to get 1,500 and explained to the researcher, “I
know the x went down 5 and I get 300 per increment by this calculation. This is less than the
increment between x = 20 and x = 25.” Without saying it, James knew that the “average rate of
change” was decreasing but did not understand that using this key piece of information could
help him to find the maximum. This showed James had fragmented information but did not know
how to piece it together in a meaningful way.
Surprisingly, James gave up on the “average rate of change” strategy and went back to
his “middling” strategy. He used x = 10 and correctly computed the revenue to be $356,000 and
claimed, “My peak is in between 15 and 10.” Knowing this, he tried x = 13 and correctly got
$356,900. Then he tried x = 14 and correctly got $357,000. James scratched his head in
confusion and told the researcher “I must have did something wrong because there are two x-
values that give me the exact same revenue.”
At this point, James still did not realize that he had used the incorrect formula the entire
time which caused him to get two maximums. The researcher asked James if it was possible to
have more than one price point that yields a maximum value. James thought about this and told

122
the researcher, “I guess so. This means Mr. Yates should charge either $420 or $425 in order to
maximize the profit,” and put his pencil down to signal he was done just as the timer went off for
the first task.
During this task, James showed more prerequisite skills than he did doing the first task in
the first interview. However, James remained mostly in the first two layers of the Pirie-Kieren
model (Figure 14). Towards the end when he decided to use the “middling” strategy, James did
move into the image having layer because he did not need any assistance to guide him which
direction to go in order to find the maximum. James demonstrated his ability to generate a
formula (although it was incorrect) and used his formula in a meaningful way to find the
maximum. James also stumbled across the average rate of change, which would have given him
insight into the first derivative and a calculus way to solve the problem. But James abandoned
this idea and continued with his “middling” strategy where he showed that he understood the
concept of increasing and decreasing functions as he correctly changed values of x every time
until he got to his maximum ‘profit’ to complete the task.
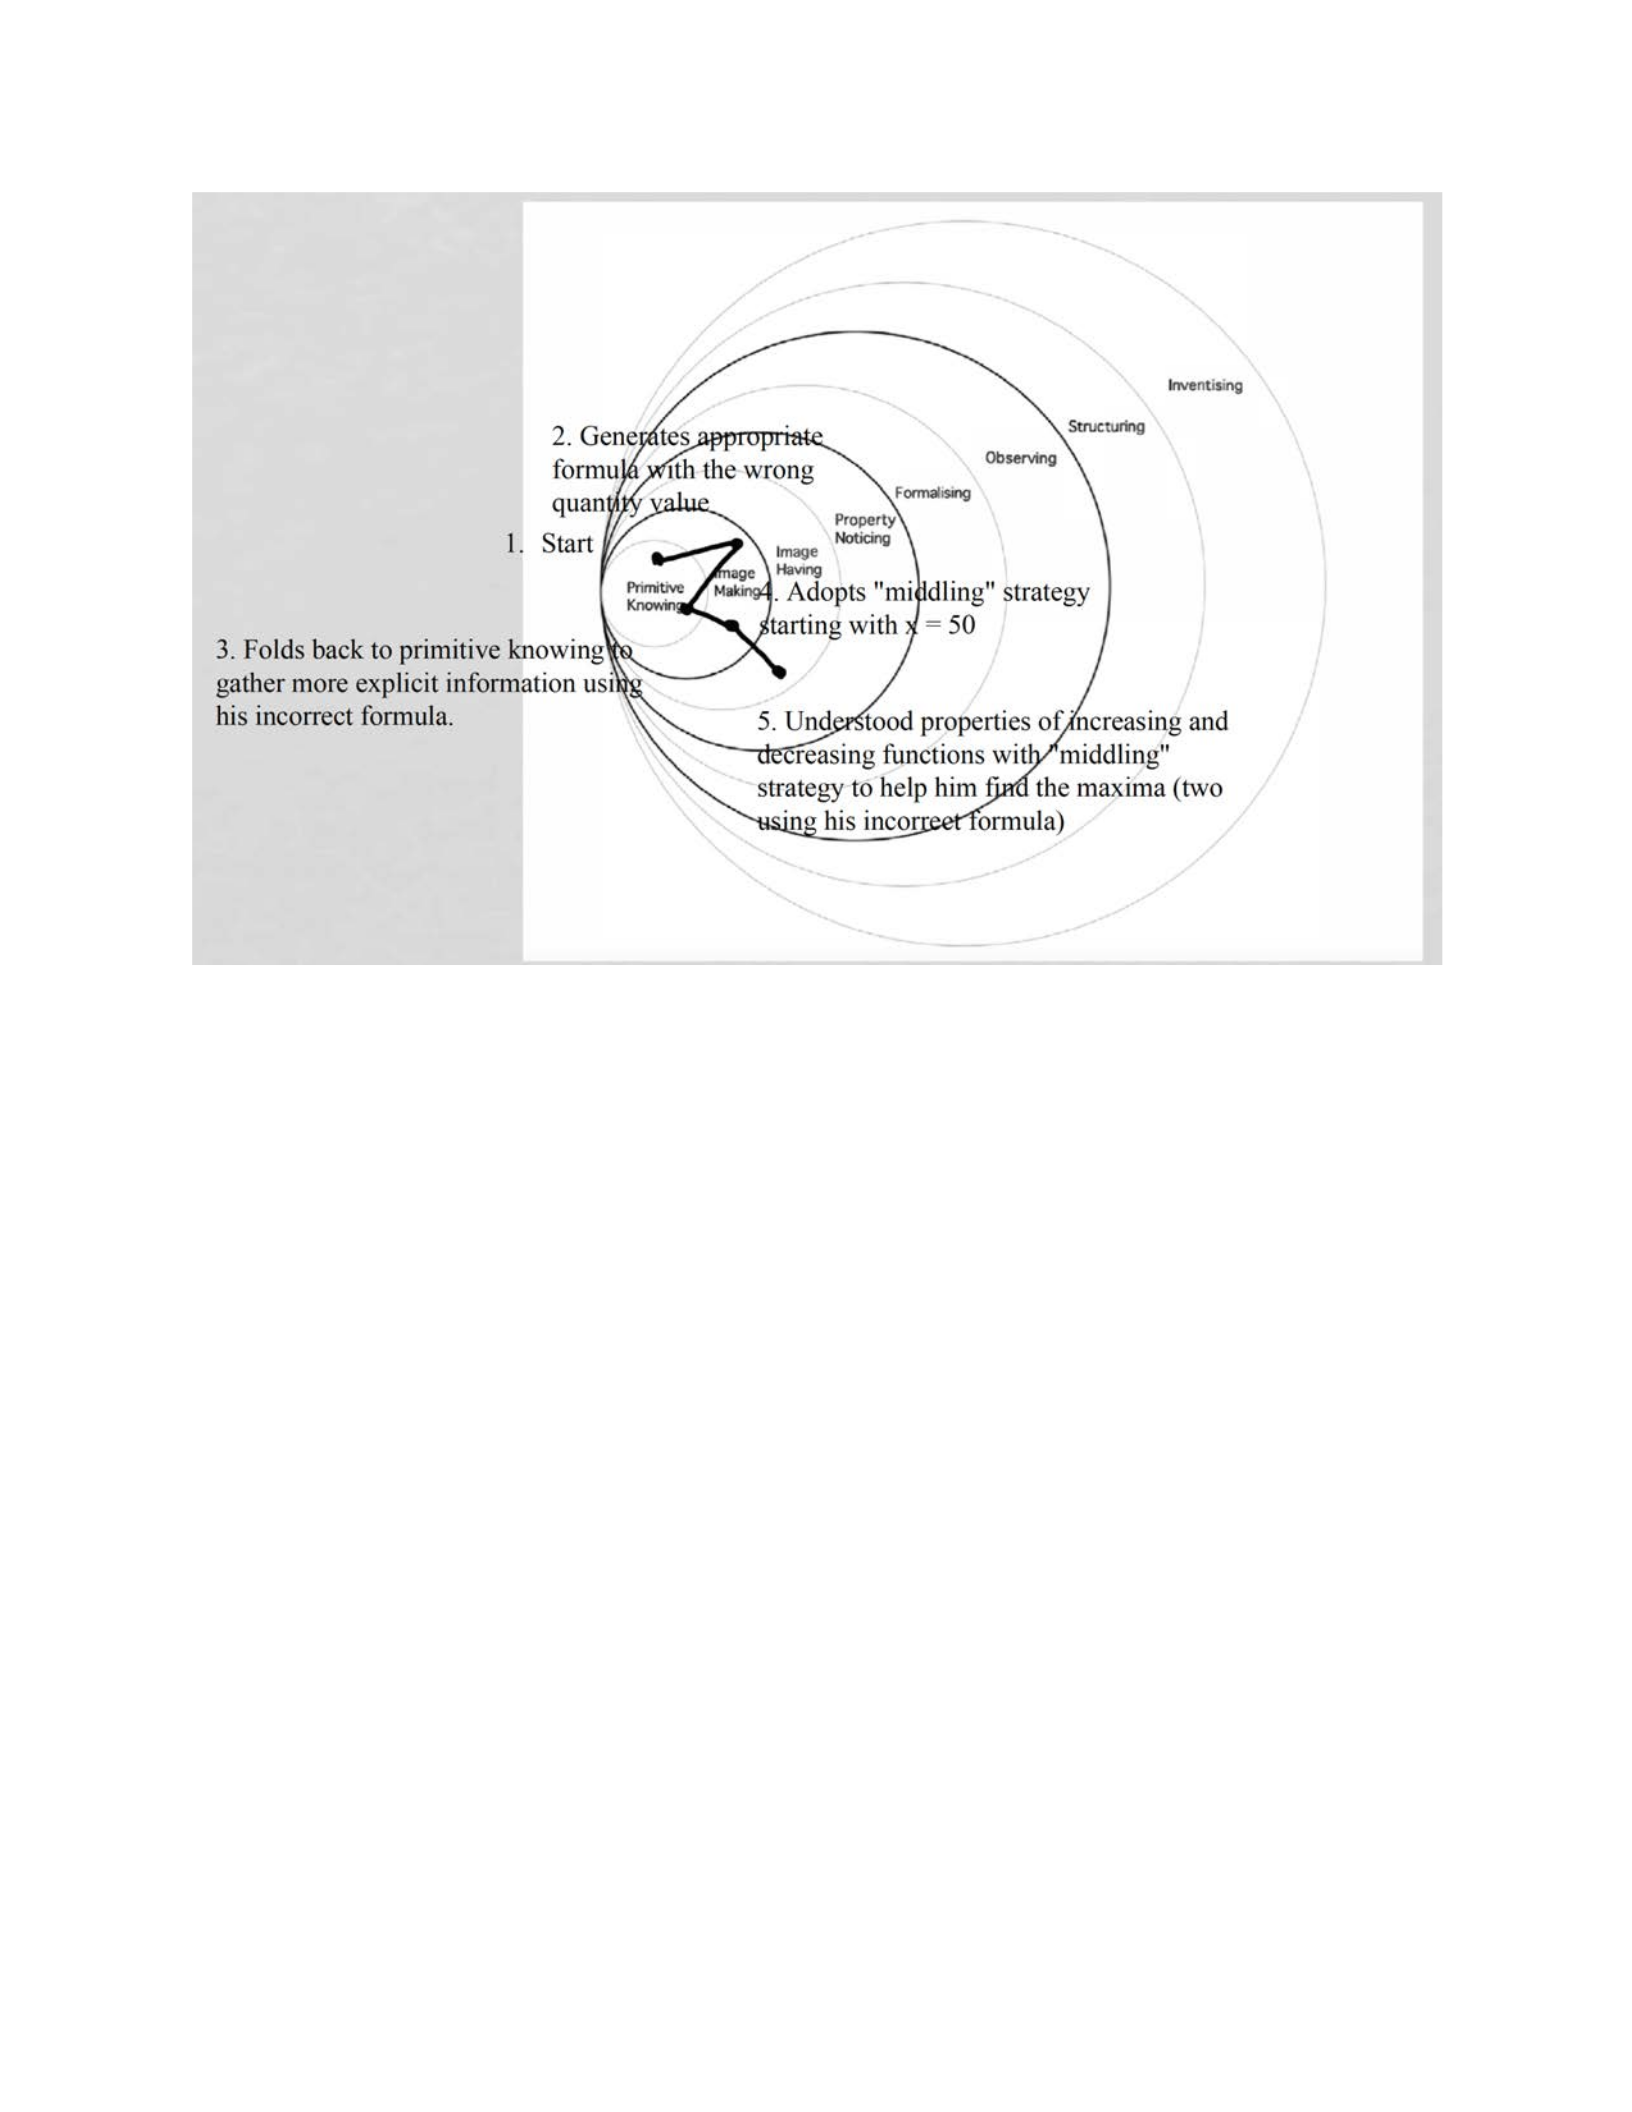
123
Figure 14. Pirie-Kieren model for James Task 1 of Interview 2
Ashley:
Once she completed reading the task, she noticed right away that this task is similar to the
first task from the first interview. Ashley immediately told the researcher, “Well I can use the
guess and check technique I used the last time since I know it works, but I want to try and find
another way to solve this.”
Ashley used her calculator and figured out that the amount of “profit” is $350,000 which
she claimed is 350 times 1000. She explained to the researcher, “Now, I’m going to use Desmos
to find other calculations. I’m starting with 360 times 980 since they have given me these
numbers in the problem.” She correctly computed the product of $352,800. This showed her

124
understanding of the capabilities of Desmos in that the program can do computations as well as
graph. But she also demonstrated her ability to use the information in the stem of the task
correctly. This signaled to the researcher that she remembered some of the process from the first
task of the first interview.
Comparing the two products, she correctly concluded that the maximum revenue will be
from having less product sold at a higher price relative to the information in the stem of the task.
She informed the researcher, “I’m going to take these two points and try to find the slope. The
customers will be the x on bottom and on top will be the price so the 360 – 350. This gives me
10/20 which is one-half.” Ashley did the exact same thing in the first task of the first interview
which did not work. But she did not realize that this same technique will not work here either.
While Ashley saw the similarities of the two tasks, she also employed the same wrong technique
in the two tasks. She also gave the incorrect slope due to a sign error.
While Ashley was not aware that she was heading down the wrong path, she did
understand what was happening in the problem. She explained to the researcher, “well every
time I add $5 to the price, I lose 10 customers. So, I’ll go down to 950 customers. Take that
down that’s minus 10 times 5 so I have to add $25. So, the price is $385.” Ashley has interpreted
the number of times she will lose 10 customers correctly and figured out the correct increase in
price. However, she has mistakenly added the increase in price to the $360 instead of the original
price of $350. She stopped to think for a moment and exclaimed, “A-ha!”. Thinking that Ashley
realized her mistake, she instead told the researcher, “My slope should be 350 – 360 because
$350 is the original price. So, it’s -10 and therefore my slope is -1/2. This makes sense because
as customers decrease, price increases.”

125
While she corrected her original error, Ashley continued going down this rabbit hole
because she asked the researcher, “Should I be trying to find the equation of a line?” The
researcher explained to her that he cannot answer this question for her and that she should
continue with her thought process. She responded, “I’m not sure about the slope so I’m going to
have to guess and check which I know worked last time.” Ashley went on to compute another
slope using the original price and JPads sold, and the incorrect point she computed (385, 950)
and told the researcher, “This slope is -7/10.” She has not realized that it does not make sense to
get two different slopes as the rate of change of the price and number of customers is always the
same.
Her facial expression clearly indicated she was not happy with the slope of -7/10 and
Ashley decided to change tactics and said, “I’m going to go halfway so I’m going to bring the
number of customers down to 500. That would be 50 which is the -10 times 50. So, that would
be plus $250 to the original price.” She went back do Desmos and computed the correct product
of 500 times 600 to get $300,000. She stated to the researcher, “That’s definitely a decrease.
HMMM!”
Not really sure how Ashley felt about that result, the researcher engaged in the following
exchange with her:
Researcher: “You sound shocked by the revenue you got?”
Ashley: “Yeah, I was expecting it to increase.”
Researcher: “Why did you expect an increase?”
Ashley: “This would make sense because the revenue increased when the price went
from $350 to $360.”
Researcher: “So, what does this mean for your strategy?”
Ashley: “I know that I can guess and check to solve this problem since that’s what I did
last time. But I want to figure out another way to solve this.”
Researcher: “So, what is preventing you from using the guess and check technique?”
Ashley: “We’ve been in calculus for seven weeks. I should have a better strategy. But
I’m stumped because the last time it went up and then down in a constant amount. So,
you’d think it would be sort of a parabola.”

126
This exchange showed that she did remember the first task of the last interview ended up
being a quadratic function. But Ashley did not see the same pattern because the prices she used
started at $350, $360, $385 (incorrect value), followed by a huge jump to $600. Knowing that
Ashley has some facts correct, the researcher tried to refocus her thoughts because she was going
all over the place. Ashley told the researcher, “I’m trying to find a function for this, but I don’t
know if it’s a parabola or an exponential or something like that.” The researcher asked Ashley,
“What are you trying to do to complete this task?” Ashley answered, “I need to compute the
revenue.” Ashley went through a roundabout explanation, but correctly explained that the graph
should be a parabola when she said, “The main thing is that there’s a pivot point. It gets higher
and higher and then it turns.”
Determined to obtain a graph, she goes back to Desmos. She explained to the researcher,
“I’m going to graph my points with number of JPads as x and the price as y. I’m going to remove
a 0 from each of the points to keep the graph in a reasonable window.” This showed
understanding of the ability to reduce the scale by a factor of 10 without changing the outcome.
She plots three points: (100, 35), (98, 36), and (60, 50). However, the last point was incorrect as
based on Ashley’s presentation of the ordered pairs, it should be (50, 60). Ashley computed the
price if the number of customer who bought JPads was 800, which she correctly solved to obtain
a price of $450. Ashley plotted the point (80, 45) on her graph as well. Not satisfied with the
graph, she told the researcher, “I’m surprised because I’m expecting to see a parabola, but it
looks like a line but it’s not consistent. (80, 45) looks different.” She has made two errors here:
the first is that the point (60, 50) is inconsistent with the other three points on the line. The
second is she did not realize that in order to find the maximum revenue using the graph, she
needed the revenue to be the y-coordinate.

127
To help get Ashley back on track, the researcher asked her what the point (50, 60)
represented. Looking at her work, she answered, “The price is $600, and the number of
customers is 500. Oh wait, that’s backwards. The point should be (60, 50).” She transposed the
coordinates in Desmos and now sees all the points in a straight line. She then said, “I’m going to
multiply 800 times 450 because last time the maximum was around the middle. That gets
$360,000. That’s an increase. I’m going to do the ones directly next to them to see if I have to
move.” Ashley reverted back to the “guess and check” method she implemented in the first
interview.
Using Desmos, Ashley inputted 790 times 455, correctly got $359,450 and concluded
that the revenue decreased. She then inputted 780 times 460 and got $358,800 and said, “That’s
another decrease. I’m going to go 10 up.” She moved in the other direction increasing the
number of customers and reducing the price. She correctly multiplied 810 times 445 in Desmos
to get $360,450. She told the researcher, “It’s actually higher. That’s an increase at 810. So, I’m
just going to go back to the 385 and 950.” This is the point she calculated that was incorrect and
the researcher did not know why Ashley was going way back to this point. Ashley used Desmos
and computed 385 times 950 to get $365,750. She then explained to the researcher, “This is a
way higher value compared to the other points. I think I better double check this because I’m all
over the place right now.” Going back to her work, she realized that she made a mistake, and the
cost should only be $375 when 950 JPads are sold.
She informed the researcher, “I’m going to find the y-intercept of these points on the line,
but it looks like it is only decreasing.” She was clearly very lost on this problem despite her
telling the researcher that the process should be the same as on the first task of the first interview.

128
Before Ashley got a chance to compute the y-intercept, the timer went off signaling that it was
time to move on to the second task.
Despite knowing that this task could have been solved using the same process the
employed in the first interview, Ashley’s determination to try and find a “more sophisticated”
method left her in the inner two layers of the Pirie-Kieren model (Figure 15). She folded back to
the Primitive Knowing layer a couple of times during the interview as she started off fine but
needed to fix a couple of mistakes. Ashley’s biggest issue that kept her in the inner two layers
was repeating the same mistake she made in the first interview by insisting that she needed to
find the slope of a line in order to complete the task. However, in this interview she was very
fixated on a line despite knowing she needed to have a parabola in order to complete the task.
This, along with not graphing the revenue as the y-coordinate, prevented her from making any
substantial progress on the task. Ashley did demonstrate some prerequisite skills in the interview.
She understood how to compute the revenue in the task and understood the relationship between
the cost of the JPads and the number of customers who bought them. She also demonstrated ratio
knowledge when she showed she could reduce both the number of customers and the price by 10
to keep the graph in a reasonable window, but not affect the overall answer.
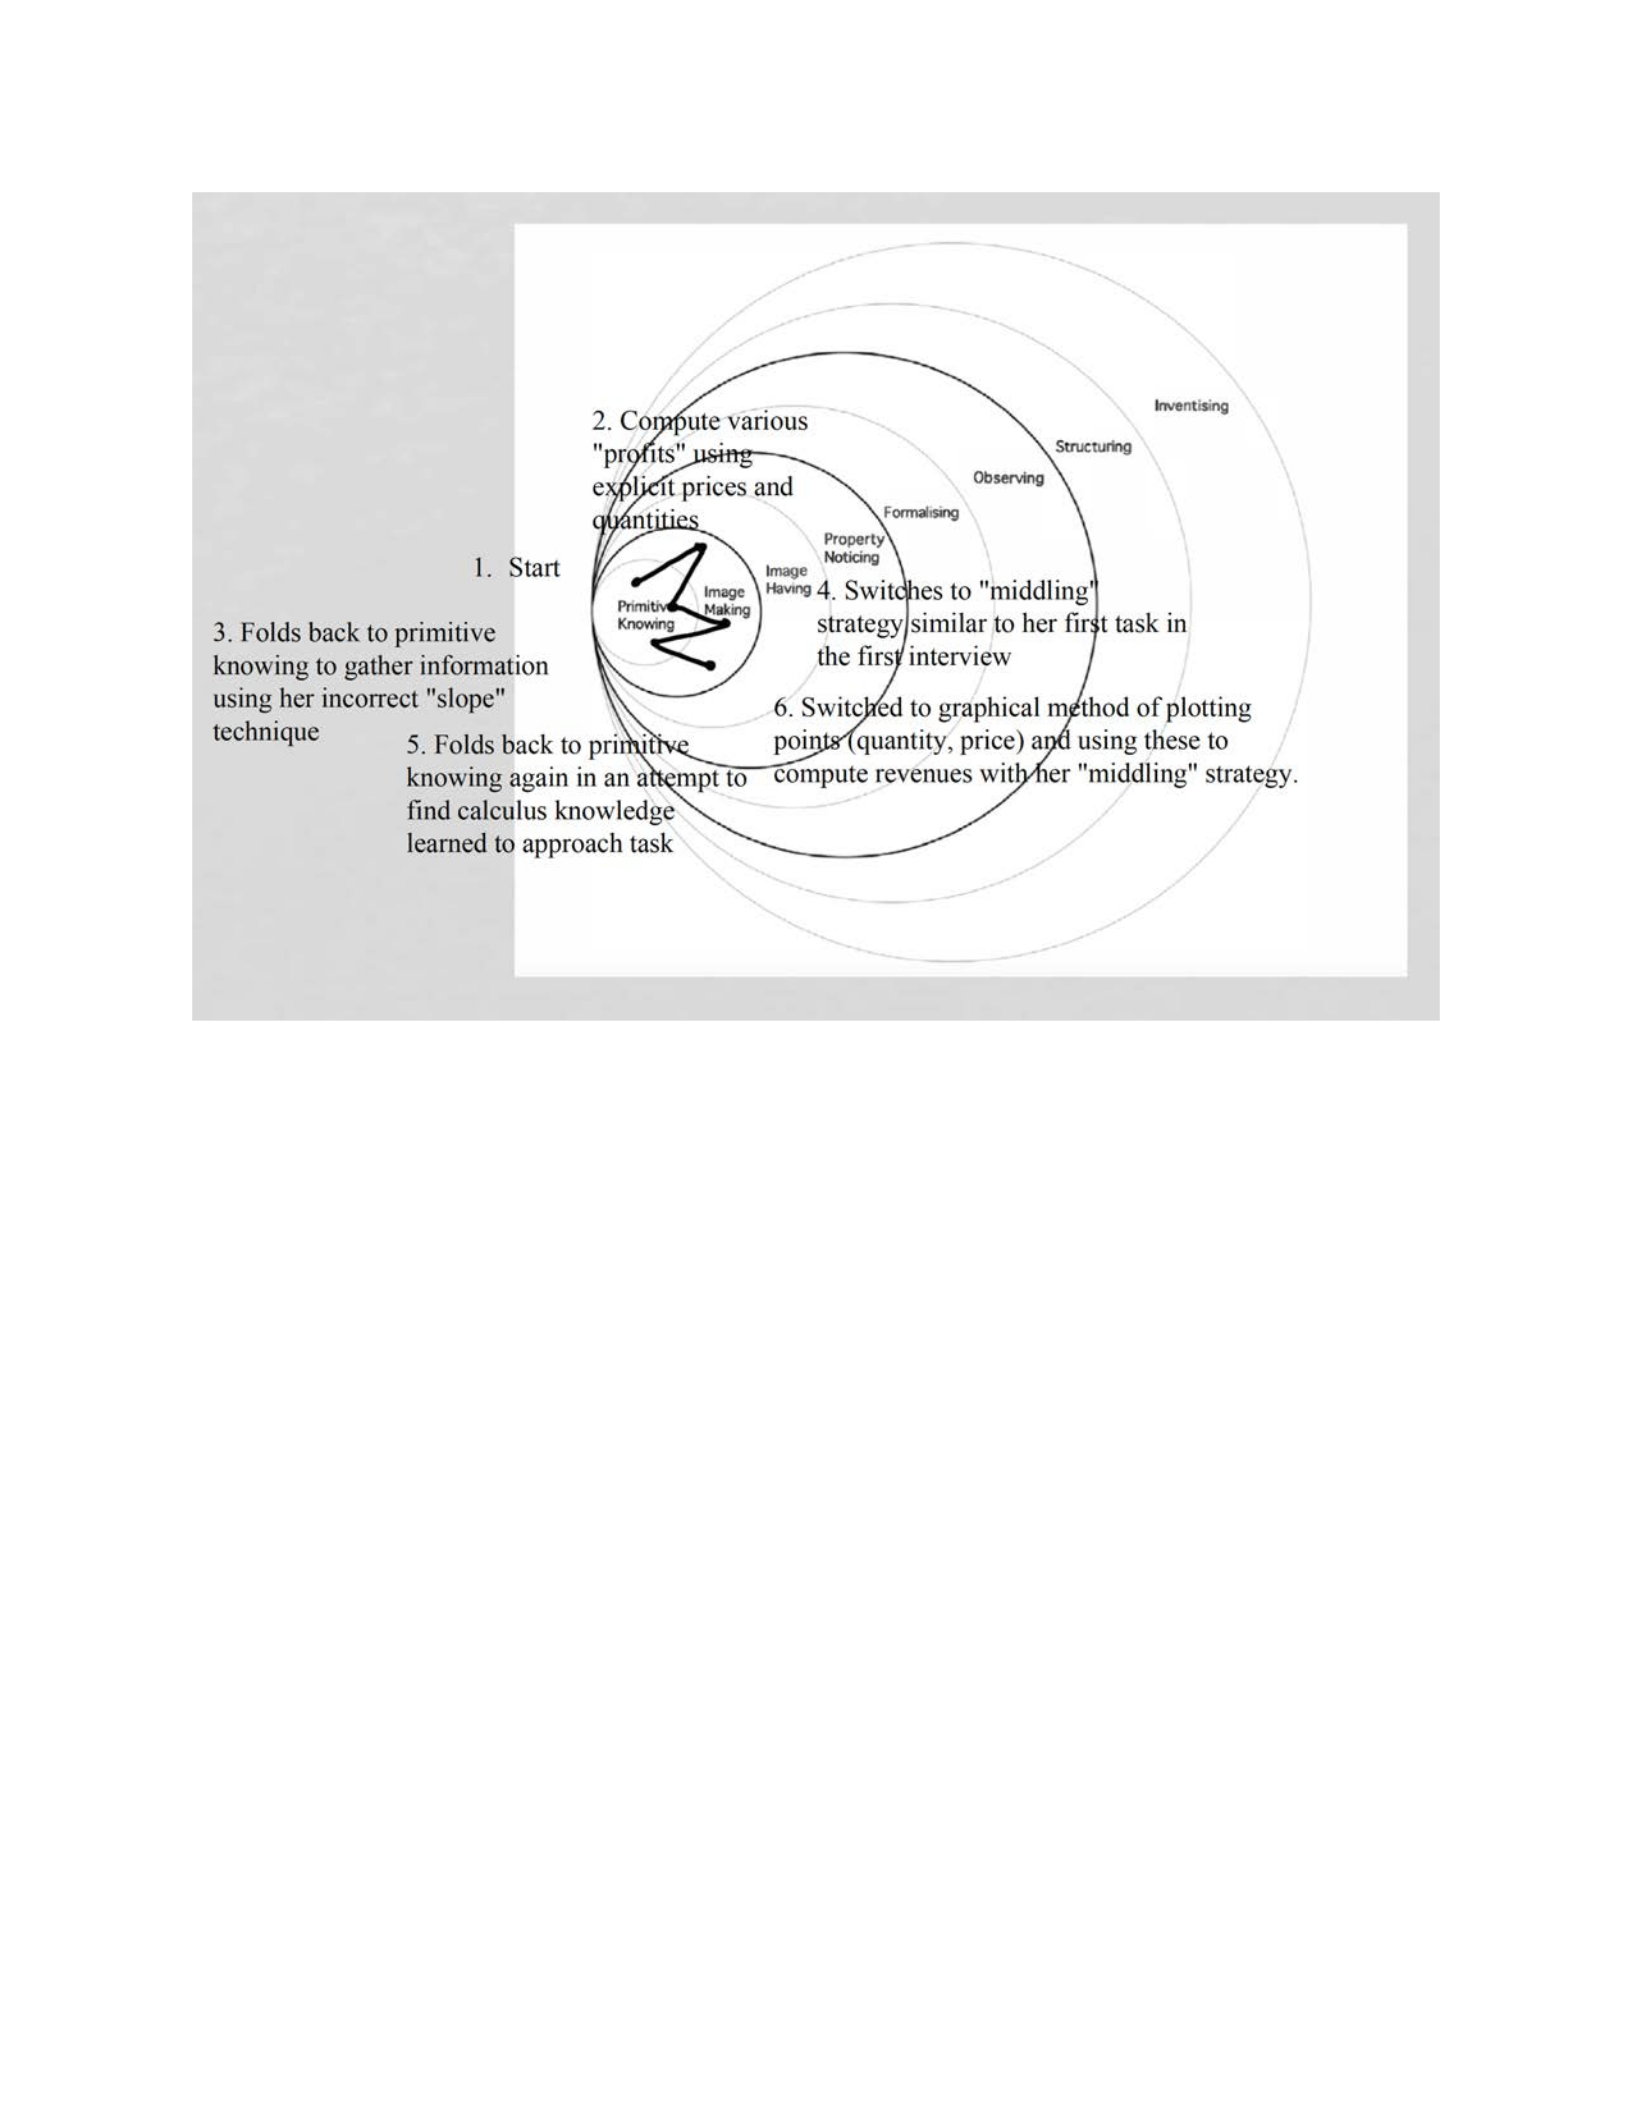
129
Figure 15. Pirie-Kieren model for Ashley Task 1 of Interview 2
Charlie:
When he finished reading the task, Charlie realized that this task was similar to the first
task of the first problem. He said to the researcher, “I’m thinking of using the same strategy I
used the last time.” Keeping that in mind, he wrote down a list with several amounts of the
number of JPads sold and prices. He started by writing 1000 JPads and $350 on his paper. He
said to himself, “For every $5 increase, there are 10 less customers.” He proceeded to write 990
times $355 and 980 times $360 on his paper under the 1000 and $350 on his paper.
This was the exact same strategy Charlie used the last time, so the researcher was
interested if Charlie can quicken up the process and demonstrate understanding of the process. I

130
asked Charlie how many JPads Mr. Yates would sell if the price were $375. After some thinking,
he replied, “That would be 50 less customers because uh . . . that would be 50 less customers.”
While Charlie had the correct number, he failed to explain why. However, he wrote 950 times
$375 and then went to Desmos on the computer to compute the product. He correctly computed
and told the researcher that the product is $356,250. This either showed some basic
understanding about what he needed to do to complete the task, or he remembered the process
that he did the last time.
Charlie continued to write down additional quantities, prices, and products on his scratch
paper. He wrote 900 times $400 and multiplied them to get $360,000. He then wrote 890 times
$405 and multiplied them to get $360,450. Below this, he wrote 880 time $410 and multiplied
them correctly to get $360,800. Based on the prices, and the associated quantities, the researcher
was convinced that Charlie understood the pattern given in the stem of the problem.
Interested if Charlie could talk conceptually about revenue in the problem, the researcher
asked Charlie if there was another way he could approach finding the maximum revenue in this
task. Charlie answered, “I don’t know. But maybe if I write down some other values it might
help me.” Charlie wrote down other prices in a column: $380, $385, $390, and then all of a
sudden went up to $500. When the researcher asked Charlie why he wrote down $500, he simply
responded, “It’s $100 more than $400.” Not exactly following Charlie’s reasoning, the
researched allowed Charlie to continue to figure out another way to find the maximum revenue.
The researcher was unsure if Charlie would be able to find another way to find the
maximum revenue because Charlie spent a few minutes trying to make the leap from $400 to
$500 by correctly justifying that it was 20 price increments. However, Charlie was unable to
determine how many JPads would be sold if the price of the JPads were $500. I encouraged him

131
to write down the other prices if he needed to like he did in the first task of the first interview.
Surprisingly, Charlie responded, “I don’t want to write down 20 price increments because it’s so
much work and I think I can figure it out. But I think I’m messing myself up.” The researcher
was convinced that Charlie could complete the task if he wanted to go back to his old method,
but Charlie was determined to try and find another way to complete the task.
Still struggling to find the number of JPads at the price of $500, the researcher engaged in
the following conversation with Charlie:
Researcher: “Charlie, can you tell me how many JPads would be sold if the price is
$400?”
Charlie: “Uh, well that would be 900 JPads.”
Researcher: “What if the price is $405?”
Charlie: “That would be 895 JPads. Oh no, it’s 890 because the decrease is 10 JPads. See,
I get the pattern and I really want to set up an equation, but I don’t see where the
variables will be going.”
Researcher: “Well, what quantities would you need to know in order to set up this
equation?”
Charlie: “I would need the people and then the dollar increment increase. I know that the
$5 increment would be a variable because that’s changing the price. So, it would be like
$350 plus that change I think.”
Researcher: “When you are calculating the revenue, can you describe what you are
doing?”
Charlie: “Yeah, I’m multiplying the number of people times the price of the Jpad. So, I
guess these are the two things I need to set up my equation.”
Based on this conversation, the researcher is convinced that Charlie understands the stem
of the problem and that his previous technique will lead him to the answer. It appeared that
Charlie was determined to push his understanding by finding another way to complete the task.
After our conversation, Charlie wrote down “# of people times price = revenue” on his paper but
then explained to the researcher, “I don’t know if this equation only works because we have no
variables. So, I don’t know if this equation I have has one variable or two variables.”
The researcher encouraged Charlie to handle the quantities one at a time. Charlie decided
to start with the price. Looking at his paper, he decided to start with $350 and noticed that each

132
change increased the price by $5. Based on this, he told the researcher, “I can write the price as
$350 plus $5 times the number of increases.” He then wrote 350 + 5x on the scratch paper under
the location where he wrote the equation “# of people times price = revenue.” Charlie explained
to the researcher that he would take a similar approach with the quantity. Looking at the list of
quantities on his paper, he realized that the initial quantity was 1000 and he would subtract 10
times the number of price increases. Charlie proceeded to write 1000 – 10x on the scratch paper
next to the 350 + 5x he previously wrote on the paper.
Since Charlie was missing the parenthesis in both quantities, I wanted to see if he knew
what to do so I asked Charlie, “What do you need to do with the two quantities you wrote
down?” Charlie responded, “I need to multiply them together.” He proceeded to multiply the
quantities out on the scratch paper and Charlie put parentheses around the two quantities before
he continued. Using his calculator, he multiplied correctly to get the expression 350000 + 1500x
– 50x2. Charlie was unsure about whether his expression was correct, so he said, “I want to make
sure this is right, so I want to double check. Let’s see, when the price is $400, x would be 10.”
Using his facts, he correctly substitutes 10 in for x in his expression and gets a correct revenue of
$360,000 and concluded to the researcher that his equation must be correct.
Certain his equation was correct, he told the researcher, “My equation is a parabola that
opens down with a vertex, so it has to have a maximum.” Convinced that Charlie understood
what was going on, the researcher allowed Charlie to proceed. Charlie went on the computer to
Desmos, and input his equation in. Although it took Charlie a while to zoom out to get an
appropriate view of the graph, he eventually found a window where he could identify the vertex.
He told the researcher, “Looking at the graph, the maximum is $361,250 and that happens when
x = 15. Therefore, 15 price increments would give me the price that maximizes revenue.” Charlie

133
proceeded to correctly substitute the 15 in for x in into his price part of his equation and correctly
got $425, which he declared as his final answer.
During this interview, Charlie stayed mostly in the primitive knowing and image making
layers of the Pirie-Kieren model (Figure 16). While Charlie did recognize the task from the first
interview and remembered some of the process of how to accomplish the task, Charlie spent
most of the time determined to find a more mathematically elegant way to complete the task.
This kept Charlie in the image making layer. During the interview, Charlie was confused about
some of the facts needed to complete the task which caused him to fold back to the primitive
knowing layer to gather and solidify his understanding of the task. However, once Charlie was
able to successfully find an equation to model the revenue, he was successfully able to move into
the image having layer. He moved into this layer because once he obtained his equation, Charlie
recognized that the equation would be a parabola with the maximum at the vertex. He was also
capable of substituting a correct value of his variable in context to double check if his equation
was reasonable in order to identify the maximum revenue.
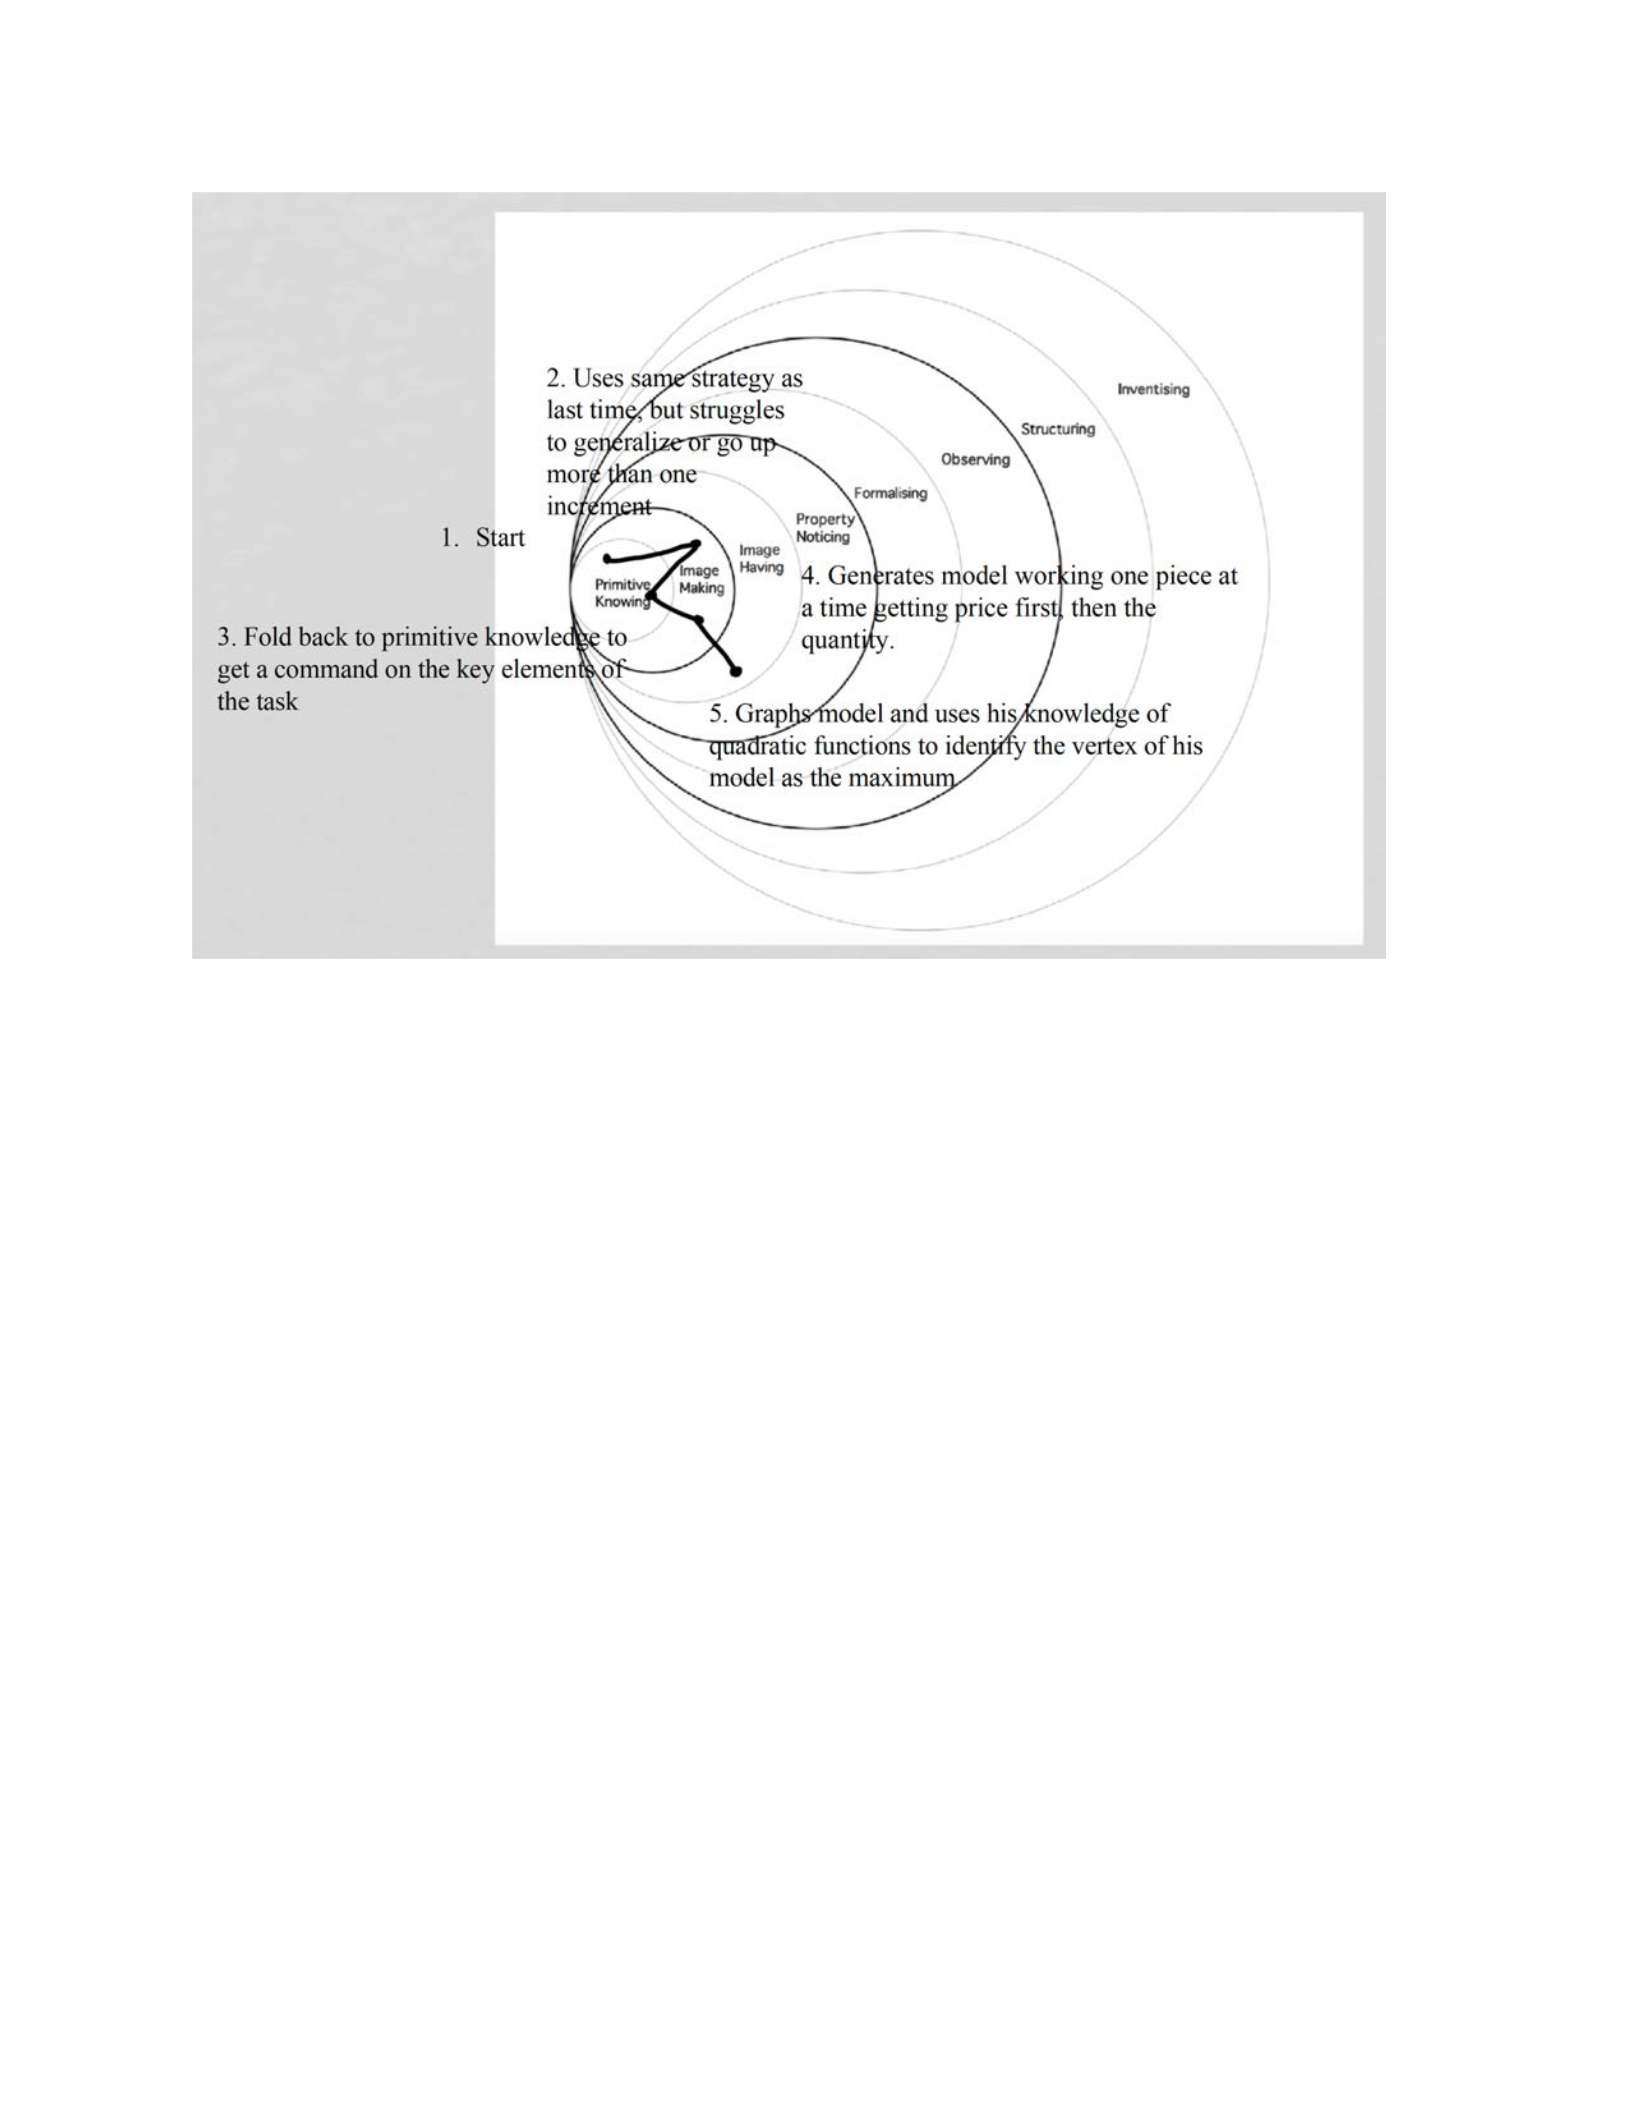
134
Figure 16. Pirie-Kieren model for Charlie Task 1 of Interview 2
Manuel:
After reading the task, Manuel was a bit nervous as he told the researcher that there was a
lot of knowledge to take in to complete this task. However, Manuel quickly highlighted the key
information he needed to proceed. Using his highlighted information, Manuel told the researcher,
“I need to generate an equation to find the revenue Mr. Yates makes. To do this, I need to
multiply the price of the JPads by the amount of JPads sold.” This showed Manuel’s
understanding of the stem of the problem and even though he did not mention it explicitly,
Manuel demonstrated familiarity with the first task of the first interview.
Manuel went to his paper and wrote down price • quantity = revenue. Underneath this
line, he wrote (350 + 5n)(1000 – 10n). When the researcher inquired what he wrote down,

135
Manuel responded, “This should be the revenue equation with n being each increment. So, for
every increment it would add 5 to the price and take away 10 from the number of JPads that are
sold.” His response showed the researcher that Manuel understood the task at hand and was
analytically able to generate a function to model this problem. He was also able to correctly
explain and interpret the variable in his model correct in the context of the task.
The researcher asked Manuel what he planned to do next. Manuel told the researcher,
“Well my calculus teacher taught us to use Desmos a lot so my first thought looking at this
equation is to plug it into Desmos.” As he went to Desmos, he expressed his concerned about
skipping steps. But Manuel proceeded to use Desmos to get a look at the graph of his model.
When he looked at the graph, he gave a look of disgust and confusion and was clearly not happy
with what he saw. This led the researcher to have the following conversation with Manuel:
Researcher: “What are you looking for on the graph? You don’t look happy.”
Manuel: “I’m going to take my (350 + 5n)(1000 – 10n) and ‘foil-ing’ them.”
Researcher: “Why are you going to expand them?”
Manuel: “I’m doing the algebra because I plugged the thing into the graph and it’s not
showing up. I don’t know where to go from here.”
Based on this, the researcher was aware that the issue is not the function. Rather, it was
the fact that he failed to zoom out or rescale the window large enough for the parabola to appear.
However, Manuel began to expand the binomials and he correctly got -50n2 + 1500n + 350000.
Manuel went back to Desmos, cleared out the two binomials and filled in his expanded form
instead. He changed the n in his function to x in Desmos as he believed this was something that
would make the graph appear. Looking at his result, again Manuel was not happy. The researcher
asked him why he is not satisfied with what happened. Manuel told the researcher, “I want to get
a graph so I can see where the top is. However, I’m only getting two vertical lines.” Looking at

136
Manuel’s graph, the researcher saw that Manuel’s issue was not due to the task. It was simply an
issue of changing the window.
To help Manuel out, the researcher asked him to consider the outputs that would occur
for his model. Manuel looked at his expanded equation and told the researcher, “Oh, well the y-
intercept of my equation is 350,000. That means that my y-values need to be a whole lot larger.”
Manuel struggled a bit to get an appropriate window to see the relevant part of the graph, but he
got there in the end. Once Manuel saw the final graph, he was satisfied and continued to progress
with the task.
Looking at the graph, Manuel quickly identified the vertex and then told the researcher,
“With the equation I got, I believe that the tip of the parabola is at 15 and the revenue they would
make is $361,250.” Not understanding what Manuela meant by 15, the researcher asked him to
elaborate of what 15 means. Manuel explained, “After 15 increments of the price being raised by
$5 each increment, they would reach the maximum revenue. Therefore, Mr. Yates should charge
$425, and he would sell 850 Jpads each week to maximize profit.”
Manuel was able to complete this task very quickly and he provided an answer that was
cohesive and logical while using the technology. With some extra time in this task, the
researcher wanted to see the extent of his knowledge. The researcher had the following
conversation with Manuel:
Researcher: “You should have had learned some calculus knowledge and skills by now
right?”
Manuel: “Yeah, we have learned about the derivative and all the derivative rules. I think
I’m pretty confident in derivatives.”
Researcher: “Oh that’s great. Looking at your response to the task, you have given me a
precalculus response. Do you think it is possible to complete this task taking a calculus
approach?”
Manuel: “Maybe. We learned the derivative finds the instantaneous rate of change and
when the derivative equals 0, that means that it’s not increasing or decreasing. That
means we would have a maximum I believe.”

137
Manuel has demonstrated that he has learned some basic calculus knowledge and has
some basic understanding of the concept of the derivative. Manuel went back to his scratch paper
to see if he could take a calculus approach to solve the problem. Since he expanded the
expression, Manuel explained that he could quickly take the derivative of the function. He took
the derivative and wrote his answer of -100n + 1500 on his paper under the expanded function.
Looking at his derivative, he explained to the instructor, “Because it’s a parabola, if I set the
derivative equal to 0 it should put me at the tip of the parabola because it’ll be zero when it’s flat
and that happens at the top of the parabola.” He set his first derivative equal to 0 and obtained the
correct value of n = 15. He told the researcher that this is consistent with what he obtained from
Desmos.
Manuel has demonstrated his procedural knowledge of calculus and the ability to
complete the task using a calculus approach. Wanting to see how far Manuel’s calculus
understanding went, I asked Manuel if this calculus approach would work with other types of
functions. After thinking about it he responded, “It would have to be a function where the top of
the graph. But some graphs may have more than one peak so you can have more than one
answer.”
This helped the researcher realize that Manuel’s calculus experience with derivatives has
been focused mostly on polynomial functions only. He never mentioned that some functions,
such as
𝑓
(
𝑥
)
=/
!
, would not produce a local extremum because setting the derivative equal to 0
would not yield a solution to indicate an extremum.
During this interview, Manuel spent most of his time in the image having and property
noticing layers of the Pirie-Kieren model (Figure 17). He recalled how to approach the task using
the prior knowledge he acquired in the first interview. Manuel was able to correctly generate a

138
model using the information in the stem and understood that he needed to find the vertex of his
quadratic model to maximize the revenue. At about the halfway point through the semester in
calculus, Manuel demonstrated his calculus ability and basic conceptual understanding of the
derivative. This allowed him to use a calculus approach as well to justify his original solution to
the task. Manuel also made a move into first outer layer, the formalising layer, of the Pirie-
Kieren model. Manuel connected that an extremum on a continuous graph, a precalculus
property, could be found using calculus by computing the first derivative of the function and
setting the first derivative equal to 0. He correctly justified that when the first derivative is equal
to 0, the instantaneous rate of change is 0 which could imply an extremum on the graph.
With the exception of his intuition about the second derivative, Manuel correctly used all
the correct prerequisite skills he used in the first interview. He was also able to apply algebra
skills when he set his first derivative equal to 0 to find his critical number. He also geometrically
described one possible, although correct for the purpose of the task, explanation of the behavior
of the graph at the point where the first derivative was equal to 0.
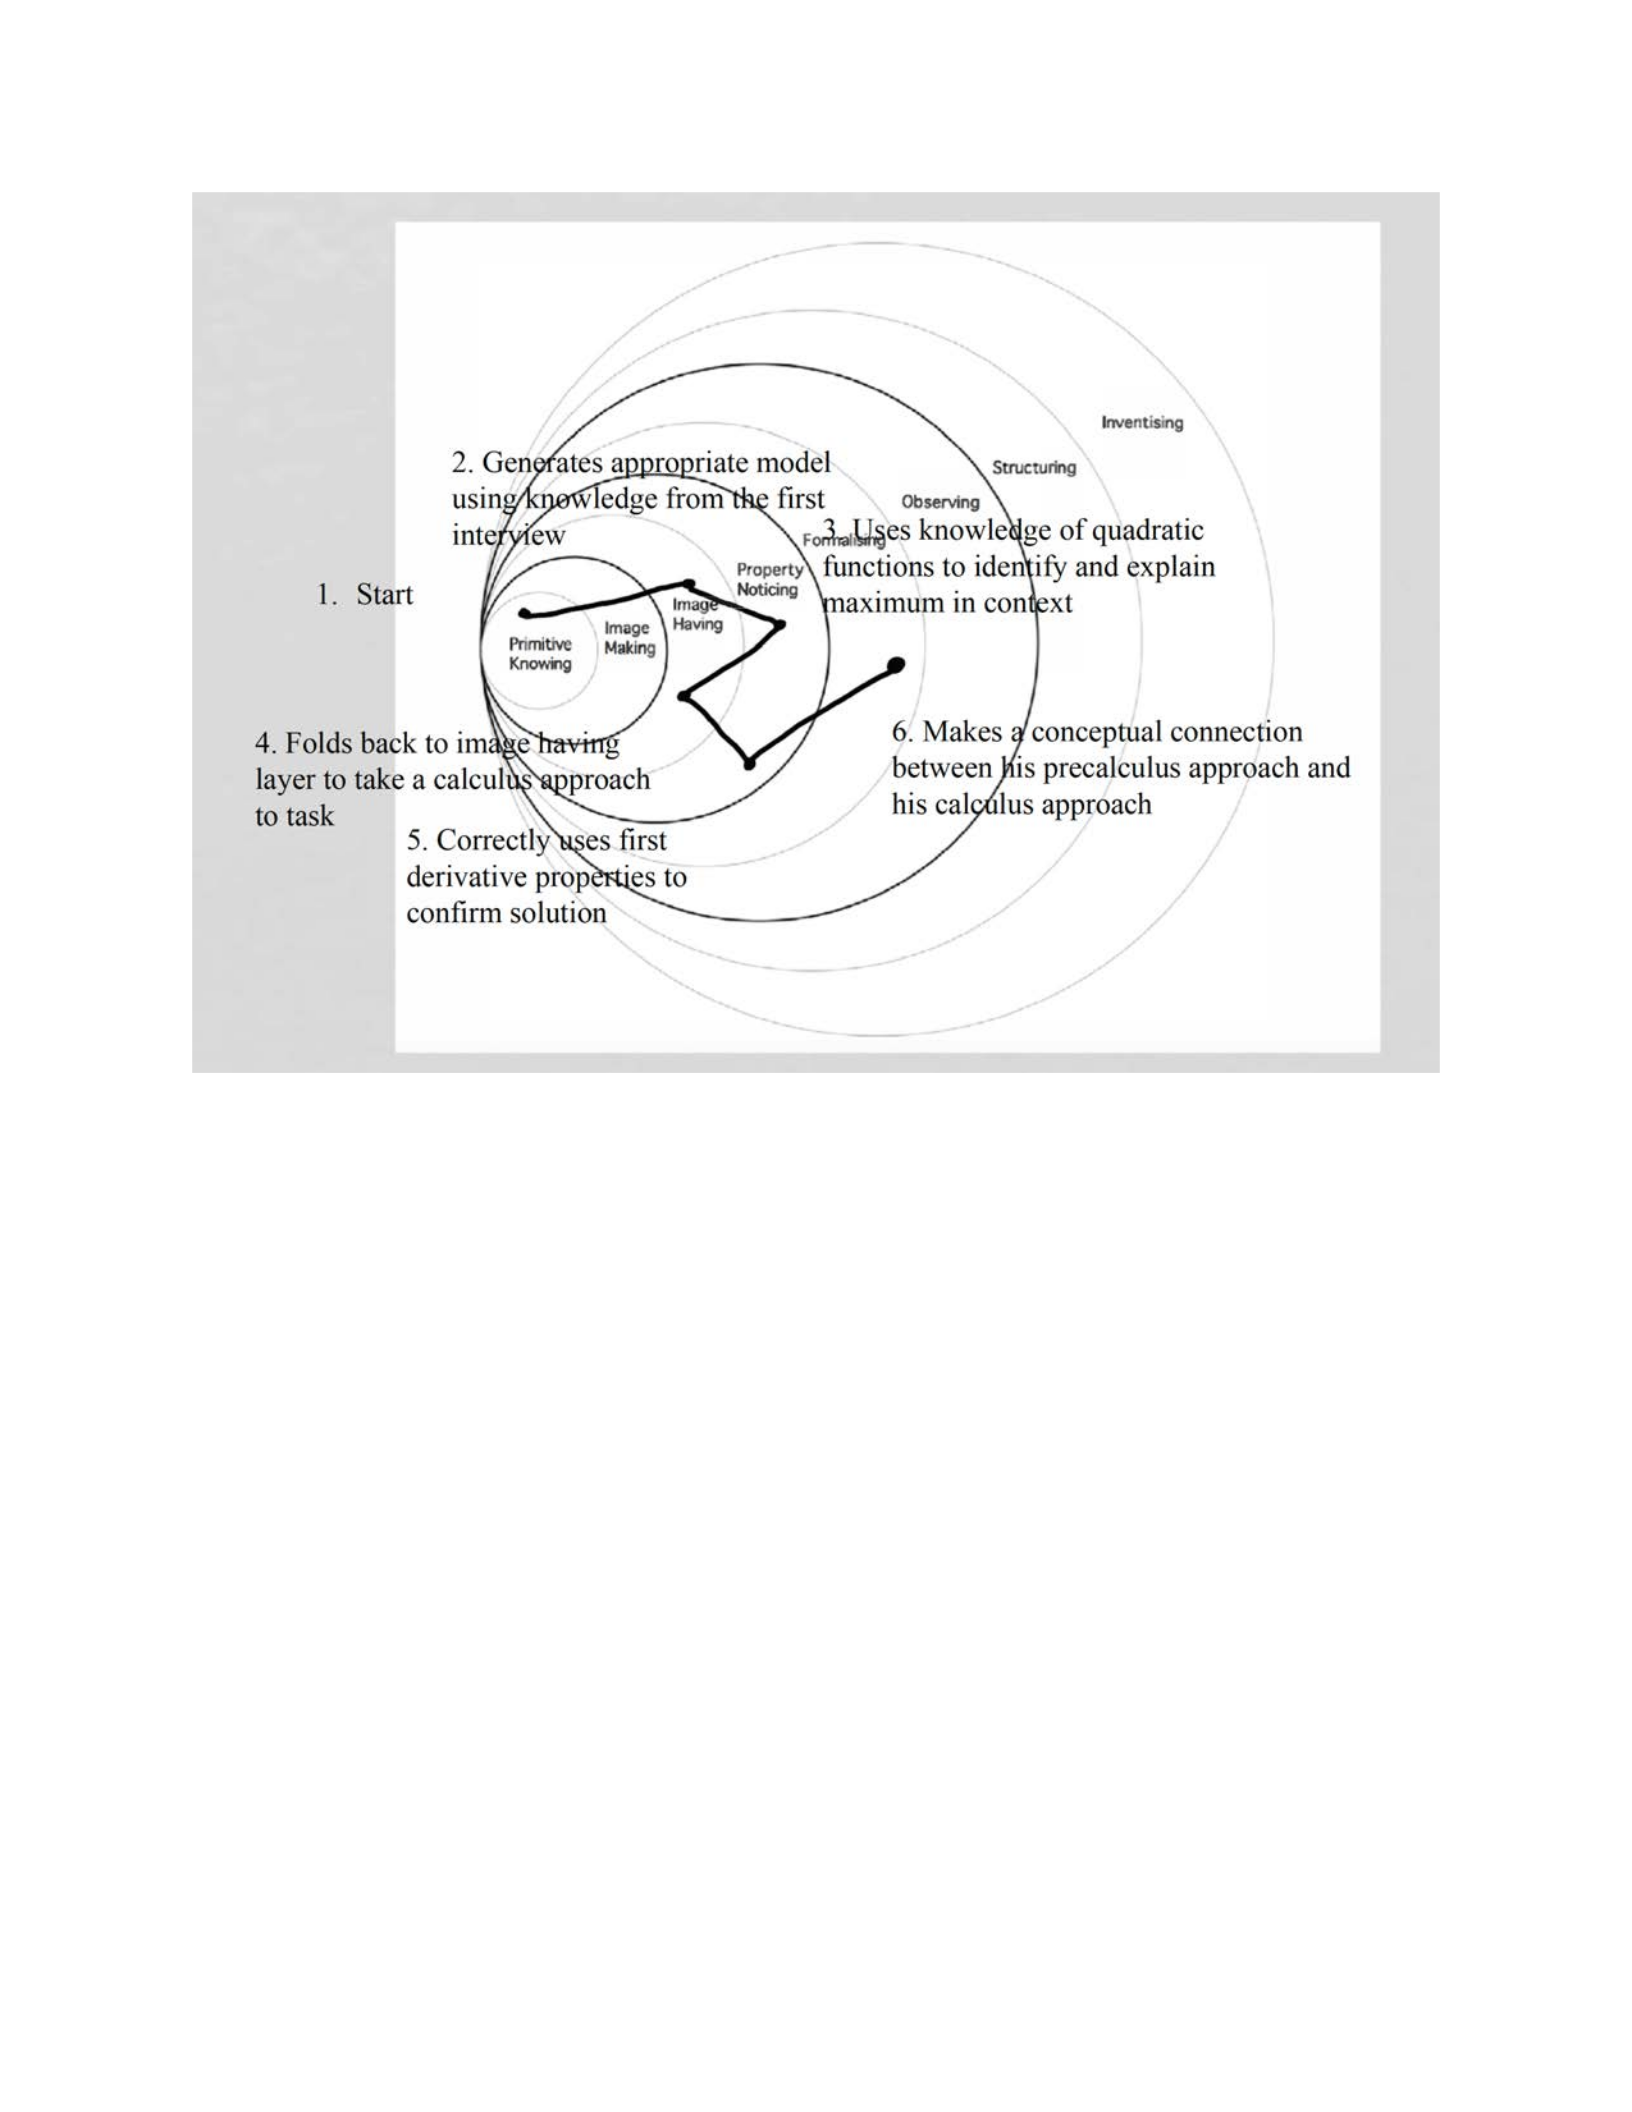
139
Figure 17. Pirie-Kieren model for Manuel Task 1 of Interview 2
Lamar:
Upon completion of reading the task, he told the researcher, “I’m going to try and write
an equation that best represents the situation and plug it into Desmos to find the solution.” While
Lamar has a definitive strategy to approach the task, he is the only one who does not mention
that this task is similar to the first task in the first interview.
On his paper, Lamar wrote down “amount of dollars” and “amount of sells” next to each
other in one line. Based on this line on his paper, the researcher was aware that Lamar
understood that the cost and the sales worked together which was a huge piece of conceptual

140
knowledge needed to complete this task. Lamar proceeded to make a table with three columns: x,
number of sells, and price per sell. Underneath, he wrote 0, 1000, and 350. He then told the
researcher, “Okay, so when x = 1, I subtract 10 sells and add $5 per sell. So, I’m going to put 1,
990, and 355.” He continued his pattern in his table up to x = 4 and then he stopped. When the
researched asked Lamar why he stopped, Lamar responded, “Because I think I have found an
equation. Since I’m subtracting 10 sells each time x goes up, my sells are 1000 – 10x which I’m
going to multiply by 350 + 5x, the price per sell.”
Lamar proceeded to correctly write (1000 – 10x)(350 + 5x) on his paper below the table
and told the researcher, “I’m going to ‘FOIL’ this.” On his paper, he expanded and combined
like terms to correctly obtain -50x2 + 1500x + 350000. He put his paper down and went to the
computer. After getting to Desmos, he plugged in the equation he obtained and initially saw “two
vertical lines.” He quickly concluded that he needed to zoom out so he could see his graph which
he correctly identified as a parabola.
While it took Lamar a while to zoom out, he quickly continued his analysis once he could
see the parabola in an appropriate window. While he looked at the parabola, he told the
researcher, “okay so my maximum of my parabola is here at x = 15. So, the maximum is x = 15
and the dollar amount he gets as his maximum is $361,250 which is the y-value of the
coordinate.”
The researcher asked Lamar what he meant by x = 15 and he responded, “Oh yeah, I
forget about that. So, I plug x = 15 into my equation and have the price as (350 + 5x). The price
will by $425. That’s the amount the guy should charge. That’s my final answer.” Of the five
participants, Lamar finished this task much quicker than he did the first time. With the extra time

141
remaining in the task, the researcher decided to probe Lamar on his prerequisite and/or calculus
skills and the following conversation occurred:
Researcher: “Is there a set of prices that would make sense in context of this task?”
Lamar: “Well it’s a parabola, so he can charge any price he wants?”
Researcher: “But, do all of them make sense?
Lamar: “No because if he were to charge too much for the JPad where he’d get 0 sales,
that wouldn’t make sense.”
Researcher: “Is there a price that Mr. Yates could charge that would result in him getting
0 sales.”
Lamar: “Yes there is (using calculator and computing) . . . So, x would be 100. That
would make the price $850. So, at $850 per JPad, he’ll make 0 sales.”
Researcher: “Based on your answer then, would it make sense for Mr. Yates to charge
$900?”
Lamar: “Uh let’s see. So, if the price is $900 (computing) . . ., then x would be 110. If
Mr. Yates charges $900, he would sell uh, that would be -100 JPads. Wait, that doesn’t
make sense to have negative sales. Oh! I see what you mean.”
Researcher: “What do you mean?”
Lamar: “It would only make sense for Mr. Yates to charge prices where he would
actually make sales.”
Based on this conversation, it was evident that Lamar understood that the domain of
quadratic functions is all real numbers. This led him to initially conclude that Mr. Yates could
charge any price. However, the rest of the conversation led him to comprehend that while in
theory Mr. Yates could charge any price, only certain prices would make sense in context. Lamar
started to work on his paper. He wrote down $850 max price, and then told the researcher that
$850 must be upper bound because anything above that would give negative sales. He looked at
the parabola and then explained to the researcher, “The x-intercept on this parabola must be
where the price is $850 because the revenue would be 0.” To confirm his hunch, he looked at the
x-value on the right x-intercept and saw x = 100. When he plugged that into his price, he got
$850.
Lamar observed the second x-intercept on the parabola and concluded that this would be
the lower bound of his price. He used Desmos to find the zero as x = -70 and told the researcher,

142
“Having x = -70 doesn’t’ make sense because you can’t charge negative dollars. Therefore, 0 is
the lowest he can charge.” While Lamar did make the correct conclusion about the lower bound
of the price, his interpretation was incorrect. If Lamar had substituted x = -70 into his quantity
for price, he would have obtained the correct price of $0. Before the researcher had an
opportunity to interject, Lamar told the researcher, “Therefore, Mr. Yates can go from $0 all the
way until x = 100 when he would charge $850. So, he can charge at most $850 for each JPad, but
he would break even due to zero sells.” It was clear to the researcher that while Lamar was able
to correctly complete the task, he still had some misunderstanding of the context of the task.
Lamar was able to address the zero, x = 100 and how the zero affected the price. However, he
failed to explain the zero correctly in context of the problem because he explained that Mr. Yates
would “break even” if he were to charge $850 per JPad. This was incorrect because at $850 per
JPad, Mr. Yates would have generated no sales.
However, the researcher let Lamar continue. Lamar told the researcher that it would only
make sense for Mr. Yates to make at least one sale. On his paper, he correctly figured out based
on his model that if Mr. Yates makes one sale, x = 99.9. He continued to substitute x = 99.9 into
his quantity for price to obtain a price of $849.50. Although the stem of the problem mentioned
that Mr. Yates will only increase prices in $5 increments, Lamar proceeded in explaining to the
researcher that, “This is just like limits where we get as close to 0 as possible for the price or the
sells, since it doesn’t make sense to charge 0 or have 0 sells because he would make no money.”
This last comment informed the researcher that maybe Lamar did understand the context of the
zero, x = 100, in context but just struggled to explain it to the researcher. Just before the
researcher was about to inquire about calculus skills, the timer went off that signaled it was time
for us to move to the second task.

143
During this task, Lamar demonstrated many relevant skills for this task which kept him in
mostly in the image having and the property noticing layers of the Pirie-Kieren model (Figure
18). Lamar was able to recognize the similarity between this task and the first task from the first
interview and was able to correctly interpret the information from the stem, figure out a pattern,
and generate a correct model without assistance from what happened during the first interview.
Lamar was also able to correctly expand his model, graph it, and understood that the vertex of
his graph would serve as the maximum revenue needed to complete the task. While Lamar did
not demonstrate any relevant calculus skills to complete this task, Lamar showed a plethora of
prerequisite skills. His demonstrated knowledge included a large amount of conceptual
knowledge about quadratic functions such as the ability to interpret the vertex, properties about
the zeros of quadratic functions, and the ability to discuss the meaning of each of these in context
of the problem with minor errors. He was also able, with minor errors, to use his knowledge
about the zeros of the quadratic function to provide an implied domain for this task. Lamar also
showed some knowledge of limit concepts in this task although knowledge of limits was not
really necessary to complete this task.
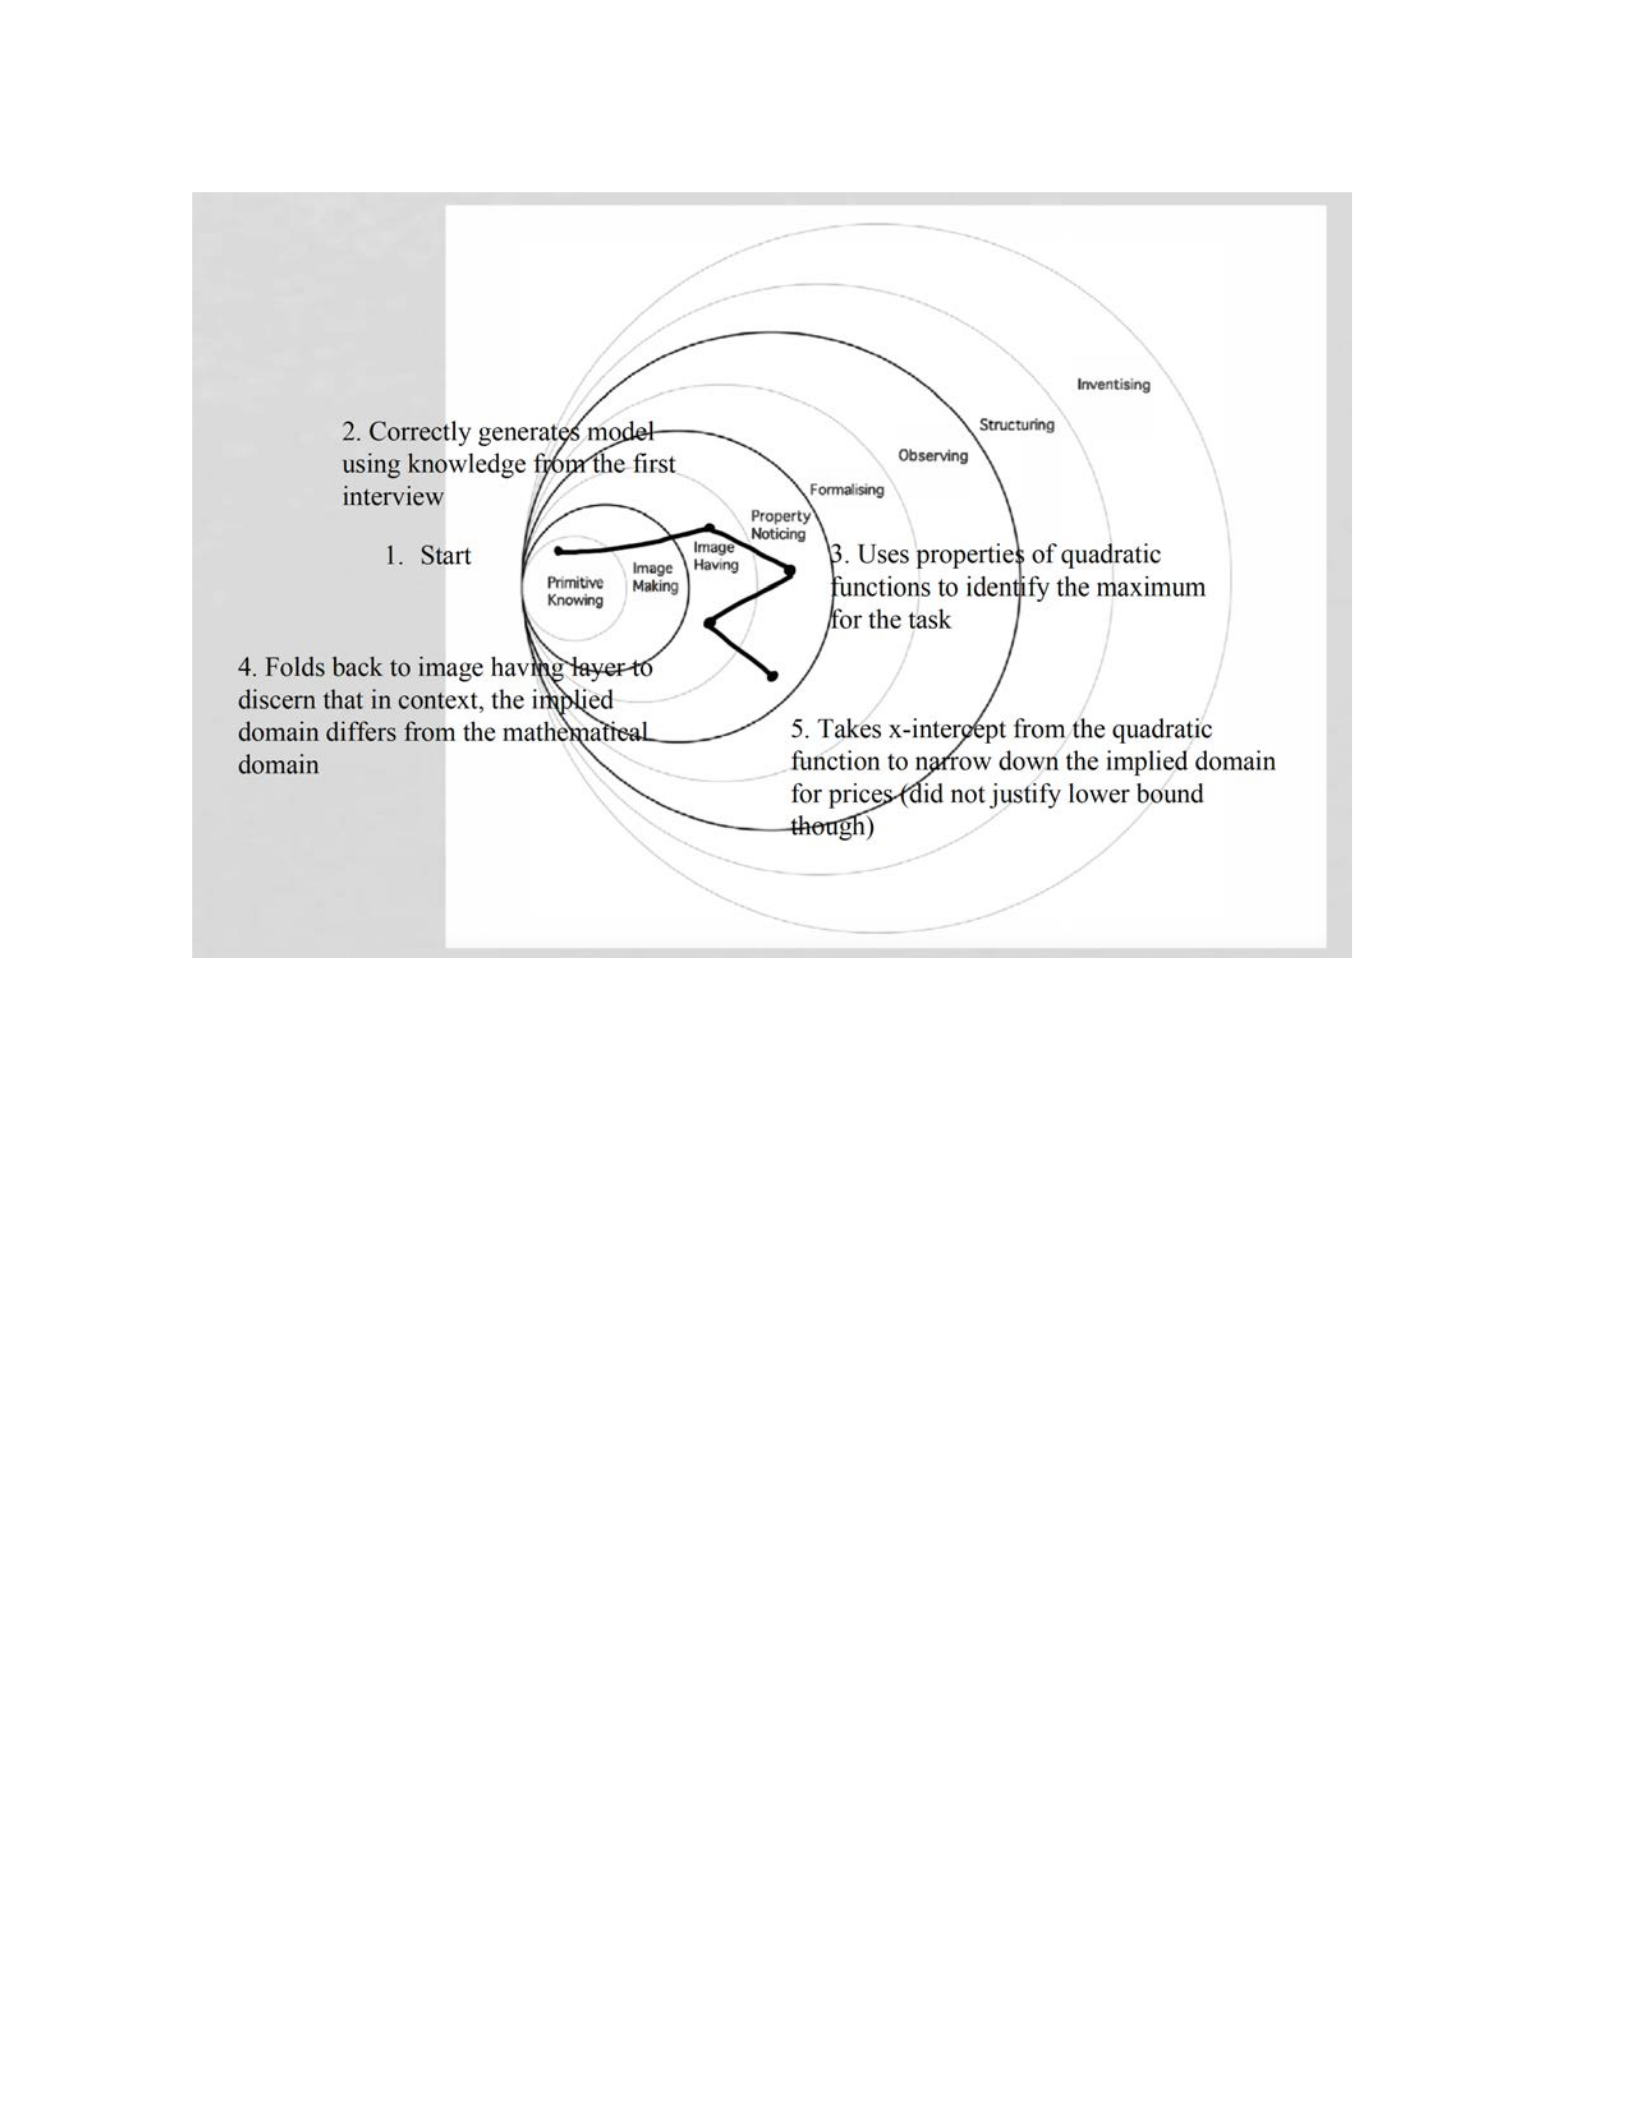
144
Figure 18. Pirie-Kieren model for Lamar Task 1 of Interview 2
In this task, each participant recognized that this task was similar to the first task of the
first interview. Every participant except Lamar acknowledged this verbally to the researcher.
Most participants demonstrated more prerequisite skills in this task. Ashley was the only one
who did not show progress in her prerequisite skills as she was the only one who did not
complete the task despite knowing she could have used her strategy from the first interview.
James utilized the ‘middling’ strategy used by a couple of participants in the first interview. This
was new for him and effective in helping him complete the task. Charlie was more successful in
piecing the fragmented pieces of information together which helped him to successfully find an
equation to model the equation and complete the task. Charlie’s inability to piece the fragmented
information together hindered him in the first interview. Lamar demonstrated a lot of conceptual
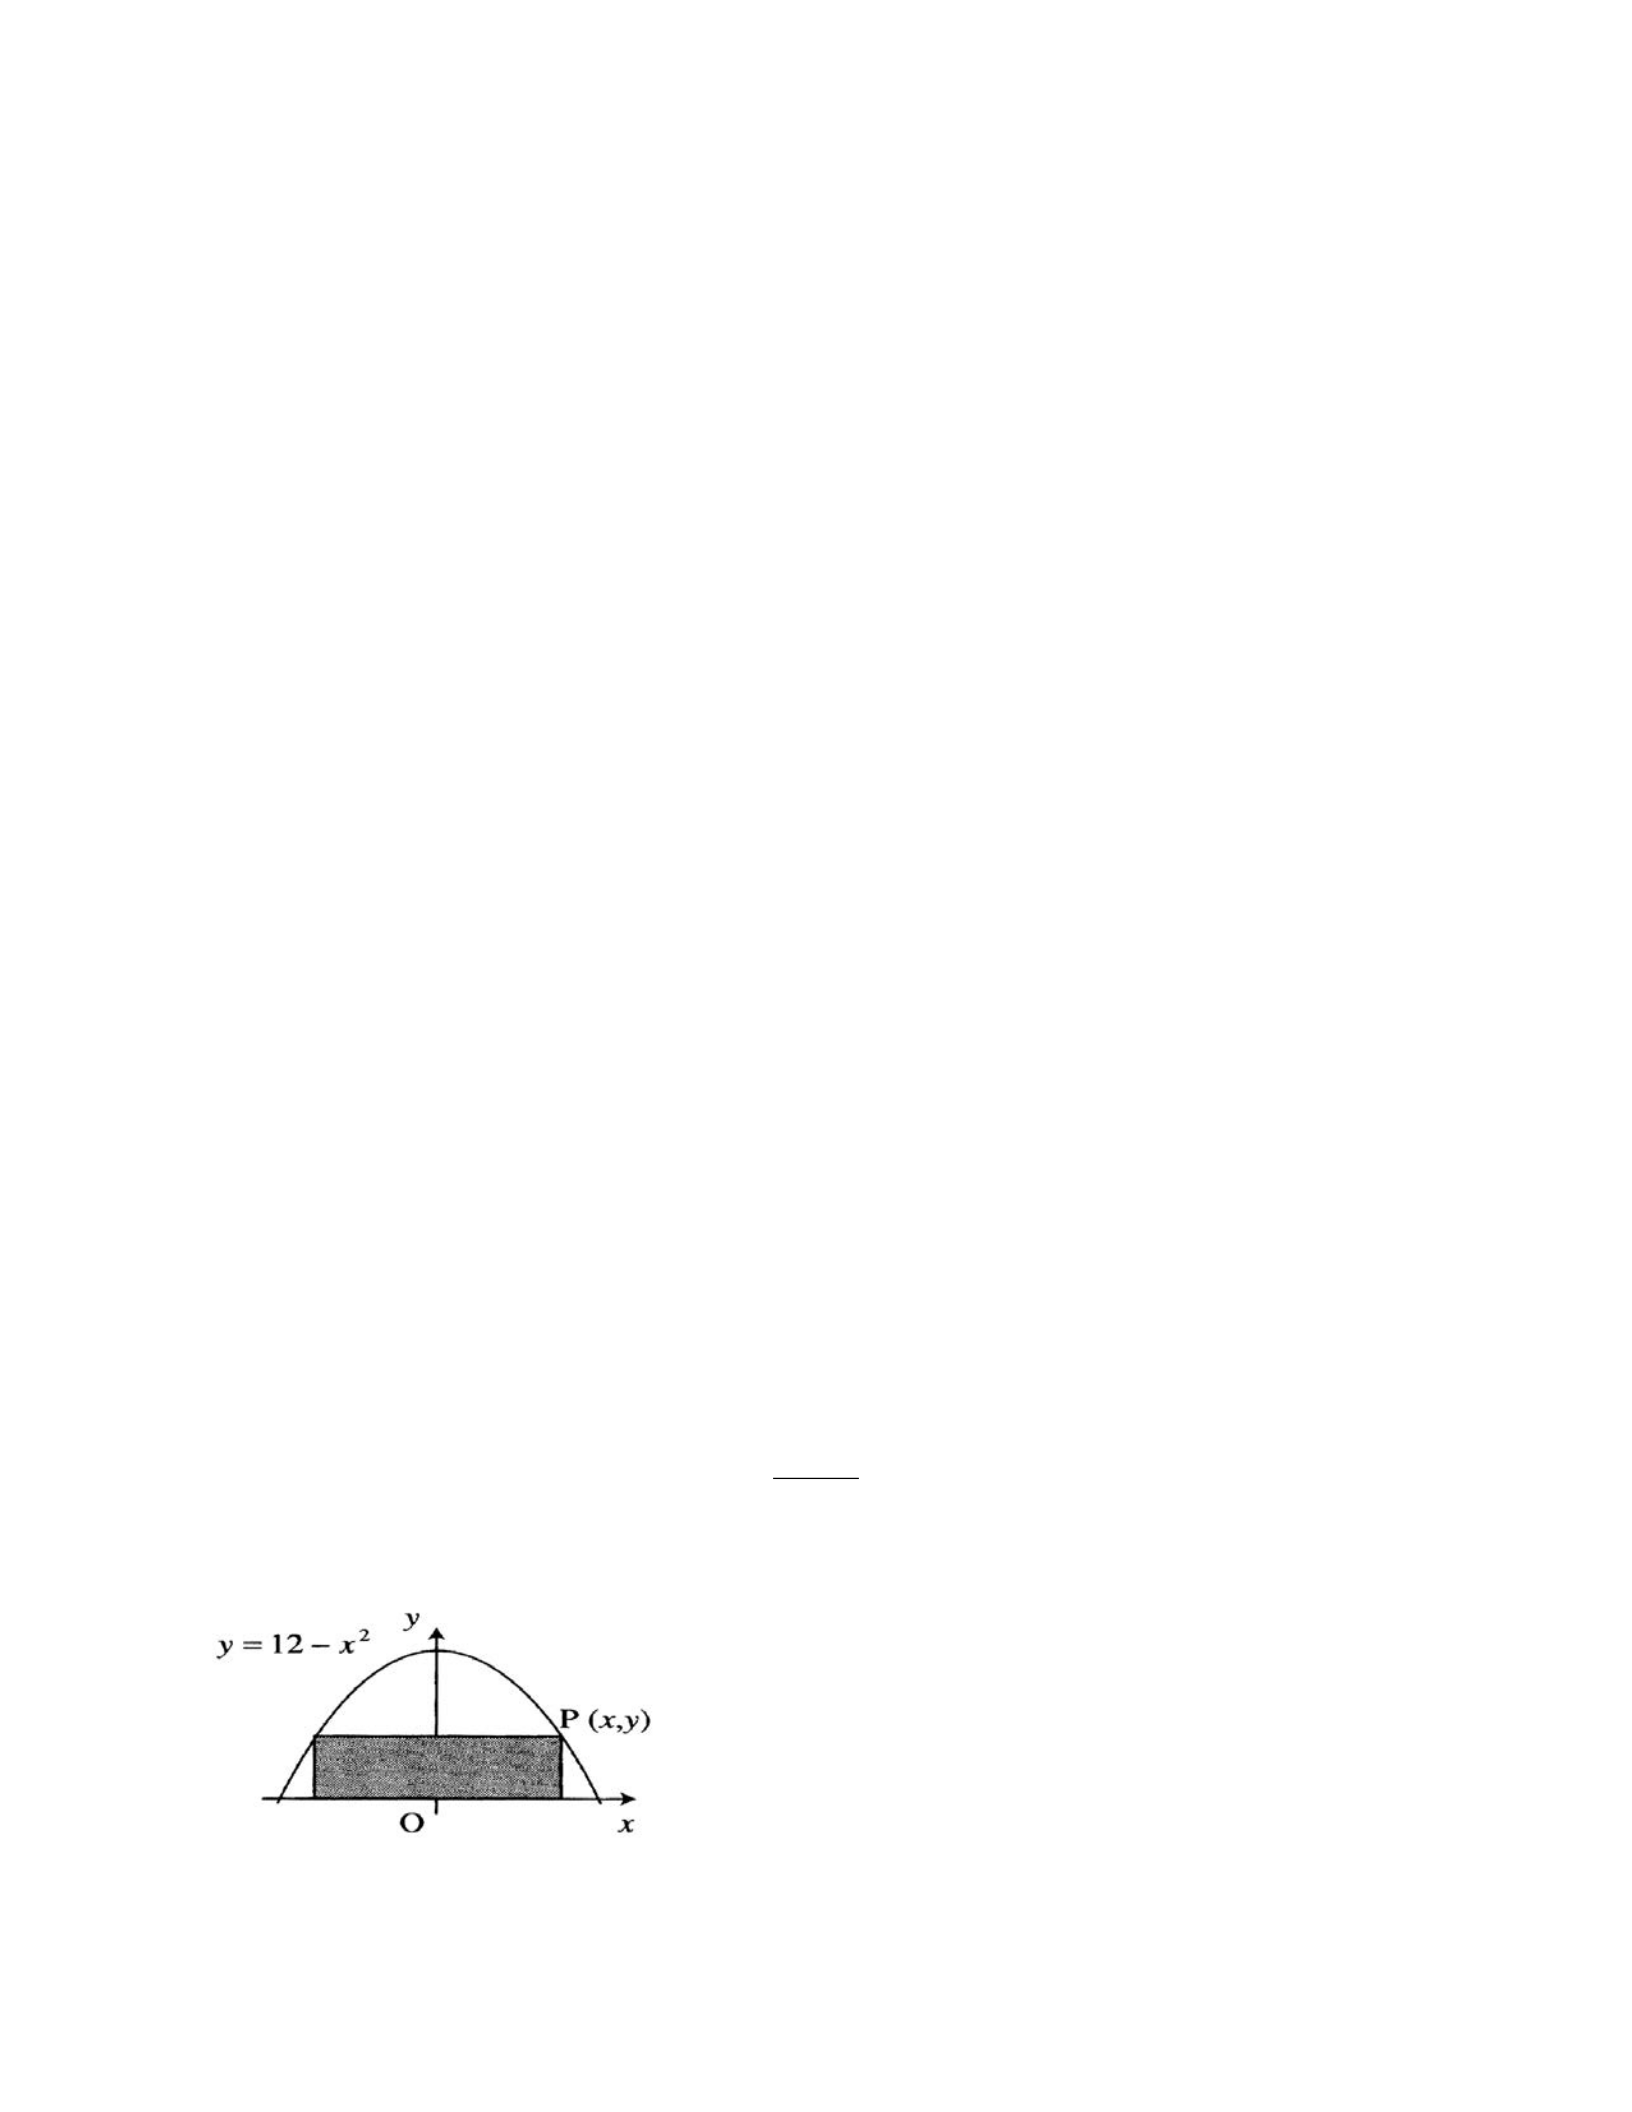
145
knowledge of prerequisite skills during his interview which expanded on the skills he
demonstrated in the first task of the first interview. He did attempt to show some calculus skills
in limits. However, this calculus skill was not necessary to complete the task. Manuel was the
only participant in this task who, in addition to showing an improvement in prerequisite skills,
was able to demonstrate his newly acquired calculus skills in the time frame of the task. He was
the only participant who attempted to and correctly computed the first derivative of his model
function, found the critical point by setting the first derivative equal to zero, and correctly
identified the critical point as a maximum to confirm his ‘precalculus’ solution to the task.
Interview 2 Task 2
The second task in this interview required the participants to maximize the area of a
rectangle that could be inscribed inside of a region bounded by the x-axis and a given parabola.
This was essentially the same task as the second task in the first interview. However, in this task,
the participants needed additional prerequisite skills. On top of the prerequisite skills needed in
the second task of the first interview, this task required students to successfully be able to
generate the area formula on their own. To help the students, a graph of the given curve with a
generic rectangle inscribed in the feasible region was provided. The second task of the second
interview is below.
Task 2
Given the point (x, y) on the curve y = 12 – x2 and a rectangle contained inside the curve as
shown in the figure, find the largest possible area of such a rectangle.
(White & Mitchelmore, 1996).

146
James:
Upon reading the stem of the task, James’ immediately reacted by telling the researcher,
“I have never done a problem like this before. Is this a trick question?” This reaction
immediately informed the researcher that James does not see the similarity between this task and
the second task from the first interview. The researcher reaffirmed to James that this was not a
trick question and to verbalize his thoughts to me.
It appeared that James was not convinced that he was not being tricked. But, seeing the
curve y = 12 – x2 in the stem, James went to Desmos on the computer and graphed the curve.
Looking at the graph on Desmos, James was not happy and told the researcher, “This task is a
trick because the curve in the picture has a short and wide rectangle, but a rectangle in my graph
would be tall and skinny.” The researcher replied, “The picture in the task in not necessarily
drawn to scale. I’m curious, does the shape of your rectangle affect how you will approach this
task?” After thinking about this question, he responded, “No. Either way, I want to find a
formula to try and solve this, but I don’t know how to solve this.”
There was about 30 seconds of silence before the researcher asked him the second
general interview question regarding his strategy to solve the task. James’ answered, “Well, I
could compute the area of the parabola and subtract out the area of the rectangle. If the area
between the parabola and the rectangle is the smallest, the area of the rectangle is largest.” This
caught the researcher off guard. While this idea is true, most students would not think of
minimizing the difference between the area under the parabola and the area of the rectangle as a
strategy to maximize the area of the rectangle. The researcher wanted to see how James would
proceed with this insight which led to the following dialogue:
Researcher: “That’s a very clever way to approach the task. What made you think of
this?”

147
James: “Well, since we want the rectangles area under this curve to be the largest, that’s
the same as making this ‘white space’ (points to the white space on the graph in the task)
the smallest.”
Researcher: “What would you need to be able to know in order to go forward with your
strategy?”
James: “I’d have to know the area of a rectangle and the area of a parabola. I know how
to find the area of a rectangle. That’s length times width. But I don’t know how to find
the area of a parabola.”
Researcher: “Have you ever computed the area of a parabola before?”
James: “No, but ‘Google’ can answer all my questions. Can I use the computer to try and
find the formula for the area of a rectangle?”
Researcher: “Sure, the technology is there to help you.”
While the researcher generally tried to sway participants to not use “Google” or other
search engines to find answers, the researcher knew that James was not going to find an explicit
formula easily. Therefore, the researcher allowed James to proceed. Because area between
curves is not usually covered until Calculus 2 or the very end of Calculus 1 and all the
participants are only halfway through Calculus 1, the researcher computed the area bounded by
given parabola and above the x-axis without James’ knowledge just in case he would need that
piece of information.
James spent the next few minutes trying to use the computer to find an explicit formula
for the area of a parabola. To his dismay, none of the websites he accessed on the computer had
an explicit formula for the area of a parabola. He told the researcher, “I cannot find a single
formula for the area of a parabola, but I know I need this area because this is how I’m thinking
about it.” Not wanting to sway James’ thought process, the researcher responded, “What if I told
you that the area under the given parabola and above the x-axis is
32
√
3
. Would this piece of
information help you to complete the task?” James was suspicious that the researcher “knew” the
area between the parabola and the x-axis, but he wrote the number down on his paper and
proceeded with his strategy.

148
Tinkering with the graph of the parabola on Desmos, he informed the researcher, “If the
rectangle is vertical, I can get a rectangle that has an area of 32.” Confused by where this came
from, the researcher asked James, “Can you explain to me how you got the area of a rectangle to
be 32?” James told the researcher, “Oh sorry, I skipped steps. I put in y = 8 and it gave me a
horizontal line and it intersects at x = 2. I knew that it would be two units right and 8 units up.”
Not convinced with James’ explanation, the researcher asked him to elaborate a bit more.
James explained, “I also have to go 2 units the other side. That makes the width of my rectangle
4. Therefore, the area of the rectangle is 4 times 8 which is 32.” The researcher is now convinced
about the area of James’ rectangle because he intuitively demonstrated that to get the correct area
of the rectangle, he needed to multiply the x-value by two to get the correct width.
James proceeded to delete the graph y = 8 from Desmos and inserted y = 6. He found the
intersection of this horizontal line and the parabola to be x = 2.449. Using his calculator, he told
the researcher, “The base of this rectangle will be almost 5, but the area is less than 32 because
the height is only 6. So, if the rectangle is going to be bigger, y needs to be bigger.” The
researcher is aware that James does know how to compute the area of any rectangle and he
correctly deduced that decreasing the value of y from 8 decreased the area of his rectangle. What
James does not currently know is that his guess of using y = 8 actually gave him the rectangle
with largest area.
James decided to try values of y that were larger than 8 and graphed the horizontal lines
on Desmos. He started with y = 10 and stated that the area is less than 32 without informing the
researcher of the value he obtained. James then graphed y = 9, and while using his calculator told
the researcher, “On the graph, x = 1.732, which times 2 is 3.464, which times 9 is 31.176. So
yeah, that gave me less than y = 8.” Just to make sure, James decided to try a value between y =

149
8 and y = 9. He deleted the horizontal line y = 9 and graphed y = 8.5. Using his calculator, he
correctly computed the area to two decimal places to be 31.79. He declared to the researcher,
“The area is 31.79, also less than 32. So, I’m happy with y = 8 and it would be stacked vertically,
so the maximum area is 32. I guess I didn’t need the area of the parabola after all.”
During this task, James spent most of his time in the image making and image having
layers of the Pirie-Kieren model (Figure 19). While James did not explicitly come up with a
model for the area of the rectangle, he utilized Desmos to geometrically compute the area of the
rectangle and deduce the maximum area based on whether the area was increasing or decreasing.
James implicitly demonstrated his prerequisite skill knowledge on increasing and decreasing
functions and also the fact that he needed to multiply the x-value by 2 in order to compute the
area of the rectangle. James utilized a similar strategy to what he did in the first task of this
interview with his ‘middling’ guesses. However, he did not have to do much middling guesses
because his first guess gave him the maximum area of the rectangle.
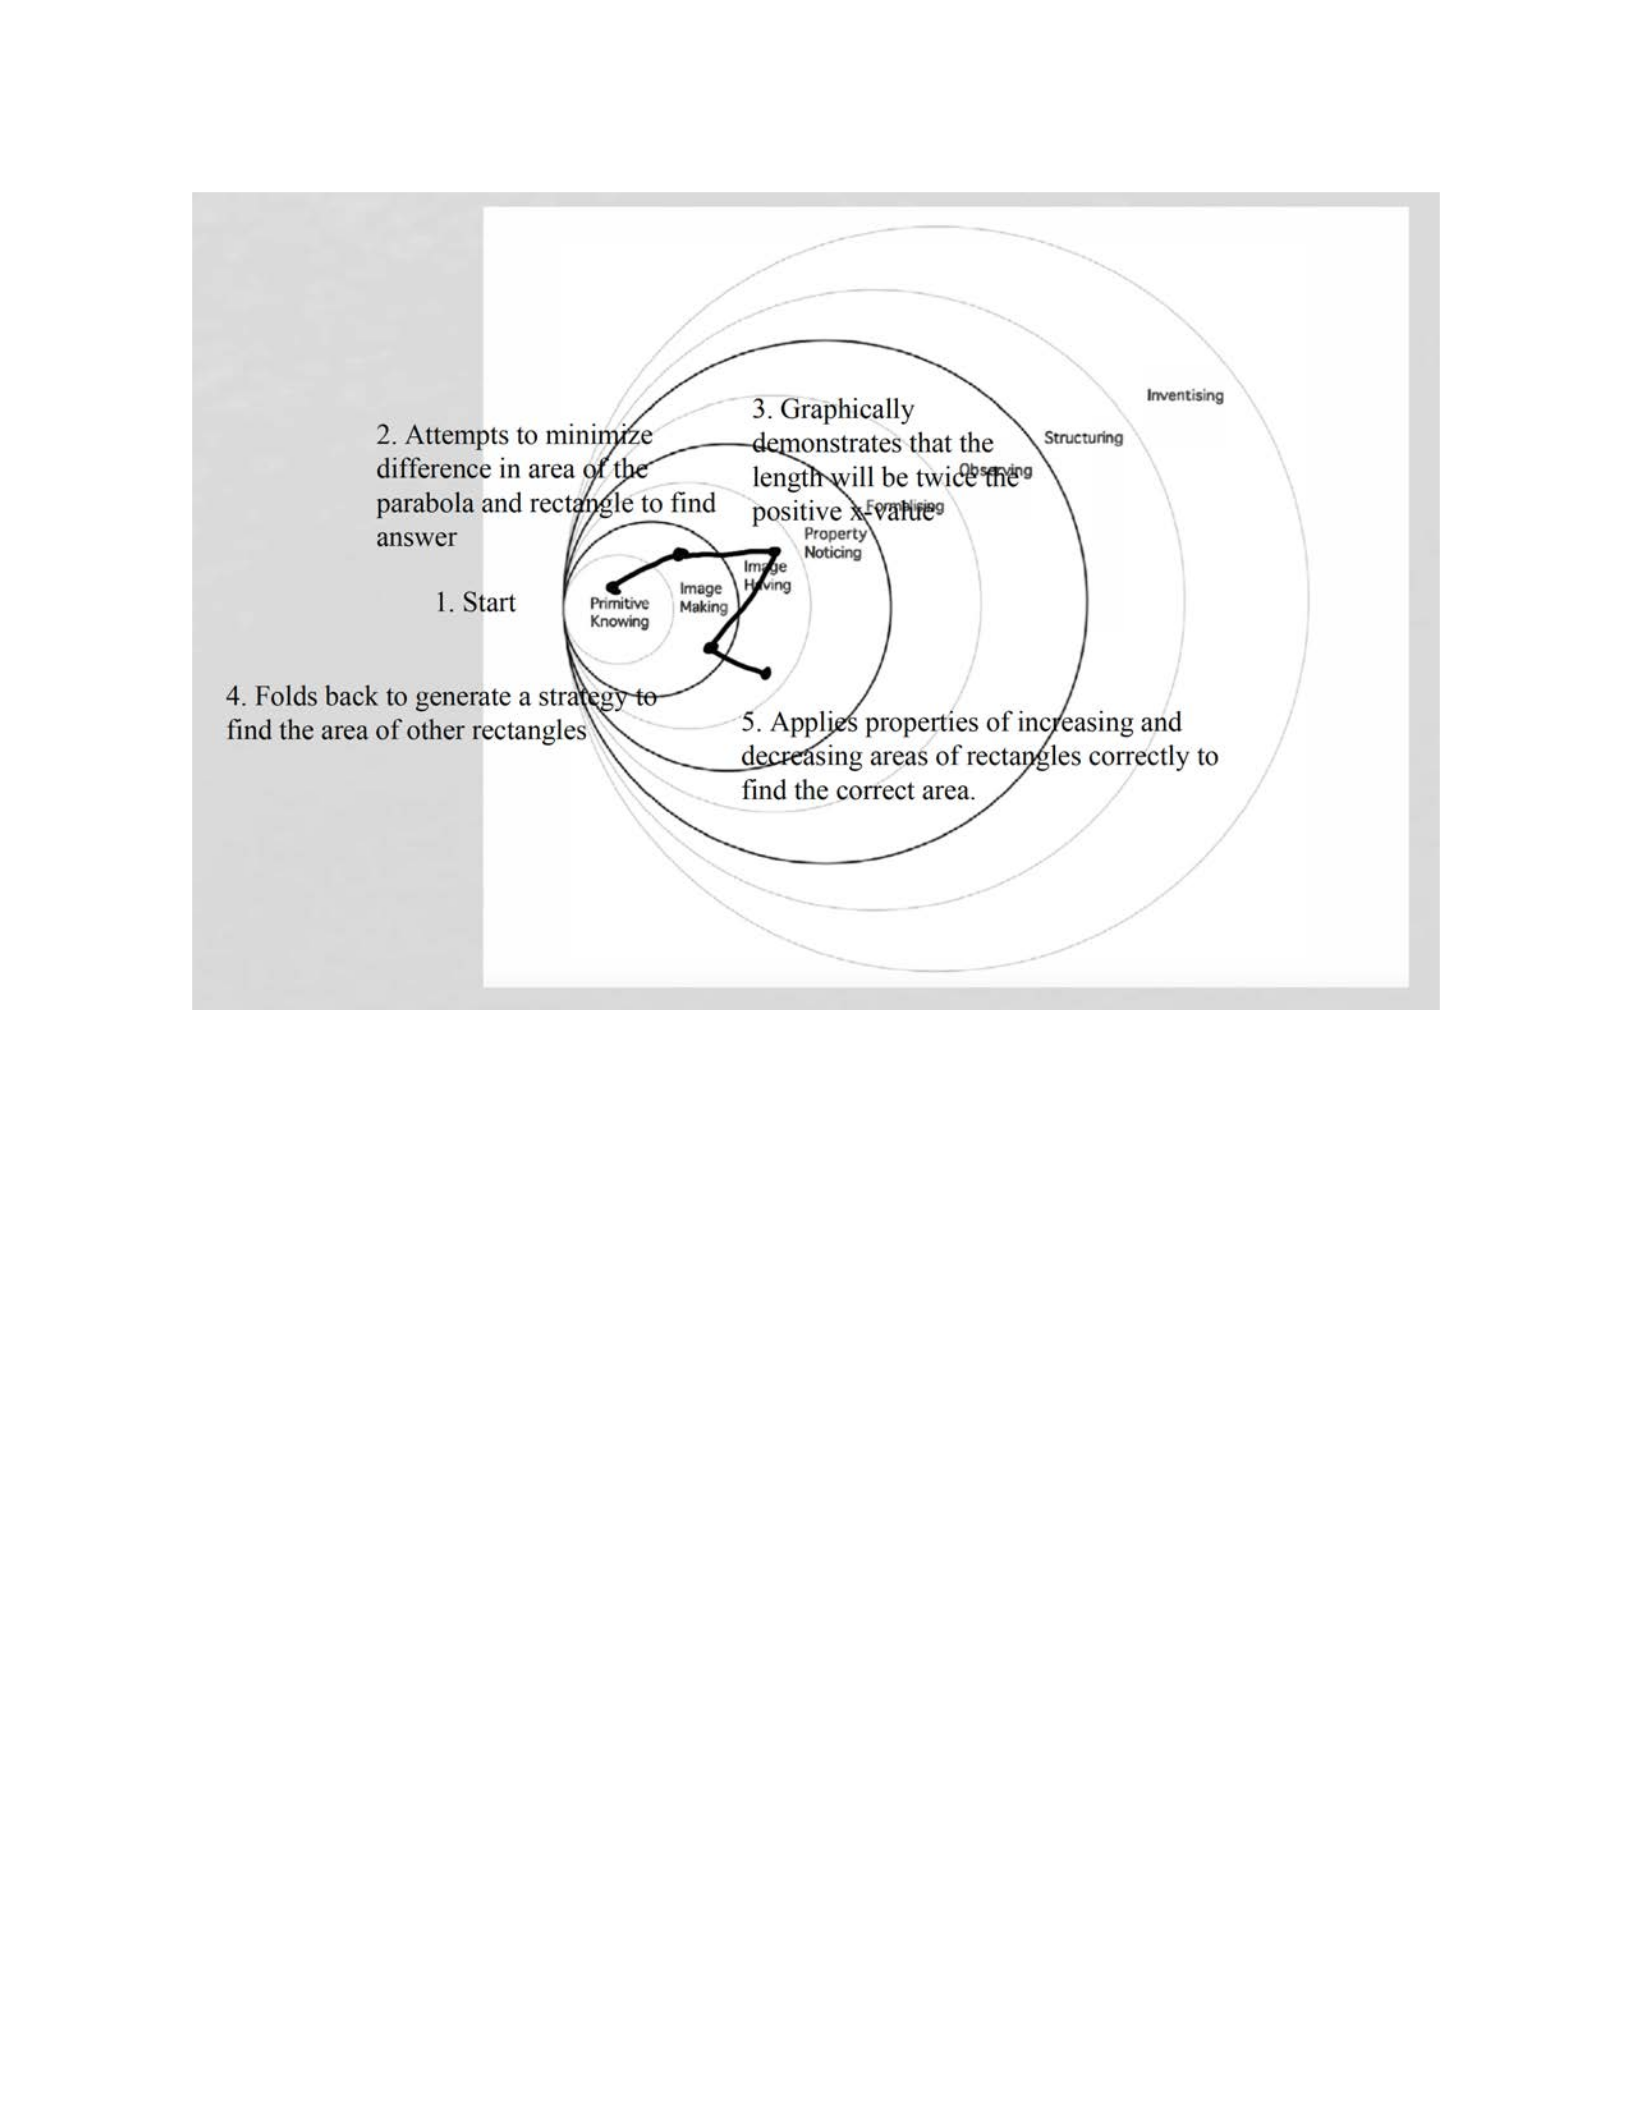
150
Figure 19. Pirie-Kieren model for James Task 2 of Interview 2
Ashley:
After reading the task, Ashley yelled, “What the heck! What does the curve represent and
what am I trying to do?” The researcher spent a bit of time trying to calm Ashley down and
gently asked her to proceed on the task. He informed Ashley that there is no wrong approach and
to just tell him what she knew.
Once she calmed down, Ashley decided to plot y = 12 – x2 into Desmos. Once she
graphed the curve and looked at it, she told the researcher, “I’m going to assume that the other
spot on the rectangle is (-x, -y). Oh wait, I mean (-x, y). That’s the other point where the
rectangle will hit the parabola.” After saying this, she drew a rectangle on her paper labeling the

151
points of the upper portion of her rectangle as (x, y) and (-x, y). Without realizing it, Ashley
correctly used her intuition to call the second point of the upper base of her rectangle as (-x, y).
This piece of conceptual knowledge was critical because she had the choice to find the length of
the rectangle by computing x – (-x).
Upon further inspection of her graph and the rectangle she drew on her paper, the
explained to the researcher, “I’m doing the absolute value for the negative x here because
distance cannot be negative. So, the distance between the two points or the length of the
rectangle is 2x because the absolute value of -x is x.” Surprised by Ashley given how she
initially reacted to the task, the researcher asked her, “What can you tell me about the height of
the rectangle?” She pointed to the ordered pair (x, y) on here paper where her rectangle was and
answered, “I’m going to say the height is y. So, the area of the rectangle is 2x by y which gives
me the area.” Thinking that Ashley had a command of the task as she had figured out the
equation for the area of the rectangle, the researcher was about to ask Ashley a question when
she said, “Now if I could just get another formula that just includes the two variables to find the
area of the rectangle.” Hearing this statement, the researcher decided to allow Ashley to continue
verbalizing her thoughts and working through the task.
Unsure of where to proceed, Ashley told the researcher, “I’m going to use 12 – x2 and
I’m going to plug it into the quadratic equation to see where the roots are.” Given that Ashley
had the graph on Desmos, the researcher thought she would find the zeros. Instead, Ashley
solved the equation by hand by setting 12 – x2 = 0. Ashley correctly isolated x and gave the
solutions as plus or minus square root of 12. She is confused about her answer and when the
researcher asked her why she looked puzzled, she responded, “These numbers are not nice. I
know I’m trying to find a value of x and a value of y so I can find the area. But I did not expect a

152
square root.” This statement clued the researcher in that Ashley understood what she needed to
do, but she did not know how to write her current area formula in terms of one variable only.
Keeping this fact in mind, the researcher engaged in the following conversation with
Ashley:
Researcher: “If you need to find a value of x and a value of y, what could you tell me if
you know the length of the rectangle is 6?”
Ashley: “Oh so it’s sort of like plugging in numbers. So, if the length is 6 then x would
be 3. Then, 12 minus 3 squared is 12 minus 9 which is 3. So, y would be 3.”
Researcher: “Okay, so what would the area of this rectangle be?”
Ashley: “Let’s see, the length is 6 and y, which is the height is 3. So, the area would be
18. So, I’m going to try another value. I’ll try x = 2.”
Based on this, the researcher is convinced that Ashley understood what to do and he
allowed her to proceed. She correctly substitutes x = 2 into the parabola equation and solved get
y = 8. She then computed the length of the rectangle to be 4, and then got the correct area of 32.
She decided to try x = 1. She repeated a similar process and correctly obtained a y-value of 11,
the length of the rectangle to be 2, and the area of the rectangle to be 22. Using these three
points, Ashley opened a blank whiteboard app and plotted three ordered pairs: (1, 22), (2, 32),
and (3, 18). While not drawn to scale, she did label the points. Ashley did this on her last
interview as well for the second task. Based on these observations the told the researcher, “I
think that the maximum area will be 32 because the curve will rise up and then go down.” She air
drew a parabolic shape that went through the three points on her graph.
The researcher was not convinced that Ashley knew she had the maximum area. So, he
probed her understanding by asking, “How do you know that this is the maximum area? What if
the maximum area had a base or height that was a decimal value?” She quickly responded, “That
would be mean if the correct answer wasn’t an integer.” After thinking about the question for a
bit, she wrote down the equation of the given curve on her paper. She proceeded to explain to the

153
researcher, “I have been plugging the value of x and solved for y. So, maybe I can plug in my
equation into my original area formula of 2xy.”
Ashley proceed to substitute 12 – x2 in for y in her area formula and told the researcher,
“Now my area formula is A = 2x(12 – x2). I’m going to expand.” She correctly distributed 2x
into the area formula to obtain an area formula of A = 24x – 2x3 on her paper which she quickly
switched to A = -2x3 + 24x. The researcher asked Ashley, “Could you use this formula to find
the maximum area.” She responded, “Yeah, I just have to graph it.” She returned to Desmos,
deleted the graph of the given curve, and graphed the area function. After adjusting the window,
she said, “This shows me that the highest point is, and I was right that when x equals 2 that it
would be the largest area. The largest area is 32. The y is the area, and the x is x.” She took a
screenshot of her graph and put her paper down to signal she had completed the task.
Despite having a mini meltdown at the beginning of the task, Ashley came around and
did a great job completing the task. She spent most of her time in the image making and image
having layers of the Pirie-Kieren model (Figure 20). While she utilized a similar strategy to what
she did in the second task of the first interview, Ashley demonstrated more prerequisite skills and
concept this time around. Ashley correctly deduced the area of the rectangle as 2xy be treating
negative x in absolute value because she referred to the magnitude as a distance. With gentle
probing form the researcher, Ashley expanded on her limited discrete points to justify the
maximum area. She did this by correctly substituting the given curve in for y as the height and
used her model to graphically justify why her answer for the maximum area was correct.
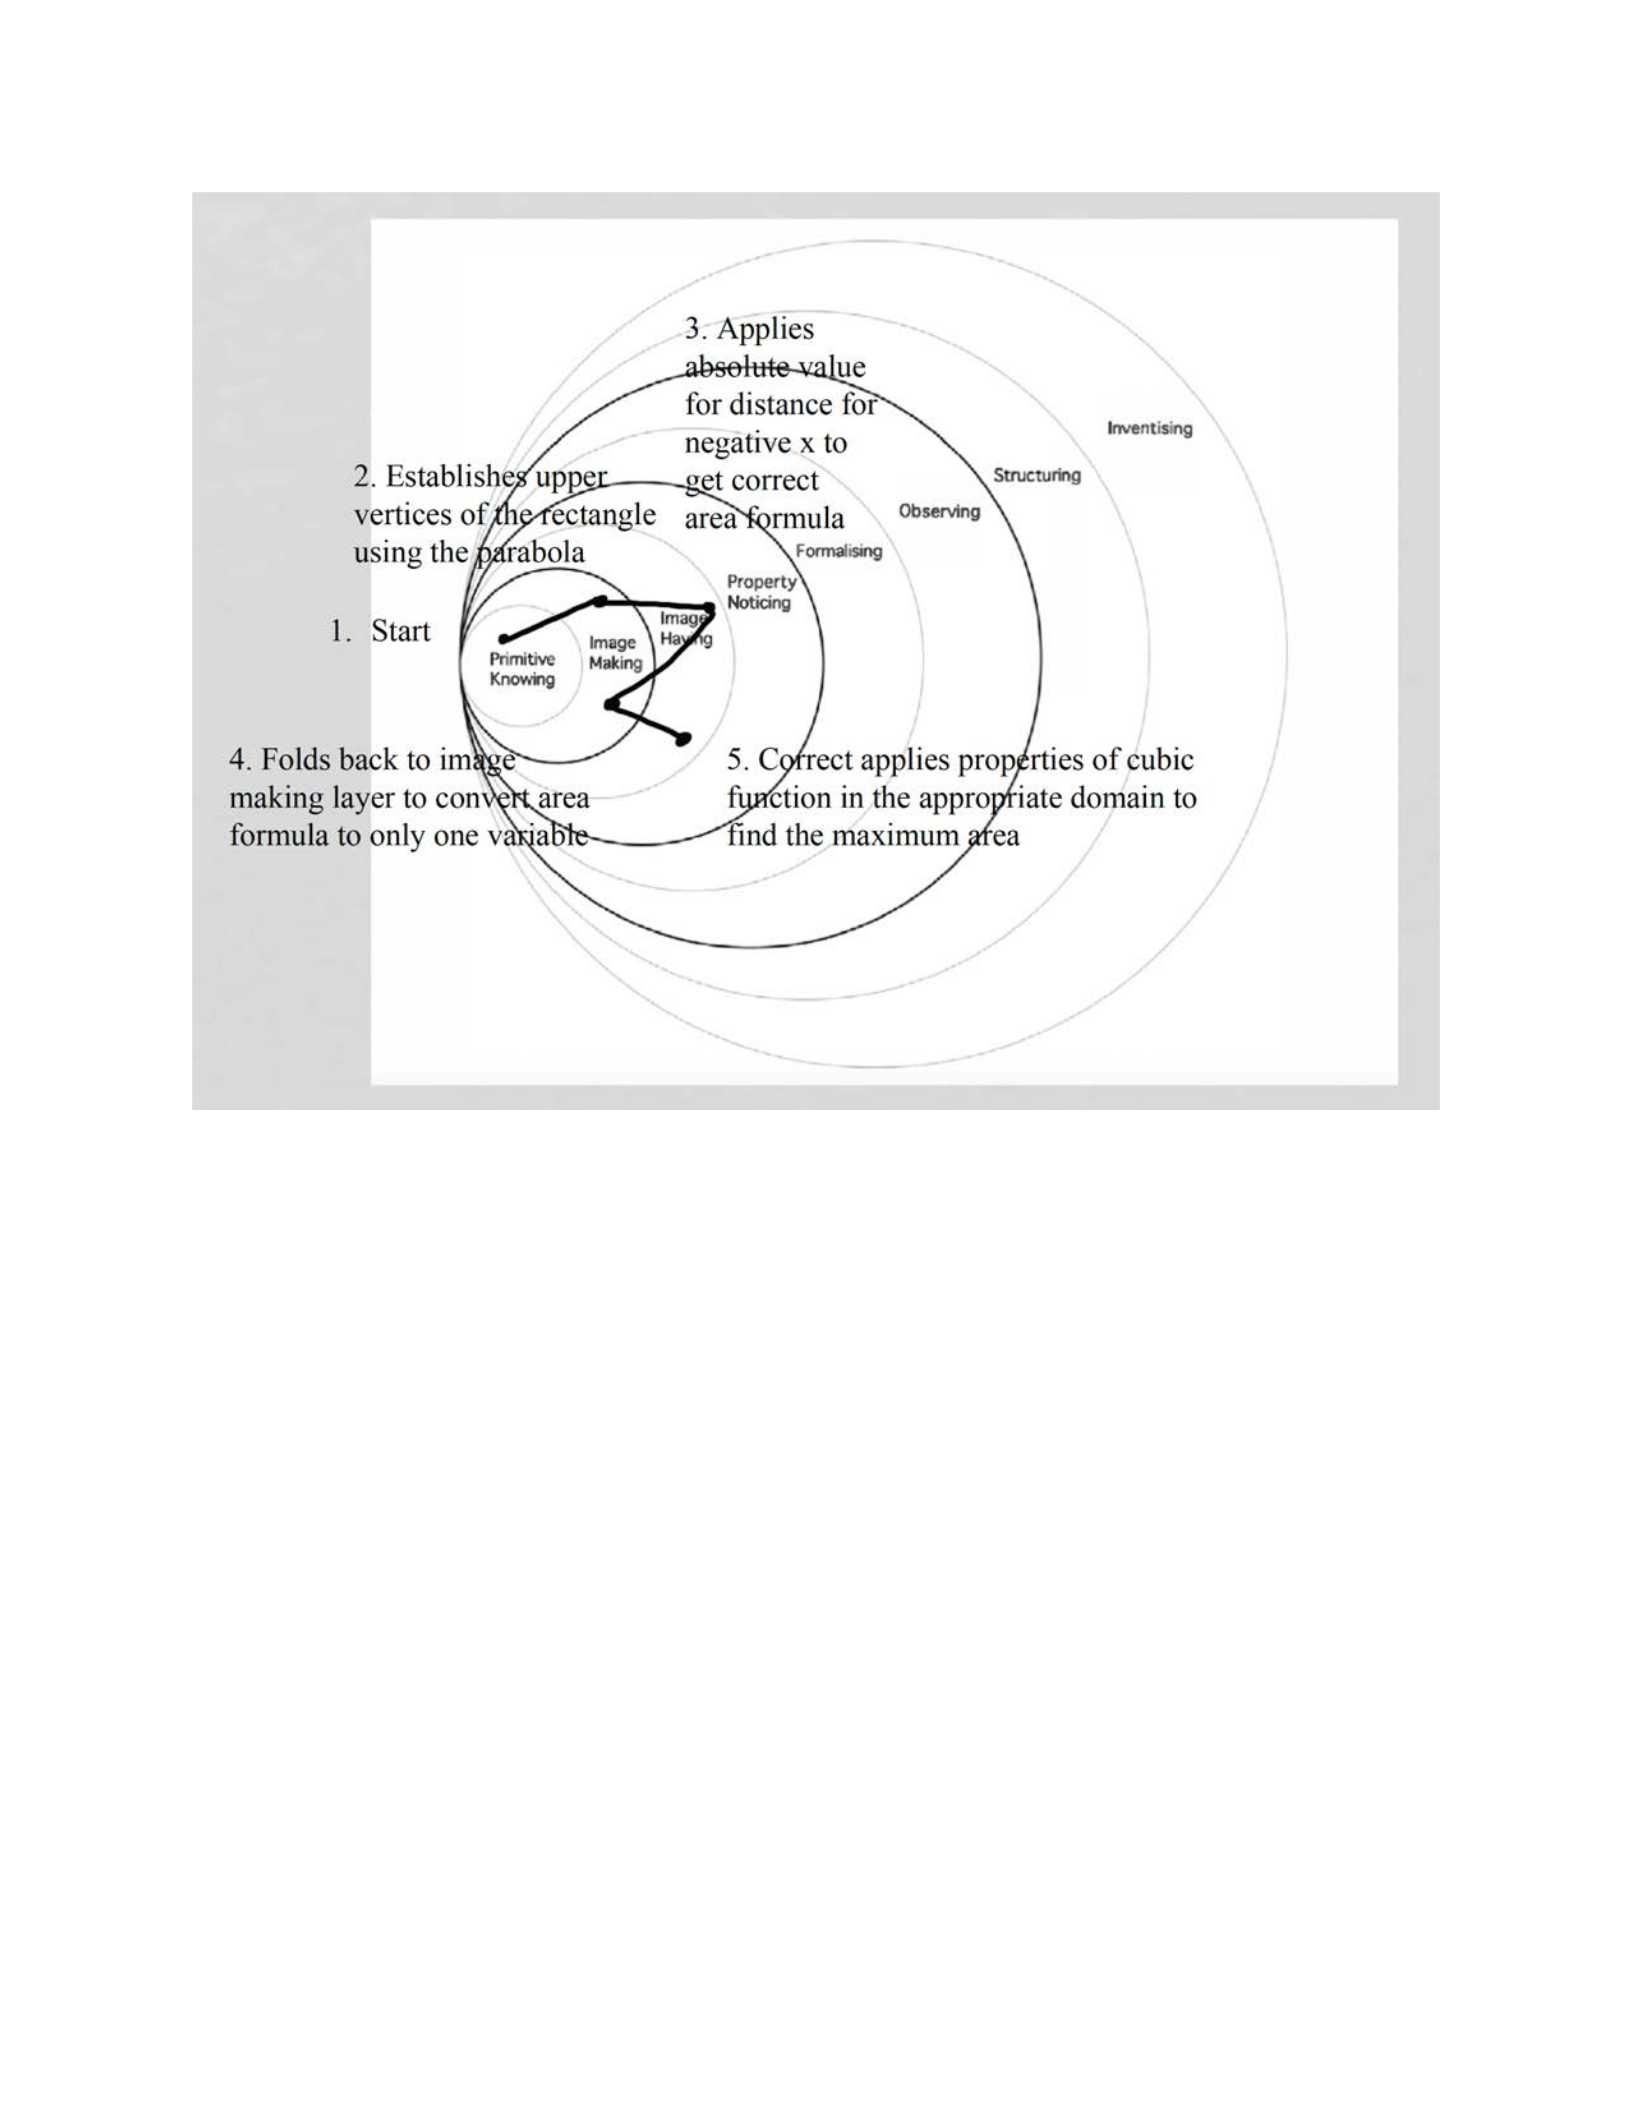
154
Figure 20. Pirie-Kieren model for Ashley Task 2 of Interview 2
Charlie:
After reading the stem of the task, Charlie came up with an immediate suggestion. He
explained to the researcher, “The easiest way to do this is to graph it and count the points and
find an area from that.” Not certain what Charlie meant by this, the researcher let him continue.
Charlie went to Desmos on the computer and graphed the given curve. After adjusting the
window to see the curve reasonably, Charlie scratched his head and said he did not know how to
proceed.

155
In an effort to guide him along, the researcher asked Charlie question 1 of the task
oriented questions regarding the height of the rectangle if the length was 6. The question
confused Charlie as he answered, “I don’t know what you mean. If the length of the rectangle
was 6, would it even be on the graph? I mean if I plug in x = 6 into the equation, I get a
negative.” He pointed to the y-value on the Desmos graph where x = 6. Charlie’s statement
informed the researcher that he is interpreting the length of the rectangle as starting from the
origin instead of being equidistant on both sides of the origin. This was a misrepresentation
despite having an image to help him with the task.
In an effort to get Charlie back on track, the researcher urged Charlie to look at the
picture given for the task to assist him. Upon studying the picture and thinking of the question
the researcher posed to him, he told the researcher, “Oh, the length goes left and right. That
means if the length is 6, it goes 3 in each direction. So, that means x would be 3 and not 6.” The
researcher was almost convinced that he understood what the task would require him to do, but
then Charlie looked at his Desmos graph and elaborated, “Okay, so the x-value would be 6 and
the y-value is -24. So, the rectangle will be in the fourth quadrant.”
As Charlie stared at the graph unsure of how to proceed with y being -24, the researcher
asked him, “Does it make sense if the rectangle is in the fourth quadrant?” Charlie looked at the
graph and responded, “No because the height would be negative. Oh wait, I just said it goes to
the left and to the right. So, x would be 3 and not 6. I take it back.” Charlie proceeded to
substitute x = 3 into the equation of the parabola and obtained the correct y-value of 3. He
concluded that the height of the rectangle would be 3. On his paper, he wrote L6 times 3W and
then told the researcher, “This area of this rectangle would be 18.” He proceeded to write A = 18
on his paper on the next line.

156
Keeping the semi-structured questions in mind to see if Charlie understood the task, the
researcher asked Charlie to try and find the area of rectangles for other values of x. Charlie chose
the length of 8 and explained to the researcher, “If the length is 8, then the value of x will be
equal to 4. This means that the height is 12 minus 4 squared which is -4. That doesn’t make
sense because the height is negative.” He scratched his head not sure what to do because the
height is negative. This single length led him to conclude that 18 is the maximum area. Knowing
that Charlie did not even consider any other values for x or the length, he had the following
discussion with Charlie:
Researcher: “Why do you think 18 is the maximum area? You only tried two values for
the length.”
Charlie: “Because when the length gets bigger, we get a negative area.”
Researcher: “So, would it be possible for the length of the rectangle to be smaller?”
Charlie: “I don’t know, but I don’t think so because making the length smaller would
make the overall area smaller.”
Researcher: “How can you justify that? You did not even try any length that was
smaller.”
Charlie: “Well, if the area of the rectangle is length times width and the length decreases,
the area should decrease as well.”
Researcher: “That sounds reasonable. So, could you tell me what the width or height of
the rectangle would be if the length of the rectangle is 2?”
Charlie: “Okay, so if the length is 2, that is one unit on each side. So, x is 1 and 12 minus
1 squared is 11. The area would be 2 times 11 which is 22. Wait, that’s bigger.”
The researcher hoped that this realization would make Charlie attempt to try other values
for the length or to make a more reasonable inference. Thinking about this realization, he told the
researcher, “I have to be able to find an equation for the area of this rectangle like we did in the
last task.” While the researcher understood that Charlie may not necessarily know what to do, he
realized that Charlie made a connection between this task and the second task of the first
interview.
Not wanting to sway Charlie’s thought process, the researched asked him, “If you want to
find the equation for the area of the rectangle, what would you need to know?” Charlie answer,

157
“I would need to know the area.” This informed the researcher that Charlie did not understand
that he needed to be able to express the length and the height (width) of the rectangle in terms of
a single variable similar to how he expressed the revenue as the price times the number of items
sold in terms of a single variable in the first task of this interview. However, when the researcher
attempted to coax Charlie to try another explicit length for the rectangle, Charlie was quick to
say, “I am determined to find the equation because the equation helped me solve the last task.”
Since the researcher saw Charlie was not going to take his mind off this approach, the
researcher engaged in the following conversation:
Researcher: “Okay, so what do you need in order to find the area of the rectangle?”
Charlie: “I need to know the length and the width of the rectangle.”
Researcher: “Can you tell me the length of the rectangle using only one variable?”
Charlie: “Well, I need to have x. But since the length goes from the right and to the left of the
origin, I need to have x over 2.”
This conversation made it apparent to the researcher that Charlie did not know how to
express the length of the rectangle in terms of one single variable. In particular, Charlie missed
the important relationship that the variable should represents the horizontal distance from x = 0.
Therefore, the length would be 2x because half the length of the rectangle in on the other side of
the y-axis. Charlie continued to verbalize his thoughts with his incorrect idea that the length of
the rectangle was
!
'
. However, this idea prevented Charlie from coming up with a meaningful
formula for the width of the rectangle. As he continued to ponder many incorrect ideas and
changing course, the timer rang to signal the end of the interview.
During this task, Charlie was stuck in the first two layers of the Pirie-Kieren model
(Figure 21). Similar to how Charlie performed in the first task of the first interview, he produced
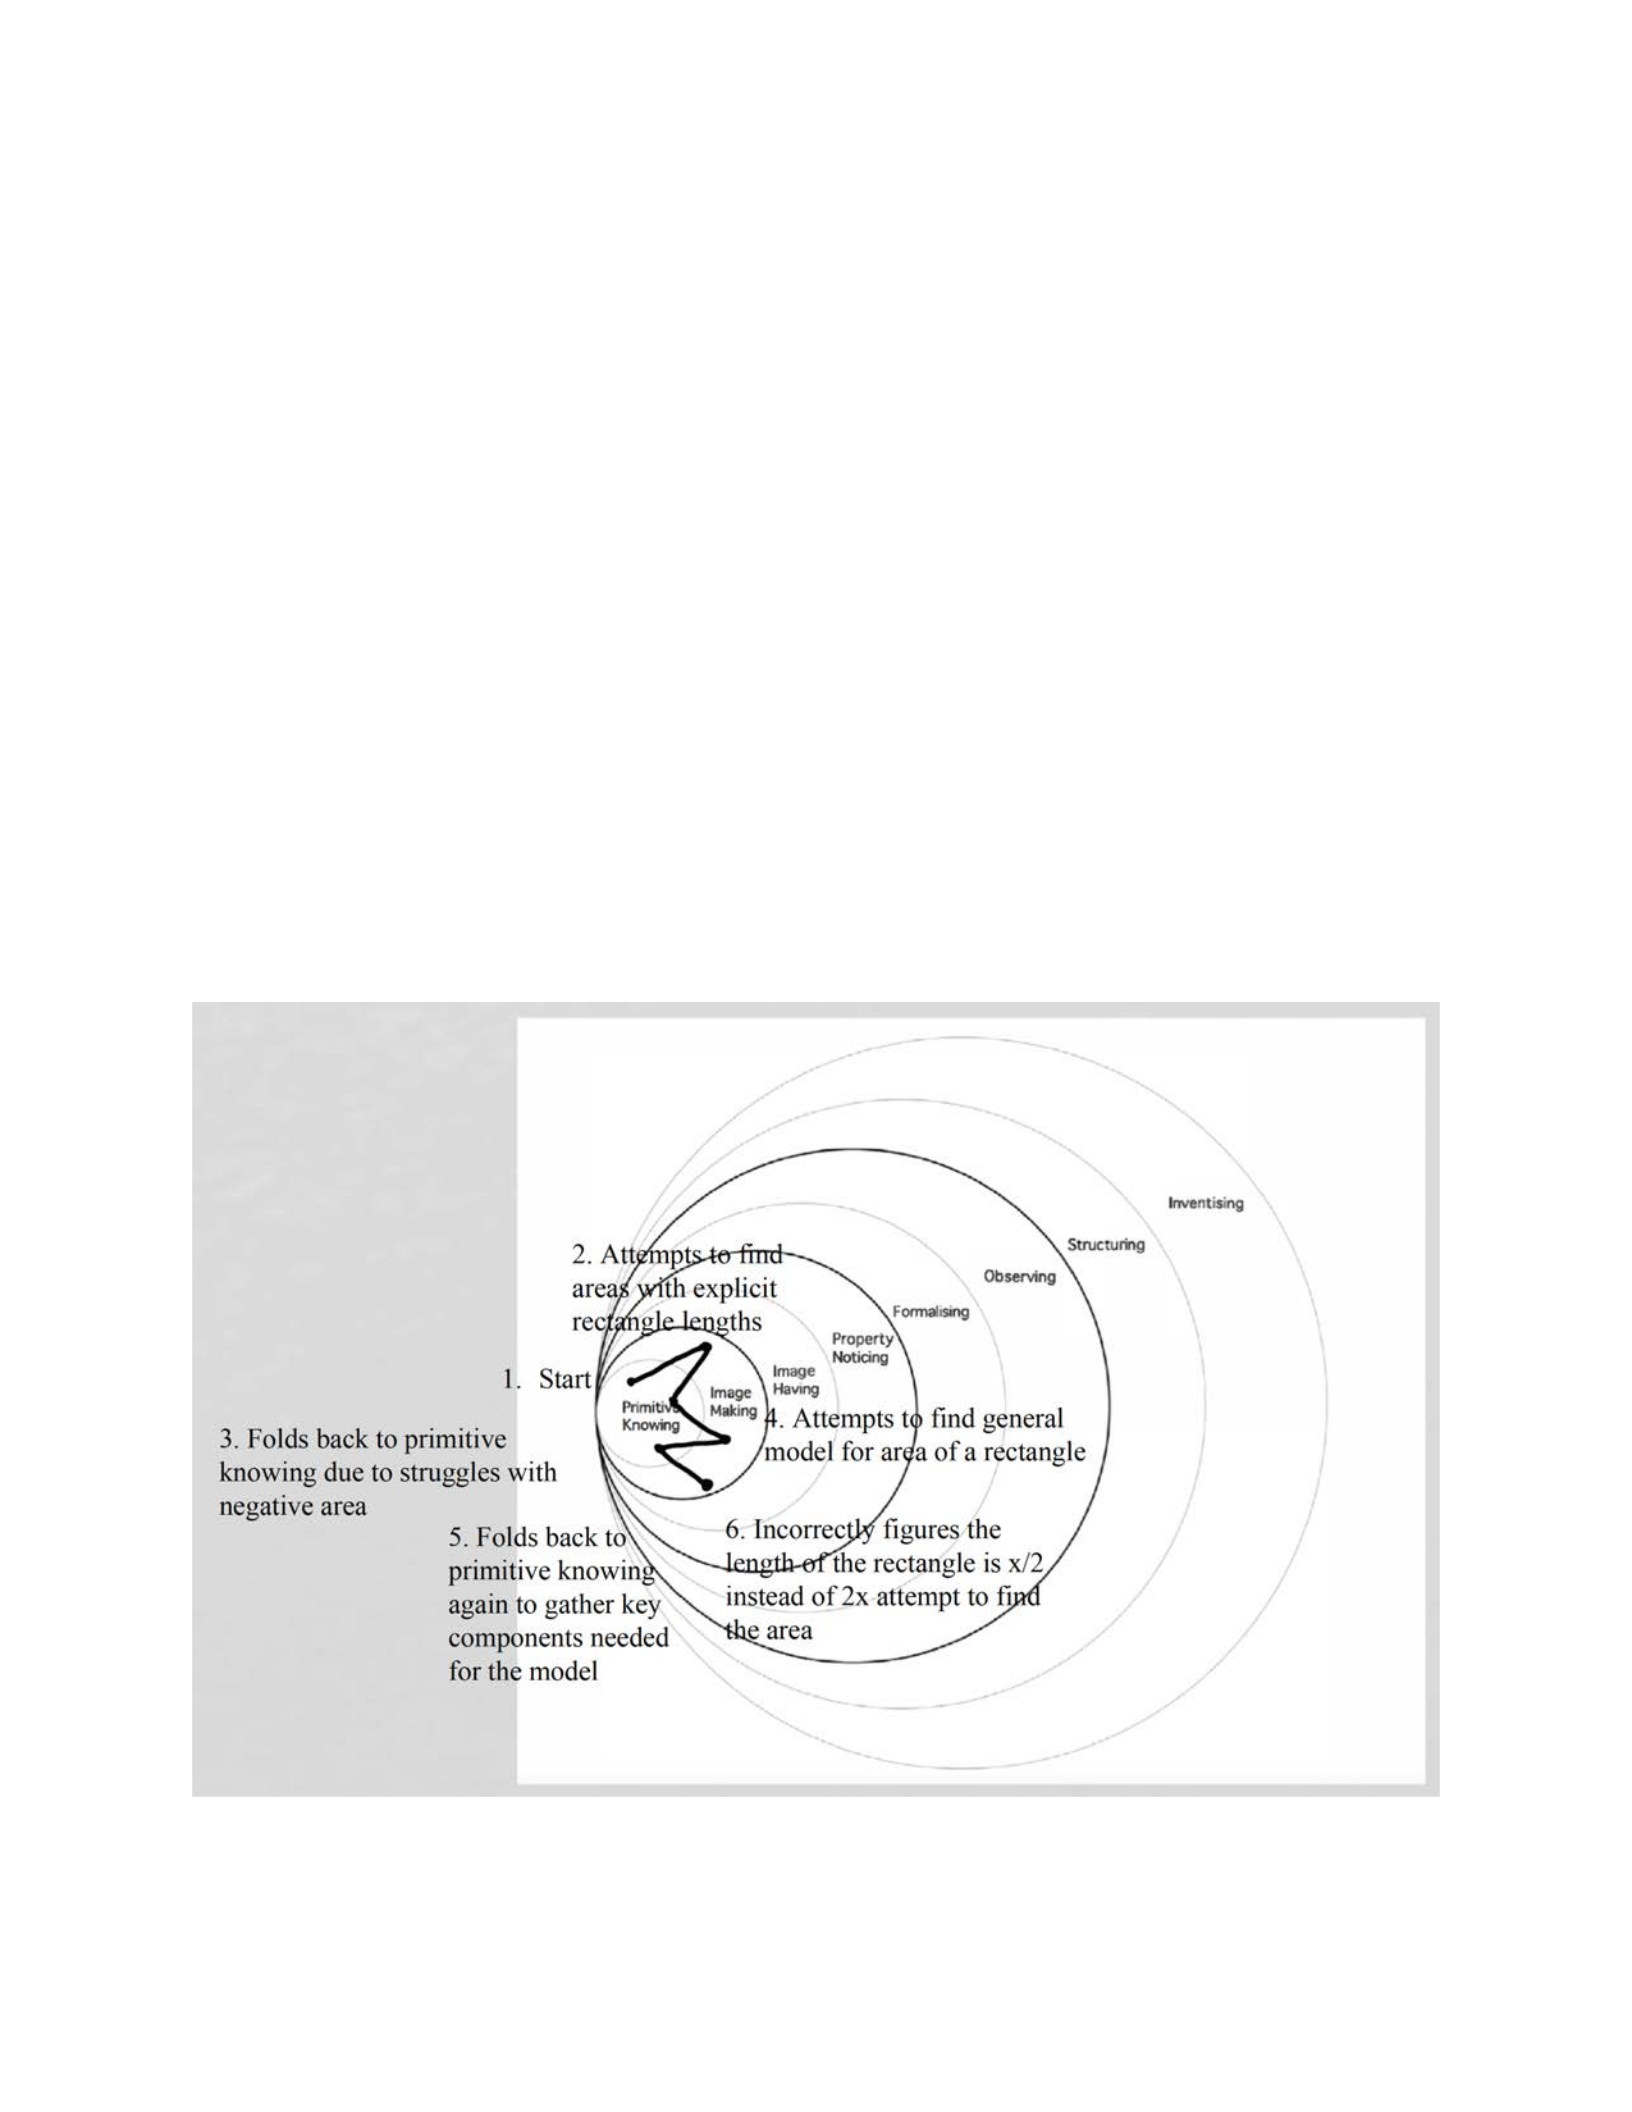
158
many pieces of information that was relevant. Unfortunately, he could not piece the fragmented
information together in a meaningful way. This caused him to fold back to the primitive
knowledge layer a couple of times. As a result, he was not able to make any substantial progress
on this task. Charlie did not show much prerequisite skills in this task but had fragments of many
of the skills. He was able to compute the height of the rectangle using a few discrete values, but
he was not able to make a generalization about the height because the negative value of the
height rattled his progress. The other major hinderance to Charlie’s progress was trying too hard
to find a formula for the area of the rectangle before he understood the relationship between the
length and the height of the rectangle.
Figure 21. Pirie-Kieren model for Charlie Task 2 of Interview 2

