


Exam 3 Study Guide
Module 9 Study Guide
Part 1:
What is a business process?
•Any activity or group of activities that takes an input, adds value to it, and provides
an output to an internal or external customer
•Processes use an organization’s resources to provide definitive results
•Step by step breakdown that aids in providing high quality results on a consistent
basis utilizing minimal resources
Relationship between business processes and the supply chain, importance of business
processes
•Made up of a series of interconnected and interdependent processes
•Productivity—managing inputs and outputs at a smaller scale
•Ties to growth, quality, design, and improvement
Three requirements of a good process
1. Good intentions- goal oriented, stakeholders considered, effective and efficient,
outputs are desired
2. Reproducible results- documented and easily understood
3. Measurable and Manageable-entire system considered. Accountability, good metrics,
easy to identify problems
Common reasons for bad processes
Never was good
•Ambiguity-goals are not clearly understood. Laziness, hubris, lack of information
•Misalignment-goals and actions not in alignment
•Miscommunication-employees do not understand goals, process…
Used to be good
•Market evolution-customer’s needs have changed
•Miscommunication-new employees don’t understand goals, process…
Limitations
•Development of poor or limited processes-may result in limited capacity,
inefficiency, confusion…
•Lack of appropriate tools, technology…
Cow path theory-Story and Lessons
•Ex. Company: Computer Silicon Wafers
•A bad process is created when someone keeps to the same safe routine
•A successful business continues if you learn a faster or better way of doing things
•If steps are important you need to communicate that to the employee, some people
try to be good employees by finding easier ways, but sometimes they skip important
steps that they never fully knew or understood
Three benefits of excellent business process
Consistency
Managing from afar
Ability to grow
Part 2:
Primary stages and steps in designing a business process
•Define goals and parameters
• Goals, values, stakeholders
• Block Diagram
• Establish the scope
•Define success
• Define the service
• Measurement & Management Considerations
•Build it, test it, improve it
• Primary steps detailed
• Develop a process map
• Evaluation, testing
Block diagrams (what’s the difference between block diagram and business process flow chart)
Block Diagram looks at the big picture. While a flow chart looks at things at a smaller level
Scope
Define process requirements and boundaries
Scope inflation or Scope creep
When scopes grow too big, the project becomes too difficult to manage and resources are wasted.
When to use each flow chart symbol
Rectangle: task, operation, data collection
Diamond: decision point where multiple flow paths possible
Oval (terminator): depicts start/end entrances and exits to process
Arrow: depicts flow of customer/material within the process
Rectangle inside a rectangle (process): depicts an entire process likely depicted in another
flowchart
Block arrow: movement, transportation
Circle: inspection requirement
Half oval: delay in process
Connector: output leads to another flow chart or into another flowchart
Swim lane flowcharts (functional)
Value of flowcharts for the organization
Module 10 Study Guide
Part 1:
Value of Process Improvement and Project Management on Careers-In-class examples
•Talked about Target jewelry example in class
Attributes of a good consultant
•Data skills
•Values feedback
•Creativity
•Understands people
Common consulting errors
•Making assumptions
•Developing solutions too soon
•Listening to client’s pre-fabricated
solutions
Change agent
Desire to help people
Values Simplicity
Scope Inflation
Sticking to a dead-end scope
Maintaining Hapiness

Business Process Improvement (BPI)
Step one: Desired State (Quantifiable Goals) (interview client-identify objectives, goals and
metrics. Goals must be quantifiable. Establish a hierarchy)
Step two: Present State (interview, observe, and/or collect data. Utilize the same metrics from
step 1. Process maps and data inspections—do actions and documentation match)
Step three: Gap Analysis—Gap between desired and present state (illustrate the GAP-utilize
desired metrics and goals. Do NOT develop solutions!!! Share and discuss the “GAP” with clients
and why it exists.)
Step four: Develop Project Scope- You can’t fix everything, Stay focused.
Step five: Collect data, share data, analyze- Investigate, Get feedback, Consider solutions
Step six: Develop solutions and recommendations-
Step seven: develop an implementation plan-
Desired State vs Present State
•Desired state-the goal!! Step 1 of BPI; quantifiable goals
•Present state-Step 2 of BPI; collect data and observe
Gap Analysis
Step 3 of BPI—measure and compare the difference between the desired state and the present
state
Scoping the project
Step 4 of BPI—there are many reasons why the present goals may not be met; you can’t fix
everything, stay focused
Developing solutions
Step 6 of BPI; solutions they will buy. Make an impact, push for creativity
Selling your solutions
Section one: Present a valuable idea
1. List values, objectives, goals
2. Recommend
Section Two: Convince on all fronts
1. Cost benefit analysis
2. Value to work ratio
3. Organizational fit
Section Three: How will it be measured?
Section Four: Implementation
Part 2:
What is a project
An endeavor in which human, material, and financial resources are organized, in a novel way, to
undertake a unique scope of work, of a given specification, within the constraints of cost and
time, so as to achieve a beneficial change defined by quantitative and qualitative objectives
Four steps in project management
•Define the project
•Establish project priorities
•Work breakdown structure
•Track project progress
Project priorities triangle from lecture
Objectives (provide examples)
Goals. Expectations or desired outcomes in the following categories
•Performance and quality
•Budget
•Time
Example: performance: The movie will make at least $20 million in ticket sales and won’t exceed
a budget of $14 million. Will be released next June and get a fresh rating on Rotten Tomatoes

Example: A motion picture with a PG-13 rating. 3 different trailers for the film. Movie posters
and graphic designs that can be used for promotion of the film
Milestones (provide examples)
A specific event in a project. Date of an important decision—choose location for factory; start of
a new phase of project—begin electrical wiring in the home; a deadline—date home must be
completed and inspected
Example: With booking actors, shooting locations, filming, etc.
AON Diagrams
Activity on Node network diagram
Calculate length of Critical path(s) and slack
Critical path-the longest path (in terms of time) in the AON network diagram. This path dictates
the expected completion time of the project. Items on this path must be completed in time in
order for project to be completed on schedule
Slack-the amount of time an activity or path can be delayed with impacting the length of the
critical path
Crash a project
Shortening the time of the project by increasing the number of resources usually in the
most cost-effective manner. When crashing in this class, ALWAYS choose the cheapest
solution
Module 11 Study Guide
Performance Metric (PM)
A single performance measurement used to evaluate, motivate and improve performance
System of metrics
A group of metrics that collectively attempt to provide a multi-dimensional view of a resource
or outcome
Ex. Basketball example: points per game; Academic example: GPA
Reasons organizations use PMs
•Helps to establish and support
standards
•Motivate good behavior
•Identify trends
•Manage from afar
Importance of goals and stakeholders
•Managing large numbers of
resources
•Performance data can facilitate
decision making and planning
The key to developing metrics that meet stakeholder goals is first recognizing all the
stakeholders and then understanding their individual goals
Consequences of poor metrics
An ill-conceived metric can motivate bad behavior and cause managers to make poor decisions.
More negative outcomes include:
•Supply chain goals are not met
•Poor output
•Waste
•Undesirable employee behaviors
Requirements of a good metric
•Managers may make poor decisions
•Employee victimization
•Undeserved winners
•Lack of contentment
•Measurable (time, length, weight,
cost, points, goals, sick days, etc.)
•Easily understood
•Attainable
•Strategically oriented
SMART metrics
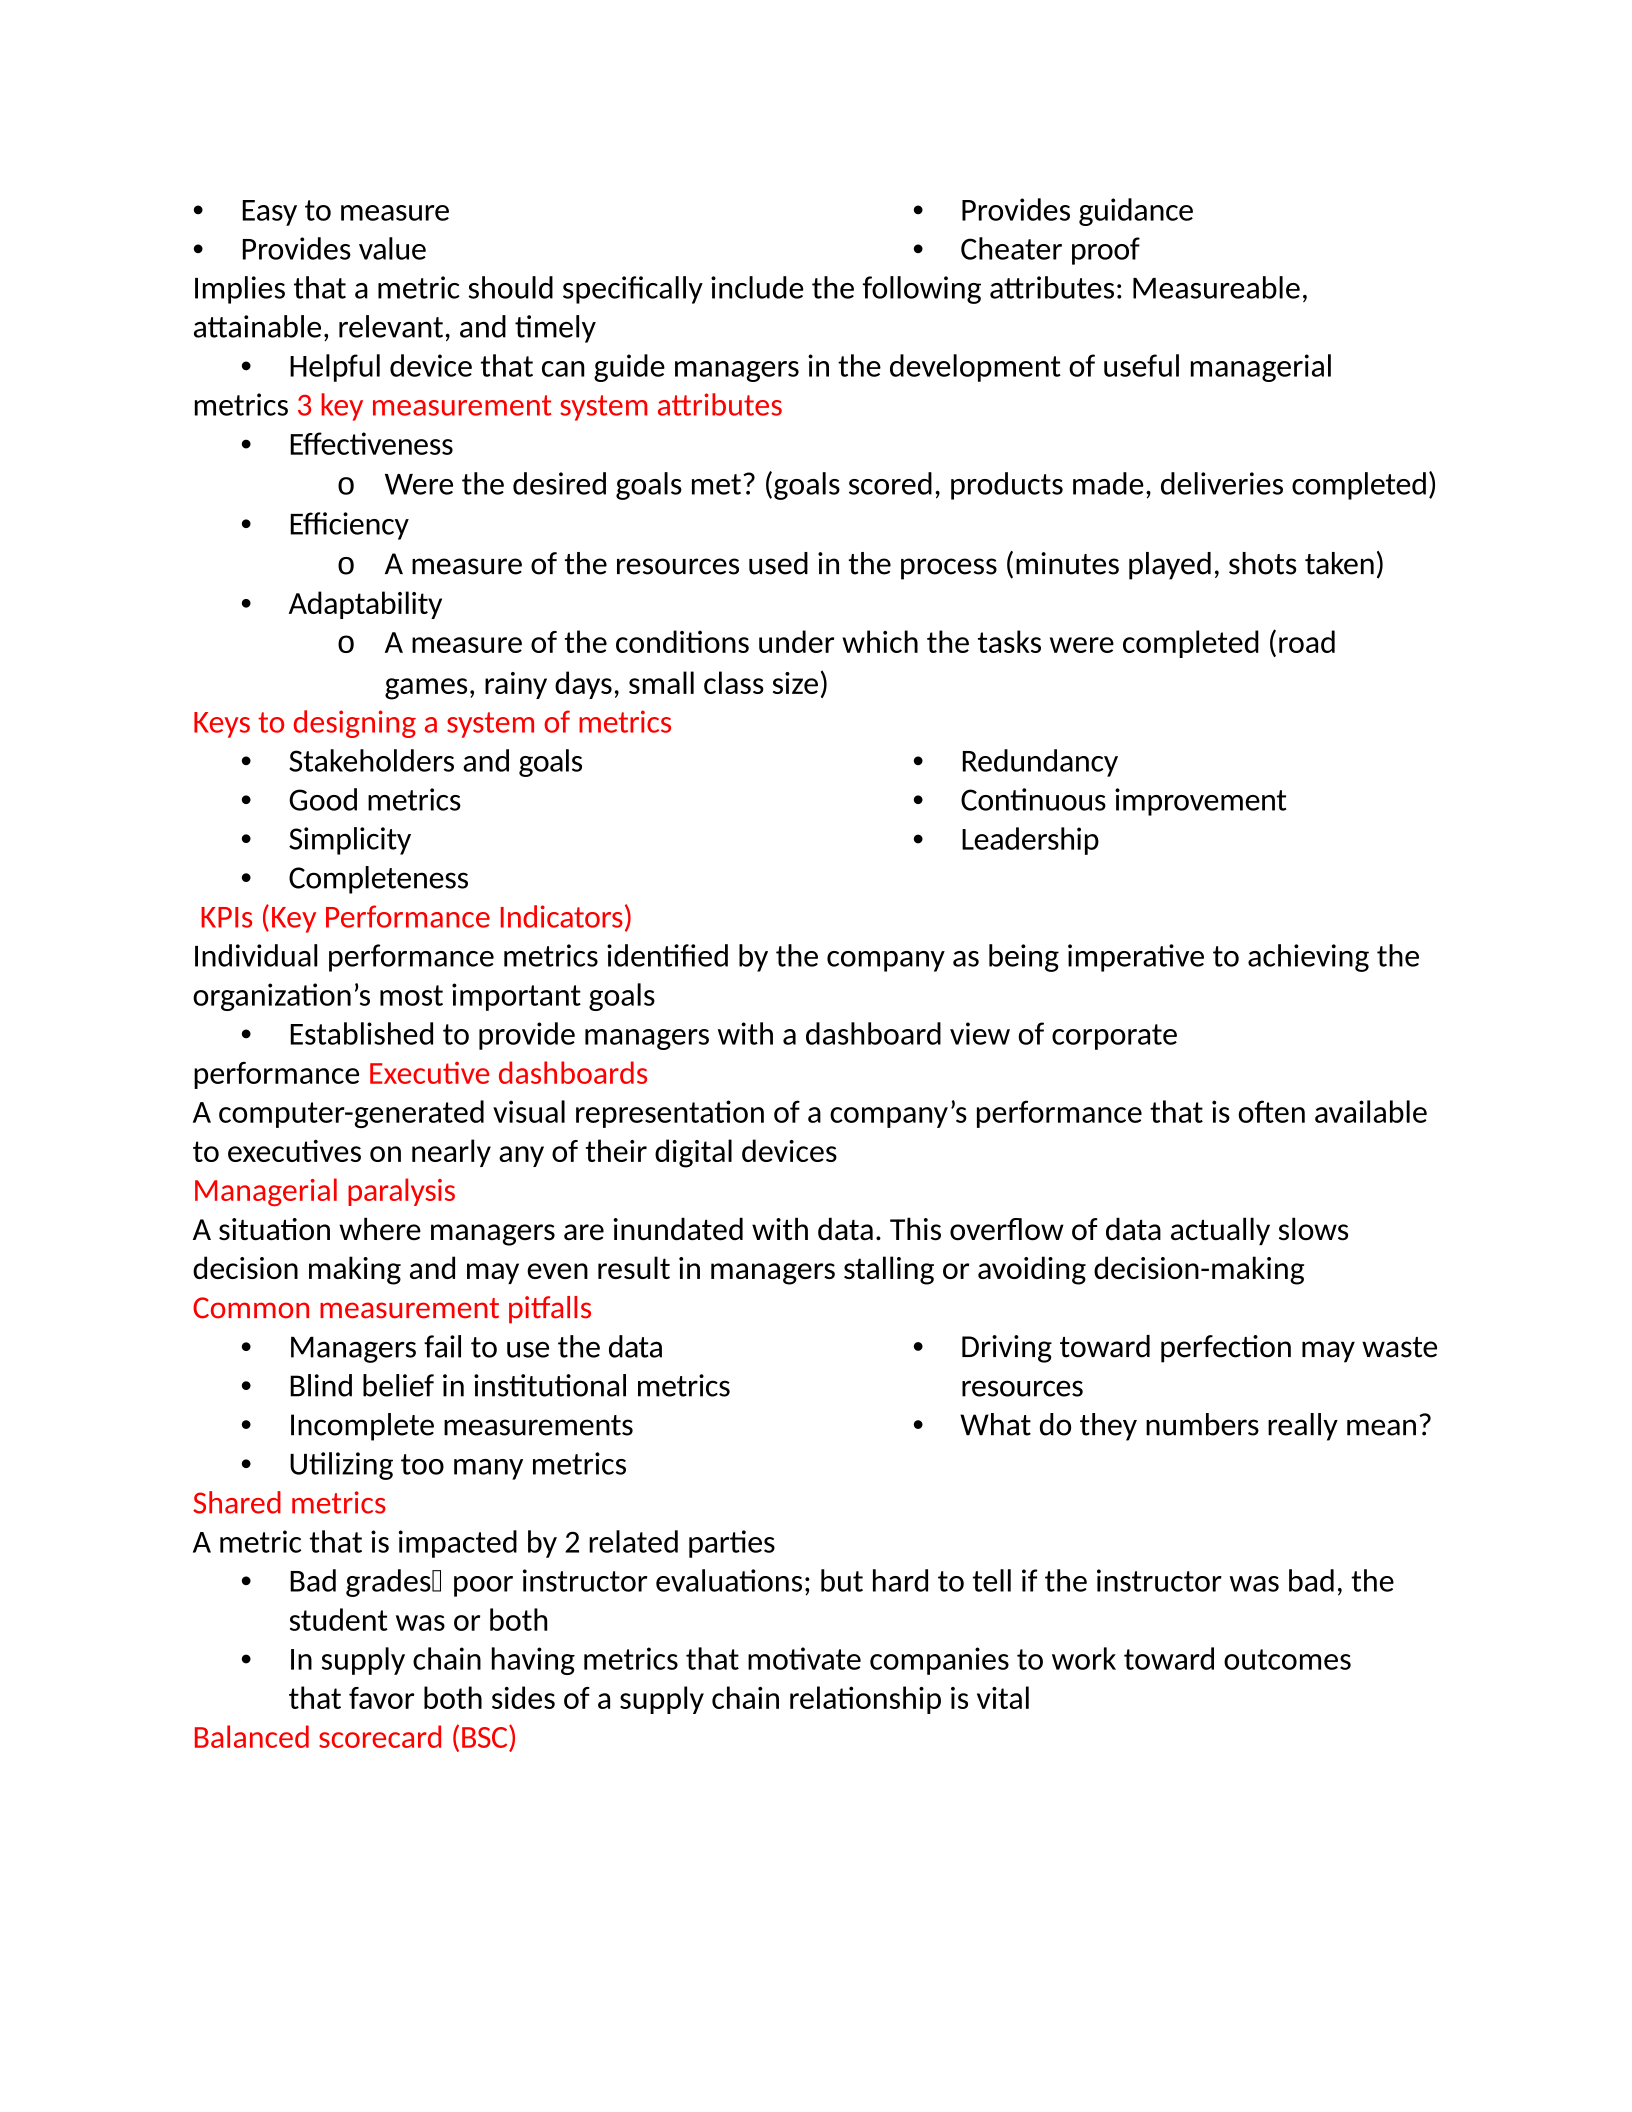
•Easy to measure
•Provides value
•Provides guidance
•Cheater proof
Implies that a metric should specifically include the following attributes: Measureable,
attainable, relevant, and timely
•Helpful device that can guide managers in the development of useful managerial
metrics 3 key measurement system attributes
•Effectiveness
oWere the desired goals met? (goals scored, products made, deliveries completed)
•Efficiency
oA measure of the resources used in the process (minutes played, shots taken)
•Adaptability
oA measure of the conditions under which the tasks were completed (road
games, rainy days, small class size)
Keys to designing a system of metrics
•Stakeholders and goals
•Good metrics
•Simplicity
•Completeness
KPIs (Key Performance Indicators)
•Redundancy
•Continuous improvement
•Leadership
Individual performance metrics identified by the company as being imperative to achieving the
organization’s most important goals
•Established to provide managers with a dashboard view of corporate
performance Executive dashboards
A computer-generated visual representation of a company’s performance that is often available
to executives on nearly any of their digital devices
Managerial paralysis
A situation where managers are inundated with data. This overflow of data actually slows
decision making and may even result in managers stalling or avoiding decision-making
Common measurement pitfalls
•Managers fail to use the data
•Blind belief in institutional metrics
•Incomplete measurements
•Utilizing too many metrics
Shared metrics
A metric that is impacted by 2 related parties
•Driving toward perfection may waste
resources
•What do they numbers really mean?
•Bad grades poor instructor evaluations; but hard to tell if the instructor was bad, the
student was or both
•In supply chain having metrics that motivate companies to work toward outcomes
that favor both sides of a supply chain relationship is vital
Balanced scorecard (BSC)
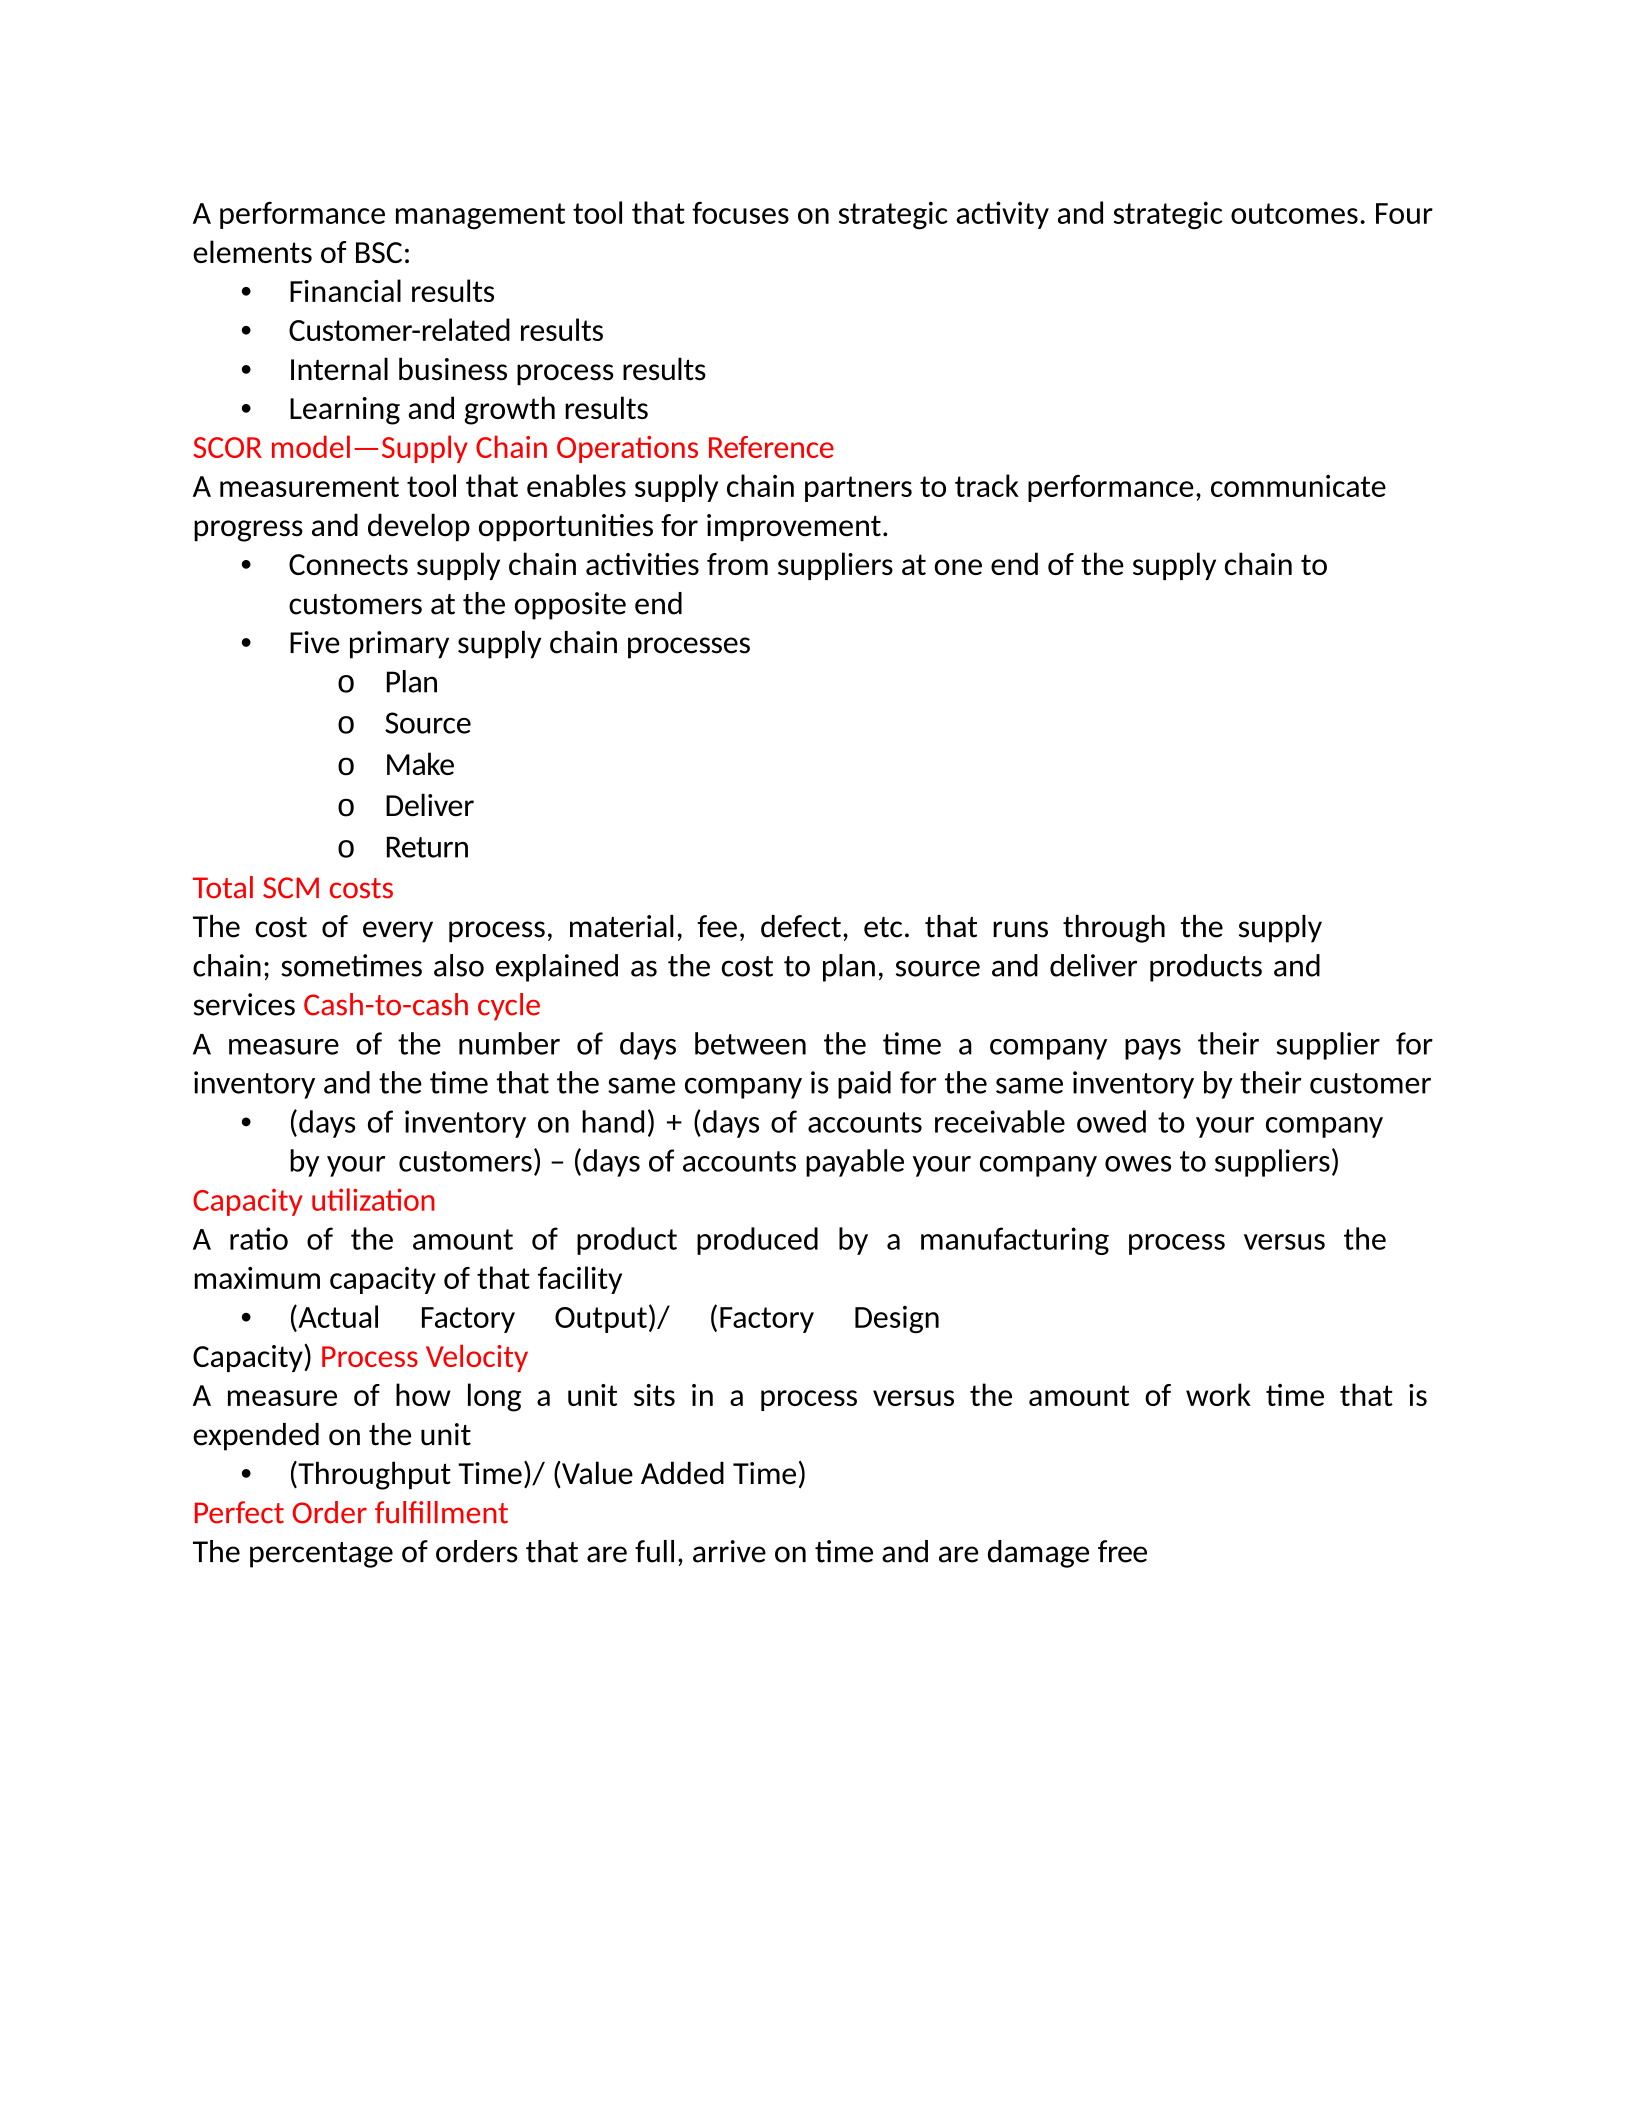
A performance management tool that focuses on strategic activity and strategic outcomes. Four
elements of BSC:
•Financial results
•Customer-related results
•Internal business process results
•Learning and growth results
SCOR model—Supply Chain Operations Reference
A measurement tool that enables supply chain partners to track performance, communicate
progress and develop opportunities for improvement.
•Connects supply chain activities from suppliers at one end of the supply chain to
customers at the opposite end
•Five primary supply chain processes
oPlan
oSource
oMake
oDeliver
oReturn
Total SCM costs
The cost of every process, material, fee, defect, etc. that runs through the supply
chain; sometimes also explained as the cost to plan, source and deliver products and
services Cash-to-cash cycle
A measure of the number of days between the time a company pays their supplier for
inventory and the time that the same company is paid for the same inventory by their customer
•(days of inventory on hand) + (days of accounts receivable owed to your company
by your customers) – (days of accounts payable your company owes to suppliers)
Capacity utilization
A ratio of the amount of product produced by a manufacturing process versus the
maximum capacity of that facility
•(Actual Factory Output)/ (Factory Design
Capacity) Process Velocity
A measure of how long a unit sits in a process versus the amount of work time that is
expended on the unit
•(Throughput Time)/ (Value Added Time)
Perfect Order fulfillment
The percentage of orders that are full, arrive on time and are damage free
Powered by TCPDF (www.tcpdf.org)

