


Consumer Perceptions of Eco-Friendly Products
Section 1: Foundation of the Study
In 2009 the Environmental Protection Agency (EPA) reported that
U.S. consumers generated over 3.19 million tons of e-waste including
televisions, telephones, video cameras, and computer equipment. In the
United States, only 430,000 tons, or 13.6%, of these electronic items had
been disposed of and recycled (Environmental Protection Agency, 2009).
The creation of global electronic waste was 40 million tons per year, and the
United Nations Environment Programme (UNEP) estimated that, by 2020,
e-waste levels could rise by as much as 500%. As the global e-waste has
grown by about 40 million tons a year concerns about e-waste ramifications
have increased (Sanitation Updates, 2010). Walsh (2009) suggested that the
massive amount of improperly disposed e-waste has raised toxicity in the air
to dangerous levels. Consequently, researchers have begun to investigate
strategies to mitigate the negative ramifications of e-waste (Robinson,
2009).
One strategy to reduce e-waste is to encourage consumers to purchase
electronic products that are environmentally friendly (Ngo, 2008). Research

by Ngo (2008) found that consumers were more likely to make purchases
based on product labeling design combining specific environmental details
and a numerical rating system. Consumers who would pay more for eco-
products believed that eco-friendly products would reduce ewaste variables
(Datta, 2011). The purpose of the present study was to assess the level of
consumer willingness to pay more for eco-friendly products, and consumers
willing to recycle e-waste at drop-off recycling centers. The relationships
among quality (Ladhari, Souiden, & Ladhari, 2011), price (Bennett, 2011),
and brand loyalty (Muk, 2012) have been the subject of research for several
decades; however, the relationship between these variables and consumer
outcomes related to eco-friendly products has not been extensively explored
in the current literature. This paper will add to the current research on
product factors and consumer behavior, thus attempting to close a gap in the
professional literature regarding eco-friendly products and consumer
conservation behavior.
Background of the Problem
Consumers play a large role in the management of e-waste. Due to
increased global interest, 90% of American consumers were concerned

about the way their purchases affected the environment, and they would be
willing to change their purchasing behavior in an effort to improve the
environment (Choi, 2012). Consumer interest in the environment had an
effect on the success of manufacturing, and manufactures that have
associated themselves with environmental causes have rebounded from the
recession significantly faster than traditional manufacturers who had not
done so. Companies that had profited from developing and selling green
and sustainable products have increased over the years (Berger, 2010).
Green sustainable products met the following criteria: sustainability, cradle-
to-cradle design, source reduction, innovation, and viability (Green
Technology, 2010). Cradle-to-cradle design is a holistic economic,
industrial, and social framework, which seeks to create systems that are not
just efficient but essentially wastefree (Watson, Boudreau, & Chen, 2010).
For example, General Electric (GE) introduced compact fluorescent light
bulbs in 2005. At first, GE captured less than 5% of the market; however,
only 2 years later, corresponding to an increase in public awareness of
threats to climate change, GE captured 20% of the market (Banon Gomis,

Guillén Parra, Hoffman, & Mcnulty, 2011; Dhiman, Marques, & Holt,
2010).
Companies’ leaders are able to increase their competitive position by
using ecofriendly products. Bonini and Oppenheim (2008) suggested that
GE increased its revenues, enhanced its brands, and strengthened its
competitive position because of its increased focus on eco-friendly products
and the consumers’ positive response to them. Other companies have also
seen the green evolution as a way to save and cut the overhead cost. If
consumers decided to purchase only eco-friendly products, then
manufacturers would have to comply and make more profit (Orange, 2010).
Although the findings indicated that not all consumers believed that they
would actually have an impact on the environment, researchers have not
established whether enough consumers believe that purchasing eco-friendly
products is good for the environment and that this could amount to a viable
strategy for reducing e-waste (Peattie, 2010).
Voinea and Filip (2011) analyzed the main changes in consumer
buying behaviors during the 2008 North American economic crisis which
threatened the collapse of large financial institutions and found that price

played a critical role in purchase decisions. Similarly, Braimah and
Tweneboah-Koduah (2011) demonstrated that price ranks ahead of green
concerns as a major influence in a purchasing decision. Whereas some
researchers suggested using a cost-based technique to establish the price of a
product (Alvarez & Lippi, 2012; Ferson & Lin, 2011), others suggested that
the cost of manufacturing was the most important determinant in product
pricing (Gordon, 2012).
Guth, Levati, and Ploner (2012) argued that full and marginal cost pricing
was consistent with the satisficing model. Ryan (2011) explained that the
satisficing model showed how a consumer made a purchase decision when
faced with an array of similar choices that were all for sale at the same
physical location. In this study, I assessed consumer decisions based on
their preference for eco-friendly products versus non-eco-friendly products.
In this model, a company objective was not only to maximize profit, but also
to earn a satisfactory return on investment. Gordon (2012) and Atkinson
(2013) suggested that price would not be the only determinant in the
marketing mix. It was currently unknown how the price points of eco-
friendly products would affect consumer behavior and whether consumers

who believed in the efficacy of eco-friendly products were willing to pay
more for those products (Lee, 2011). It was also unclear how willing
consumers would be to recycle e-waste at drop-off recycling centers
(Saphores,
Ogunseitan, & Shapiro, 2012).
Some researchers demonstrated that quality had an impact on
consumer behavior as consumer behavior models revealed that quality was a
positive antecedent to purchase intentions (Gallarza, Gil-Saura, & Holbrook,
2012; Melnik, Richardson, & Tompkins, 2011; Monroe, 2012). According
to the Zeithaml model (as cited in Gallarza et al., 2012) perceived quality
and purchase intention are measurable. In the Zeithaml model, the
consumer perception of perceived quality shows consumers’ judgments
about a product’s overall superiority or excellence. Although other
researchers have studied the effect of consumers’ green purchasing behavior
using quality attributes as a contributors to the formation of purchase
intention (Chen & Chai, 2010; Lindqvist, 2010), researchers do not currently
know how quality affects consumers’ willingness to pay more for eco-

friendly products or the consumers’ willingness to recycle e-waste at drop-
off recycling centers.
This study will add to the existing knowledge base surrounding these topics.
In addition to the important role that product quality plays, Han and
Ryu (2009) concluded that brand loyalty also influences consumer behavior.
Research also suggested that customer satisfaction was influenced by
physical surroundings and price perception (Ariffin, Bibon, & Saadiah,
2011; Han & Ryu, 2009). Other researchers maintained that these factors
had an impact on customer satisfaction and that customer satisfaction
depended on customer loyalty (Ladhari et al., 2011). Loyal customers were
more likely to recommend products and services and engage in positive
word-of-mouth behaviors as a result they spend extra money in service
operation than nonloyal customers were more likely to do so (Ladhari et al.,
2011). In addition, loyal customers were less costly to serve because they
already knew the product or service well and required less information
(McKercher & Guillet, 2011). Thus, in recent years, service providers have
focused on achieving customer loyalty by delivering superior value and by
identifying and enhancing the key factors that determine loyalty (Chen,

2010). The key factors that make up customer brand loyalty are captive
customers or convenience seekers and contented and committed customers
(Mao, 2010).
Mao (2010) defined captive customers as repeatedly purchasing the
same product, service, or brand because of a lack of opportunities to
substitute alternatives, whereas convenience-seekers might not respect the
brand, but act out of convenience. Mao contended that consumers, who had
a positive attitude toward a brand, did not consume extra products or
services. Lastly, committed consumer loyalty was active in both attitude
and behavior.
The concept of green branding had slowly started to emerge. Green
branding consists of a set of attributes and benefits that are associated with
reduced adverse environmental impact and the ability to make a positive
impression on consumers and raise their concerns for the environment
(Wong, 2010). It was unknown how brand loyalty would affect consumers’
willingness to pay more for eco-friendly products and the consumers’
willingness to recycle e-waste at drop-off recycling centers. In this study, I

attempted to clarify the relationships among service quality, price, brand
loyalty, and eco-friendly products.
Problem Statement
In 2009 the Environmental Protection Agency (EPA) reported that
U.S.
consumers generated over 3.19 million tons of e-waste including televisions,
telephones, video cameras, and computer equipment. In the United States,
only 430,000 tons, or 13.6%, of these electronic items had been disposed of
and recycled (Environmental Protection Agency, 2009). The power
generated from recycling a million laptops can power 3,500 U.S. homes for
a year (EPA, 2012). As consumers continue to purchase and replace
electronic items, these figures will continue to rise (Rani, Singh, &
Maheshwari, 2012). Despite the high rate of e-waste, Sharma and Bagoria
(2012) contended that green marketing for eco-friendly products would
reach $3.5 trillion by the year 2017, due to catering to environmentally
conscious consumers. The general business problem is the need to manage
the high rate of failure of e-waste and to produce more eco-friendly
products, thus not missing profits and a growing eco-friendly customer
market. The specific business problem was that business managers did not

have sufficient evidence to develop marketing and pricing strategies
reflecting addressing the relationship between the high level of e-waste and
the consumer’s preference for eco-friendly products.
Purpose Statement
The purpose of this quantitative study was to examine the relationship
between the high level of e-waste and the consumer’s preference for eco-
friendly products and provide business managers with the information they
need to develop advertising and pricing strategies. The method used was
convenience sampling. The geographic location used for this study was
central Florida. The population sampled was comprised of students from
University of South Florida (USF) registered on the SurveyMonkey
database. I used correlation analysis to determine the relationships between
the independent variable consumers’ views on eco-friendly products on
reducing waste, and consumers’ willingness to pay more money for eco-
friendly items. Product price perceptions, quality perceptions, and brand
loyalty perceptions were the three dependent variables used in this study.
The findings of this study might contribute to social change by
encouraging product manufacturers to produce more environmentally

friendly products than nonenvironmentally friendly products. This increase
could lead to a reduction in e-waste by providing more justification for the
proliferation of products with a lower environmental liability rating rather
than having products with high environmental
liability.
Nature of the Study
To explore and investigate consumer views on eco-friendly products I
used a quantitative correlational design to address the purpose of this study.
A qualitative methodology would explore attitudes, behavior, and
experiences through such methods as interviews or focus groups. A smaller
pool of participants is required to participate since this type of research
yields in-depth opinions from participants. Smaller groups allow consumers
to express clear ideas and share feelings that do not typically come out in a
quantified survey or paper test. In qualitative research, the contact with
participants tends to last quite a bit longer than in a quantitative study (Chen
& Macredie, 2010). In contrast, the quantitative methodology is an
exploration that aims to measure variables and their relationships (Jandaghi
& Matin, 2011). Unlike qualitative research, quantitative research uses
measurable data to determine facts and patterns. A quantitative method

offered the best approach for this study because data gathering from a large
sample via survey and collecting quantitative data allowed me to determine
consumer perceptions and intentions though statistical means. I
administered an online survey through SurveyMonkey (see Appendix A) to
University of South Florida members of the SurveyMonkey database, and
the data gathered helped to assess consumer perspectives on eco-friendly
products.
The design of this study was nonexperimental and correlational. In an
experimental design, the researcher would measure the impact of an
intervention on an outcome (Chen & Macredie, 2010; Smith, Wright, &
Breakwell, 2011). Without a random assignment, manipulation, or
treatment, nonexperimental investigations are possible (Holbrook, 2011).
The correlational design was appropriate for this study to find answers to the
research questions, which required estimating the degree of association
between variables (Chen & Macredie, 2010).
Although correlational methods cannot imply causation, correlation
does allow for the determination of the strength and nature of the
relationship between two variables. Only a small number of empirical

investigations explore what motivates a consumer to purchase eco-friendly
products, the present study provides a description of the consumers’
understanding of whether eco-friendly products are suitable for the
environment, whether they are beneficial in reducing e-waste, and whether
consumers would be willing to pay more for eco-friendly products.
Research Questions
The research question this study will answer is how does the high
level of e-waste correlate with consumer preference for eco-friendly
products? The following research questions examined consumers’ views on
eco-friendly product quality, eco-friendly products price, and eco-friendly
product brand loyalty and how these views would relate to consumers’
willingness to recycle e-waste at drop-off recycling facilities and
consumers’ willingness to pay more for green products.
RQ1: To what extent does eco-friendly product quality relate to
customer willingness to recycle e-waste at drop-off recycling facilities?
RQ2: To what extent does eco-friendly product price relate to
customer willingness to recycle e-waste at drop-off recycling facilities?

RQ3: To what extent does eco-friendly product brand loyalty relate to
customer willingness to recycle e-waste at drop-off recycling facilities?
RQ4: To what extent does eco-friendly product quality relate to
customer willingness to pay more for green products?
RQ5: To what extent does eco-friendly product price relate to
customer willingness to pay more for green products?
RQ6: To what extent does eco-friendly product brand loyalty relate to
customer willingness to pay more for green products?
RQ7: To what extent do gender and age differences relate to customer
willingness to pay more for green products?
RQ8: To what extent is a relationship extant between e-waste and
eco-friendly product purchasing?
Hypotheses
The null hypotheses and alternative hypotheses set forth this study
were as follows:
Ho1: There is no significant statistical relationship between eco-
friendly product quality and customer willingness to recycle e-waste at drop-
off recycling facilities.

Ha1: A significant statistical relationship exists between eco-friendly
product quality and customer willingness to recycle e-waste at drop-off
recycling facilities.
Ho2: There is no significant statistical relationship between eco-
friendly product price and customer willingness to recycle e-waste at drop-
off recycling facilities.
Ha2: A significant statistical relationship exists between eco-friendly
product price and customer willingness to recycle e-waste at drop-off
recycling facilities.
Ho3: There is no significant statistical relationship between eco-
friendly product brand loyalty and customer willingness to recycle e-waste
at drop-off recycling facilities.
Ha3: A significant statistical relationship exists between eco-friendly
product brand loyalty and customer willingness to recycle e-waste at drop-
off recycling facilities.
Ho4: There is no significant statistical relationship between eco-
friendly product quality and customer willingness to pay more for green
products.

Ha4: A significant statistical relationship exists between eco-friendly
product quality and customer willingness to pay more for green products.
Ho5: There is no significant statistical relationship between eco-
friendly product price and customer willingness to pay more for green
products.
Ha5: A significant statistical relationship exists between eco-friendly
product price and customer willingness to pay more for green products.
Ho6: There is no significant statistical relationship between eco-
friendly product brand loyalty and customer willingness to pay more for
green products.
Ha6: A significant statistical relationship exists between eco-friendly
product brand loyalty and customer willingness to pay more for green
products.
Ho7: There is no significant statistical relationship between gender,
age, and customer willingness to pay more for green products.
Ha7: A significant statistical relationship exists between gender, age,
and customer willingness to pay more for green products.

Ho8: There is no significant statistical relationship between e-waste
recycling, income, and age.
Ha8: A significant statistical relationship exists between e-waste
recycling, income, and age.
Survey Questions
All survey information is completely confidential. Your responses are
very important. Thank you for participating in the survey.
Please circle the option that applies to you
Section 1 1 2 3 4 5
Demographics
1. Your gender male Female
2. Your age range 18-24 25-31 32-38 39-45
46-52
3. Education level high some AA BA/ BS Master’s
school college – degree degree Degree or
graduate no degree higher
3b. Income 0-24,999 25,000-49,000 50,000-100,000-150,000-+
99,999 149,000

Please circle the option that applies to you
Section 2 - Willingness to
pay more for green
products Never Rarely Sometimes Often Always
4. I have used green 1 2 3 4 5 product before.
5. I believe that green products are more expensive than nongreen
products.
6. I am willing to pay
more for green
products.
1 2 3 4 5
7. Indicate the
percentage you are
willing to pay for green
products
between
1% -
10%
more
between
11% -
20% more
between
21% -
30% more
betwee
n 31% -
40%
more
between
41% -
50%
more
8. I believe the price of
green products effect
my decision to purchase
them.
1 2 3 4 5

19
1 2 3 4 5
Strongly
Disagree
Disagree
Neutral
Agree
Strongly
Agree
9. I believe the quality of 1 2 3 4 5 green
products effect my decision to purchase.
10. I believe that green 1 2 3 4 5
products are of better quality than nongreen products.
11. I would recommended green products based on quality to
my friends.
12. I would switch to 1 2 3 4 5 green products if
they were more available at my local store.
13. I would switch to 1 2 3 4 5 green products if
they were promotional deals such as TVs ads and local printed coupons
available at my local store.
14. I am more likely to buy a certain product because it has a brand
name I have used in the past.
Select the option that best describes you best
Section 3
Willingnes
s to
Recycle e-
Waste
Never
Rarely
Sometimes
Often
Always
15. I recycle electronic
devices or e-waste
(products such as
computers, televisions,
VCRs, stereos, copies,
fax machines, cellular
phones as opposed to
discarding them as trash).
1
2
3
4
5

20
1 2 3 4 5
Select the option that best describes
you best
Strongly
Disagree Disagree
Neutral
Agree
Strongly
Agree
16. I would start recycling 1 2 3 4 5 electronic
devices if I receive a financial incentive for doing so.
17. If I had the choice of 1 2 3 4 5 discarding an old electronic
device I would use a drop-off recycling facilities.
18. I would buy and 1 2 3 4 5
recycle electronic devices if more drop-off recycling facilities were
available in my area.
19. I would you buy and recycle electronic devices if there was an
awareness campaign in my area about the dangers of not recycling.
Theoretical or Conceptual Framework
Consumer behavior theories and buying behavior in advertising were
the theoretical frameworks used in this investigation. Through the results
of this research, I will explain an aspect of buyer behavior.
Consumer Behavior Theories
Consumer behavior theories cover two areas: consumer perception
and collective consciousness (Cohen, n.d.). The consumer perception
theory suggests that consumers understand how perception of a product or

21
1 2 3 4 5
service influences their behavior. Researchers studying consumer
perception explored branding, buyer’s remorse, positioning, repositioning or
depositioning, sensory perception and value, and quality (Kher et al., 2010;
Monday, 2011; Rosenzweig & Gilovich, 2011).
Perception relates to the consumer’s ability to make some sense of reality
from external sensory stimuli (Rosenzweig & Gilovich, 2011). Branding
involves imposing an identifying feature on products or services so that they
would be easy to identify by the public (Kher et al., 2010). Positioning
occurs when marketers try to build up their brand. Positioning involves
actively creating images that are both appealing to and recognizable by
certain target groups. Repositioning relates to altering the image to appeal
to a larger market of consumers to help influence a larger target market,
whereas depositioning relates to the practice of trying to devalue a substitute
(Timofte, 2013). Value relates to the customer’s perception that a product’s
benefits outweigh its cost. These benefits can be either qualitative or
quantitative. Quality relates to value, while taking into account measuring
goods and services against the competition (Timofte, 2013). Buyer’s
remorse relates to a feeling of regret that occurs after one has made a

22
1 2 3 4 5
purchase and, then, realizes that one has missed a better opportunity to buy a
product or service (McKnight, Paugh, McKnight, & Parker, 2010).

23
In the cognitive dissonance theory, cognition (e.g., attitudes, desire,
intention) is dissonant, or conflicted, when consumers are unable to keep
away from a situation, as well as from information, that might add
dissonance (Sahgal & Elfering, 2011). This is apparent when a consumer
chooses one brand over another. Similarly, cognitive dissonances that occur
after a purchase is post purchase dissonances (Bose & Sarker, 2012). Saleh
(2012) was able to show that post purchase regret comes from low consumer
satisfaction, and low satisfaction leads to no-repurchase intention, the
tendency to shift to alternative brands, and negative word-of-mouth reports
about the brand in question.
Theories of collective consciousness reflect the shared beliefs and
attitudes held within a society. Researchers such as Dekker, Hummerdal,
and Smith (2010); Filippakou and Tapper (2010); and Jung (2012) suggested
that an autonomous individual would come to identify with a larger group.
While this was true for some groups (as for example in Japan), other groups
(for instance in the United States), had a more selfaggrandizing need over
others (Cohen, n.d.). Self-aggrandizing nations had a high opinion of them
and viewed themselves as very different from others.

Collectiveconsciousness information helped marketers target their market by
appealing to consumers’ individualism in the United States but not in other
parts of the world.
Buying Behavior Theories
Some theories related to buying behavior include the generic theory of
buying behavior, cultural theory of buying behavior, and the environmental
theory of buying behavior. These three theories are explaining how
consumers tend to buy products and services. Consumers would go through
a series of steps before making a purchase and customer decisions depend
on a number of different factors such as cultural influences, personality, and
environmental elements (Lehtinen, 2012).
The generic theory of buying behavior highlights the basic procedures
followed by consumers when making a purchase. The customer would
recognize a need to make a purchase and start researching potential products
and pricing. An example would be a customer about to buy a television set:
He or she would evaluate features, benefits, and pricing, and finally make a
decision to purchase. Additionally, the way the customer feels about the
brand would also tell how likely the customer is to purchase from the same
company again. In a 2000 study, 89% of teenagers said that they “would

likely switch brands to one associated with a good cause” (Hyllegard, Yan,
Olga, & Attmann,
2010).
Proponents of the cultural theory of buying behavior highlight the
cultural influences shown to affect the buyers’ behavior (Penn, n.d.). An
individual’s cultural beliefs and values develop over time and within the
context of a community. These values and beliefs lead to certain purchases
(Yuan, Song, & Kim, 2011). Researchers have explored cultural variables
and their effects on online shopping (Ha & Stoel, 2012) and brand loyalty
(Carman, 2011).
Supporters of the environmental theory of buying behavior suggested
that purchasers would buy different items based on different situations and
variations in customer knowledge. For example, a buyer in the United
States would buy winter clothes in November or December and not during
the summer (Bloch, 2011). Mazar and Zhong (2010) used environmental
theory to explore the occurrence of green purchase decisions using socio
demographic variables and personality indicators that measured
environmental consciousness.

Operational Definitions
This section clarifies terms in this study. Some are topic specific,
whereas others might convey a variety of different meanings in relation to
other subject matter. e-Waste: A popular, informal name for electronic
products nearing the end of their useful life. Computers, televisions, VCRs,
stereos, copiers, and fax machines are common electronic products
(California Department of Resources Recycling and
Recovery, 2013).
Green: The term green encompasses a variety of environmental
concerns. Some of the current concerns relate to the depletion of natural and
scarce resources. Examples include bad and excessive production and
consumption activities, waste accumulation, and emissions because of
production processes, the use of hazardous materials, fast replacement,
consumption patterns and usage, and usage and disposal habits. There are
also unhealthy products and side effects arising from unhealthy
environments, the use of improper materials, improper choices, and uses due
to uninformed consumer decisions, unsafe or unpleasing work environments
due to inadequate safety management, and lack of appropriate aesthetics
(Chen, 2010).

Green sustainability products: Such products meet the following
criteria: (a) sustainability by meeting the needs of society in ways that can
continue indefinitely into the future without damaging or depleting natural
resources, and (b) sustainability meeting present needs without
compromising the ability of future generations to meet future needs (Green
Technology, 2010).
Greenwashing: Greenwashing occurs when a company or
organization spends more time and money claiming to be green through
advertising and marketing than through implementing business practices that
minimize environmental impact. Some consider it an example of
whitewashing, but with a green brush
(Greenwashingindex.com, 2011).
Innovation: Innovation involves developing alternatives to existing
technologies, whether fossil fuel or chemical-intensive agriculture, which
have demonstrated to damage health and the environment (Green
Technology, 2010).
Source reduction: The attempt to reduce waste and pollution by
changing patterns of production and consumption (Green Technology,
2010).

Sustainable products: Such products reduce the impact on the
environment by virtue of being responsibly sourced products (e.g., those that
are either renewable or sustainably harvested). A sustainably harvested
source material does not harm the surrounding area, pollute the air, or
permanently reduce the supply (Sebhatu, Enquist,
Johnson, & Gebauer, 2011).
Viability: Viability involves creating a center of economic activity
around technologies and products that benefit the environment, speeding
their implementation, and creating new careers that truly protect the planet
(Green Technology, 2010).
Assumptions, Limitations, and Delimitations
Assumptions
This study contains two foundational assumptions. The primary
assumption was that participants would be honest in their responses to the
survey. Honest responses were essential to the integrity of the study, and I
made every effort to elicit honest answers. For example, I would assure
participants that their responses were confidential and would remain
anonymous. Additionally, the survey questions were short to keep
participants interested and focused on providing the most pertinent

responses. The survey was also pilot tested to ensure that questions were
straightforward and easy to understand and that respondents were likely to
answer honestly and appropriately.
A second assumption was that consumers were aware of recycling
efforts and able to answer questions about the likelihood of their practicing
recycling. There was an assumption that participants would know the
location of their nearby recycling centers. Daoud (2011) stated that
American households account for most of the electronic market, but they
recycle only 26% of the time, thereby producing an enormous amount of
ewaste. The assumption that consumers were becoming more aware of the
effect of their spending habits on the environment and the trend that they
were making changes to protect natural resources for future generations
appears to be accurate (Spiegel, 2011).
Limitations
There were several potential limitations in this study. One limitation
of the survey was administration within an online database so that only
participants who had access to the Internet and had a survey account would
able to participate. I analyzed a large number of responses by age and
gender representing a diverse pool of online USF student registered with

Survey Monkey. This provided a level of validity to the data analysis.
Another limitation was the availability of persons to participate. Although
participants would receive no incentives for participation, the survey was
brief in order to encourage responses. Participants received a number of
reminders to encourage them to take part in the survey. Another limitation
was the potential for a social desirability bias. Respondents might indicate
that they were more likely to recycle or pay more for a green item because
they considered it an environmentally conscious activity. This was
consistent with information found through the literature review (Lee, 2011).
With this study, I also explored whether consumer’s attitude and behavior,
environmental consciousness and willingness to pay more for green
products still prevailed. Lee was able to prove those college students who
were more concerned about the environment tended to be willing to pay
more for green apparel. The quantitative methodology also limits exploring
the conclusions from an investigation. In nonexperimental research,
causality cannot be determined. The correlational method allows for the
examination of significant statistical relationships to be reported (Leedy &
Ormrod, 2010). Information on these relationships helps to close a gap in
the professional literature.

Delimitations
A delimitation of the study was the selection of products within the
consumerelectronics industry; thus, the results might not apply to products
from other industries. Another delimitation was that the sample consisted of
persons who currently reside in the state of Florida; the results might not
generalize to individuals who are not Florida residents. Last, University of
South Florida students between 18 and 24 years of age, who have registered
as members of SurveyMonkey, made up the sample. Accordingly, the
results might not generalize to individuals outside this university and age
range or to persons who are not members of SurveyMonkey. Based on E-
Marketer (2008) research suggesting that this demographic shows the
greatest tendency to integrate green behavior into their daily lives, I chose
this age range for my research.
Significance of the Study
Reduction of Gaps
Recent studies indicated that eco-friendly product choices share a
relationship with product pricing. Researchers Draper, Dawson, and Casey
(2011) and Lee (2011) were able to identify target consumers who were
willing to pay more for environmentally friendly products. Other

researchers such as Millson (2012) focused on determining green customers’
purchase intentions and the usefulness of ecological product labels and
pricing. No research was extant on the relationship between belief in
products being good for the environment and willingness to purchase eco-
friendly products. Currently, the EPA (2011) defined green products as
products made in a way to reduce their environmental impact. There was
also a paucity of research on consumers’ self-reported understanding of the
role played by eco-products in reducing e-waste and creating appropriate
outcomes for the environment. This information could be useful for
business, and it might influence business practices. This study adds to the
existing knowledge on the topic and is a step in the direction of closing a
gap in the literature.
Implications for Social Change
As dissemination of information related to the advantages of green
technology increased, manufacturing companies were making decisions
about their products. Some companies were already becoming more
socially and environmentally responsible and found that their profits
increased as they changed along with their consumers’ preferences. Other
companies were lagging behind in these considerations. I began this

investigation with a firm belief that, if the results of my study would
demonstrate a significant statistical relationship between consumers’ belief
that purchasing eco-friendly products is good for the environment and
inspired their willingness to pay more for such products, then I needed to
promulgate this information. This information might be valuable for
businesses, especially ones subscribing to traditional business models, and it
might contribute to social impact. The results of this study might benefit
society by encouraging product manufacturers to make investments and
explore development opportunities in green products. The findings might
also encourage manufacturers to pursue higher environmental ratings per
product rather than lower ones. If I could demonstrate to product
manufacturers that investing in environment-friendly factors will directly
affect their ability to increase their profits, then they might consider
implementing more green technology in their consumer electronics, which,
in turn, will create social benefits for consumers and society by reducing e-
waste. The results of the current investigation might also be informative for
consumers who had decided for themselves which factors were most
important when they made a purchase decision. If consumers were aware of
the relationship between a product’s price and its impact on the

environment, perhaps it would motivate them to modify their purchasing
decisions.
A Review of the Professional and Academic Literature
The purpose of the literature review was to provide a background of
the issues and factors surrounding consumer behavior related to eco-friendly
products and to determine if a relationship existed between consumer
understanding and their willingness to pay more for eco-friendly products.
Previous research suggested that customer satisfaction shares a relationship
with the physical surroundings, price perception, brand loyalty, and the
quality of goods and services (Ariffin et al., 2011; Han & Ryu, 2009). The
cost to the environment could be overwhelming because most of these
products produce e-waste. In 2010, the United Nations Environment
Programme (UNEP) reported that the generation of global electronic
garbage was 40 million tons per year, and estimates suggested that by the
year 2020, e-waste levels could rise by as much as 500%. Electronic waste
and the role businesses play in managing electronic waste are critical issues
under these circumstances. The enormous amount of environmental
pollution related to industrial manufacturing worldwide and evidenced in

recent years has caused society in general to become more concerned about
environmental conditions (Chen,
2010).
Researchers and experts agree that e-waste is an enormous emerging
environmental problem, and some companies have become invested in
reducing e-waste by creating products that reduce the amount of e-waste
generated (Bereketli, Genevois, Albayrak, & Ozyol, 2011). This has created
an entire industry promoting a green environment, eco-friendly products,
green branding, and green jobs (Ahn, 2010). Green jobs would grow from
610,000 in 2008 to 810,000 in 2013, while green investment would grow
from $2.02 billion to $115.2 billion US (Ahn, 2010). These emerging
changes would also increase the overall demand for eco-friendly products
and with it the cost to the business sector, which, inevitably, would cause
higher prices for consumers. The purpose of this research was to investigate
how willing were consumers to pay more for eco-friendly products if they
believed that such products would reduce e-waste and, further, whether a
statistically significant relationship existed between these variables.

Consumer Perspectives
In this study, I sought to clarify, through a review of the literature,
whether customer perspectives were related to purchase decisions and
perceived risks and also the extent to which they might be related to a
number of conditions such as brand loyalty, advertising effectiveness,
innovation, and pricing (Becker, 2009; Cheung & Thadani, 2010). To
reduce customer doubt related to purchase decisions, consumers process
available information regarding each product and form a first impression.
To that end, consumers viewed products in an arrayed queue where they
could evaluate each product to make a basic judgment about the product
(Muhamad, Melewar, & Alwi, 2011).
Product price perceptions. Of all the elements in the queue, price
turned out to be the most salient influence for consumers (Bennett, 2011).
Price was a powerful piece of information for the consumer, reported
Farrell and Shapiro (2010, p. 12).
Balakrishnan (2011) called price “the sacrifice to obtain a product” (p. 253).
Consumers can attach a value to price; therefore, price plays an important
part in their decisionmaking process about a product. Customers used price
as a cue in evaluating their experiences with a product or service and in

shaping their attitude toward a provider (Han & Ryu, 2009). What was
unknown, however, was whether consumers were willing to pay more for an
item if it offered environmental advantages, and it was to that question that
the present study addressed itself.
Brand loyalty perceptions. Han and Ryu (2009) and Ariffin et al.
(2011) suggested that physical surroundings and price perception influence
customer satisfaction. Other researchers also maintained that these factors
had an impact on customer satisfaction and that customer satisfaction led to
customer loyalty (Ladhari et al., 2011). Loyal customers were more likely
to engage in positive word-of-mouth behaviors and spending extra money in
a service operation than nonloyal customers were likely to do so (Ladhari et
al., 2011). In addition, loyal customers were less costly to service because
they knew the product or service well and required less information
(McKercher & Guillet, 2011). Thus, in recent years, service providers
focused on achieving customer loyalty by delivering superior value and
identifying and enhancing the main factors they had determined to inspire
loyalty (Chen & Chen, 2010).
Product quality perceptions. Numerous researchers have conducted
investigations into the relationship between price and quality (Bennett,

2011; Zheng, Chiu, & Choi, 2012). Hui (2010) explored how brand names
can affect the consumers’ reliance on technology-adoption decisions and
protection from security technologies. Hui used an experimental research
method to study the effects of brand name and knowledge on the adoption
decision of antivirus software. In the 2 x 2-research method, two groups of
students used two different brands. Hui randomly selected subjects to
participate in different groups, presented them with information about
different brands of antivirus software, and the respondent indicated their
product choices. Hui used z tests and logistic regression to analyze the data
received from each group. The findings demonstrated that, with other cues
held constant, price was the only factor to predict the consumers’ perceived
quality. Hui also reported that the brand name did affect product choice. A
strong brand tended to inspire a false sense of security and lead to poor
product choices, whereas knowledge could reduce the consumers' reliance
on brand name in a security-technology adoption decision.
Rao (2007) measured the two forms of market information, price, and
store, in his study. The results indicated that, although price was the
dominant variable, the inclusion of store image had a significant impact on
consumers’ product-quality perception. Rao conducted a meta-analysis that

investigated the influence of price and brand name or store name on buyers'
evaluations of product quality. Results of the analysis revealed that, for
consumer products, the relationships between price and perceived quality
and between brand name and perceived quality were positive and
statistically significant. Overall, these early investigations demonstrated that
price strongly affected the consumer’s quality perception.
Ho (2010) examined customer satisfaction and the role-played by total
quality management (TQM). The authors were able to demonstrate that
improved quality could actually save money. With the use of a meta-
analysis, existing research studies on TQM revealed that TQM significantly
increased customer satisfaction across various industrial sectors and cultural
settings. The researchers noted that this result challenged a fundamental
assumption of the day, namely that producing higher quality goods and
services meant incurring greater costs. Most people assumed that
development of higher quality products would require raw materials that
were more expensive, extra care in processing, more inspections, and the
hiring of more skill workers. Hassen, Rahmanb, and Haruna (2012)
demonstrated that quality could be improved by reducing and reworking
mistakes to ensure that things would be corrected the first time (better

process control), which would result simultaneously in financial savings and
a better quality product.
Consequences of Electronic Waste
Many electronic items contain dioxin, and an inappropriate disposal
strategy can release dioxin into the environment. Numerous health
problems have resulted from high levels of dioxin, including stillbirths, low
birth weight, and premature deliveries. E-waste is one of the causes of
dangerous gases and other chemicals into the environment as well,
specifically lead, beryllium, arsenic, mercury, antimony, and cadmium, all
of which affect people’s health and the environment in a negative way.
Based on the health and environmental ramifications associated with e-
waste, researchers were beginning to investigate strategies to reduce, or at
least stop increasing, the amount of e-waste.
However, additional research is required in this area.
Role of Business in Managing Electronic Waste
Researchers and experts agreed that e-waste was an emerging
environmental problem and some companies were starting to invest in
reducing e-waste. For them, managing e-waste provided augmented
business opportunities, especially given the volumes of e-waste currently

generated and the content containing both toxic and valuable materials
(Bereketli et al., 2011).
Not all businesses agreed on e-waste management strategies
(Lepawsky, 2012; Wu, 2011). Although most researchers and consumers
agreed on the necessity of preserving a livable planet, some maintained that
environmental regulation hampers business competitiveness. In addition,
despite presumed social benefits of environmental standards, leaders in
private industry maintained that prevention cost and clean-up cost would
lead to higher prices for electronics and reduced competitiveness (Redclift,
2009). The differences that have come to characterize the discussion of the
environment and nature in the social sciences descriptions are the
distinctions between critical realism and social constructivism, and Redclift
reviewed the main intellectual challenges of both positions. Redclift blamed
a lack of theoretical development in carbon dependency on an apparent
stalemate.
Green environment. Because of the enormous amount of
environmental pollution evidenced in recent years, which relates to
industrial manufacturing worldwide, society has become increasingly
concerned about environmental conditions (Chen, 2008b). Because of the

increased societal attention and consumer demand for environmentally
friendly products, more and more companies were willing to accept the
environmental responsibility (Zeng, Meng, Yin, Tam, & Sun, 2010).
Currently, environmental concerns were rapidly emerging as a mainstream
issue for consumers, especially because of global warming, and many
companies were seeking to profit from the opportunity. Environmental
pollution could result from the inefficient use of resources, but businesses
could increase their productivity with the use of green innovation (Zeng et
al., 2010). Green innovation relates to innovation in environmentally
responsible products and services that were both sustainable and
contributing to reducing the impact of greenhouse gases (GHG) on the
environment (Cooke, 2012).
Chioua, Chana, Letticea, and Chung (2011) promoted the concept of
core competence, and many previous studies explored the relevant issues of
core competence; however, no research to date has explored core
competencies of firms with green innovation or environmental management.
In order to achieve core competencies, some researchers maintained that a
company should meet three requirements by (a) gaining potential access to a
wide variety of markets, (b) contributing to the customer benefits of the

product, and (c) developing products that were difficult for competitors to
imitate (Gimzauskiene & Staliuniene, 2010). The creation of core
competencies is beneficial for company performance and corporate success
(Paik, 2011). If companies want to adopt green marketing successfully,
their environmental concepts, and ideas should be in all aspects of marketing
(Sandhu, Ozanne, Smallman, & Cullen, 2010). When companies are able to
provide products or services that satisfy their customers’ environmental
needs, the customers might be more favorably disposed toward their
products or services.
Eco-Friendly Products
Eco-friendly products, or green products, are products that do not
harm the environment whether in their production, use, or disposal.
Businesses and consumers alike were attempting to reduce their impact on
the environment by practicing energy conservation and reducing pollution to
the environment; thus, many environmental factors were currently under
review. In addition, GreenPeace (2010) corroborated the importance of
environmental factors, in their ranking of the top 18 manufacturers of
consumer electronics such as personal computers, mobile phones, TVs, and
game consoles, according to their policies on toxic chemicals, recycling, and

climate change. GreenPeace aimed at eliminating hazardous substances,
recycling obsolete products, and reducing the impact of the manufacturers’
operations on the climate. The eco-rating system helps to prevent
greenwashing, a term used to describe false or misleading advertising by
leading companies, designed to convince consumers that their products were
environmentally friendly, when in actuality they were not.
According to one research, more than 95% of consumer products
claiming to be green commit at least one of the greenwashing offenses such
as hidden trade-off, no proof of being green, and vagueness (Mitchell &
Ramey, 2011). At this writing, there were only a few consumer-product
rating companies in existence. The Electronic Product Environmental
Assessment Tool (EPEAT) was a standard tool used for evaluating,
certifying, and registering green computers and other electronic consumer
products according to three tiers of environmental performance: Bronze,
Silver, and Gold (Obrien, 2010). No current industry standards were
available for rating green products.
Environmental positioning. Environmental positioning was an
effective way to lure consumers to try new brands and product variants.
Firms with established brands were increasingly leveraging the brand equity

associated with their core products and launching green brand extensions.
Some companies were taking independent action to improve environmental
performance by self-advertising their environmental activities or by
participating in voluntary environmental programs (VEP) that required
participants to self-monitor and publicly report their environmental
performance (Darnall, Potoski, & Prakash, 2010; Harrington, Khanna, &
Deltas, 2011). In other instances, companies received a third-party
certification for environmental activities (Darnall et al., 2010). Keller and
Lehman (2009) suggested that marketers of leading brands usually advertise
heavily to reinforce some of the brand attributes as a way of positioning the
brand schema effectively in the consumers' minds. Although this might be
effective, consumers were likely to have already attributed their own
opinions and existing perceptions as part of their brand schemas for well-
established and highly familiar brands (Laceya, Close, & Finney, 2010;
Völckner, Sattler, Ringle, & Thurau, 2010).
The nature of the product category itself would produce some
expectations of product attributes (Kocyigit & Ringle, 2011). Consumers
were likely to have strong notions of typical product attributes for highly
familiar brands, as there was relatively little room for ambiguity in the

perceptions of these brands in comparison to other brands. A number of
researchers have suggested that product attributes dominate consumer
decision making, which also link pioneering advantage to attribute typicality
(Perera & Chaminda, 2013). Perera and Chaminda (2013) explored
corporate social responsibility (CSR) and its relationship with identifying
stakeholders along with categorizing types of CSR initiatives and linking
corporate social performance to firm performance. The researchers
suggested that CSR should enhance its sustainable competitive advantage in
social performance. Using literature reviews, the researchers were able to
demonstrate that, for CRS to gain competitive advantage, it should be part of
the company’s mission and visible to external audiences.
Absolute levels or values of product attributes alone cannot be the
basis for new product variants or line extensions. Rather, evaluations based
on the congruency between an extension product’s attributes and
consumers’ existing expectations about the parent brand schemas as well as
product categories (Völckner et al., 2010). Völckner et al. (2010)
investigated the importance of brand extension in consumer expectations.
The researchers used two large data sets to identify four areas, namely
generalizability of relevance of brand extension factors, the research results

beyond the lab into conditions with real extensions, generalizability of
findings across consumers, and product categories and parent brand and
their generalizability across success measures.
The results indicated that there were major differences across
customer segments. The researchers concluded that green product-line
extensions were product variants in the product category that satisfied the
functional needs of the customers, but eco-friendly positioning could help
customers reduce their carbon footprint. The researchers also noted that
consumers had to reconcile the perceptions of benefits associated with
environmental green claims and how such perceptions correlated with
dominant attributes in a product-category schema for familiar and parent-
brand schemas (Völckner et al.,
2010).
Green branding. Green branding and imaging were important when
distinguishing products and services based on quality features (Hur, Yoo, &
Hur, 2010). Brand images included symbolic meanings with the attributes
of a brand that could help customers develop a mental picture of the brand
and link it to offers (Chen, 2010). According to Myrden, Kelloway, and
Scotia (2012), brand image covered functional benefits, symbolic benefits,

and experiential benefits. Based on the understanding that green brands are
those that consumers associate with environmental conservation and
sustainable business practices, the green-brand image was becoming more
important for companies, especially due to the widespread environmental
consciousness of consumers and strict international regulations of
environmental protection. A well-implemented green brand identity could
provide benefits to companies that were environmentally conscious, and
consumers could select products that were greener than other products.
Commercial success of green branding could become successful only if the
communication of branding messages was effective (Paço, Alves, & Shiel,
2013).
Green positioning. Sharma and Singh (2013), along with Schaper
(2010), suggested that green positioning was an essential factor in the
success of green branding strategies. By utilizing a green positioning
strategy, a company could build functional brand attributes that built brand
associations by delivering information on environmentally sound product
attributes. In order to be effective, this positioning strategy should be based
on relevant environmental advantages of the product compared to competing
conventional products and might refer to production processes, product use,

or product elimination, or all of these in combination (Sabchez, Martínez-
Ruiz, JiménezZarco, & Megicks, 2012). For example, a car brand is
environmentally sound if the models in question produced significantly
lower emissions than their competitors did. Several studies addressed the
value perception of selected environmental product attributes (Park, Choi, &
Kim, 2011). Park et al. (2011) explored a number of variables to
understand consumer behavior and the choices consumers made with regard
to environmentally friendly products. The researchers reviewed current
research on the topic to try to find the relationships among
sociodemographic variables and preferences for environmentally sustainable
products. Findings were mix especially in the area of income, where
previous research showed that income could be negatively, positively, or
insignificantly related to green consumer choices.
Researchers also suggested that there was a negative correlation
between proenvironmental attributes and attributes in product categories for
nonhuman consumption. Kayande, Roberts, Lilien, and Fong (2007)
examined the incoherence of fuel-efficient and powerful cars on consumer
uncertainty perceptions, preference, and likelihood of purchase. The
subjects in this study were (N = 77) 2nd-year MBA students. The

researchers were able to prove, through a mathematical model, that products
that positively combined valued attributes might increase some elements of
preference for the product. However, if those attributes occurred in
unexpected combinations, incoherence would also increase uncertainty,
which, in turn, might lower other elements of preference.
The results of the investigation corroborated earlier research on this topic.
Prior research on schema incongruity suggested that, when an
additional attribute in a product variant is congruent with dominant
attributes in the product category schema, it improves product evaluations.
The findings also indicated product improvement drove its salability even
when the improvement was irrelevant to the main operation of the product
(Ahearne, Rapp, Hughes, & Jinal, 2010).
Because neither regulations nor independent verification of product
sustainability existed, consumers had to make their purchase choices based
on unsustainable environmental claims. Although there was no regulation
of claims, consumers preferred some claims to others. Kangun, Carlson,
and Grove (1991) indicated that consumers were able to distinguish between
specific (tangible and concrete environmental benefits) and vague claims.
Kangun et al. investigated how organizations increased their target in

advertising as consumers became more environmentally conscious than they
had been before. The researchers developed two typologies; the first one
sorted advertised environmental claims into five distinctive types, and the
second one delineated categories of misleading or deceptive environmental
claims. The researchers found that certain types of claims placed among
environmental advertisements were more susceptible to causing consumer
confusion and perceptions of possible deception. Further, the findings of
Simula, Lehtimäki, and Salo (2009) suggested that environmental claims
perceived as clear and straightforward would result in positive perceptions
of the product as well as the advertiser, whereas vague claims tended to
result in negative perceptions and suspicions of greenwashing. Simula et al.
noted that the growth of sustainable development required a high level of
directed innovation. The authors reported that the relationship between
scale effects and administration, purchasing, pricing, technology, marketing,
and profitability had an effect on the environment, and they suggested
alternatives to quality management standards as well as codes of practice to
influence the sustainable development on business practices. Chang and
Fong (2010) maintained that green marketing and improving brand image,

which was an important determinant of customer satisfaction could achieve
differentiation between products.
Literature Related to Research Design
The methods used most often in the reviewed literature were
descriptive in nature. Some researchers used experimental models such as
the brand loyalty model, the wordof-mouth, or WOM, model (Becker,
2009), and the TQM model (Ho, 2010) to guide their research. In this study,
I chose the descriptive method as the most appropriate approach.
I utilized a cross-sectional, descriptive survey method to explore the
relationships among demographic variables (age, gender), consumer
perspectives on eco-friendly products (product quality, product price, brand
loyalty), and consumer behaviors (willingness to pay more for an item,
willingness to drop off e-waste). Descriptive research would explore
relationships between nonmanipulated variables and phenomena, or existing
problems, with the intent of providing a potential solution (Adu-Agyem,
Sabutey, & Emmanuel, 2013). Descriptive research methods explored the
phenomenon under present conditions, without modifying the variables
under study (Redmond, 2010).

In the current study, consumer perception factors of product quality;
perceived value; and brand loyalty, as defined by Chen (2008a) in his 2008
model, were under consideration. Demographic data analyzed in this study
included general consumer information such as age and gender. Consumer
perception factors and demographics were part of the collection process of
the online sample survey of adult consumers.
Transition
Researchers indicated that consumers were becoming more
environmentally conscious than ever before as information about the
scarcity of natural resources increasingly entered the public discourse.
Consequently, companies are starting to price and manufacture products for
emerging market with environmentally conscience consumers in mind.
With their empirical research, researchers had clearly demonstrated the
importance of pricing in consumers’ decision-making behavior; however,
there is a paucity of literature on the relationship between environmental
factors and pricing, quality, brand loyalty, and the relationship between
understanding how eco-friendly products affect the environment and
consumers’ willingness to pay more for them.

The purpose of this quantitative correlational study was to describe
consumer behavior related to eco-friendly products and determine if a
relationship existed between consumer perceptions and behaviors regarding
eco-friendly products. Results from the current investigation might
contribute to the field of business practice by increasing the understanding
of product manufacturers and by providing information on the strength of
the relationship between price and a product’s environmental impact and its
effect on consumer behavior. The results from this study might also
contribute to social change by encouraging product manufacturers to better
price their environmentally friendly products in order to sell more, which in
return could create more social benefits for the community by reducing e-
waste. The results of the current investigation might also provide relevant
information to consumers who are willing to pay more for a product that has
fewer negative environmental consequences.
Section 2 of the study describes the research method chosen for this
study. The section provides information on the sampling technique used;
the role of the researcher; a discussion of the data collection, the instrument
used for data collection, and its reliability and validity; and, finally, the data
analysis.

Section 3 of the study presents the findings of the (data analysis; a
discussion of the applications to professional practice, the implications for
social change, recommendations for actions and further study, and
reflections). Section 3 ends with a summary of the findings and
conclusions.
Section 2: The Project
Purpose Statement
The purpose of this quantitative study was to examine the relationship
between the high level of e-waste and the consumer’s preference for eco-
friendly products and provide business managers with the information they
need to develop advertising and pricing strategies. The geographical
location for this study was central Florida. A convenience sample of
randomly selected registered members of SurveyMonkey who were
currently attending the University of South Florida participated in the
research by completing an online survey hosted by SurveyMonkey. The
researcher-designed questionnaire assessed consumer demographics (gender
and age), the consumers’ product perception (i.e., consumers’ views on eco-
friendly products, using the dependent variables price, quality, and brand

loyalty), and consumer behaviors (using the independent variables
willingness to pay more for eco-friendly products and willingness to recycle
e-waste at drop-off recycling centers).
With inferential data analysis, I used correlation and regression
analysis to determine the extent of the relationships among consumer
perceptions, consumer behaviors, and demographic variables. Information
gained through this research should provide business managers with greater
insights into the consumers’ views regarding ecofriendly products, their
willingness to reduce e-waste, and their willingness to pay more for eco-
friendly products. The findings of this study could bring about positive
social change by encouraging product manufacturers to produce more
environmentally friendly products than environmentally harmful ones. This
will lead to a reduction in e-waste by providing incentives for the
proliferation of products with a low environmental liability rating in
preference to products with high environmental liability.
Role of the Researcher
Researchers (as citied in Smith, Wright, and Breakwell, 2011 and
Komesaroff, 2012) actively anticipate and address each ethical dilemma that
might occur at every stage of their research. A researcher must ensure that

the sources of data used in the study are reliable and that the data analysis
and interpretations are ethical. To that end, the researchers must make every
effort to maintain the integrity of the data and the protection of study
participants and their rights.
Prior to inviting subjects to participate, I obtained approval to conduct
the study from the Internal Review Board (IRB) of Walden University. This
approval was contingent upon my appropriate and adequate description of
the research process, including participant identification, invitation to
participate, informed consent, data collection, data analysis, and data
management procedures. After extending the invitation to participate in the
study (Appendix B), I had no plans for interacting with the subjects, unless
they contacted me for additional information about the study. As the
researcher, I assured the participants that their anonymity and online data
would be password protected and accessed only by me. Further, as the
researcher, I would not be a member of the staff of their university or have
any affiliation with this university or with potential research participants. I
chose the University of South Florida for conducting this study based on the
size of the student body and its geographical location. As indicated in the
invitation, after completion of the study and upon the request of the

participants a final report and summary of descriptive and inferential
statistics and the study’s findings will be available for their review.
Participants
The population consisted of young adults attending the University of South
Florida (USF) in the United States. The average age of students at USF was
23 years (USF college portrait, 2011). According to research by E-Marketer
(2008), a leading marketing group, this age group shows the greatest
tendency to integrate green behavior into their daily lives when compared to
other age groups. The demographic data collected (i.e., age and gender)
helped to explore the salient perceptions of young adults regarding eco-
friendly products. Currently, SurveyMonkey has 600 USF students
registered.
Approximately 381 students received an e-mail invitation to participate (see
Appendix B) out of the 600 USF college students who registered with the
SurveyMonkey Contributor Member database subgroup. The Tabachnick
and Fidell (2007) formula was used as the sample calculator to test for the
minimum number of participants to complete this study. The Tabachnick
and Fidell (2007) formula for sample size is 50 + 8(m), where m=# of
predictor variables. There are three independent variables attached to this

study i.e. price, quality and brand loyalty. Therefore, the sample size
calculation 50 + 8
(3) = 74 a minimum of participants. I was fortunate to have a sample
population of 381. This represents the population of 47,214 potential
participants residing on the USF campus.
In the event that not enough of the SurveyMonkey Contributor
Members responded positively to the invitation to participate in the study, a
plan was in place for contacting the USF student body to gather more
participants. Potential participants received an informed-consent form
together with information about the study (see Appendix B); they had to
give their consent by completing the online consent form before they could
participate in the survey. The online survey enabled gathering data from a
large group inexpensively. The survey was a workable way to assemble a
sufficiently large pool of subjects for addressing the hypotheses (Amponsah-
Tawiah, Dartey-Baah, & Ametorwo, 2012); the survey is an
environmentally friendly, paperless method (McPeake, Bateson, & O'Neill,
2014) and provided a faster response rate than other methods such as

telephone interviews or in-person interviews (Kaplowitz, Lupi, Couper, &
Thorp, 2012; Novick et al., 2011).
The method of participant selection was nonprobability convenience
sampling (Kakinami & Conner, 2010) of a target population at USF.
Researchers often use convenience sampling when it is the only way to gain
access to certain groups such as such as marijuana users (Hathaway et al.,
2010) or incarcerated youth (Abrams, 2010). Such samples might have to
satisfy additional IRB requirements because they are in protected groups.
Convenience sampling in the current study facilitated recruitment of a
sample large enough to perform data analysis.
Research Method and Design
Research Method
The three methodological approaches to conducting research are
quantitative, qualitative methods and mixed method. (Marczyk, DeMatteo,
& Festinger, 2010). In qualitative research, one could explore attitudes,
behaviors, and experiences with the use of such methods as interviews or
focus groups (Church & Ekberg, 2013). The yield of qualitative research
consists of in-depth opinions from the participants who usually number far
fewer than in quantitative studies, but the contact with the former tends to

last much longer (Chen & Macredie, 2010). By contrast, in quantitative
research, one can quantify attitudes and behaviors or measure variables
(Jandaghi & Matin, 2011). Unlike qualitative research, quantitative research
uses measurable data that rely, facts, and patterns. The quantitative
approach was best suited for this study because I intended to obtain data
from a large sample via questionnaires assessing consumer behaviors and
perceptions using numerical data. I also planned to use statistical means to
quantify, measure, and analyze the data and express the results numerically.
Quantitative methodology also allowed me to test multiple variables of
costumer behavior reported by the sample to determine which variables have
a significant effect on e-waste reduction.
Chen and Chai (2010) distributed 200 questionnaires to undergraduate
students at a major private university in Malaysia to assess their attitudes
toward the environment and green products and to measure the relationship
between attitude toward the environment and the use of green products.
Results indicated that there was no difference according to gender in the
students’ attitude toward the environment and their use of green products.
One important finding through multiple linear regression analysis was that
how consumers view both the government’s role and their personal norms

toward the environment contributed significantly to their attitude on
purchasing green products and recycling e-waste.
Lee (2011) described how researchers such as Laroche used a
conceptual framework that considered many factors such as demographics,
knowledge, values, attitudes, and behavior that influence consumers’
willingness to pay more for environmentally friendly products. Laroche (as
cited in Lee, 2011) disseminated 2,387 questionnaires to selected household
in a North American city. The questionnaires included Likert scales and
measured participant responses to several questions. The first part of the
survey collected demographic information (i.e., gender and age), the second
part measured consumer attitudes toward a variety of topics related to the
environment, and the last part measured behaviors of the respondents toward
the environment. One significant finding was that values played an
important role in the consumers’ willingness to spend more for green
products.
A mixed method was not appropriate for this study since there was
insufficient time to explore the qualitative rationale for the respondents’
responses.

Research Design
In the current study, I used a quantitative design. Smith et al. (2011)
and Komesaroff (2012) explained that quantitative research designs fit two
basic types: experimental and nonexperimental designs. Nonexperimental
designs consist of descriptive research and correlational studies, whereas
experimental designs include experiments and causal-comparative or quasi-
experimental research.
The first design, descriptive research, is to determine and describe the
status of an identified variable. Descriptive research involved the gathering
of data that describe events, and then the data collection organization,
tabulated, depicted, and described (Graney, Martínez, Missall, & Aricak,
2010). Tom and Eves (1999) provided an example of this type of
descriptive research, where 120 pairs of advertisements were collected to
test whether they used rhetorical figures. The researchers found that 45% of
the advertisement had used some form of rhetorical figures. The conclusion
was that advertisements that used rhetorical figures performed better in
terms of recall and persuasion than advertisements that did not.
The second design, and the method used in this study is correlational
research. A study qualifies as nonexperimental and correlational if the data

lend themselves only to interpretations about the degree to which certain
things tend to co-occur or relate to each other. Chang and Zauszniewski
(2011) used a nonexperimental, cross-sectional, correlational design to
examine the interrelationships among a situational factor (maternal
depression), learned resourcefulness (LR), and target behaviors (depression
and adaptive functioning in school-aged children). The major advantage of
a correlational design in this study was that the collected data were easy to
interpret. The major disadvantage of the correlational designs was that the
reason for the associations discovered was unclear. As the purpose of the
current study was to gather information on the relationships among
consumer perceptions, consumer behaviors, and demographic variables, the
correlational design was appropriate.
The third design, experimental research, is an attempt to maintain
control over all factors that might affect the results of an experiment. In
doing so, the researcher attempts to determine or predict what might occur
(Li, Hung, & Tangpong, 2012). Some of the steps involved in experimental
research are identifying and defining the problem, formulating hypotheses
and deducing the consequences, constructing an experimental design that

represents all the elements, conducting the experiment, compiling raw data
and reducing it to usable forms, and applying an appropriate test of
significance. Some of the advantages of this method are researcher control
over the variables by determining the ideal population for achieving clear
results (Weathington, Cunningham, & Pittenger, 2012). Some of the
disadvantages of this method are potential personal bias of the researcher,
the sample might not be representative, and the results might apply only to
one situation and might be difficult to replicate (Weathington et al., 2012).
Gruppen (2008) who examined the dispersion of airborne infectious viruses
and the development of brain pathology because of exposure conducted an
example of this type of research.
The researcher used lab rats to perform this study and controlled all the
variables.
The fourth design, causal-comparative or quasi-experimental
methodology, identifies cause-and-effect relationships between independent
and dependent variables
(Smith et al., 2011). D’Onofri, Lahey, Lichtenstein, and Turkheimer (2013)
conducted an example of this type of research. The researchers explored
how genetic and biological influences, environmental risks, and behavior act

and interact across development to result in psychological and physical
health problems. The researchers were able to show, by examining past
studies, that a need existed for more quasi-experimental studies to further
the understanding of the true causes of human health and development.
Population and Sampling
The focus of this study was to describe self-reported consumer
behaviors related to eco-friendly products to determine if a relationship
exists between consumers’ perceptions related to eco-friendly products and
their willingness to pay more for such products. The survey target audience
was USF Students between the ages of 18 and 24 years from the
SurveyMonkey database of respondents. According to E-Marketer (2008)
research, this demographic had the greatest tendency to integrate green
behavior into their daily lives when compared to other age groups. As
reported in the University of
South Florida Fact Book, the total student population for the 2011 academic
year was
47,214 (USF System, 2011), and of those students, 600 were registered in
the
SurveyMonkey database.

Eligibility criteria for participating in this study required that the
respondent be a student at USF, between 18 and 24 years of age, a registered
user of SurveyMonkey, and live in the United States. Of the entire 600 USF
student population registered on the SurveyMonkey database, I invited 381
potential participants. The only exclusion criterion used specified age, in
that participants had to belong to the 18 to 24 year age range.
Ethical Research
To protect the participants’ rights I addressed a number of ethical
considerations throughout the research process. All potential respondents
received an invitation, Informing them about the purpose of the study,
requirements for participation, and the rules for completing the survey. By
signing the consent document, the participant acknowledged his or her
voluntary participation in this study (see Appendix B). In the consent
document, I informed the respondents that they could withdraw from the
study at any time by exiting from the survey or by not submitting their
responses at the end of the survey.
I assured the respondents about complete confidentiality and
anonymity and that I would not use any identifying information anywhere
on the completed survey. The researcher would be the only person to know

the identities of the participants and the responses to the questionnaires. As
an added measure of security, I converted the names of survey respondents
to Participant 1 (P1), Participant 2 (P2), and so forth. These generalized
categories provided enough information without compromising the
respondents’ privacy. Respondents received a small financial incentive
through
SurveyMonkey upon the successful completion of their questionnaires.
All online information regarding potential participants is stored in a
passwordprotected electronic folder and accessible only to the researcher.
Data deletion will take place 5 years after the completion of the study with
the use of a freeware program called CyberShredder. The SurveyMonkey
research profile removal will take place after the study to guard against any
misuse of the participants’ information.
Data Collection
Data Collection Instruments
I developed a survey for data collection (see Appendix A). Existing
measurement instruments were not appropriate for this study, and
customized instruments by variables were different from study to study.
Therefore, for this study a new instrument was developed.

Before launching the data collection, I performed a pilot survey to
ensure the validity of the questionnaire. Five participants received the
questionnaire via e-mail from SurveyMonkey.com to make sure that the
participants clear and readily answered the questions. The results from the
pilot survey ensured instrument validity. The questions’ purpose was to
examine consumer perspectives on product price, product quality, and brand
loyalty, as well as self-reported consumer behavior of paying more for an
item and willingness to drop off e-waste. Also collected were demographic
variables (i.e., age and gender). With the pilot study, I also wanted to make
sure that the survey was comprehensive and had a high level of content
validity. High content validity was a necessary attribute of the questionnaire
survey in this study. Each survey question corresponds to one of the study
variables and the research questions. The rating scale for each question
indicates a respondent’s level of agreement or disagreement with the
statement. For example, the response to Question 4 on the survey (“I have
used green products before”) would yield a score from 1- 5. This score
became the data for data analysis of the applicable variable. A score of 1
would indicate a low level of agreement, whereas a score of 5 would
indicate a high level of agreement.

Data Collection Techniques
Study variables and questionnaire items. The purpose of the study
was to evaluate relationships among consumer perspectives on product
price, product quality, and brand loyalty; consumer behaviors of paying
more for an item and willingness to drop off e-waste at drop-off centers; and
demographic variables of age and gender. To that end, a researcher-
developed questionnaire assessed respondents’ perceptions, behaviors, and
demographic variables.
Product price perspectives. The two survey questions used in this
research helped to elevate participants’ perspectives on price. Survey
questions pertaining to price perceptions were Questions 5 and 8.
Responses to these items would be in the form of a 5-point Likert-type scale
where 1 = never, and 5 = always. The calculation score will be the total for
the responses of the two questions and the total product price perspective.
Product quality perspectives. The three survey questions used in
this research helped to elevate participant’s perspectives on quality. Survey
questions pertaining to product quality perceptions were Questions 9, 10,
and 11. Responses to these items would be in the form of a 5-point Likert-
type scale where 1 = strongly disagree, and 5 = strongly agree. The

calculation score will be the total responses of the three questions and the
total product price perspective.
Perceptions on brand loyalty. The four survey questions used in
this research helped to elevate participant’s perspectives on brand loyalty.
Survey questions pertaining brand loyalty perceptions were Questions 12,
13, and 14. Responses to these items will be in the form of a 5-point Likert-
type scale where 1 = strongly disagree, and 5 =
strongly agree. The calculation score would be the total responses of the
four questions and the total product price perspective.
Consumer behaviors. I used survey questions to measure
consumers’ selfreported behaviors of willingness to pay more for a green
items and willingness to recycle e-waste. The survey question used to
enquire about willingness to pay more for green products was Question 6.
Responses to this item will be in the form of a 5-point Likert-type scale
where 1 = never, and 5 = always. For Question 6, 1 = strongly disagree, and
5 = strongly agree. The calculation score will be the total responses of the
10 questions and the total product price perspective.
Questions 18 on the survey inquired about willingness to recycle e-
waste. Responses to this item will be in the form of a 5-point Likert-type

scale where 1 = never, and 5 = always. The calculation score will be the
total responses to Question 18 and the total product price perspective.
Following approval by the IRB of Walden University, I sent an e-mail
invitation to the target sample of 381 randomly selected potential USF
participants registered with SurveyMonkey (see Appendix B). The
participants first had to agree to the informedconsent conditions (Faden,
Beauchamp, & Kass, 2014), and then they would move onto the survey link.
Participation was voluntary, and subjects could quit the study at any time.
The participants did not need to provide any identifying information.
Measuring the first three items of the survey established a relationship
among product price, product quality, and brand loyalty and labeled a
measure either as effective or ineffective. A product price was effective if
the price of the product inspired the consumer to pay more for an item and
drop it off at an e-waste drop-off station at the end of its usefulness. Once a
consumer deemed a product effective or ineffective, I conducted a
correlation analysis to determine if the remaining survey items had a
positive correlation with the consumer behaviors of paying more for an item
and willingness to drop off e-waste. The collection and validity test data

from the pilot survey were able to measure the internal consistency for each
question in the survey.
After obtaining IBR approval, I conducted the pilot study began. The
pilot study participants had 2 weeks to submit their comments for analysis
and validation of the research questions. After the completion of the pilot
study, the online survey participants also had 2 weeks to respond to the
survey. When the survey responses did not reach the set target number
within 2 weeks, I sent a reminder e-mail to the invited participants. The
survey closed when 381 respondents had taken the survey; then, the data
collected with SurveyMonkey went to the Statistical Package for the Social
Sciences (SPSS) for analysis. A summary of the analysis of raw data is
available Section 3.
Data Organization Technique
Following receiving approval from IRB, I distributed an e-mail
invitation targeting 381 randomly selected potential participants from
SurveyMonkey. The SurveyMonkey (2013) website reported that more than
30 million unique subjects responded to SurveyMonkey surveys each
month. This online resource collected information from a large group of
participants in a relatively short period about purchasing habits.

The SurveyMonkey Contributor Member database consisted of 30
million members. The selection of participants was from SurveyMonkey
Contributor Member database, for a target sample of 381 participants. The
participants knew that they could stop their participation at any time; they
provided their answers on a voluntary basis. I kept the responses
confidential, and the participants remained anonymous. I analyzed the
collected data using SPSS software (Appendix A).
Data Analysis
I used SurveyMonkey for data collection in this quantitative study.
Access to the survey on the SurveyMonkey website is password protected.
As the researcher, I was the only one able to check on the number of
responders and review their responses. Once the participants had completed
the survey, the responses went from SurveyMonkey to the SPSS software
for analysis. I ensured that the SPSS data file would take each subject’s
scores on each of the 19 survey questions, and I then analyzed the results.
I used SPSS Version 17 to perform data organization, analysis,
calculated, and reported descriptive and inferential results. Descriptive
statistics included the means, standard deviations, and the ranges of
variables (i.e., responses to each question). I used

Spearman correlation coefficients for RQs 1-6 and multiple regressions
models for RQs 7-8 to analyze and evaluate the data and to answer the
research questions.
To evaluate the answers to Research Question 1, I used Spearman
correlation analysis to analyze the relationship between the total product
quality score and willingness to recycle e-waste at drop-off recycling
facilities. To evaluate answers to
Research Question 2, I calculated the Spearman correlation score using the
total product price perception scores and willingness to recycle e-waste at a
drop-off recycling facilities. To evaluate answers to Research Question 3, I
calculated the Spearman correlation coefficient to analyze the correlations
between the total brand loyalty scores and willingness to recycle e-waste at a
drop-off recycling facility scores. To evaluate answers to Research
Question 4, I calculated the Spearman correlation to analyze the relationship
between the product quality scores and willingness to pay more for a green
product. To evaluate answers to Research Question 5, I calculated the
Spearman correlation to analyze the relationship between total product price
perception scores and willingness to pay more for a green product. To
evaluate Research Question 6, I calculated the Spearman correlation to

analyze the relationship between total brand loyalty scores and willingness
to pay more for a green product. To evaluate answers to Research Question
7, I conducted a multiple regression analysis using age and gender as
predictor variables and customer willingness to pay more for green products
and customer willingness to recycle e-waste at drop-off recycling facilities
as criterion variables. Finally, to evaluate answers to Research Question 8, I
conducted a multiple regression using e-waste as the predictor variable and
eco-friendly product purchasing as criterion variable.
Reliability and Validity
Reliability
I used Cronbach’s alpha to test the internal consistency of the survey
instrument for the subject population. There are four general classes of
reliability estimates. Firstly, Inter-
Rater or Inter-Observer Reliability, assesses the degree to which different
raters/observers, gives consistent estimates of the same phenomenon.
Secondly, TestRetest Reliability assesses the consistency of a measure from
one time to another. Thirdly, the Parallel-Forms Reliability assesses the
consistency of the results of two tests constructed in the same way from the
same content domain. Finally, Internal Consistency Reliability assesses the

consistency of results across items within an instrument. Internal
consistency reliability assesses the reliability of the summation scale and
several items from a total score (Kurtz, McCrae, Terracciano and Yamagata,
2010). Some of the tests used to calculate these results are the Average
Inter-item Correlation, Average Item total Correlation, Split-Half
Reliability, and Cronbach's Alpha. Cronbach’s alpha tests the inter-item
reliability of the survey questions to examine their relationship to each other.
The coefficient alpha measures the degree to which the questions examine
the same core constructs. Cronbach’s alpha values measure between 0 and
1, where the acceptable values of alpha ranges from 0.70 to 0.95 (Dennick &
Tavakol, 2011. The
Cronbach’s alpha value for this study was 0.685. Cronbach’s alpha value
means that the survey questions were adequate per the internal consistency
reliability coefficient. One of the means for ensuring the validity and
reliability was to assure each respondent could only take the survey once.
The survey questions were the same for all respondents, and the survey
remained opened for 2 weeks to ensure that respondents’ experience was
consistent.

Validity
There are two types of study-centric validity, internal validity, and
external validity (Thomas, Nelson, Silverman, & Silverman, 2010). Internal
validity refers to both how well a study is being conducted (research design,
operational definitions used, the measurement of variables, what is being
measured, among other considerations) and how confidently one might
conclude that the observed effect(s) are attributable to the independent
variable and not some extraneous ones (Kidd & Morgan, 2010). External
validity represents the extent to which a study's results can apply to other
people or settings (Thomas et al., 2010).
I used the online survey instrument to determine the relationships
among consumer perspectives, consumer behavior, and demographic
variables, and claim no causality between the study’s variables. The use of
an online survey allowed for wide selection of candidates from University of
South Florida.
Applying my knowledge of the green industry and the geographical
region, I ensured that all of the necessary, fundamental elements of the
survey applied. Additionally, the distribution of the pilot survey to five
participants not associated with the study enabled me to examine the clarity

of the measurement instrument (i.e., the survey. The purpose for the pilot
study was to ensure that the instrument was clear, comprehensible, and easy
to understand. If the results of the pilot study had revealed some question
clarity issues, I would have applied corrective measures to all such issues,
before using the questionnaire in the main data collection stage.
I used a non-parametric method for data analysis, which does not
require parametric assumptions because interval data conversion to rank-
ordered data. The Spearman's rank correlation provides a distribution free
test of independence between two variables. This method helps to improve
validity in the study since handling rankordered data is one of the strengths
of non-parametric tests.
Transition and Summary
The purpose of the current investigation was to examine the
relationship among consumer perspectives and consumer behaviors such as
willingness to pay more for ecofriendly products. In order to explore this
information, I used a quantitative, nonexperimental, correlational design.
The results of this research will contribute to the business practice
literature with an increased understanding of the strength and nature of the

relationship between customers’ preferences and their willingness to pay
more for eco-friendly products. The results of the investigation might be
relevant for researchers, product manufacturers, and consumers. The
information garnered from the study might serve as an impetus for social
change by encouraging product manufacturers to address the environmental
concerns of environmentally conscious consumers. The information gained
from this study might also create some social benefits for communities in
which certain companies are operating by leading to an eventual reduction
in e-waste through proper disposal of electronic waste. Included in this
section was information about the (research method and design of the study,
population and sampling technique, instrument, data collection and data
analysis procedures, and the role of the researcher). I discussed the
appropriateness and justification of the research method chosen, along with
the research questions.
Section 3 presents the findings of the (data analysis; a discussion of
the applications to professional practice, the implications for social change,
recommendations for actions and further study, and reflections). Section 3
ends with a summary of the findings and conclusions.

Section 3: Application to Professional Practice and Implications for
Change
Introduction
The purpose of this quantitative correlational study was to examine
the relationships among demographic variables (gender and age), consumer
perspectives, and consumer behavior. The research questions and
hypotheses were put forth to examine consumers’ views on eco-friendly
product quality, eco-friendly product price, and ecofriendly product brand
loyalty as they relate to consumers’ willingness to pay more for
green products and willingness to recycle e-waste at drop-off recycling
facilities.
This section provides a restatement of the research questions and
hypotheses and an explanation of the statistical methods employed, namely,
the Spearman correlation coefficient to measure the strength of the
association between ranked variables and ordinal regression to examine the
customer behavior relationships of interest. Provided in this section is a
detailed description of the results of the study, including the (presentation of
finding, application of the finding to professional practice, implications for
social change, recommendations for action and further research, and a

reflection of the researcher’s experience with this topic). The section ends
with a summary and conclusion.
Research Questions and Hypotheses
Research Questions
The following eight research questions were guiding the study:
RQ1: To what extent does eco-friendly product quality relate to
customer willingness to recycle e-waste at drop-off recycling facilities?
RQ2: To what extent does eco-friendly product price relate to
customer willingness to recycle e-waste at drop-off recycling facilities?
RQ3: To what extent does eco-friendly product brand loyalty relate to
customer willingness to recycle e-waste at drop-off recycling facilities?
RQ4: To what extent does eco-friendly product quality relate to
customer willingness to pay more for green products?
RQ5: To what extent does eco-friendly product price relate to
customer willingness to pay more for green products?
RQ6: To what extent does eco-friendly product brand loyalty relate to
customer willingness to pay more for green products?

RQ7: To what extent do gender and age differences relate to customer
willingness to pay more for green products?
RQ8: To what extent is a relationship extant between e-waste and eco-
friendly product purchasing?
Hypotheses
In this study, I used the significance value of less than 0.05 to reject
any of the following null hypotheses addressing the research questions.
Ho1: There is no significant statistical relationship between eco-
friendly product quality and customer willingness to recycle e-waste at drop-
off recycling facilities.
Ha1: A significant statistical relationship exists between eco-friendly
product quality and customer willingness to recycle e-waste at drop-off
recycling facilities.
Ho2: There is no significant statistical relationship between eco-
friendly product price and customer willingness to recycle e-waste at drop-
off recycling facilities.
Ha2: A significant statistical relationship exists between eco-friendly
product price and customer willingness to recycle e-waste at drop-off
recycling facilities.

Ho3: There is no significant statistical relationship between eco-
friendly product brand loyalty and customer willingness to recycle e-waste
at drop-off recycling facilities.
Ha3: A significant statistical relationship exists between eco-friendly
product brand loyalty and customer willingness to recycle e-waste at drop-
off recycling facilities.
Ho4: There is no significant statistical relationship between eco-
friendly product quality and customer willingness to pay more for green
products.
Ha4: A significant statistical relationship exists between eco-friendly
product quality and customer willingness to pay more for green products.
Ho5: There is no significant statistical relationship between eco-
friendly product price and customer willingness to pay more for green
products.
Ha5: A significant statistical relationship exists between eco-friendly
product price and customer willingness to pay more for green products.
Ho6: There is no significant statistical relationship between eco-
friendly product brand loyalty and customer willingness to pay more for
green products.

Ha6: A significant statistical relationship exists between eco-friendly
product brand loyalty and customer willingness to pay more for green
products.
Ho7: There is no significant statistical relationship between gender,
age, and customer willingness to pay more for green products.
Ha7: A significant statistical relationship exists between gender, age,
and customer willingness to pay more for green products.
Ho8: There is no significant statistical relationship between e-waste
recycling, income, and age.
Ha8: A significant statistical relationship exists between e-waste
recycling, income, and age.
The research findings indicated that price was not the primary factor why
people were unwilling to pay more for green products or recycle e-waste at
drop-off recycling facilities. Brand loyalty and brand awareness played a
major role in consumer willingness to recycle e-waste at drop-off recycling
facilities and the consumers’ willingness to pay more for green products.
The next heading contains a detailed presentation of the findings.
Presentation of Findings

Pearson’s Versus Spearman’s Coefficient
The total number of respondents in this study was 313. Pearson’s
correlation coefficient measures the linear relationship between two
normally distributed variables, that is, the line of best fit, whereas
Spearman's correlation measures the relative rank order of the points. The
selection chosen was Spearman's correlation, in preference over Pearson’s
because Spearman’s correlation coefficient does not require any
assumptions about the frequency distribution of the two variables.
Specifically, the variables reflect ordinal data and the calculation of
Spearman’s correlation results do not assume that the relationship between
the variables is linear (Lund, 2013).
Spearman’s correlation coefficient is a statistical measure of the
strength of a monotonic relationship between two variables. If the value of
one variable increases, so does the value of the other variable, or,
conversely, as the value of one variable increases, the value of the other
variable decreases. Spearman's rank correlation coefficient, or Spearman's
rho, denoted by the Greek letter ρ (rho), or as rs, which is a nonparametric
measure of statistical dependence between two variables. One can verbally

describe the strength of the correlation using the following guide for the
absolute value of rs where
0.00-0.19 expresses a very weak relationship, 0.20-0.39 expresses a weak
relationship, 0.40-0.59 expresses a moderate relationship, 0.60-0.79
expresses a strong relationship, and 0.80-1.0 expresses a very strong
relationship (Lund, 2013).
Consideration 1: Customer Willingness to Recycle e-Waste at Drop-Off
Recycling Facilities
Research Question 1. To what extent does eco-friendly product
quality relate to customer willingness to recycle e-waste at drop-off
recycling facilities?
Research Question 1 addressed respondent views on products
reliability and assessed whether respondent would keep or recycle a product
based on the available of having recycling facilities. This question’s aim
was to capture the buying and recycling habit of respondents. The two
survey items related to Research Question 1 were:
Item 15: I recycle electronic devices or e-waste (products such as
computers, televisions, VCRs, stereos, copiers, fax machines, and
cellular phones) as opposed to discarding them as trash.

Item 18: I would buy and recycle electronic devices if more drop-off
recycling facilities were available in my area.
This research question addresses how likely, based on quality, customers
recycle devices and if they consider using a local drop-off recycling facility.
To answer Research
Question 1, I tested the following hypotheses:
Ho1: There is no significant statistical relationship between eco-
friendly product quality and customer willingness to recycle e-waste at drop-
off recycling facilities.
Ha1: A significant statistical relationship exists between eco-friendly
product quality and customer willingness to recycle e-waste at drop-off
recycling facilities.
Table 1 shows the results of the Spearman’s correlation test for
customer willingness to recycle e-waste at drop-off recycling facilities and
eco-friendly product quality. Product quality is defined through two
primary dimensions, product features (e.g., e-friendly) and the products that
are reflecting the intended features. Research Question 1 addresses
respondent views on products quality/reliability and assess whether
respondent would keep, get rid or recycle a product based its value at a

recycling facilities. The aim is to capture the buying and recycling habit of
respondents when it comes to assessing the quality of a product.
Table 1.
Spearman’s Correlation Test for Customer Willingness to Recycle e-Waste
at Drop-Off
Recycling Facilities and Eco-Friendly Product Quality
Questions from the Questionnaire
I recycle
electronic
devices or
e-waste
(products
such as
computers,
televisions,
VCRs,
stereos,
copies, fax
machines,
cellular
phones as
opposed to
discarding
them as
trash).
I would
buy and
recycle
electronic
devices if
more drop-
off
recycling
facilities
were
available
in my area.
Spearman'
s ρ
I recycle electronic
devices or e-waste
(products such as
computers,
Correlation
Coefficient
Sig.
(2-tailed)
1
.
-.213*
0

televisions, VCRs,
stereos, copies, fax
machines, cellular
phones as opposed to
discarding them as
trash).
N 313 313
I would buy and
recycle electronic
devices if more drop-
off recycling facilities
were available in my
area.
Correlation
Coefficient
Sig.
(2tailed)
-.213*
0
1
.
N 313 313
Note. *I tested the correlation at the significance level of 0.05.
Per the values in the table above rs = -.213, n = 313
Because the calculated significance was less than 0.05 or 1.437E-4, I
rejected the null hypothesis (Ho1). The rejected hypothesis stated that there
is no significant statistical relationship between eco-friendly product quality
and customer willingness to recycle e-waste at drop-off recycling facilities.
Quality did not have a positive correlation with customer willingness
to recycle ewaste at drop-off recycling facilities and this could be the
strength expressed by this variable, that is, product quality. Product quality
and reliability have steadily improved over the years; Energy Star-qualified

refrigerators currently last longer than they did 5 years ago. Refrigerators
that were sold in 2010 are 20% - 30% more energy efficient than
nonqualified refrigerators and, at least, 40% more energy efficient than
nonqualified refrigerators sold in 2001 (General Electric, 2014). The change
in quality of the product has allowed consumers to keep products longer and
delay recycling.
Research Question 2. To what extent does eco-friendly product
price relate to customer willingness to recycle e-waste at drop-off recycling
facilities?
The two survey items related to Research Question 2 were:
Item 16: I would start recycling electronic devices if I received a
financial incentive for doing so.
Item 17: If I had the choice of discarding an old electronic device I
would use a drop-off recycle facilities.
This research question asked would consumers use the local drop-off
recycle facilities if product pricing that included a financial incentive is
available. To answer Research Question 2, I tested the following
hypotheses.

Ho2: There is no significant statistical relationship between eco-
friendly product price and customer willingness to recycle e-waste at drop-
off recycling facilities.
Ha2: A significant statistical relationship exists between eco-
friendly product price and customer willingness to recycle e-waste at
drop-off recycling facilities. Table 2 shows the results of the Spearman’s
correlation test for customer willingness to recycle e-waste at drop-off
recycling facilities and eco-friendly product price.
Table 2.
Spearman’s Correlation Test for Customer Willingness to Recycle e-Waste
at Drop-Off
Recycling Facilities and Eco-Friendly Product Price
Questions from the Questionnaire
I would start recycling
electronic devices If I had the
choice of if I receive a
discarding an old
electronic financial incentive
device I would use a dropfor
doing so. off recycling
facilities.
Spearman's I would start recycling 1.000 .166*

Correlation Coefficient ρ electronic devices
if I receive a Sig. (2-tailed)
financial incentive for doing
N
so.
. .003
313 313
If I had the choice of Correlation
Coefficient discarding an old
electronic
Sig. (2-tailed)
device I would use a drop-off
N
recycling facilities.
.166* 1.000
.003 .
313 313
Note. * I tested the correlation at the significance level of 0.05.
rs = .166, n = 313
Because the calculated significance was less than 0.05 r (0.0032), I
rejected the null hypothesis (Ho2). The rejected hypothesis stated that there
is no significant statistical relationship between eco-friendly product price
and customer willingness to recycle e-waste at drop-off recycling facilities.
Product price correlating with customer willingness to recycle e-waste
at drop-off recycling facilities might be due to the existence of a secondary
market. Wang, Zhang, Yin, and Zhang (2011) found two factors that could
affect recycling styles: economic benefit and convenience. The authors

showed that reclaiming by peddlers played a major role in e-waste recycling
in Beijing because the price offered for e-waste was much higher and onsite
services were convenient. Similarly, reused cell phones in the United States
are at 65%, and the buy-back price can range from a few dollars to $40 or
$50, depending on the model of the phone (Geyer & Blass, 2010). Most
consumers can easily sell their old phones, rather than recycle them.
Research Question 3. To what extent does eco-friendly product
brand loyalty relate to customer willingness to recycle e-waste at drop-off
recycling facilities?
The survey items related to Research Question 3 were:
Item 18: I would buy and recycle electronic devices if more drop-off
recycling facilities were available in my area.
Item 19: I would buy and recycle electronic devices if there were an
awareness campaign in my area about the dangers of not recycling.
This research question addressed the relationship between consumers'
awareness of the dangers of not recycling and consumers’ likelihood to use
local drop-off recycles facilities. Awareness campaign about the dangers of
not recycling helps to encourage consumer to purchase more products eco-
friendly products. To answer Research

Question 3, I tested the following hypotheses:
Ho3: There is no significant statistical relationship between eco-
friendly product brand loyalty and customer willingness to recycle e-waste
at drop-off recycling facilities.
Ha3: A significant statistical relationship exists between eco-friendly
product brand loyalty and customer willingness to recycle e-waste at drop-
off recycling facilities.
Table 3 shows the results of the Spearman’s correlation test of customer
willingness to recycle e-waste at drop-off recycling facilities and eco-
Friendly product brand loyalty. With a recycling awareness campaign,
managers could promote responsible habits from respondents to use
recycling facilities when products have reached the end of their useful
life.
Table 3.
Spearman’s Correlation Test of Customer Willingness to Recycle e-Waste at
Drop-Off Recycling Facilities and Eco-Friendly Product Brand Loyalty
Questions from the Questionnaire
I would buy and I
would buy and recycle
electronic recycle

electronic devices if
more devices if there
was drop-off recycling
an awareness facilities
were campaign in my
area available in my
about the dangers
of
area. not recycling
Spearman'
s ρ
I would buy and
recycle electronic
devices if more
dropoff recycling
facilities were
available in my
area.
Correlation
Coefficient
Sig. (2-tailed)
N
1.000
.
313
.537*
.000
313
I would buy and
recycle electronic
devices if there
was an awareness
campaign in my
area about the
dangers of not
recycling
Correlation
Coefficient
Sig. (2-tailed)
N
.537*
.000
313
1.000
.
313
Note. * I tested the correlation at the significance level of 0.05.
rs = .537, n = 313
Because the calculated significance was less than 0.05 (9.569E-25), I
rejected the null hypothesis (Ho3). The rejected hypothesis, which stated
that brand loyalty did not relate to customer willingness to recycle e-waste at
drop-off recycling. Research

Questions 3 addressed respondents’ views on brand loyalty as it related to
customer willingness to recycle e-waste at drop-off recycling facilities. The
questions also addressed whether an awareness campaign would prompt
respondents to start using the ewaste at drop-off recycling facilities. The
results could demonstrate the importance of customer awareness of using
recycling facilities, which is alignment with Wang et al. (2011) findings that
stated that consumers education played an important role in recycling, as did
the convenient location of recycling facilities, both these aspects tended to
enhance public participation in recycling (Wang et al., 2011). Management
of companies should begin programs to start an awareness campaign to
shape consumer behavior. Some managers of management companies have
adopted an Extended Producer Responsibility (EPR) policy. These policies
required manufacturers to finance the cost of recycling or of safely
disposing of products that consumers no longer want. Some businesses
management saw programs that encourage consumers to bring back
products for recycling as opportunities for strengthening brand loyalty (Nash
& Bosso, 2013). For example, Nestlé Waters, a major producer of bottled
water products, recently funded the start-up called Recycling Reinvented, a
new organization dedicated to advocating EPR for packaging (MacKerron,

2012). Other companies’ leaders such as those at Waste Management
Incorporated have lent financial support to organizations’ leaders advancing
EPR policies in the hope that these efforts will generate business for them
(Nash & Bossi, 2013).
Consideration 2: Customer Willingness to Pay More for Green Products
Research Question 4. To what extent does eco-friendly product
quality relate to customer willingness to pay more for green products?
The four survey items related to Research Question 4 were:
Item 6: I am willing to pay more for green products.
Item 9: I believe the quality of green products affects my decision to
purchase.
Item 10: I believe that green products are of better quality than
nongreen products.
Item 11: I would recommend green products based on quality to my
friends.
This research question compared the extent to which the quality of a
green product relates to customers’ willingness to pay more for green
products than for a nongreen product. To answer Research Question 4, I
tested the following hypotheses:

Ho4: There is no significant statistical relationship between eco-
friendly product quality and customer willingness to pay more for green
products.
Ha4: A significant statistical relationship exists between eco-friendly
product quality and customer willingness to pay more for green products.
Table 4 shows the results of the Spearman’s correlation test of customer
willingness to pay more for eco-friendly product quality.
Table 4.
Spearman’s Correlation Test of Customer Willingness to Pay More for Eco-
friendly
Product Quality
Questions from the Questionnaire
I
believe that
green products
are of better I am
willing to quality
than pay more
for nongreen
green products.
products.
I would
I believe the
recommended
quality of green
green
products products
affect my based on
decision to quality
to my purchase.
friends.

Spearman's I am
willing to pay more ρ
for green products.
Correlation
Coefficient
Sig. (2-
tailed)
1.000
.
-.445*
.000
-.327*
.000
-.517*
.000
N 318 318 318 318
I believe that
green
products are
of better
quality than
nongreen
products.
Correlation
Coefficient
Sig. (2-
tailed)
N
-.445*
.000
318
1.000
.
318
.157*
.005
318
.461*
.000
318
I believe the
quality of
green
products
effect my
decision to
purchase.
Correlation
Coefficient
Sig. (2-
tailed)
-.327*
.000
.157*
.005
1.000
.
.392*
.000
N 318 318 318 318
I would recommended
Correlation Coefficient
green products based on
Sig. (2-tailed)
quality to my friends.
-.517*
.000
.461*
.000
.392*
.000
1.000
.
N 318 318 318 318
Note. * I tested the correlation at the significance level of 0.05.

rs = -.445, n = 318 (Item
9) rs = - .327, n = 318
(Item 10) rs = - .517, n =
318 (Item 11) Because
the calculated
significance level was
less than 0.05 (4.9373E-
6, 2.3675E9 and
3.8545E-23)
respectively, I rejected
the null hypothesis
(Ho4), which stated that
there is no significant
statistical relationship
between eco-friendly
product quality and
customer willingness to
pay more for green
products.

Quality might not be much of a concern in consumers’ willingness to
pay more for a green product because consumers might have not developed
a high level of trust in eco-friendly products. Datta (2011) showed that a
high percentage of respondents (82%) would consider buying eco-friendly
products, but only a few (36%) actually trust the quality of the eco-friendly
products. This apparent discrepancy might have been due to the perception
of product performance and hesitation to use eco-friendly products.
Research Question 5. To what extent does eco-friendly product
price relate to customer willingness to pay more for green products?
The three survey items related to Research Question 5 were:
Item 6: I am willing to pay more for green products.
Item 5: I believe that green products are more expensive than
nongreen products. Item 8: I believe the price of green products
affects my decision to purchase them.
This research question compared the extent to which the price of a
green product relates to customer willingness to pay more for green products
than nongreen products.
To answer Research Question 5, I tested the following hypotheses.

Ho5: There is no significant statistical relationship between eco-
friendly products price and customer willingness to pay more for green
products.
Ha5: A significant statistical relationship exists between eco-friendly
product price and customer willingness to pay more for green products.
Table 5 shows the results of the Spearman’s correlation test of customer
willingness to pay more and eco-friendly product based on price.
Table 5.
Spearman’s Correlation Test of Customer Willingness to Pay More and
Eco-Friendly
Product Based on Price
Questions from the Questionnaire
I
believe that green
products are more
I am willing to
expensive than
pay more for
nongreen green
products.
products.
I believe
the price
of green
products
affects
my
decision
to
purchase.
Spearman'
s ρ
I am willing to
pay more for
green products.
Correlation
Coefficient
Sig. (2-tailed)
1.000
-
-.157*
.005
-.271*
.000

N 318 318 318
I believe that
green products
are more
expensive
than nongreen
products.
Correlation
Coefficient
Sig. (2-tailed)
N
-.157*
.005
318
1.000
-
318
.409*
.000
318
I believe the
price of green
products
effect my
decision to
purchase.
Correlation
Coefficient
Sig. (2-tailed)
-.271*
.000
.409*
.000
1.000
-
N 318 318 318
Note. * I tested the correlation at the significance level of 0.05.
rs = -.157, n = -.318
rs=-.271, n =- .381
Because the calculated significance was less than 0.05 (0.005 and
9.1365E-7) respectively, I rejected the null hypothesis (Ho5). The rejected
hypothesis stated that there is no significant statistical relationship between
eco-friendly products price and customer willingness to pay more for green
products.
Customers are willing to pay more for green products because they
are willing to pay a premium for product sustainability as a baseline

condition for consumer products. Doh, Howton, Howton, and Siegel (2010)
showed that management should not ignore sustainability, as it would lead
to negative results. Doh et al. stated that, since social performance is
difficult for investors to track, they rely on expert endorsements from
companies such as the Calvert Group. When the Calvert Group maintained
and endorsed a company, the company’s stock would remain stable.
Research Question 6. To what extent does eco-friendly product
brand loyalty relate to customer willingness to pay more for green products?
The four survey items related to Research Question 6 were:
Item 6: I am willing to pay more for green products.
Item 12: I would switch to green products if they were more available
at my local store.
Item 13: I would switch to green products if they were promotional deals
such as
TV ads and local printed coupons available at my local store.
Item 14: I am more likely to buy a certain product because it has a
brand name I have used in the past.
This research question compared the extent to which brand loyalty to
a green product related to customer willingness to pay more for green

products than for nongreen products. To address Research Question 6, I
tested the following hypotheses.
Ho6: There is no significant statistical relationship between eco-
friendly product brand loyalty and customer willingness to pay more for
green products.
Ha6: A significant statistical relationship exists between eco-friendly
product brand loyalty and customer willingness to pay more for green
products.
Table 6 shows the results of the Spearman’s correlation test for customer
willingness to pay more and eco-friendly products and brand loyalty.

Table 6.
Spearman’s Correlation Test for Customer Willingness to Pay More and
Eco-Friendly
Products and Brand Loyalty
What are these
statements?
I
would switch to
green products
if I am willing
to they were
more pay more
for available at
my green
products. local
store.
I would
switch to
green
products if
they were
promotional
deals such as
TV ads and
local printed
coupons
available at
my local
store.
I am
more
likely to
buy a
certain
product
because
it has a
brand
name I
have
used in
the past.
Spearman's
ρ
I am
willing to
pay more
for green
products.
Correlation
Coefficient
Sig. (2-
tailed)
1.000
-
-.551*
.000
-.285*
.000
.050
.374
N 318 318 318 313
I would
switch to
green
products if
they were
more
available at
Correlation
Coefficient
Sig. (2-
tailed)
-.551*
.000
1.000
-
.484*
.000
.038
.501

my local
store.
N 318 318 318 313
I would switch to
Correlation green
products if they
Coefficient were
promotional
Sig. (2-
tailed)
deals such as TVs ads
N
and local
printed
coupons
available at
my local
store.
-.285*
.000
318
.484*
.000
318
1.000
-
318
.121*
.032
313
I am more likely to
Correlation buy
a certain product
Coefficient
because it has a brand
Sig. (2-
tailed)
name I have used in
N
.050
.374
313
.038
.501
313
.121*
.032
313
1.000
-
313

the past.
Note. * I tested the correlation at the significance level of 0.05.
rs =-.551, n = 318 (Item
12) rs = -.285, n = 318
(Item 13) rs = .05, n =
313 (Item 14)
Because the calculated significant was less than 0.05 (1.2839E-26,
2.3995E-7), I rejected the null hypothesis (H₀6). The rejected hypothesis,
which states that there is no significant statistical relationship between eco-
friendly product brand loyalty and customer willingness to pay more for
green products.
Repeat purchasing of green products might induce consumers to pay a
higher price because the consumers might now consider a store’s green
credentials when choosing where to shop (Tucker, Pearce & Bruce, 2012).
Green credentials help to ensure that the consumer understands why the
company’s products are superior to those of other stores. Leaders of car
companies understand that consumers are becoming increasing concerned
about the effect the automobile has on the environment (Tucker, Pearce &
Bruce, 2012). Marketing professionals of the car companies have developed

an advertising campaign for their hybrid car that lets consumers know that
the hybrid cars are the most efficient gas-and-electricity vehicle on the
market. Hybrid cars are now the brand that most consumers have in mind
when purchasing or shopping for an automobile that will save money on gas
and reduce harmful effects to the environment.
Consideration 3: Customer Willingness to Pay More and to Recycle at
Drop-Off
Recycling Facilities
Research Question 7. To what extent are there gender and age
differences in customers’ willingness to pay more for green products?
For the three survey items related to Research Question 7, I collected
demographic information for gender, age, and income.
To address Research Question 7, I used an ordinal regression analysis
to test the following hypotheses:
Ho7: There is no significant statistical relationship between gender,
age, and customer willingness to pay more for green products.
Ha7: A significant statistical relationship exists between gender, age,
and customer willingness to pay more for green products.

To examine the issue of willingness to pay more, Table 7 shows the results
of the Ordinal regression analysis of customer willingness to pay more for
eco-friendly products based on gender, age, and income information.
Table 7.
Ordinal Regression Analysis of Customer Willingness to Pay more for Eco-
Friendly
Products based on Demographic Information
Parameter Estimates
95% Confidence Interval
Estimat
e SE Wald
d
f Sig.
Lowe
r
Boun
d
Uppe
r
Boun
d
Threshol
d
[Sec2_Price_
2 = 1] -2.262 .43
4
27.15
4 1.00
0
-
3.113
-
1.411
[Sec2_Price_
2 = 2]
-.350 .35
2
.99
0
1 .32
0
-
1.041
.34
0
[Sec2_Price_
2 = 3]
2.410 .38
5
39.10
9
1 .00
0
1.655 3.166
[Sec2_Price_
2 = 4]
4.085 .44
9
82.91
4
1 .00
0
3.206 4.964
Location [Gender=1] .667 .23
3
8.188
1 .00
4
.21
0
1.124
[Gender=2] 0a - - 0 - - -
[Age=1] -.093 .38
6
.058 1 .81
0
-.849 .66
3

[Age=2] .145
.38
5 .142 1
.70
6 -.610 .901
[Age=3] -.533
.40
9 1.694 1
.19
3
-
1.334 .269
[Age=4] .304
.37
0 .672 1
.41
2 -.422 1.030
[Age=5] 0a - - 0 - - -
[Income=1] 1.249 .41
9
8.869 1 .00
3
.427 2.071
[Income=2] 1.002 .41
8
5.755 1 .01
6
.183 1.821
[Income=3] .712 .38
4
3.439 1 .06
4
-.040 1.464
[Income=4] .799 .48
8
2.674 1 .10
2
-.159 1.756
[Income=5] 0a - - 0 - - -
Note. Link function: Logit.
Note. Threshold: Response categories ‘logit functions’ intercepts for each
pricing category’s logit function.
Note. Location: Independent variables ‘logistic regression models’
coefficients for willingness to pay more.
Note: a: Reference category
Ordinal regression analysis models enable researchers to examine the
relationship between a set of predictors or independent variables and a
polytomous ordinal dependent variable response. The first ordinal
regression model (results in Table 7) measured “I am willing to pay more

for green products” (dependent variable) against gender, age, and income
(independent variables).
Table 8 shows the results of the goodness of fit for the ordinal regression
analysis of customer willingness to pay more and eco-friendly products and
table 9 shows that the assumption of the parallel lines cannot be rejected.
Table 8.
The Model Fitting Information, Which Shows the Statistical Significance of
the Ordinal Regression Analysis for Customer Willingness to Pay More for
Eco-Friendly Products
Table 9.
Test of Parallel Line, Which Shows the Statistical Significance of the
Ordinal Regression Analysis for Customer Willingness to Pay More for Eco-
Friendly Products

Since the calculated significance level was less than 0.05 the model
fitting information above validate my decision to reject the null hypothesis
(H₀7), which stated that there is no significant statistical relationship
between gender, and customer willingness to pay more for green products.
Furthermore, as shown in Table 9, the test for parallel logit lines calculated
the chi-square significance value as 0.658, which is larger than 0.05, which
implies that the assumption of the parallel lines cannot be rejected.
The income range of the participants who expressed a readiness to
pay more for green products was respondents who earned up to $49,999.
The data results showed the need to develop awareness campaigns targeting
respondents with incomes greater than $50,000. We also observe a
significance value of 0.004, which shows that males were more likely to be
willing to pay more for recyclable products than females.

Research Question 8. To what extent is there, a relationship between
customer willingness to recycle e-waste at drop-off recycle facilities based
on gender, age, and income?
The response items in the ordinal regression test were:
Item 6: I am willing to recycle more for green products.
Item 18: I would buy and recycle electronic devices if more drop-off
recycling facilities were available in my area.
The testing, done via the following hypotheses, addressed Research
Question 8 as it related to willingness to recycle e-waste at drop-off
recycling facilities.
H₀8: There is no significant statistical relationship between e-waste
recycling intent and gender, income, and age.
Ha8: A significant statistical relationship exists between e-waste
recycling intent and gender, income, and age.
Table 10 shows the results of the Ordinal regression analysis of
customer willingness to recycle e-waste at drop-off recycling facilities based
on their demographic characteristics. Table 10 shows the results of the
ordinal regression analysis of customer willingness to recycle e-waste at
drop-off recycle facilities based on demographic information.

Table 10.
Ordinal Regression Analysis of Customer Willingness to Recycle e-Waste
at DropOff Recycling Facilities Based on Demographic Information
Parameter Estimates
95% Confidence Interval
Estimate SE Wald df Sig.
Lower
Bound
Upper
Bound
Threshol
d
[Sec3_Recycle_4
= 1] -6.192 .800 59.880 1 .000 -7.760 -4.624
[Sec3_Recycle_4
= 2] -3.965 .438 81.898 1 .000 -4.824 -3.106
[Sec3_Recycle_4
= 3] -2.199 .373 34.657 1 .000 -2.931 -1.467
[Sec3_Recycle_4
= 4]
-.074 .348 .045 1 .831 -.755 .607
Location [Gender=1] -.805 .225
12.815 1 .000 -1.246 -.364
[Gender=2] 0a - - 0 - - -
[Age=1] -.578 .371 2.432 1 .119 -1.304 .148
[Age=2] -.858 .372 5.323 1 .021 -1.587 -.129
[Age=3] -.180 .393 .210 1 .646 -.949 .589
[Age=4] .138 .359 .148 1 .701 -.565 .840
[Age=5] 0a - - 0 - - -

[Income=1] -.546 .404 1.832 1 .176 -1.337 .245
[Income=2] -.760 .405 3.523 1 .061 -1.553 .034
[Income=3] -.572 .374 2.339 1 .126 -1.305 .161
[Income=4] -.359 .473 .574 1 .449 -1.286 .569
[Income=5] 0a - - 0 - - -
Note. Link function: Logit.
Note. Threshold: Response categories ‘logit functions’ intercepts for each
recycling willingness category’s logit function.
Note. Location: Independent variables ‘logistic regression models’
coefficients for customer willingness to recycle e-Waste at Drop-Off
Recycling Facilities Note: a: Reference category
Tables 11 and 12 below show the results of the model of fit and test of
parallel lines for the customer willingness to recycle e-waste at drop-off
recycle facilities based on demographic information. The model fitting
information in Table 11 validated the decision to reject the null hypothesis
(H₀8) and the test of parallel lines implied that the assumption of the parallel
lines cannot be rejected.
Table 11.
The Model Fitting Information, Which Shows the Significance of the Ordinal
Regression
Analysis for Customer Willingness to Recycle E-Waste at Drop-Off
Recycling Facilities Base
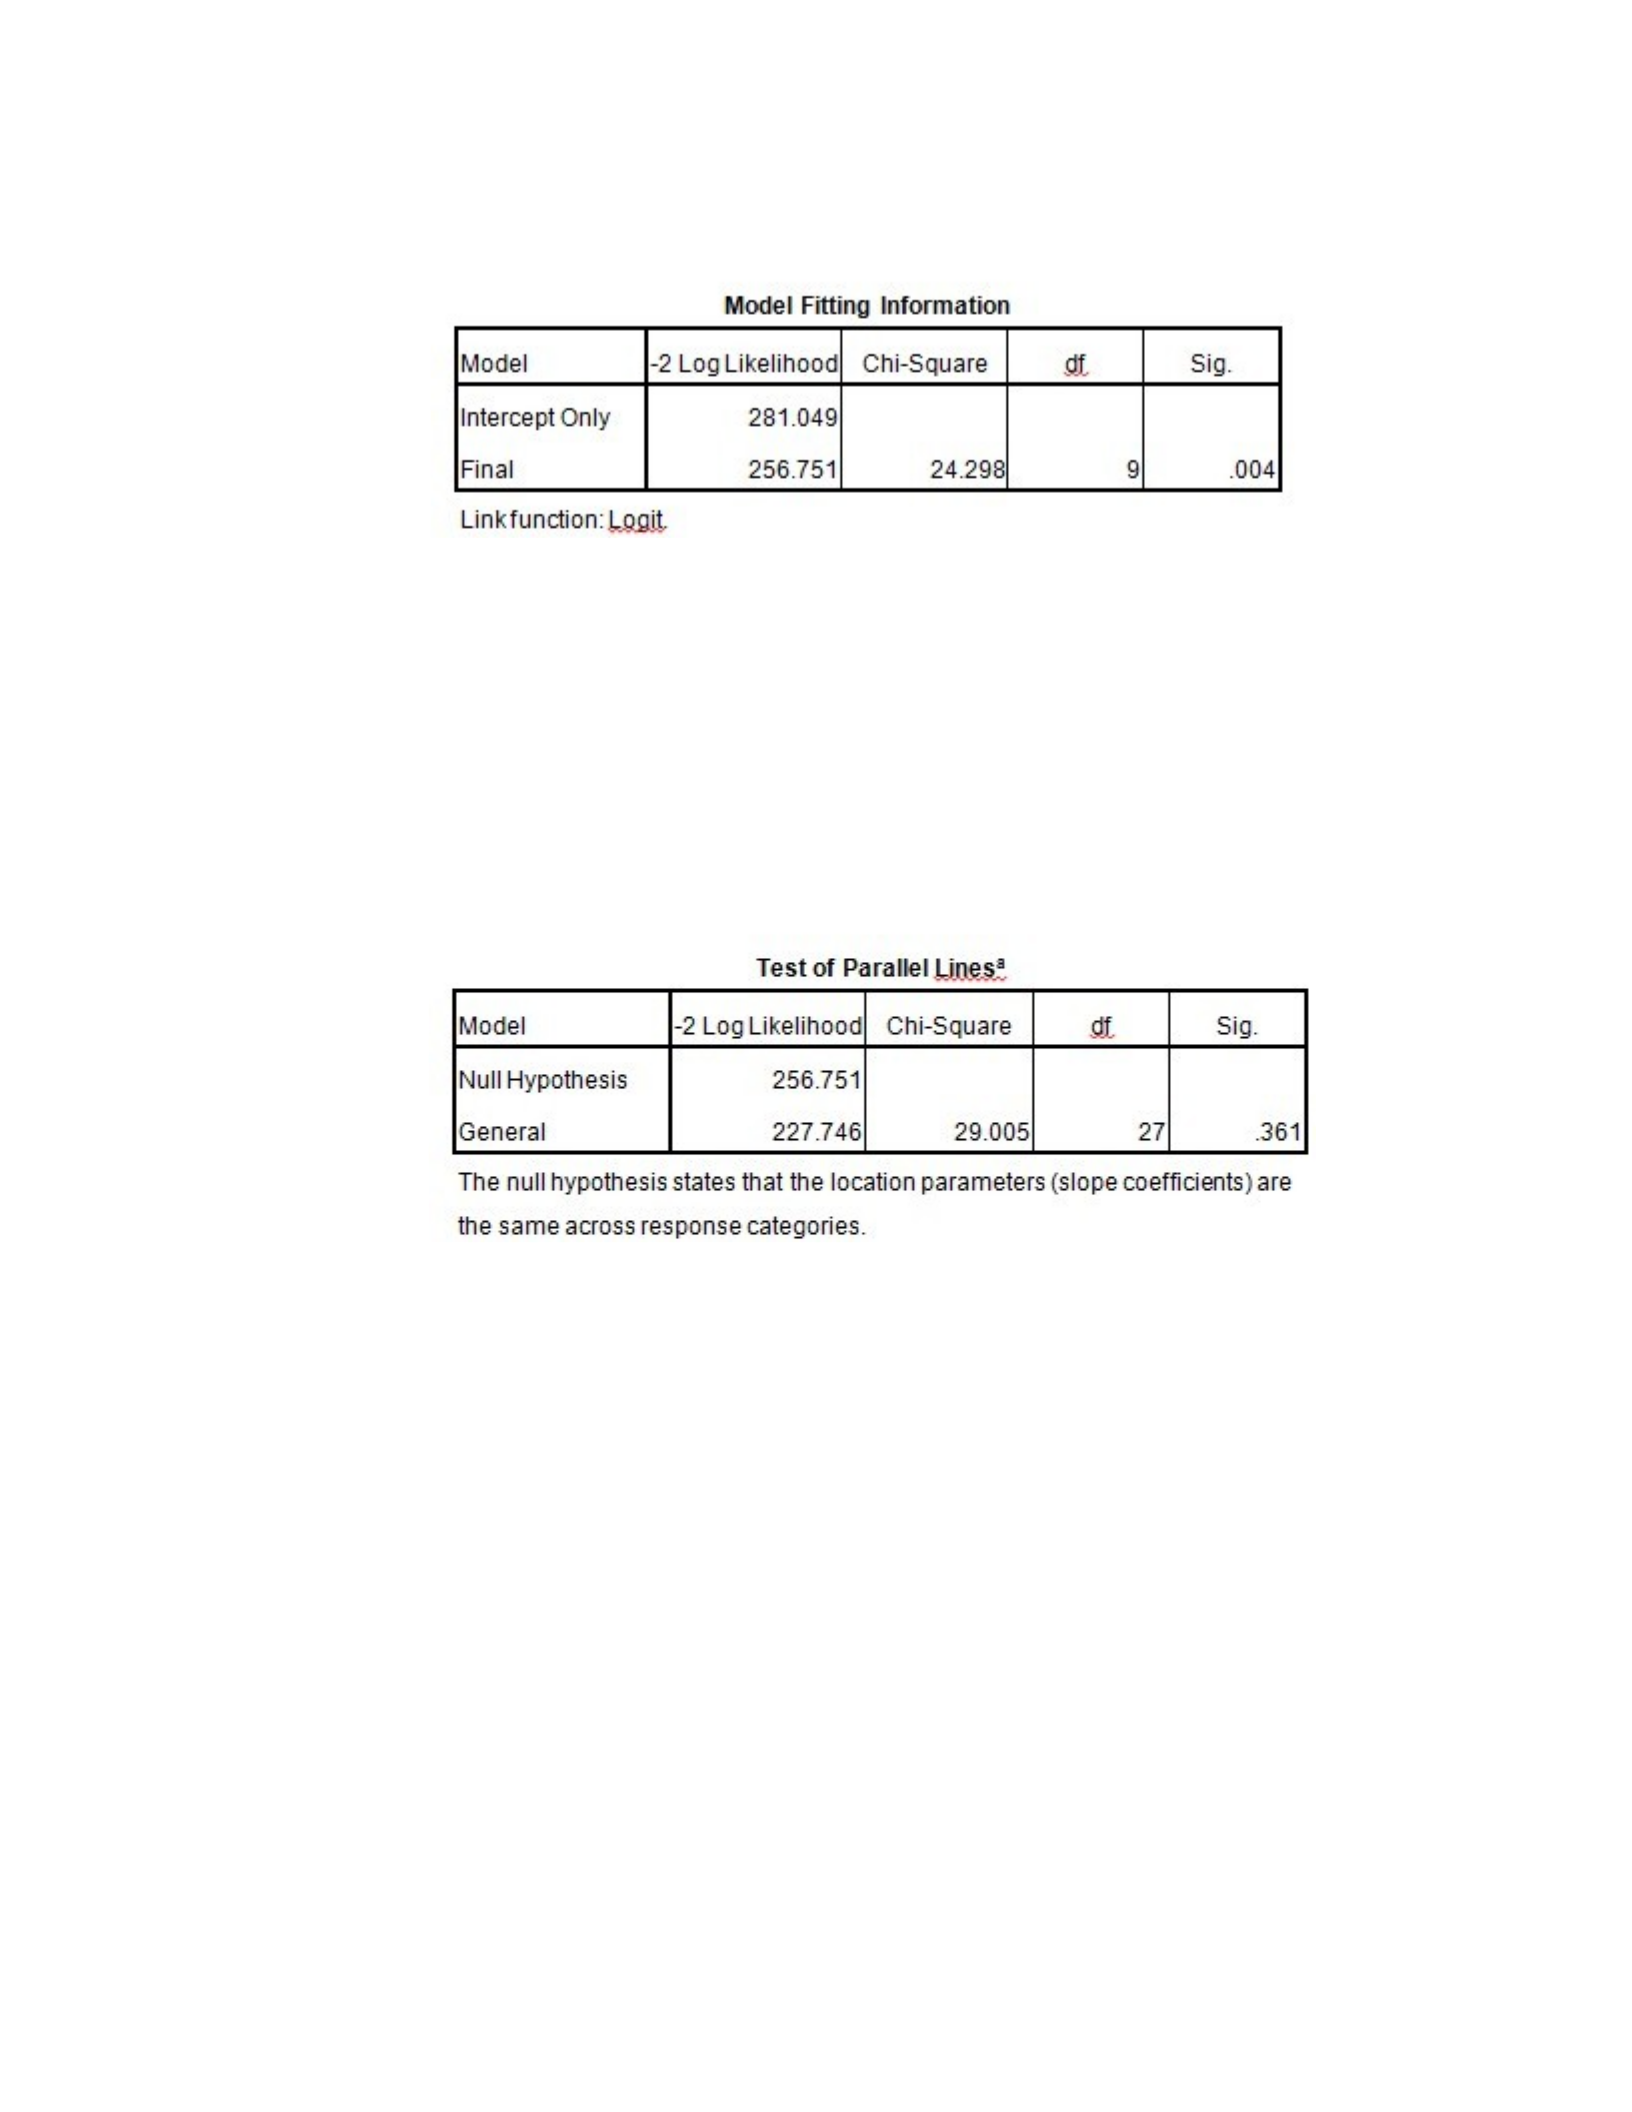
Table 12.
Test of Parallel Line, Which Shows the Significance of the Ordinal
Regression Analysis for Customer Willingness to Recycle E-Waste at Drop-
Off Recycling Facilities Base
Using ordinal regression enabled me to model the polytomous ordinal
dependent variable response’s relationship with the set of independent
demographic variables gender, age, and income. The ordinal regression
analysis estimated the correlation between the response to “I would buy and
recycle electronic devices if more drop-off recycling facilities were
available in my area (Sec3_Recycle_4 - dependent variable)” against
“gender, income, and age” (independent variables).

As reflected in Table 10, the results of testing Hypotheses for
research question 8 were:
•Gender: Gender=1= Male participants were less willing to
recycle e-waste at drop-off recycling facilities than female
respondent.
•Age: Age=2=25-31 years old participants were less willing to
recycle ewaste than the AGE=5=46-52 respondents.
•Income: There was no significant difference (at the .05 level)
in willingness to recycle associated with the income categories.
Research question 8, inquired about customers’ willingness to recycle
e-waste. The results of testing the hypotheses for independent variable i.e.
gender, income, and age along with the dependent variables for willingness
to recycle e-waste at drop-off recycling facilities demonstrated that
respondents between ages 25-31 were not as willing to recycle e-waste
products as respondents between the ages of 46-52 even with the increased
availability of recycling facilities. The calculated significance level was less
than 0.05 and as a result, I rejected the null hypothesis (H₀8), which stated
that there is no significant statistical relationship between e-waste recycling
intent and gender, income, and age. Some respondents might not be willing

to practice in recycling behaviors as previously noted under Research
Question 2, due to an inverse relationship with the existence of a secondary
market. Consumer products such as Apple iPhones resell for as much as
10% to 50% of the cost of a new iPhone in emerging markets such as Africa
and
Latin America (Laseter, Ovchinnikov, & Raz, 2010).
The question I used to answer if customers would buy and recycle
electronic devices in their area was “I would be willing to recycle electronic
devices if more dropoff recycling facilities were available in my area.” Both
gender and income had a calculated significance level of less than 0.05 for
customer willingness to recycle at a drop off facility. The model fitting
information in Table 11, which had significant level of 0.004, validated my
decision to reject the null hypothesis (H₀8), which stated that there is no
significant statistical relationship between e-waste recycling intent and
gender, income, and age. Furthermore, the test of parallel lines calculated
the chi-square significant value as 0.361, which implied that the assumption
of the parallel lines cannot be rejected. The results of this ordinal regression
analysis showed that male participants and customers ages 25-31 were not
as willing to buy and recycle electronic devices as female customers or

customers in the older age categories. This is an indication that by
promoting recycling habits, including awareness campaigns and recycles
drives, is vital to encourage consumers ages 25 and 31 to start developing
recycle habits and use recycling facilities.
Summary
In conclusion, the key findings are that product quality and price are
significant for attaining consumers’ brand loyalty, and in relationship to
customers’ willingness to recycle e-waste at drop-off recycling facilities and
their willingness to pay more for green products. The findings indicate that
male participants and participants between the ages of 25-31 were not as
likely to recycle e-waste as female participants and participants in the older
age group. Additionally, as reflected in Table 7, male participants and the
participants who earned up to $49,999 expressed a readiness to pay more
for green products.
Applications for Professional Practice
In Consideration 1, I explored customers’ willingness to recycle e-
waste at dropoff recycling facilities and found brand loyalty, as shown in
Table 3, plays a significant part in customers’ decision to recycle.

In Consideration 2, I explored customers’ willingness to pay more for
green products and found similar results: As shown in Table 6 when
customers had used a certain brand before, they were more likely to
continue buying that brand, even if the price went up.
Consideration 3, in Table 7 explored the association of Willingness to
Pay More according with gender and income. The income range that
expressed a readiness to pay for more for green products contained
respondents that make up to $49,999.
Consideration 3, Table 8 demonstrated the association of willingness to
recycle electronic devices at a drop-off facility for green products and
demographic variables. The age range and income group that were less
willing to recycle e-waste at drop-off recycling facilities was the
respondents in the 25-31 age group.
The results based on consumer views highlighted the fact that
business managers should focus on brand awareness to inform their
customers of the benefits of using their products as well as the availability of
local recycling centers. Business managers should also use customer
testimonials, or experiences with green products, to encourage new
customers to switch from using non green products to eco-friendly products.

Business managers could create brand awareness by investing in marketing
and advertising to promote eco-friendly products.
Implications for Social Change
In Section 1, I indicated that findings from this study could provide an
opportunity to bring more awareness to the social responsibility of the
business community. Data analysis from Table 6 revealed that a significant
statistical relationship existed between social responsibility and brand
loyalty, the implications for social change became much clearer. Social
responsibility reflects a business manager’s willingness to promote and
address environmental responsibility. Social responsibility within
businesses drives social change and produces an atmosphere conducive to
better business practices (Chaminda and Perera, 2013).
The significant relationship between social responsibility and product
innovation creates a venue for social change (Close, Finney, and Laceya,
2010). The socially responsible activities of business leaders can help to
promote awareness. Therefore, the evaluation of the findings of this study
supported the need for more socially responsible practice from business.
These few actions could help to promote environmentally responsible
behavior by consumers.

There is a need to transform the current markets into green markets by
replacing inefficient processes with green, sustainable processes (Chang and
Fong, 2010). Some of the strategies that several companies’ leaders have
used to separate themselves from the competition are by developing and
rewarding businesses for promoting green and fair product strategies.
Recommendations for Action
The evaluation of the results of this study provided an opportunity to
recommend actions that will continue to promote social responsibility within
the business community. The first action that might further support socially
responsible behavior of businesses is to quantify the variable savings by
using a green-product alternative and include it on a company‘s balance
sheet, or profit-or-loss statement. The steps toward achieving this task
would require a combined effort from major groups (businesses, consumer
advocate groups, government policy groups, marketing groups,
shareholders, and the EPA). The Research and Development department
will be able to develop better products, which will make their promotion
more cost effective.
Business management should adopt a more environmentally and
socially responsible supply-chain management-practice and promote such

practices to consumers and other businesses. Starbucks (2013) and Google
are two companies whose leaders have held themselves accountable for
becoming greener. Starbucks stores’ owners purchase coffee beans only
from companies that are part of the Fair Trade Certified and Certified
Organic Coffee. Starbucks’ storeowners are going green, whereby each
storeowner will achieve LEED® certification. This focus has enabled
Starbucks’ leaders to reduce both operating costs and the environmental
impact of its business practices (Starbuck, 2013).
Business managers need to communicate the environmental and
social impacts associated with product use to their consumers. This means
addressing and making consumers aware of any hidden costs of product
ownership and educating consumers on how to decrease their “carbon”
footprint when they make purchases as, for example, through energy use of
electronic devices or waste avoidance upon product disposal. For example,
every pack of Walkers potato crisps made by PepsiCo has a carbon-
emissions label. PepsiCo found that 44% of carbon emissions, associated
with each bag of crisps, came from the production of the raw materials, most
notably the way in which its potatoes were cultivated, processed, and stored.

Such information increases awareness of both the impact of the products and
the carbon footprint of everyday foods (Ecopromising, 2008).
The second recommendation, based on research done by Kondon,
Kurakwa, Kato, Umeda, and Takata (2006), is to explore a number of ways
to reduce costs while investing in green products such as using best practice
for the management of the product life cycles, expansion of the business
scale, and technological innovation among others.
The final recommendation is business managers should focus on
brand awareness to inform their customers of the benefits of using their
products as well as the local recycling center. Business managers should
also use customer testimonials, or experiences with green products, to
encourage new customers to switch from using nongreen products to eco-
friendly products. Business managers could create brand awareness by
investing in marketing and advertising to promote the benefits of purchasing
eco-friendly products.
Recommendations for Further Study
There are many potential follow-ups to this study. The first and most
obvious follow-up would be to widen the industry and geographical location
to see if similar results exist. In this study, I explored consumer views on

recycling and willingness to pay more for green products. It is unclear
whether the same findings and conclusions would apply in other industries
such as housing and the energy sector.
Second, the data in Section 1 include an EPA report on e-waste
figures for 2009. This EPA report contained the most currently data
available at the time of this study; another researcher could revisit the EPA
figures as more recent data become available. It would be interesting to
track the changes from 2009 to a future point in time to see if any significant
changes occurred.
Third, researchers should focus on government policies regarding e-
waste in light of increases or decreases in a country’s population. Countries
with larger populations may have more comprehensive polices due to their
need to identify, control and improve more environmental variables.
Exploring questions on the policies’ effectiveness and efficiency could
provide the foundation for further studies.
Reflections
With this research, I examined the level of consumer willingness to
pay more for eco-friendly products and consumers willing to recycle e-waste
at drop-off recycling centers. The research process has been both rewarding

and challenging for two reasons. First, the results of this research provided
significant insights into the decision-making process customers go though
and helped focus on which variables (price, quality, or brand name) play an
important part in the final purchase decision. Secondly, the literature and
research findings revealed consumers (Chang & Fong, 2010) and business
(Eco-promising, 2008) views on eco-friendly products. I believe that the
information from this study provides a point in time reference of
participating customers’ spending decisions and propensity to recycle. I was
surprised that business managers have not noticed the eco-friendly product
trend sooner since this information about scarcity of resources has been
around for several years. Based upon completing this study, I believe as
customer demand for ecofriendly products increases, business managers will
respond and more eco-friendly products will be available in stores along
with people using dropoff center to recycle goods.
Summary and Conclusions
In conclusion, to promote green products as the wave of the future,
the focus should be on product stewardship and product marketing. Because
evolving and changing customers’ views drive business product
development, it is the customers’ expressing their newly found interest in

green products that should prompt businesses leaders to refocus their efforts
and dedicate their resources to explore how they can harness this new and
potentially competitive advantage to increase companies’ bottom lines while
satisfying the customer base.

