


1
CHAPTER ONE
Introduction to cancer immunology
1.1 Earliest approaches to immunotherapy
The notion that the immune system can recognize and potentially eliminate cancer has only
gained broad acceptance in the medical community over the last few decades, but initial reports
highlighting the potential of immunotherapy date back to the 19th century. In 1866, Wilhelm Busch
described complete remissions in some sarcoma patients who developed erysipelas, a superficial
skin infection, of their postoperative wound1,2. In 1883, Friedrich Fehleisen identified
Streptococcus Pyogenes as the causative agent for erysipelas and reported surprising responses in
some patients with inoperable metastatic disease inoculated with pure cultures of the bacteria3.
However, it was not until the surgeon William Coley, often recognized as the “Father of Cancer
Immunotherapy”, that these anecdotes were formalized into a crude treatment now referred to as
“Coley’s Toxins”4.
Inspired by the numerous case reports in the literature, Coley performed direct injections
of Streptococcus preparations into patient tumors. Many patients experienced serious side effects
such as high fevers, nausea, malaise, and tachycardia. However, a subset of patients did have
significant regression of their otherwise inoperable tumors which Coley published as a case series
in 18935,6. The serious side effects, in addition to the underlying treatment effect, were likely the
result of substantial innate immune activation in response to the bolus of transferred bacteria, but
these mechanisms were very poorly understood by Coley and the medical community at the time.
Despite some successes, his findings were highly controversial and difficult to consistently
replicate. In 1894, the Journal of the American Medical Association criticized the use of his toxins,

2
while the American Medical Association referenced them as an “entire failure” and an “alleged
remedy”4,7. Perhaps in part due to the considerable doubt of his medical contemporaries, Coley’s
ideas did not gain widespread acceptance.
At the same time, scientists in the nascent field of immunology were considering not just
the potential for the immune system to be augmented therapeutically but also its role in the natural
surveillance and elimination of tumors. In 1909, noted Germany physician and scientist Paul
Ehrlich was the first to propose that the immune system could potentially eliminate an
“overwhelming frequency” of developing carcinomas8, an early precursor to the theory of cancer
immunosurveillance. However, it would take close to a century of development in the fields of
cancer biology and immunology to develop a framework to fully understand Coley’s early studies
and explore the immune system’s role in the prevention and treatment of cancer.
1.2 Establishment of tumor immunity
Over the first half of the 20th century, many significant developments in tumor immunology
were connected to the study of tissue transplantation. Owing to a lack of established inbred mouse
strains, tumor studies were typically performed by the transplantation of cancer cells between
genetically different organisms or sometimes completely different species. While tissue
transplants between genetically identical hosts were possible, most tissues, whether a malignant
tumor or a benign skin graft, would be normally rejected between genetically dissimilar
individuals. Several studies from James B. Murphy in 1914-15 proposed that the rejection of tumor
grafts was mediated by lymphoid cells and could be enhanced with nonspecific stimulation of
lymphocytes, but his studies gained little traction as the prevailing notion was that lymphocytes
were fixed cells lacking motility9–12. Elegant studies from Ernest E. Tyzzer and Clarence C. Little

3
in 1916 suggested that the survival of certain tumor transplants in genetically related mouse strains
could be explained by the existence of several genes that, when matched, would allow for tumor
growth13. Several decades later, George Snell set about to isolate the genetic loci responsible for
the acceptance and rejection of grafts, a phenomenon he referred to as ‘histocompatibility’.
Working at the Jackson Laboratory that Clarence Little founded, Snell developed an extensive
panel of congenic mouse strains differing only in their alleles at specific histocompatibility (H)
genes inferred from prior studies14. Using these mice, Snell was able to isolate a that a specific
genetic locus he called H-2 was the strongest barrier to rejection and was extremely polymorphic
between mice15,16. However, a mechanistic understanding of the role of the H-2 locus and the genes
encoded within it was beyond the techniques of the time.
At around the same time, extensive work from Peter Medawar and colleagues defined the
vital role of the cellular components of immunity in the rejection of tissue allografts17–19.
Additionally, they emphasized the faster rate with which a second identical tissue allograft would
be rejected in humans or animal models, highlighting the similar kinetics to other immune-
mediated phenomena. However, these findings posed a problem for the developing field of cancer
immunology. As most studies with common transplanted tumors had been performed between
genetically dissimilar organisms, it was not possible to determine whether the demonstrated
immunity was to antigens common to the tumor itself or simply to any transplanted foreign tissue.
The existence of true tumor-specific immunity was definitively shown in a series of studies from
Ludwik Gross in 1943, Edward Foley in 1953 and Richmond Prehn in 195720–22. All of these
studies displayed that mice could be immunized against syngeneic transplants of tumors induced
by chemical carcinogens, establishing the presence of tumor-specific immunity. Shortly thereafter,
building upon these studies and the earlier ideas of Paul Ehrlich, Sir Macfarlane Burnet and Lewis

4
Thomas proposed a formal hypothesis of “cancer immunosurveillance” on the role of the immune
system in the natural prevention of malignancy23,24. Burnet and Lewis felt that the immune system
must play a protective role in the host against tumor development going so far as to call it an
“evolutionary necessity that there should be some mechanism for eliminating or inactivating such
potentially dangerous mutant cells”24,25. In summary, Burnet stated “it is by no means
inconceivable that small accumulations of tumor cells may develop and because of new antigenic
potentialities provoke an effective immunological reaction with regression of the tumor and no
clinical hint of its existence.”23 With the combination of these definitive studies from Gross, Foley,
and Prehn together with the conceptual framework of immunosurveillance proposed by Burnet
and Thomas, the role of the immune system in preventing and eliminating cancer appeared to be
coming into focus.
1.3 From immunosurveillance to immunoediting
Following the presentation of the cancer immunosurveillance hypothesis, there was
immense interest in seeking to test its natural conclusion that immunodeficient organisms should
have a higher rate of spontaneous tumor formation. The identification and characterization of the
athymic nude mouse allowed for the examination of the immunosurveillance hypothesis in a
genetically immunodeficient host26,27. In a series of extensive studies, Osias Stutman dealt a major
blow to the acceptance of the immunosurveillance hypothesis. Stutman found that
immunodeficient CBA/H nude mice did not form more tumors than their wild-type counterparts
following carcinogen exposure28. Furthermore, nude mice did not have higher rates of spontaneous
or virally induced tumor formation29,30. Stutman’s results appeared definitive and had failed to
uphold the central tenets of the immunosurveillance hypothesis, leading to widespread skepticism

5
of its validity. Despite its conceptual elegance, even Lewis Thomas began to doubt his own theory
stating that “the greatest trouble with the idea of immunosurveillance is that it cannot be shown to
exist in experimental animals”31.
However, Stutman’s experiments had multiple caveats he could not have foreseen at the
time. First, later studies would show that nude mice still carried detectable levels of functional ab
T cells and were not fully immunodeficient32,33. Additionally, the CBA/H strain of mice Stutman
used were later shown to have extremely high levels of the aryl hydrocarbon hydroxylase enzyme
necessary for the transformation of the carcinogen used (methylcholanthrene--MCA) into its active
carcinogenic form34,35. Thus, the rate of cellular transformation in this system may have
overwhelmed any endogenous antitumor response. Finally, additional follow-up studies
corroborating these results likely did not follow the mice for sufficient periods of time to assess
the rates of spontaneous tumor formation36.
While Stutman’s work dampened most enthusiasm for the concept of cancer
immunosurveillance, several key studies in the 1990’s renewed interest in the idea. First, interferon
g (IFN-g) was shown to have a protective role against the growth of transplanted tumors and the
development of primary chemically induced or spontaneous tumors37,38. Second, mice lacking
perforin, a component of the cytolytic granules within cytotoxic T cells and NK cells necessary
for target cell lysis, were shown to have higher rates of tumor formation following MCA
challenge39,40. However, the definitive studies proving the existence of a cancer
immunosurveillance process made use of mice lacking recombination activating gene 1 (RAG-1)
or RAG-2. Without these enzymes involved in V(D)J recombination, mice completely lack B and
T cells41. Using 129/SvEv RAG-2-/- mice, Robert Schreiber and his group clearly showed that these
immunodeficient mice developed tumors more rapidly and with a greater frequency than their

6
wild-type counterparts in response to MCA challenge42. Furthermore, when these mice were aged
and tracked over time, the immunodeficient mice developed far more spontaneous malignancies42.
A set of elegant follow-up transplant experiments provided further insight into the role of the anti-
tumor immune response. When tumors isolated from either RAG-2-/- mice or wild-type mice were
transferred to RAG-2-/- mice, they all grew with similar kinetics suggesting no tumor-cell intrinsic
growth defects in tumors formed in the absence of an intact immune system. However, when these
same tumors were transplanted into wild-type mice, a sizeable fraction of tumors originally derived
from a RAG-2-/- host were unable to form tumors in an immunocompetent host42. This suggested
that tumors formed in the absence of an intact immune system are inherently more immunogenic
than those arising in immunocompetent hosts. Together, these studies definitively proved the role
of the immune system in preventing tumor formation and revived the cancer immunosurveillance
hypothesis of Thomas and Burnet. However, they also demonstrated the ability of the immune
system to sculpt the immunogenicity of tumors that ultimately escape immune recognition.
These dual roles were combined into a “cancer immunoediting” hypothesis presented by
Gavin Dunn and Robert Schreiber containing three stages of tumor-immune interactions:
elimination, equilibrium, escape43–45. The elimination phase represents the initial concept of
immunosurveillance in which highly immunogenic cancer cells are eliminated through an
integrated response of the innate and adaptive immune systems. If the developing tumor is fully
eradicated at this phase, there is no progression to the later stages. However, if the tumor is not
fully eliminated it will progress to the equilibrium phase in which the host immune system exerts
a significant selective pressure that is enough to temporarily contain tumor outgrowth but not
enough to fully eradicate the tumor. Over time, the genetically unstable tumor will accumulate
mutations and tumor subclones will form that are capable of growing under the intense

7
immunological pressure. It is the growth of these cells that will then result in the formation of a
clinically apparent tumor. This theory of cancer immunoediting provided a unified model to
understand tumor-immune interactions at various stages of carcinogenesis.
1.4 Advancements in fundamental T cell biology
While the cancer immunoediting hypothesis provided a framework to explain the role of
the immune system in both the prevention and formation of tumors, it was a deeper understanding
of the fundamental aspects of T cell biology that ultimately led to the development of novel
immunotherapies in the last few decades. In 1974, Rolf Zinkernagel and Peter Doherty reported
that the interactions between cytotoxic T cells and target cells they recognized required matching
at the H-2 gene complex (also known as major histocompatibility complex) previously defined by
George Snell, a phenomenon now known as major histocompatibility complex (MHC)
restriction46,47. However, the mechanism through which gene products from the MHC regulated
immune responses was not clear. In 1985, a landmark study from Bruce Babbitt, Paul Allen, and
Emil Unanue showed the association of an immunogenic peptide recognized by T cells with MHC
class II molecules48. Together with their previous studies, this work suggested that T cells
recognized short peptide fragments produced by intracellular processing of in-tact proteins that are
then presented by MHC molecules on the surface of antigen-presenting cells49,50. Several years
later, Pamela Bjorkman and Don Craig Wiley elucidated the structure of a human MHC class I
molecule, human leukocyte antigen (HLA)-A2, in complex with a foreign antigen, providing the
most detailed glimpse yet at the cell surface structure recognized by T cells51.
Meanwhile, advancements in T cell biology would enable a more complete understanding
of the other side of this molecular interaction. In the late 1970’s, a series of reports described a

8
protocol for the selective growth of T cells from normal unfractionated human bone marrow and
peripheral blood52–54. All of the methods involved stimulation with conditioned medium from
phytohemagglutinin (PHA)-stimulated human blood lymphocytes that was theorized to contain a
still unknown molecule referred to as T-cell growth factor. In follow-up work, several groups
reported on the biochemical purification and sequence analysis of this protein that immunologists
had named interleukin-2 (IL-2)55–57. By the mid-1980’s, the gene for human IL-2 had been
identified, recombinant IL-2 had been produced and shown to be biologically active, and IL-2’s
role as an autocrine factor potently stimulating T cell proliferation was becoming clear58–60. The
discovery and characterization of IL-2 would open new doors for studying the fundamentals of T
cell biology.
Throughout the 1970’s and into the early 1980’s, the identification of the T cell receptor
(TCR) mediating antigen-specific reactions in T cells was viewed as the “holy grail” of cellular
immunology. In a series of pivotal studies, Jim Allison and John Kappler characterized the
biochemical features of a cell surface protein that would soon be defined as the TCR61,62. They
described a disulfide-linked dimer with each component containing both constant and variable
regions within both mouse and human T cells. These discoveries set off a race to identify the genes
encoding the TCR. In 1984, a trio of studies from Stephen Hedrick, Mark Davis, and Tak Mak
identified the gene encoding the TCR in both mouse and human T cells63–65. This work defined a
cell-surface protein with constant, variable, and joining regions very similar to the previously
defined structure of immunoglobulins in B cells. In parallel with the studies describing antigen
presentation by MHC molecules, the elusive mechanism through which T cells recognize their
target was coming into focus.

9
1.5 Molecular basis for anti-tumor immunity
The existence and nature of tumor antigens has been a fundamental question since the
earliest days of cancer immunology, inspiring both enthusiasm and immense uncertainty. In a
widely read 1929 review, William Woglom summarized his skepticism stating that “it would be
as difficult to reject the right ear and leave the left ear intact as it is to immunize against cancer.”66
While the previously described studies of Gross, Foley, and Prehn demonstrated the potential for
mice to be immunized against syngeneic tumors, the underlying mechanisms and the nature of
antigen driving this response were not clear. For many decades, the techniques to probe these
questions were simply not present. However, fundamental discoveries in the B and T cell biology,
including techniques for the production of monoclonal antibodies and the propagation of T cell
clones, allowed for detailed and painstaking studies on the identification of tumor antigens52,54,67.
In a series of detailed molecular studies, Lloyd Old used panels of monoclonal antibodies to
identify potential cell surface antigens in mouse and human cancer lines68,69. However, the antigens
he identified were found to be generally expressed across various cell types or tissue-specific but
not tumor-specific. In his famed 1981 address Cancer Immunology: The Search for Specificity,
Lloyd Old stated that “if there is a basic tenet in the field, it is that cancer cells are antigenically
distinguishable from their normal progenitors,” but he cautioned that70:
“An underlying assumption in much of the work going on in cancer immunology is that antigenic
changes recognizable by the host’s immune system are an invariable accompaniment of malignant
transformation…In my opinion, it is simply too soon to say whether tumor-specific antigens, i.e.,
antigens with an absolute restriction to cancer, exist.”

10
In the early 1980’s, Thierry Boon’s group was performing a collection of studies on the
mouse mastocytoma line P815. He observed that mutagenesis of P815 resulted in the formation of
tumor variants rejected by syngeneic mice and found to stimulate a variant-specific cytolytic T
cell (CTL) response, suggestive of the generation of new antigens within these tumor variants
following mutagenesis71,72. In a collection of arduous studies utilizing DNA transfection into
antigen-negative clones, Boon’s group isolated the source of T cell reactivity to one of their tumor
variants – a point mutation in a gene they named P91A that resulted in a single amino acid change
in the resulting protein73. Follow-up studies identified additional tumor-specific antigens within
P815 clones, suggesting that T cell recognition of these tumor-specific mutations was a generalized
mechanism of anti-tumor immunity74. Boon’s studies were pivotal in changing our understanding
of cancer immunology, as they demonstrated that tumor mutations producing novel protein
antigens, now termed neoantigens, could function as tumor-specific targets for T cell recognition.
At the same time Boon was performing these studies in mice, Lloyd Old’s group reported
tumor-specific reactivity among autologous T cell clones isolated from a patient with metastatic
melanoma75. Utilizing Boon’s methodologies of anti-tumor CTL clones and antigen-loss tumor
variants, a collection of groups demonstrated the existence of distinct antigens recognized by T
cells on human melanoma lines76–79. Ultimately, this led to the identification of the first tumor
antigens in human patients, members of the multi-protein MAGE family80–82. These genes,
together with related families of BAGE and GAGE genes, were shown to have exclusive expression
to cancer cells and germ cells of the testis, earning them the name Cancer/Testis (CT) antigens83.
Later work from Thierry Boon and Steve Rosenberg would identify additional tumor antigens in
human melanoma that were shown to be lineage-related molecules involved in melanocyte

11
differentiation such as tyrosinase and MART-184–87. Shortly thereafter in 1995, dual studies
reported on the first human neoantigens identified in melanoma cell lines88,89.
Altogether, these studies proved the existence of mouse and human tumor antigens that
could be broadly grouped into two types. The first, the result of tumor-specific mutations that
produce novel protein epitopes, are termed neoantigens and represent ideal targets owing to their
exquisite tumor specificity. The second represent an enormously diverse class of nonmutated self-
proteins to which T cell tolerance is incomplete owing to restricted patterns of expression such as
CT antigens or tissue differentiation antigens. The specific roles played by each of these classes of
tumor antigens in both spontaneous anti-tumor immunity and the response to immunotherapy
remains a significant question to this day.
1.6 Immune checkpoint blockade
Following his crucial studies involved in the identification of the TCR, Jim Allison
continued to explore the fundamental mechanisms of T cell activation and regulation. While TCR
recognition of peptide:MHC was known to be essential for T cell activation, it was also clear that
a second co-stimulatory signal was required for optimal T cell function. In a pivotal 1992 study,
Fiona Harding in Jim Allison’s lab identified CD28 as the cell-surface molecule providing this co-
stimulatory signal90. Through his interest in T cell co-stimulation, Allison and his lab began
studying a structurally similar protein previously identified as being expressed on activated T cells
known as cytotoxic T-lymphocyte-associated protein 4 (CTLA-4)91. In 1995, Matthew Krummel
in Jim Allison’s lab established the opposing role of CTLA-4 and CD28 in T cell function92. While
CD28 recognition of its ligands B7-1 and B7-2 on antigen presenting cells leads to T cell co-
stimulation, CTLA-4 binds with higher affinity to both B7-1 and B7-2 and produces a potent

12
inhibitory signal that decreases T cell proliferation and cytokine production92. That same year, Tak
Mak’s group characterized the CTLA4-/- mouse which had a lethal phenotype characterized by
uncontrolled lymphocyte proliferation, highlighting the crucial role of CTLA-4 in T cell
homeostasis93. The following year, Dana Leach and Matthew Krummel in Allison’s group
published a landmark study that would come to change the field of tumor immunology. In it,
treatment of tumor-bearing mice with a blocking antibody against CTLA-4 resulted in the rejection
of pre-established tumors and generated immunological memory against tumor rechallenge94. This
provided the preclinical rationale for the targeting of T cell inhibitory receptors such as CTLA-4
in the treatment of cancer, an approach now known as immune checkpoint blockade (ICB).
Meanwhile in the early 1990’s, Tasuku Honjo’s group was characterizing gene expression
changes in T cells undergoing apoptosis. They isolated a novel member of the immunoglobulin
gene superfamily with normal expression restricted to the thymus that they called programmed
cell death protein 1 (PD-1)95. In contrast to the lethal phenotype observed in the CTLA4-/- mouse,
the PD-1 knockout mouse generated by Honjo’s group displayed a more moderate effect with aged
mice developing symptoms consistent with lupus and PD-1 knockout T cells showing enhanced
functionality96. Collectively, his studies suggested that PD-1 played a crucial role in the
maintenance of peripheral self-tolerance by serving as a negative regulator of T cell function. In
2000, a joint collaboration between Gordon Freeman, Clive Wood and Honjo’s group identified a
member of the B7 gene family as the ligand for PD-1 which they referred to as PD-L197. This work
further characterized the role of PD-1 signaling, describing the expression of PD-L1 and B7-1/B7-
2 on antigen presenting cells and the capacity for PD-1 signaling to inhibit CD28 costimulation in
activated T cells. Recognizing the potential application to tumor immunology, Honjo’s group
published studies in 2002 and 2005 on the role of PD-L1 expression on tumor cells in suppressing

13
anti-tumor T cell responses and the capacity to reverse this effect with antibody blockade of either
PD-1 or PD-L198,99. In 2006, an elegant study from Rafi Ahmed’s group observed PD-1
upregulation in dysfunctional virus-specific CD8 T cells in the chronic infection model with
lymphocytic choriomeningitis virus (LCMV)100. Crucially, this study described how blockade of
the PD-1/PD-L1 inhibitory pathway could lead to restoration of function in these exhausted CD8
T cells, leading to increased proliferation, cytokine production, and target cell lysis. While the
study was entirely performed using a model of chronic viral infection, it provided a framework for
conceptualizing the role of PD-1 in regulating immune responses more broadly and, together with
Honjo’s previous work, provided a clear rationale for targeting PD-1 in cancer.
These pivotal studies from Allison, Honjo, and numerous others led to the initiation of
clinical trials evaluating the efficacy of blocking antibodies against CTLA-4 (aCTLA-4) or the
PD-1/PD-L1 axis (aPD-1 or aPD-L1) in the treatment of solid tumors. In a landmark clinical trial
published in 2010, aCTLA-4 therapy was shown to provide a survival benefit in patients with
metastatic melanoma101. The next year, the FDA approved the monoclonal antibody ipilimumab
for the treatment of metastatic melanoma, the first drug of any kind ever shown to improve survival
in patients with metastatic melanoma. 2010 also saw the first promising reports on the safety and
tolerability of aPD-1 therapy in patients with refractory solid tumors102. Two years later in 2012,
a major study showed durable responses with aPD-1 therapy in a fraction of patients with
advanced non-small cell lung cancer (NSCLC), melanoma, or renal cell cancer that had failed prior
therapies103. The next year, Science magazine referred to cancer immunotherapy as the
“breakthrough of the year,” and the first aPD-1 therapy was FDA approved in 2014. Since then,
the approved uses for ICB therapy have exploded, with combination therapy consisting of both

14
aCTLA-4 and aPD-1 indicated for metastatic melanoma, NSCLC, renal cell carcinoma, Hodgkin
lymphoma, and squamous cell carcinoma of the head and neck among numerous others.
The enormous success of ICB therapy in treating a multitude of malignancies has generated
immense interest in understanding the mechanisms of action underlying the effect and
characterizing the correlates of response. Early clinical studies on aPD-1 therapy demonstrated
that the most important factor predicting a successful response was the existence of pre-treatment
CD8 T cell infiltrate together with intratumoral PD-L1 expression, suggesting the presence of an
anti-tumor immune response suppressed by the PD-1/PD-L1 axis104,105. Additionally, numerous
studies revealed that tumor mutational burden correlated with response to either aPD-1 or
aCTLA-4 therapy and was found to correlate with local immune cytolytic activity106–109. The
importance of tumor mutational burden is potentially tied to the relationship between tumor
mutations and neoantigens. Pre-clinical studies proved the importance of neoantigen-specific
immune responses in mediating tumor regression following ICB therapy in mice but a rigorous
approach to this question is more challenging in patients110.
1.7 Cellular immunotherapy
In 1983, Steve Rosenberg’s lab described the generation of “lymphokine activated killers”
(LAK) cells following the activation of peripheral blood from cancer patients with IL-2111. These
LAK cells showed the capacity to lyse NK-cell resistant tumor targets, and a protocol for the
treatment of patients with LAK cells and recombinant IL-2 was quickly initiated112. While close
to half of the original patients experienced objective responses, side effects such as severe fluid
retention were also common. Rosenberg’s group did note particularly strong responses in patients
with metastatic melanoma, a phenomenon they also observed in patients treated with high-dose

15
recombinant IL-2 alone113. Motivated by numerous studies suggesting anti-tumor immune
responses in melanoma, Rosenberg developed a protocol for the use of autologous expanded tumor
infiltrating lymphocytes (TIL) in conjunction with IL-2114. This combination achieved higher
response rates than previously achieved with LAK cells or IL-2 alone in patients with metastatic
melanoma. While the mechanisms underlying the treatment approaches were not entirely clear,
and LAK cells were likely just activated T cells, these studies paved the way for adoptive cell
therapy (ACT) as a viable treatment approach.
In recent decades, Rosenberg and his group have continuously updated their approaches to
ACT. Following the identification of tumor associated antigens in melanoma, some patients were
treated with activated antigen-specific CD8 T cell clones, achieving responses in a majority of
cases115,116. In 2006, he reported on the first patients with metastatic melanoma treated with
autologous genetically engineered lymphocytes given TCRs specific for tumor-associated antigens
such as MART-1, gp-100, and NY-ESO-1117. Several years later, his group showed that this
approach could induce cancer regression outside of metastatic melanoma, treating patients with
synovial sarcoma with engineered T cells expressing a TCR against the CT antigen NY-ESO-1118.
However, it was more dramatic T cell engineering pursued by Rosenberg and other groups that
would bring forth the next breakthrough in ACT – the use of chimeric antigen receptor (CAR) T
cells.
In 1993, Zelig Eshhar published a report on the generation of cytotoxic lymphocytes that
he had engineered with a chimeric receptor to give these T cells antibody-like specificity119.
Introduction of the chimeric gene consisting of a single-chain Fv domain (scFv) of an antibody
linked to T cell intracellular signaling domains resulted in T cell activation and cytotoxicity upon
recognition of target antigen in an MHC-independent manner. Later, crucial work from Michel

16
Sadelain’s group would show the essential role of CD28 co-stimulatory domains in the optimal
function of these CAR T cells and display the potential of CD19-directed CARs to eradicate human
B cell tumors in immunodeficient mice120–122. By 2010-11, the first impressive case reports were
published by Carl June and Steve Rosenberg, describing cancer regression in patients with
follicular lymphoma or chronic lymphoid leukemia treated with autologous CAR T cells directed
against CD19123–125. These promising studies were promptly followed by larger trials establishing
the efficacy of this therapy in treating a multitude of B cell malignancies126,127. By 2017, the FDA
approved CAR T therapy for patients with B cell acute lymphoblastic leukemia (B-ALL), a
landmark moment in the field of adoptive cell therapy and cancer immunology. Since then, the
indications for CAR T cell therapy have broadened to include other B cell malignancies such as
diffuse large B-cell lymphoma or follicular lymphoma.
1.8 Cancer immunogenomics
The completion of the human genome project in 2003 laid the foundation for a deeper
understanding of the role of genetic variation in human health and disease128. However, it was the
development of next generation sequencing (NGS) technology enabling far more cost-effective
sequencing that would bring genomics into the mainstream of the clinical and research world. By
2008, the first complete cancer genome had been sequenced, ushering in a new era in the
characterization of cancer129. Since that time, the extensive profiling of human cancer genomes
has produced an in-depth analysis of the genomic alterations at the heart of all cancers and shaped
our understanding of cancer biology. In some cancer types, the identification of specific mutations
has resulted in the development of targeted therapies, providing patients with personalized
treatment approaches130. However, the widespread genomic analysis of cancer has also paved the

17
way for new approaches and techniques at the intersection with basic immunology in the field of
cancer immunogenomics.
Broadly, cancer immunogenomics represents a complementary approach utilizing the
precision of tumor genomic analysis together with the fundamentals of cancer immunology. The
identification and targeting of candidate tumor-specific neoantigens produced as a result of tumor
genomic alterations lies at the core of cancer immunogenomics. Neoantigens are considered ideal
therapeutic targets owing to the lack of pre-existing T cell tolerance against them and their tumor
specificity. Their restricted expression should allow for tumor-specific targeting without the
accompanying side effects observed with more general immunostimulatory agents such as ICB
therapy or adoptive cell therapy against self-proteins. Furthermore, studies in preclinical systems
have shown that neoantigen-specific responses form the basis for both cancer immunoediting and
the response to ICB therapy110,131. The role of endogenous neoantigen-specific responses in
patients and their involvement in mediating immunotherapy responses is much less clear.
A central component of cancer immunogenomics is the identification of tumor antigens.
The earlier studies led by Boon, Rosenberg, and Old describing some of the first tumors antigens
were the culmination of arduous work utilizing classical techniques in molecular and cellular
biology. However, the painstaking nature of these approaches meant they were unlikely to ever
scale for clinical applicability. The remarkable advancements in our capacity to identify tumor
mutations through the widespread utilization of NGS technologies has radically altered approaches
to tumor antigen detection. As early as 2008, Jim Allison’s group reported on the use of in silico
prediction methods for the identification of putative tumor neoantigens from whole-exome
sequencing data132. Numerous computational methodologies have been developed for the
prediction of candidate neoantigens with initial approaches such as NetMHC relying on neural

18
networks trained on defined sets of peptide:MHC pairs133,134. While all of these approaches
generate putative neoepitopes, none has clearly separated itself as the best option for the
identification of recognized neoantigens, likely owing to the complex multifactorial nature of this
process. However, these approaches will likely improve with time as more patient-derived data
continues to update the underlying models. For now, they provide an initial step towards
personalized cancer immunotherapy by providing patient-specific epitopes and allow for the in-
depth profiling of treated patients.
Numerous studies utilizing these approaches in patients treated with ICB or ACT suggest
a potentially vital role for tumor neoantigens in mediating treatment effect. In addition to the well-
established correlation between mutational load and response, treatment of patients with ICB
therapy has been demonstrated to enhance neoantigen-specific responses135. Furthermore,
comprehensive genomic profiling of tumors treated with ICB therapy suggests a dynamic
evolutionary interplay with the outgrowth of tumor clones that have lost mutation-associated
neoantigens136. Nonetheless, the most striking examples of the importance of neoantigens in
immunotherapy response come from Steve Rosenberg’s work with patients treated with expanded
TIL cultures. While these ACT approaches began long before the technologies existed to easily
probe for antigen-specific responses, numerous reports from his group have identified significant
neoantigen reactivity among TIL cultures given to patients with favorable responses to
treatment137,138. Of note, ACT with TIL cultures containing significant neoantigen-reactivity have
also been shown to mediate tumor regression in cancers beyond metastatic melanoma. One patient
with metastatic cholangiocarcinoma experienced tumor stabilization and ultimate regression
following transfer of a TIL culture with significant CD4 T cell recognition of a tumor neoantigen,

19
while another patient with metastatic colorectal cancer saw an impressive response from treatment
with a TIL culture containing a polyclonal CD8 T cell response against KRASG12D139,140.
The progress in the genomic profiling of cancer and the development of in silico algorithms
for the prediction of patient-specific neoantigens has also led to renewed enthusiasm for
vaccination against cancer. In one of the earliest genomically guided approaches, Gerald Linette
and his group demonstrated that a dendritic cell vaccine led to an enhancement and broadening of
neoantigen-specific responses in patients with metastatic melanoma141. More recently, several
groups have reported the induction of neoantigen-specific responses in patients with metastatic
melanoma through personalized peptide or nucleic-acid formulations142,143. These same techniques
were also applied and shown to produce responses in the treatment of glioblastoma, a tumor with
a much lower mutational burden and neoantigen target pool144,145. While the optimal vaccination
route for the induction of neoantigen-specific T cells is still an open question, personalized cancer
vaccines represent the culmination of decades of work in cancer immunogenomics. The
enhancement of neoantigen-specific T cell responses, whether through personalized vaccines or
alternative approaches, will likely continue to be a dominant thread in cancer immunotherapy
going forward.
1.9 Cancer immunology today
As the field of immunology has matured over the last several decades, the process through
which anti-tumor immune responses are generated and maintained, specifically the necessity of
cross-talk between the innate and adaptive arms of immunity, has come into clearer focus. Ralph
Steinman’s initial discovery of a novel cell type within lymphoid organs that he termed the
“dendritic cell” did not generate significant enthusiasm at the time146,147. However, the following

20
decades would elucidate the role of dendritic cells at the intersection of innate and adaptive
immunity. Work from Hy Levitsky and Drew Pardoll would demonstrate the pivotal role of bone-
marrow derived cells in initiating immune responses to MHC class I-restricted tumor antigens148.
Several years later, Nina Bhardwaj’s group showed that dendritic cells function as potent antigen
presenting cells (APCs) capable of acquiring antigens from apoptotic cells and inducing the
generation of CTLs149. A collection of detailed studies from Ira Mellman, Steinman, and Antonio
Lanzavecchia outlined the process through which dendritic cells are activated by microbial
products and pro-inflammatory mediators to become potent APCs and activate CTLs150,151.
Together, these and other studies defined the process through which dendritic cells are
activated in peripheral tissues and migrate to draining lymph nodes where they initiate an adaptive
immune response152. In the context of tumor immunology, this process has been broadly referred
to as the cancer immunity cycle153,154. In summary, this process is initiated by the release of tumor
antigens following cancer cell death and uptake by dendritic cells in the local microenvironment.
Upon activation by pro-inflammatory mediators, these dendritic cells will migrate to local draining
lymph nodes where they prime and activate naïve T cells. Upon proliferation and differentiation
into activated T cells, these effectors must migrate and infiltrate into the tumor microenvironment
where they recognize and kill target cells. The antigen released following tumor cell lysis then re-
initiates this cycle. This cycle provides a framework for conceptualizing the initiation and
maintenance of anti-tumor immune responses and the impact of various interventions such as ICB
therapy or neoantigen vaccines. However, fundamental questions remain at virtually every step of
this cycle. A deeper understanding of the processes regulating myeloid cell activation and
migration as well as T cell recruitment and anti-tumor effector function will continue to inform
future cancer immunotherapy treatment approaches.

21
Despite immense progress in our understanding of anti-tumor immunity and the
development of the first FDA approved immunotherapies over the last decade, there remain
significant open questions and room for progress. Even among immunotherapy responsive tumors
such as melanoma and NSCLC, a sizeable fraction of patients do not respond. What factors
determine a patient’s response and how can non-responders be prospectively identified and
converted into responders? Furthermore, a number of difficult to treat malignancies such as
pancreatic ductal adenocarcinoma and glioblastoma do not respond to conventional
immunotherapies and have so far proven resistant to more novel approaches. Malignant brain
tumors such as glioblastoma represent a significant challenge in that patients face a particularly
grim prognosis and a paucity of treatment options. This work is specifically focused upon
deepening our understanding of the anti-tumor immune response in malignant brain tumors and
leveraging this for the development of novel immunotherapies.
1.10 Malignant brain tumors with emphasis on glioblastoma
Malignant brain tumors consist of both primary tumors arising from within the central
nervous system (CNS) and secondary metastases originating from extracranial sites. The most
common malignant primary tumor of the CNS is glioblastoma (GBM) with approximately 12,000
new cases per year, whereas secondary tumors typically develop from carcinomas of the lung,
breast, kidney or melanoma155,156. Significant advances in our understanding of the molecular and
genetic features of glioblastoma157,158 have not led to effective new therapies with conventional
standard of care treatment for primary GBM still consisting of surgery followed by concurrent
chemoradiation159. Despite this multimodality treatment, patients have a poor prognosis with a
median progression-free survival of 6.9 months and median overall survival of just 14.6 months159.

22
The inevitable recurrence is likely due to the highly aggressive and infiltrative nature of GBM,
best exemplified by the Walter Dandy’s 1928 report on the failure of hemispherectomies to prevent
recurrence160.
In contrast, the use of ICB therapy has led to improved outcomes and robust intratumoral
T cell infiltration in a considerable subset of patients with brain metastases (BrMETs)161,162.
However, these treatments and other immunotherapeutic approaches have not been effective in
GBM. Indeed, aPD-1 monotherapy did not improve survival in patients with newly diagnosed or
recurrent disease, and targeted vaccines and cell therapy approaches also have shown limited
efficacy144,145,163–165. Thus far, immunotherapy responses within GBM have been restricted to a
selective group of patients with a hypermutated phenotype caused by germline deficiencies in
DNA replication or repair166,167.
1.11 Molecular and cellular heterogeneity in glioblastoma
The lack of effective treatment options for patients with GBM is not due to an incomplete
understanding of the genomic landscape of GBM. In fact, it was the first study published as part
of The Cancer Genome Atlas and has been the subject of extensive characterization to date157,158.
These studies have defined crucial genetic features of GBM such as frequent copy number
amplifications of EGFR, deletions of CDKN2A/B, and mutations in tumor suppressors such as
TP53, PTEN, NF1, and RB1. However, in-depth genomic profiling has also unveiled remarkable
cellular and molecular heterogeneity within GBM168–171. Gene expression profiling of GBM has
led to the generation of a collection of transcriptionally defined tumor subtypes172. However, an
analysis of spatially distinct regions within GBM demonstrated that approximately half of all
tumors contained regions classified as multiple distinct subtypes within the same mass173. In

23
essence, each individual GBM is likely composed of numerous unique diseases within the tumor
and the identification of critical targetable dependencies is quite difficult.
In addition to the impact on the development of targeted drug therapies, this heterogeneity
likely poses additional challenges for potential immunotherapy. Studies in NSCLC and melanoma
have defined a strong association between the response to ICB therapy and the frequency of clonal
mutations that likely produce clonal neoantigen targets174,175. In contrast, even oncogenes such as
the epidermal growth factor receptor (EGFR) vIII frequently observed within GBM have been
shown to be expressed by only a fraction of the cancer cells within EGFRvIII-positive tumors176.
This suggests that even targeted immunotherapy against ideal candidates would likely fail due to
immune escape from a resistant subclone.
1.12 The immune system and glioblastoma
A collection of molecular, cellular, and anatomical factors makes GBM a uniquely difficult
tumor to target via immunotherapy. The early work of Peter Medawar, combined with the lack of
conventional lymphoid structures within the CNS, led to the concept of “CNS
immunoprivilege”177. The core principle of this notion was the belief that the CNS was a uniquely
immunosuppressive compartment and that immune reactions to intracranial antigens were
substantially diminished. However, this dogma was frequently challenged over the ensuing
decades by the presence of CNS autoimmunity in the context of demyelinating diseases as well as
clear immunosurveillance against viral, bacterial, and fungal pathogens. More recently, the
definitive identification of lymphatic vessels within the meninges and a collection of studies
defining the cellular components necessary for the initiation of intracranial immune responses has
diminished most enthusiasm for the idea of CNS immunoprivilege178–181. However, there clearly

24
exist nuances to CNS immunity that are possibly detrimental to generating immune responses but
also potential therapeutic targets. Recent work from Akiko Iwasaki’s lab describing increased anti-
tumor immune responses by the enhancement of lymphatic drainage through vascular endothelial
growth factor C (VEGF-C) treatment represents one intriguing avenue for research182.
GBM also appears capable of generating a significantly immunosuppressive
microenvironment through a combination of systemic and local factors. First, the presence of
systemic T cell dysfunction and lymphopenia has been a noted but unexplained feature for several
decades183,184. While this may be partially driven by treatment with depleting chemotherapy such
as Temozolomide, recent work also suggests the potential for T cell sequestration within the bone
marrow in response to intracranial malignancies185. Furthermore, histological analyses of GBM
reveal high levels of PD-L1 together with relatively sparse T cell infiltration186. The low number
of T cells that do infiltrate into GBM face an extremely immunosuppressive microenvironment
that contributes to significant T cell exhaustion and dysfunction187,188. The features generating this
immunosuppressive microenvironment are likely multifactorial but include high levels of IDO1
expression, production of immunosuppressive cytokines such as TGF-b and IL-10, and infiltration
with myeloid derived suppressor cells (MDSCs)189–192.
1.13 Immunotherapy in glioblastoma
Owing to the scarcity of effective treatment options and the success of immunotherapy in
other difficult to treat tumor types, there has been immense interest in the development of
immunotherapy for GBM. However, most of the conventional approaches have generated mostly
mixed or negative results. Large-scale studies of ICB therapy have demonstrated no survival
benefit in the recurrent setting for adjuvant (post-surgery) ICB but do suggest potential for

25
neoadjuvant (pre-surgery) ICB therapy to increase survival and CD8 T cell infiltration163,193.
Furthermore, up to twenty percent of GBMs will recur with a treatment-induced hypermutated
phenotype, leading to immense interest in the treatment of these tumors with ICB194. Despite some
case reports hinting at the potential benefit of ICB therapy in these patients, the magnitude of ICB
response is still unclear166,167,194.
Additional trials have focused upon the targeting of tumor-specific or tumor-associated
antigens within GBM. EGFRvIII is a splice variant of EGFR that produces a putative neoepitope
frequently expressed by GBM158,195. Previous studies have demonstrated the ability of this epitope
to induce antibody, CD4, and CD8 T cell responses, making it an ideal antigen target for
immunotherapy in GBM196–198. However, despite encouraging phase II results for a vaccine
targeting this neoantigen, no benefit was observed in the phase III trial164,199. Similarly, a trial of
CAR T cell therapy targeting the EGFRvIII variant displayed clear intratumoral T cell infiltration
and activation but also evidence of immunosuppression and antigen loss preceding immune
escape165. Additional work has targeted the growth factor receptor IL13Ra2 found to be
upregulated on a number of cancer types including GBM200. However, CAR T cell therapy
targeting IL13Ra2 showed similar results as the targeting of EGFRvIII with T cell infiltration in
conjunction with antigen downregulation201.
1.14 Conclusions
Decades of investigation on the fundamentals of cancer biology and immunology have led
to enormous successes with immunotherapy over the last decade, leading many to consider it a
pillar of modern oncology. However, these achievements have also clashed with the reality that
numerous questions still remain on the core aspects of the anti-tumor immune response and most

26
patients with solid tumors still do not benefit from immunotherapy. One such tumor with limited
response to immunotherapy and a relative scarcity of effective treatment options is GBM. Despite
extensive characterization of its genomic profile and immense interest in leveraging
immunotherapy for its treatment, there has been no change to the standard of care for GBM in over
fifteen years. Cancer immunogenomics, the utilization of complementary approaches in genomics
and cancer immunology, represents a framework for the identification and targeting of tumor-
specific neoantigens within tumors that could open new therapeutic avenues for the treatment of
tumors such as GBM. In this work, we provide a comprehensive immunogenomic profile of a
cohort of malignant brain tumors, develop new systems for the identification and characterization
of tumor-specific responses in mouse and human systems, and establish a preclinical system for
the targeting of brain tumor-specific neoantigens through adoptive cellular therapy.

27
CHAPTER TWO
Immunogenomic landscape of malignant brain tumors
2.1 Introduction
One cardinal feature of GBM that may be a particularly important contributor to therapy
resistance is its extensive intratumoral molecular and cellular heterogeneity168. Indeed,
intratumoral genetic heterogeneity is found in many cancer types to varying degrees202–205. The
presence of a complex tumor subclonal genomic architecture likely plays a pivotal role in limiting
the efficacy of both targeted therapies as well as immunotherapies. Specifically, studies in non-
small cell lung cancer (NSCLC) and melanoma showed a strong association between checkpoint
blockade immunotherapy response and the frequency of clonal nonsynonymous mutations, which
likely serve as sources of spatially distributed neoantigen targets174,175. In GBM, extensive work
has demonstrated that intratumoral heterogeneity of a range of tumor somatic changes including
mutations, copy number alterations, and transcriptional signatures across spatially distinct tumor
regions is also a hallmark of this disease173,206,207. In contrast, we have a more limited
understanding of the extent of intratumoral heterogeneity in other intracranial malignancies such
as brain metastases (BrMETs), as few corresponding analyses have been performed in these
cancers208. Moreover, further work is needed to understand the relationship between tumor genetic
heterogeneity and other important features of the tumor ecosystem, including the immune
microenvironment. Although numerous recent studies in other solid tumors including NSCLC and
ovarian cancer have examined the relationship between tumor cell intrinsic properties and
immunologic parameters such as the T cell receptor (TCR) repertoire209–212, this analysis has not
been extended either to primary or metastatic malignant brain tumors where the extent of

28
heterogeneity in the immune microenvironment and its interplay with genomic and transcriptional
diversity is unknown.
To address these questions, in collaboration with Malachi Griffith and Megan Richters, we
performed systematic and comprehensive multi-sector immunogenomic analyses on 93 samples
from a cohort of 30 patients with primary or recurrent gliomas or metastatic brain tumors,
representing the largest cohort of these brain cancers studied spatially to date. For each patient, we
characterized multiple spatially distinct regions using whole exome sequencing (WES), custom
capture validation, RNA, and TCR-sequencing. Our findings underscore the significant
differences in clonal architecture between gliomas and metastatic brain tumors which translates
into distinct neoantigen landscapes and, in turn, tumor infiltrating T cell clonotypic diversity.
These data therefore provide high resolution insights into the immunogenomic landscapes within
malignant brain tumors which may inform tumor-specific therapeutic approaches.
2.2 Results
2.2.1 Genomic features of glioma and BrMET cohorts
We obtained surgically resected tumor tissue and matched peripheral blood from a group
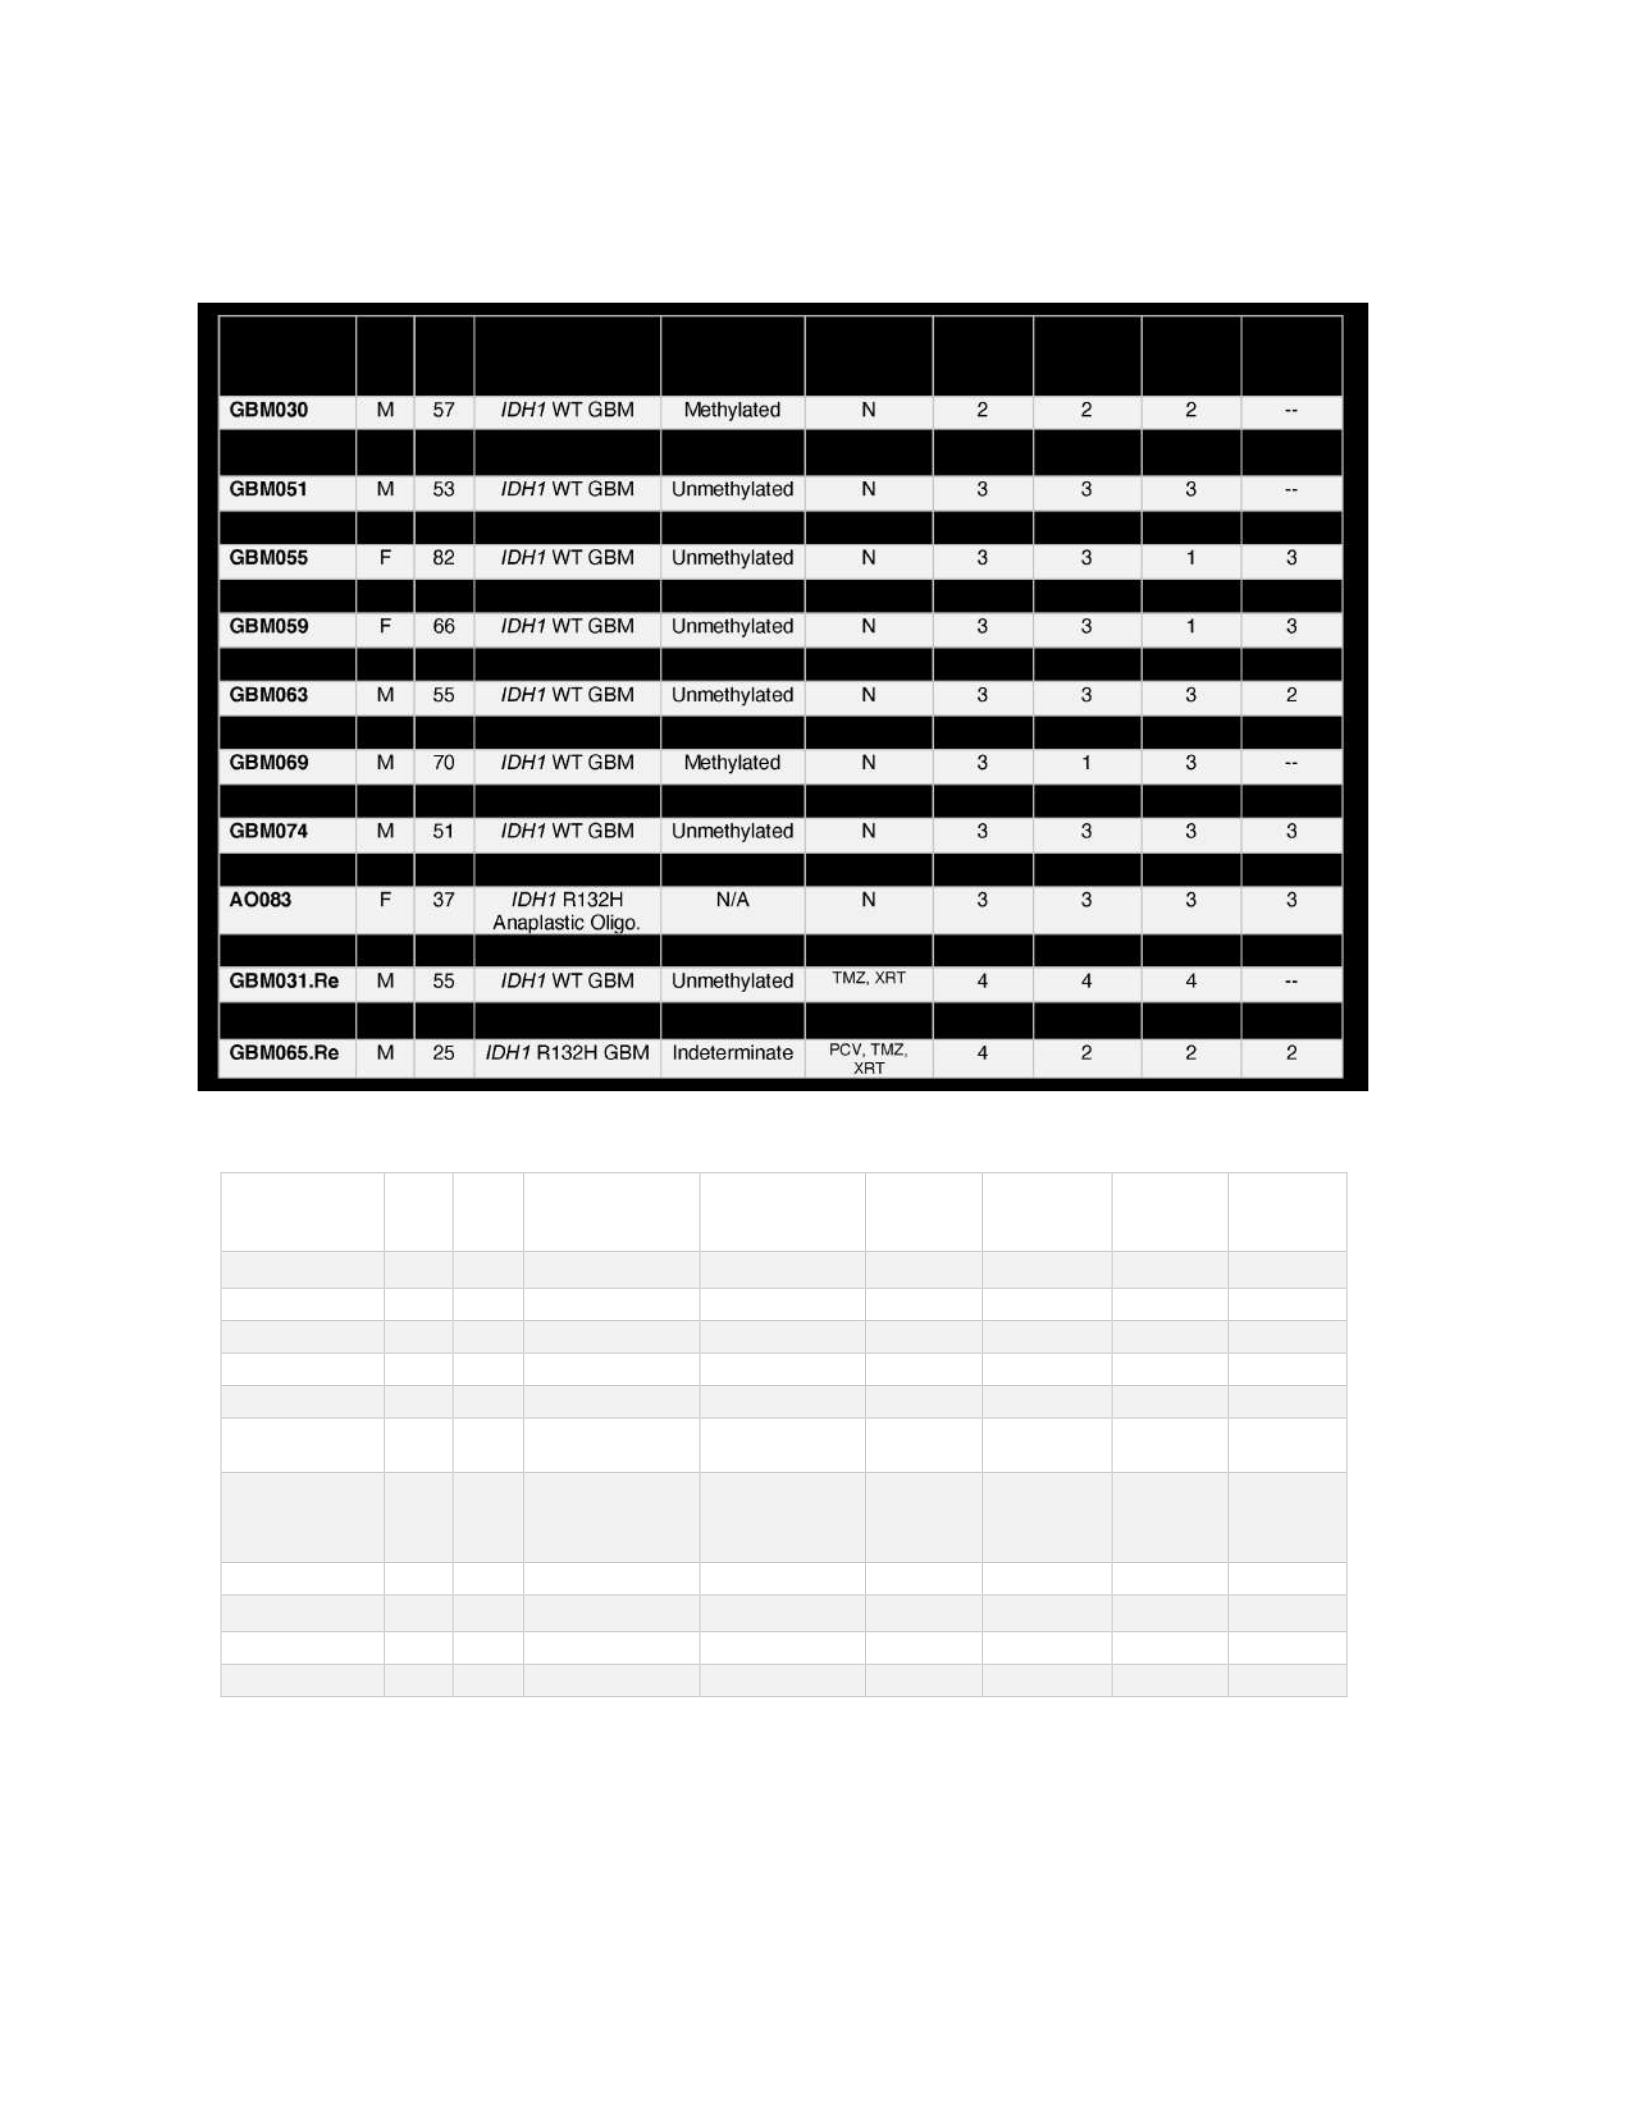
of 30 patients with pathologically confirmed intracranial tumors (Fig. 2-1a-b). Within this cohort,
14 tumors were primary GBM, 4 were recurrent GBM, 1 was an anaplastic oligodendroglioma
and 11 were BrMETs from either lung, breast, or cutaneous malignancies. In total, 21 of these
patients (15 primary gliomas and 6 BrMETs) were newly diagnosed and had received no prior
therapy. The 4 patients with recurrent GBM had undergone standard of care chemoradiation
therapy, while 5 of the BrMET patients had received varying treatment regimens for their primary
tumor (Fig. 2-1b). Importantly, no patients had prior immunotherapy
29
b
Figure 2-1: Clinical details of study cohort. Clinical and study-specific details for glioma (a) or BrMET (b)
patients included in the work. The number of spatially distinct regions from each tumor that underwent a
given analysis is indicated in the last four columns. NSCLC - Non-small cell lung cancer.
SCLC - Small cell lung cancer. MGMT - O-6-methylguanine-DNA methyltransferase. WES - Whole-exome
sequencing. TMZ - Temozolomide. RT - radiotherapy. PCV - procarbazine, lomustine (CCNU), vincristine.
Patient ID
Sex
Age
Pathology
Prior Trea tment
WES
Regions
Custom-
Capture
Regions
RNA-Seq
Regions
TCR Seq
Regions
BrMET00 8
M
81
NSCLC
Carboplatin,
Pemetrexed
4
4
4
4
BrMET00 9
M
58
NSCLC
N
3
3
3
3
BrMET01 0
F
60
NSCLC
N
3
3
3
3
BrMET01 8
F
57
Brea st
Taxol
3
3
3
3
BrMET01 9
F
59
SCLC
N
3
3
3
3
BrMET02 3
F
48
Brea st
Carboplatin,
Taxotere, Abraxane,
Herceptin/Perjeta
3
3
3
--
BrMET02 4
F
59
Brea st
TDM1, Docetaxel,
Capecitabine,
Tamoxifen,
Exemestane,
Herceptin
3
3
3
--
BrMET02 5
F
71
NSCLC
N
3
3
2
3
BrMET02 7
F
31
Brea st
Carboplatin,
Taxotere
3
3
3
3
BrMET02 8
M
69
Melanoma
N
3
3
3
3
BrMET05 8
F
54
NSCLC
N
2
2
1
--
a

30
treatment, however all patients across the cohort were given pre-operative steroids. Immediately
following surgical resection via craniotomy, each sample was dissociated into multiple (2-4)
spatially distinct tumor regions that each underwent comprehensive genomic and immunological
profiling including DNA WES, RNA sequencing, neoantigen prediction, and TCR sequencing
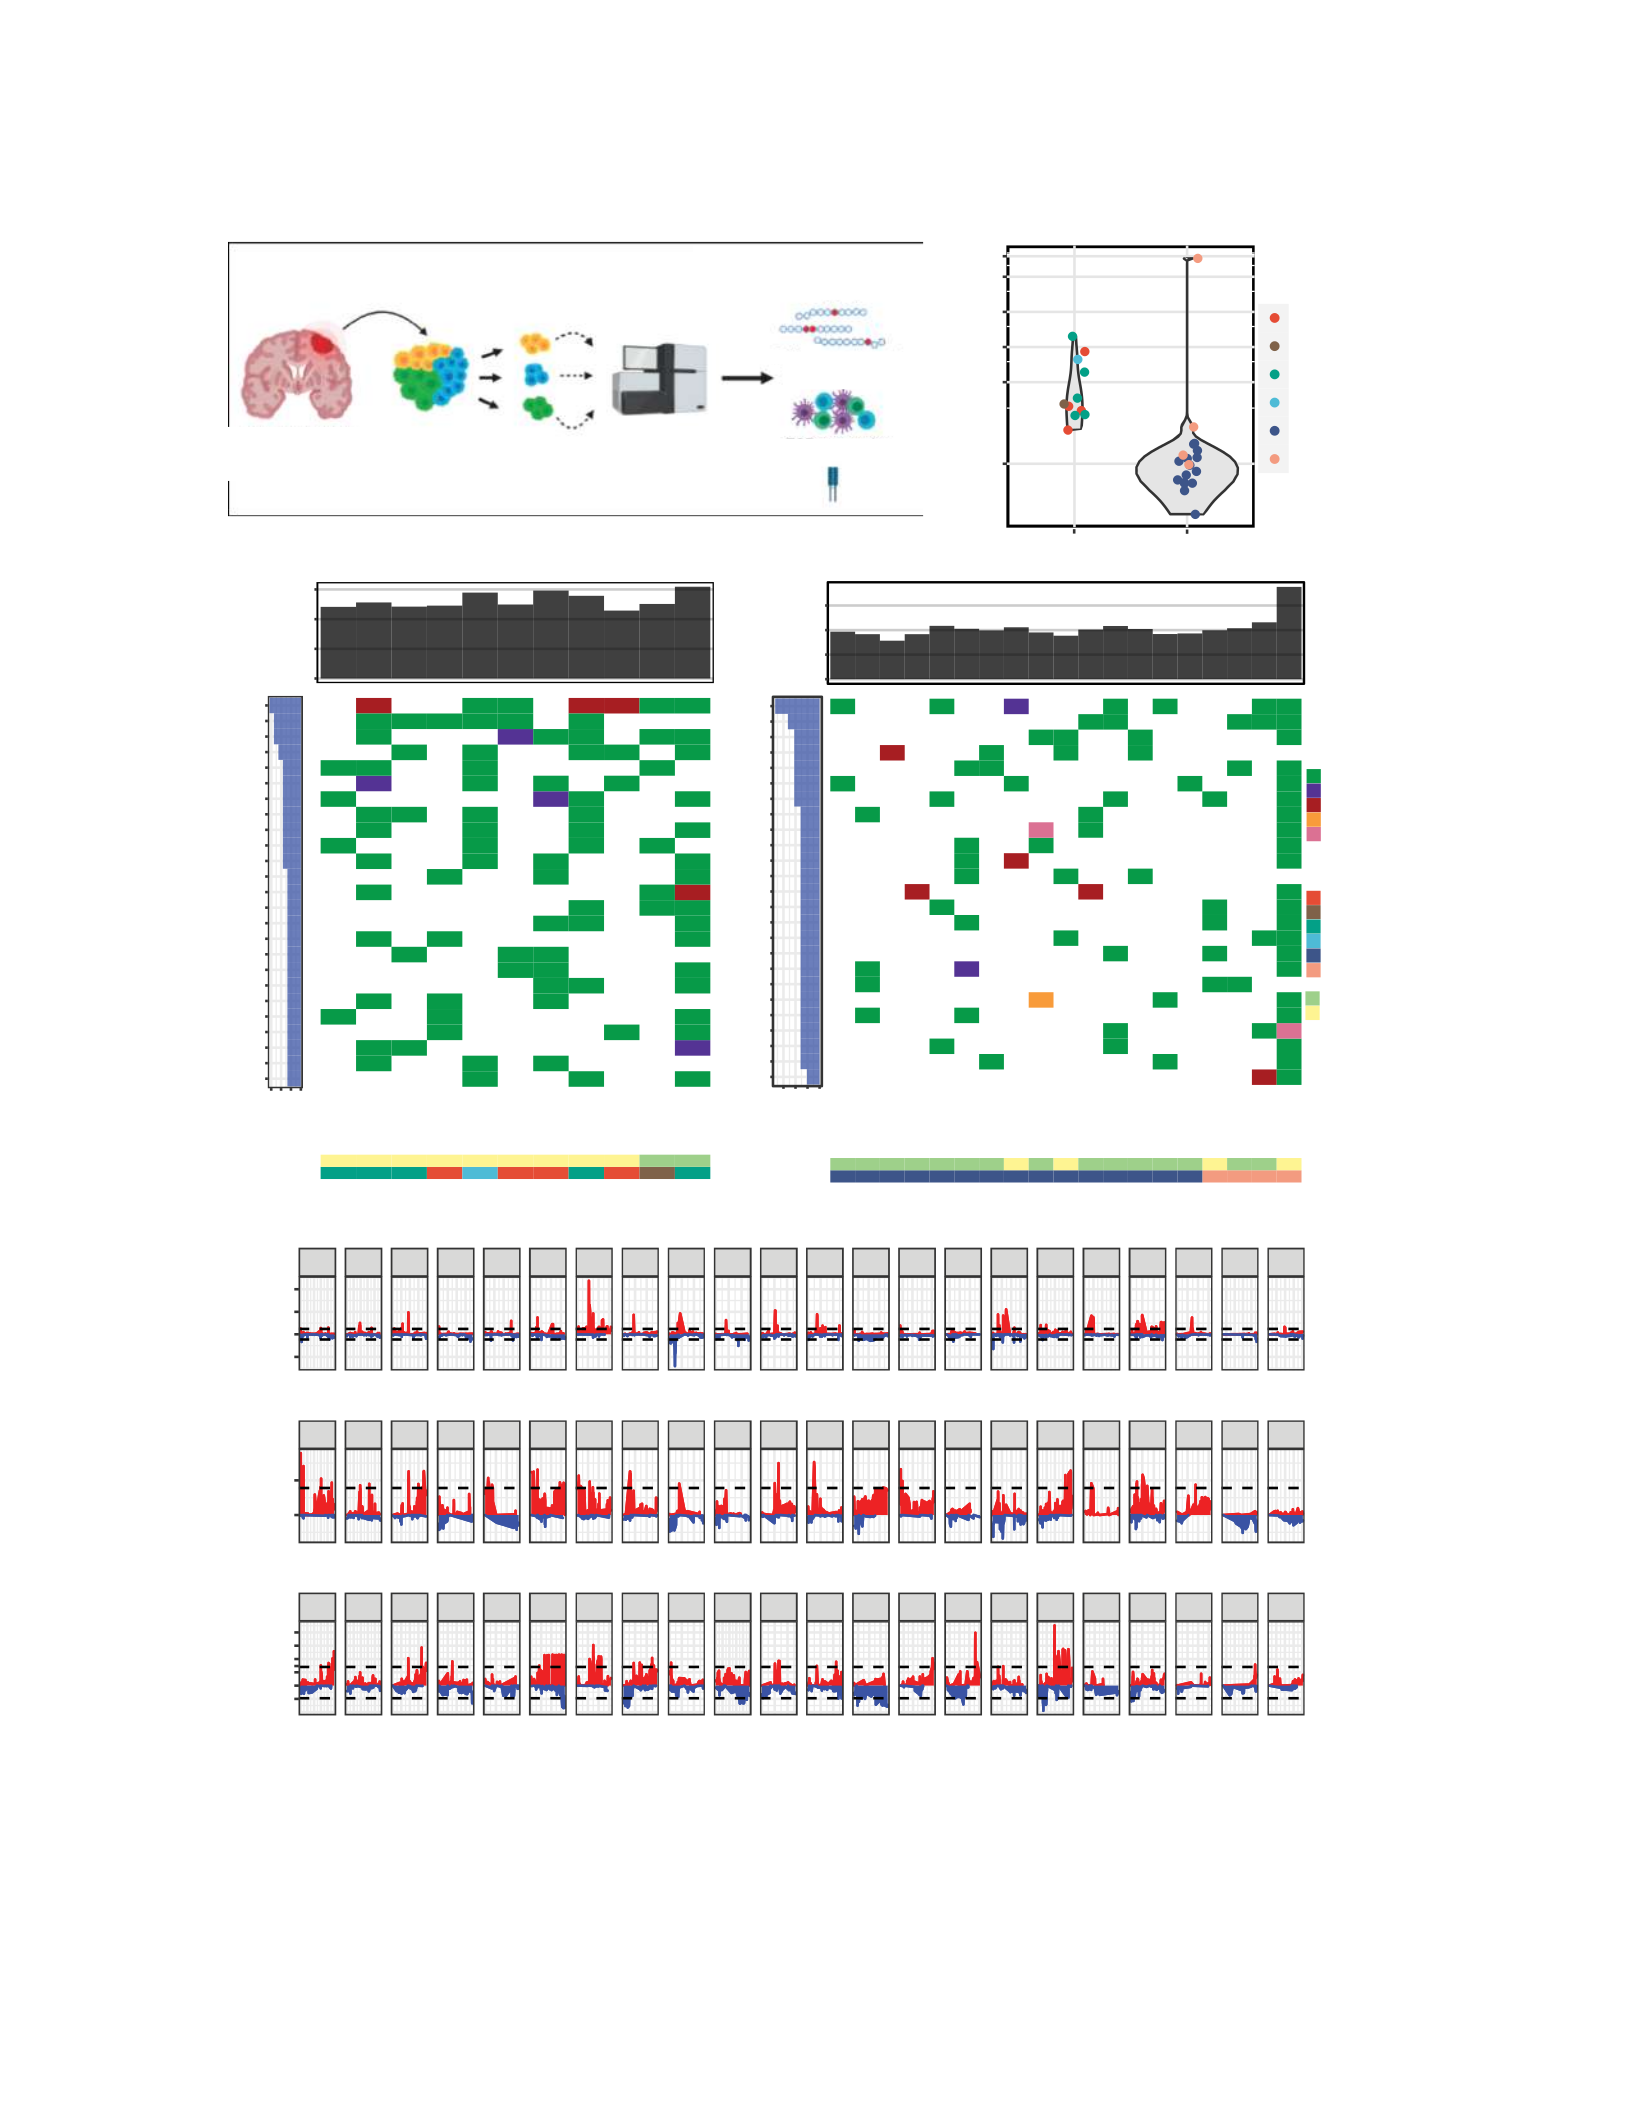
(Fig. 2-2a). Using WES at an average coverage depth of 156x, we identified a total of 11,923
somatic variants (both single-nucleotide variants and indels) across the tumor cohort. Because of
the subclonal nature of many variant calls derived from tumors with significant intratumoral
heterogeneity, we developed a customized, targeted validation sequencing assay with a set of
probes targeting all initially identified variants in addition to a select group of noncoding sites
(e.g., TERT promoter mutation sites) to re-sequence all initially detected variants to confirm their
presence. Using this approach, 87.6% of the cohort was characterized at a depth of at least 250x
at >90% of positions captured by the custom reagent. This resulted in confirmation of 92%
(10,254/11,181) of the original variants through validation sequencing after removal of those that
could not be targeted (488) or lacked sufficient minimum coverage (244). These data allowed us
to obtain high precision estimates of the VAF of each variant and provided greater confidence that
variants were not missed owing to potential regional variability in neoplastic content or sequencing
depth.
As expected, the median number of aggregate somatic variants per tumor was higher in
BrMETs (504) than in either primary (93) or recurrent glioma (141) (Fig. 2-2b). Within the glioma
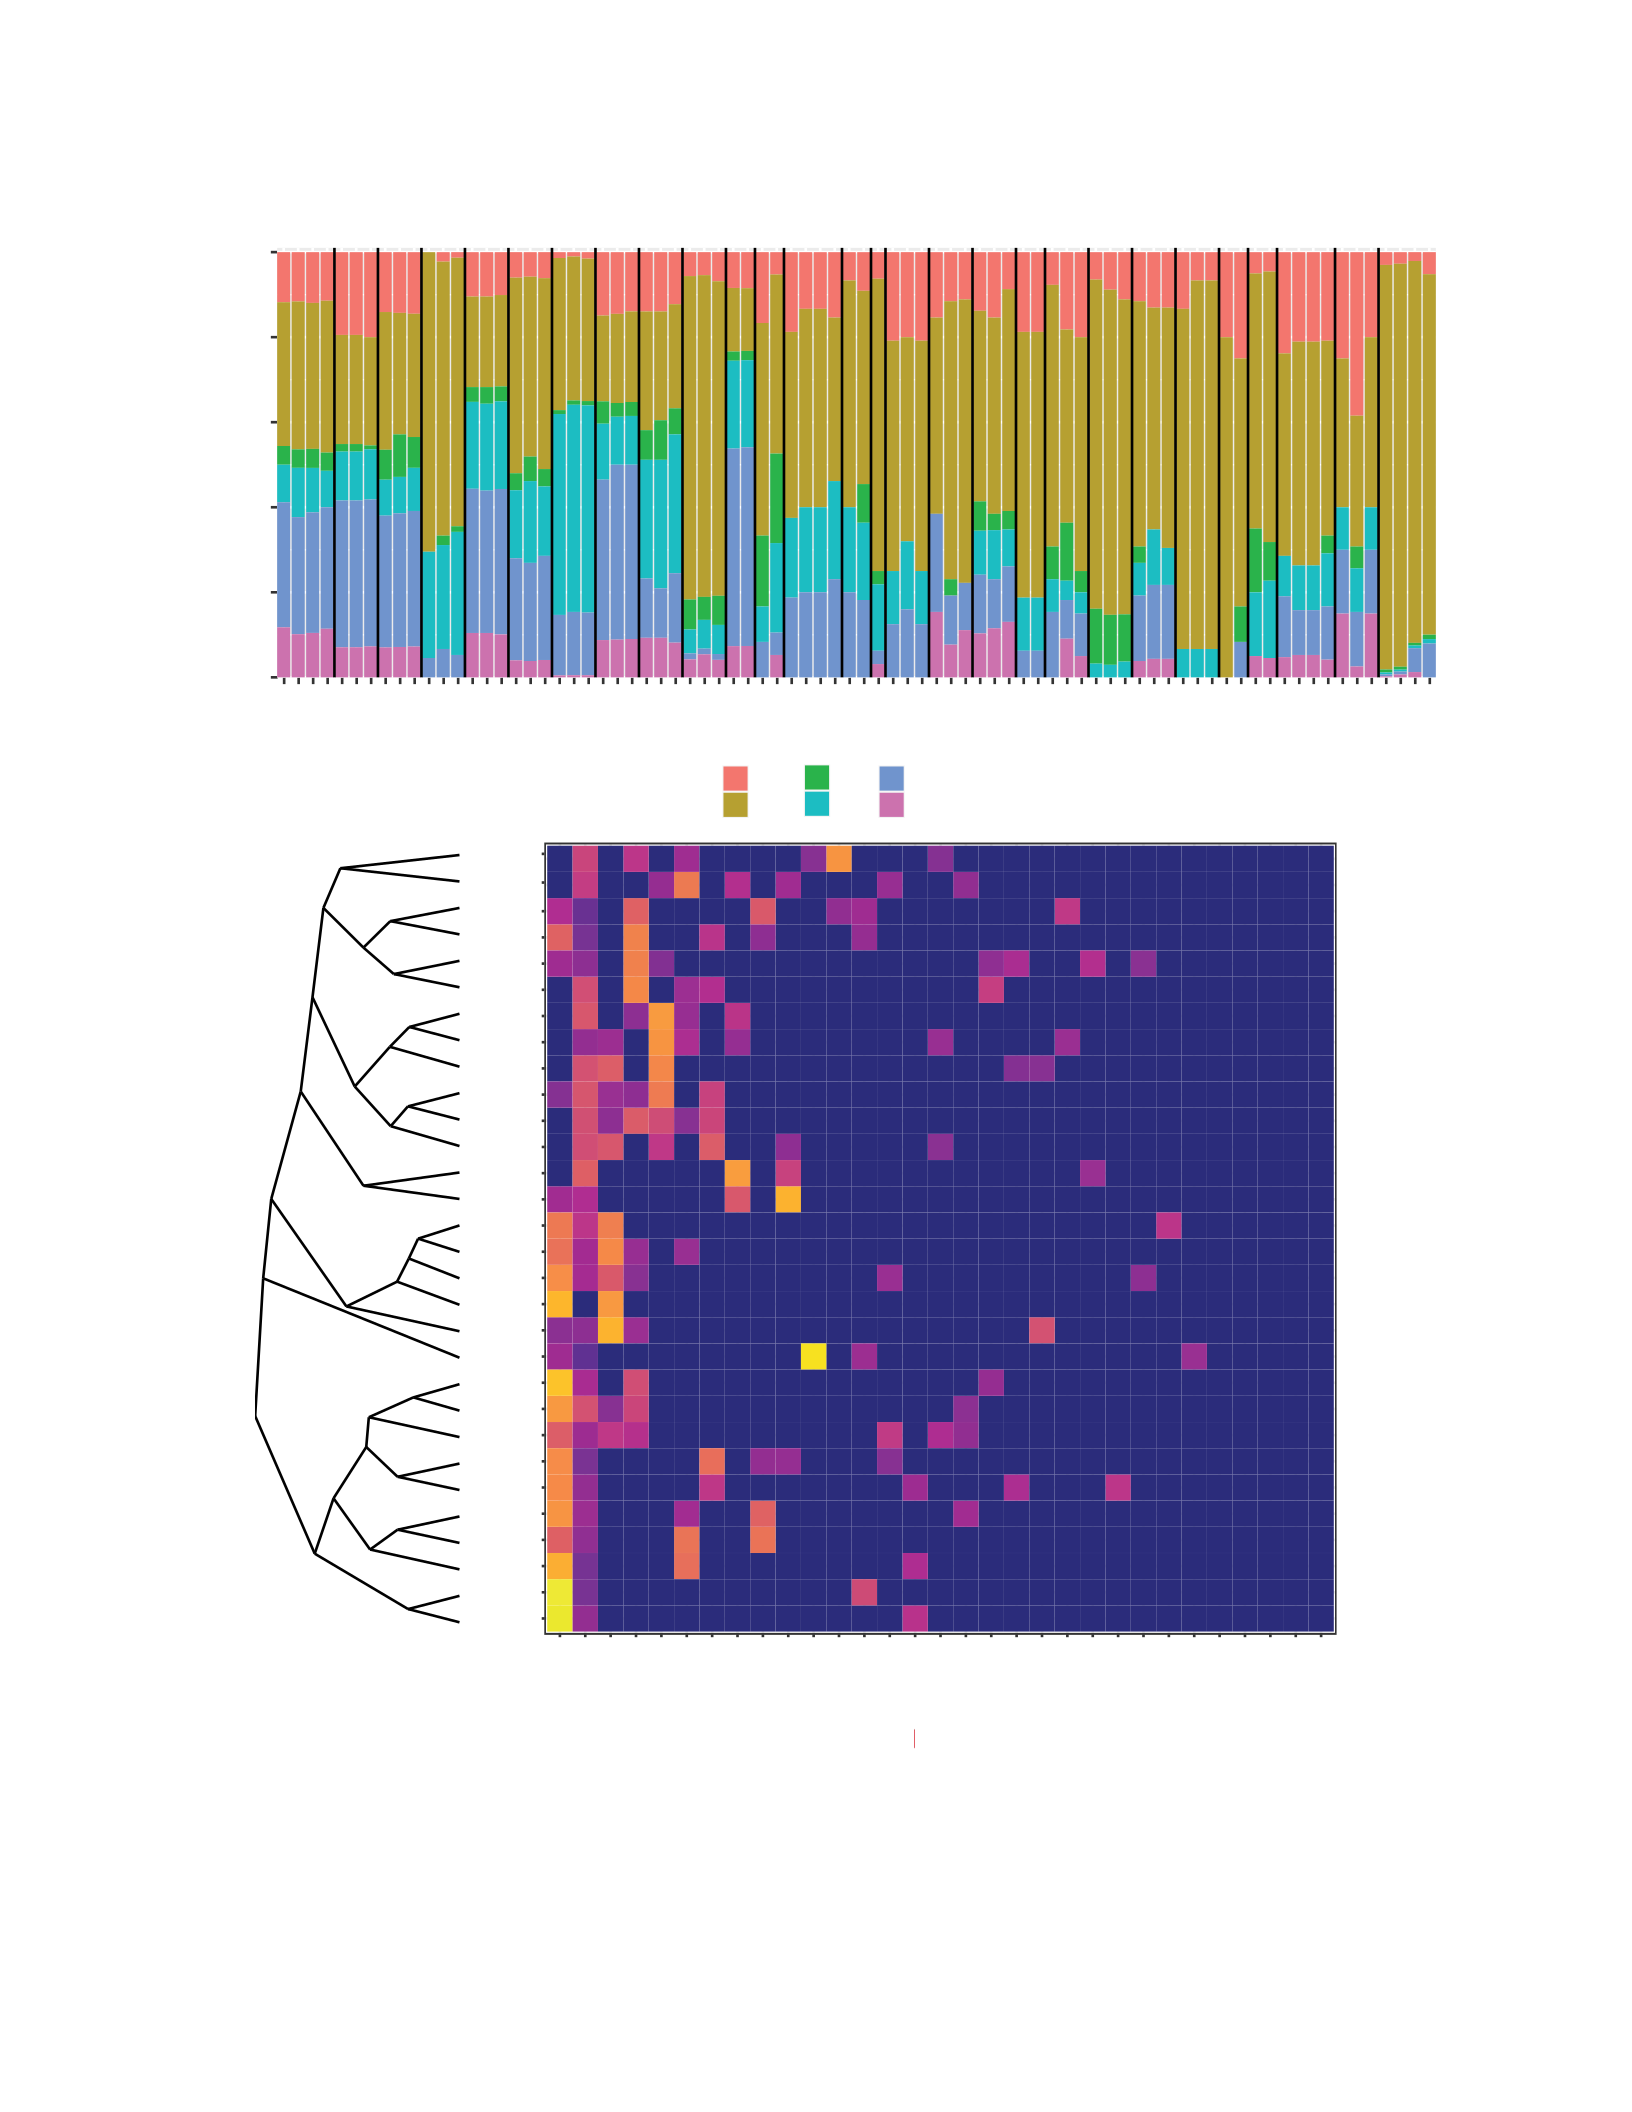
cohort, GBM065.Re represented an outlier with 5,750 somatic mutations identified across 4
distinct tumor regions. Most of the variants within this sample displayed the characteristic
mutational signature associated with prior temozolomide treatment (Fig. 2-3a-b), suggesting a
treatment-induced hypermutated phenotype213,214. Within the BrMET specimens,
31
1
10
10 0
10 00
Mutation Burden
ZNFX1
ADGB
BNC 2
CD H9
CSMD 2
EGFR
FCGBP
FOXC2
HC N4
LR P2
NF1
NL RP5
PCM1
VWA2
ZNF831
HC N1
IDH1
MUC 16
PTEN
SLIT3
FRAS1
TP53
0102030
% Mut an t
GBM030
GBM032
GBM051
GBM052
GBM055
GBM056
GBM059
GBM062
GBM063
GBM064
GBM069
GBM070
GBM074
GBM079
AO0 83
GBM018.Re
GBM031.Re
GBM047.Re
GBM065.Re
Mutation Type
Misse nse
Stop Gained
Frame shift
Inframe D ele ti on
Spl ice Re gio n
Ca ncer type
TERT promoter
Sample n =19
Clinical Data
Yes
No
Prima ry Glioma
Re c. Glioma
1
10
10 0
10 00
Mutation Burden
SCN 2A
SI
SLITRK1
SPEN
SPTA1
SYNE1
SYNE2
TENM3
THSD7A
TME M132 C
TSHZ3
VWA5B1
ZFR2
ZNF800
CH D7
COL5 A1
DMD
FAM47C
FLG
LR P1B
ZFHX4
MUC 16
RYR2
TTN
TP53
0204060
% Mut an t
BrMET008
BrMET009
BrMET010
BrMET018
BrMET019
BrMET023
BrMET024
BrMET025
BrMET027
BrMET028
BrMET058
Sample n =11
Brea st Ca ncer
Mel ano ma
NSC LC
SCL C
1
2
3
4
5
6
7
8
9
10
11
12
13
14
15
16
17
18
19
20
21
22
−1
0
1
2
G−score
Glioma
1
2
3
4
5
6
7
8
9
10
11
12
13
14
15
16
17
18
19
20
21
22
0
1
G−score
BrMET NSCLC
1
2
3
4
5
6
7
8
9
10
11
12
13
14
15
16
17
18
19
20
21
22
−2
−1
0
1
2
3
4
G−score
BrMET BRCA
ab
cd
e
f
g
Variant Count
Breast Cancer
Melanoma
NSCLC
SCL C
Primary Glioma
Rec. Glioma
Ca ncer type
TERT promoter
CDC42BPB
OR5D13
MGAT5B
15 Pri mary Glioma s
4 Recurrent Gliomas
11 Bra in Metastase s
Mul ti -sector tumor sequ encing
92 t umo r re gio ns
Whole exome seque ncing
an d neo antig en pre dictio n
RN A se quencin g and
immu ne pro filin g
TCR sequencing
EGFR
CD KN2A
CD K4
KRAS
ERBB2
10 0
50 0
10 00
20 00
40 00
60 00
Glioma
BrMET
Figure 2-2: Genomic landscape of brain tumor cohort. a, Overview of sample collection, sequencing, and
data analysis. b, Variant counts per tumor pooled across samples. c, Summary of top 25 recurrently mutated
genes (3 or more tumors) in 11 brain metastases. d, Summary of recurrently mutated genes (3 or more tumors)
in 19 primary and recurrent gliomas. e, Cohort-level copy number variation in gliomas determined by the GISTIC
algorithm. Dashed lines indicate significantly recurrent amplifications (red) and deletions (blue) at an FDR < 0.1.
f, NSCLC brain metastasis cohort GISTIC output. g, Breast cancer brain metastasis cohort GISTIC output.
32
BrMET023
GBM079
GBM032
GBM064
BrMET027
BrMET028
GBM055
GBM065.Pri
GBM052
GBM030
GBM031.Re
GBM074
AO083
GBM069
GBM018.Re
GBM070
GBM065.Re
GBM047.Re
GBM059
GBM056
GBM062
GBM063
BrMET018
BrMET024
BrMET010
BrMET008
BrMET025
BrMET009
BrMET019
BrMET058
Sig nature.1
Un known
Sig nature.16
Sig nature.8
Sig nature.4
Sig nature.3
Sig nature.5
Sig nature.13
Sig nature.9
Sig nature.2
Sig nature.11
Sig nature.7
Sig nature.23
Sig nature.29
Sig nature.28
Sig nature.25
Sig nature.21
Sig nature.19
Sig nature.24
Sig nature.26
Sig nature.12
Sig nature.18
Sig nature.15
Sig nature.27
Sig nature.10
Sig nature.30
Sig nature.6
Sig nature.14
Sig nature.17
Sig nature.20
Sig nature.22
0.00 0
0.00 5
0.01 0
0.01 5
0.02 5
Proportion
b
a
A>G
C>T
A>C
C>G
C>A
A>T
0
20
40
60
80
10 0
12341
BrMET009 2 31
BrMET010 2 31
BrMET018 2 31
BrMET019 2 31
BrMET023 2 31
BrMET024 2 31
BrMET025 2 31
BrMET027 2 31
BrMET028 2 324121234
GBM052 1 3
GBM055 2 1
GBM056 2 31
GBM059 2 31
GBM062 2 31
GBM063 2 1
GBM069 2 31
GBM070 2 31
GBM074 2 31
GBM079 2 31
AO83 2 1312341
GBM047.Re 2 31234
% Tot al M utation s
BrMET008
BrMET058
GBM030
GBM018.Re
GBM065.Re
GBM031.Re
GBM032
Figure 2-3: Mutation al spectrum and sign atures across cohort. a, Spectrum of single-nucleotide
variants across cohort. b, Distribution of mutational signatures across cohort generated by deconstructSigs.
Signature descriptions at http://cancer.sanger.ac.uk/cosmic/signatures.

33
recurrent mutations were identified in TP53 across all histologies (7/11 overall; 3/5 NSCLC, 2/4
breast carcinoma) (Fig. 2-2c). KRAS alterations were identified within 2/5 NSCLC tumors and
PIK3CA mutations were present in 2/4 breast carcinomas consistent with their high incidence in
studies of primary samples215,216. Additionally, TERT promoter mutations were observed in both
a melanoma and NSCLC BrMET tumor. Across the GBM samples, we identified recurrent
mutations in canonical GBM-associated genes such as the TERT promoter (14/18), TP53 (7/18),
PTEN (4/18), NF1 (3/18), and EGFR (3/18) (Fig. 2-2d). This high frequency of TERT promoter
mutations mirrors earlier work estimating frequencies upwards of 70-80% among GBM217,218.
Additionally, the frequency of TP53 alterations is consistent with prior studies observing
mutations in 30-40% of GBM samples, while the frequency of EGFR mutations is slightly
lower207,218. We next assessed the prevalence of copy number alterations (CNAs) within our cohort
and identified classical GBM-associated changes such as frequent chromosome 7 amplification
encompassing EGFR (17/18), chromosome 9 deletions of the CDKN2A locus (15/18), and
chromosome 10 deletions of the PTEN locus (17/18) (Fig. 2-2e). These amplifications and
deletions have been detected at comparably high frequencies across several other studies207,218.
The metastatic tumors displayed alterations similar to those previously defined for their
corresponding primary tumor such as amplifications of KRAS (3/5) in NSCLC and ERBB2 (2/4)
in breast carcinomas (Fig. 2-2f,g).
2.2.2 Intratumoral genomic heterogeneity of gliomas and BrMETs
Having characterized all variants in our glioma and BrMET cohorts, we next sought to
characterize the extent of intratumoral genomic heterogeneity within all tumors. First, we
categorized all variants in each sample as either “clonal” (present in all sequenced regions of a

34
tumor), “subclonal shared” (present in more than one region of a tumor but not all), or “subclonal
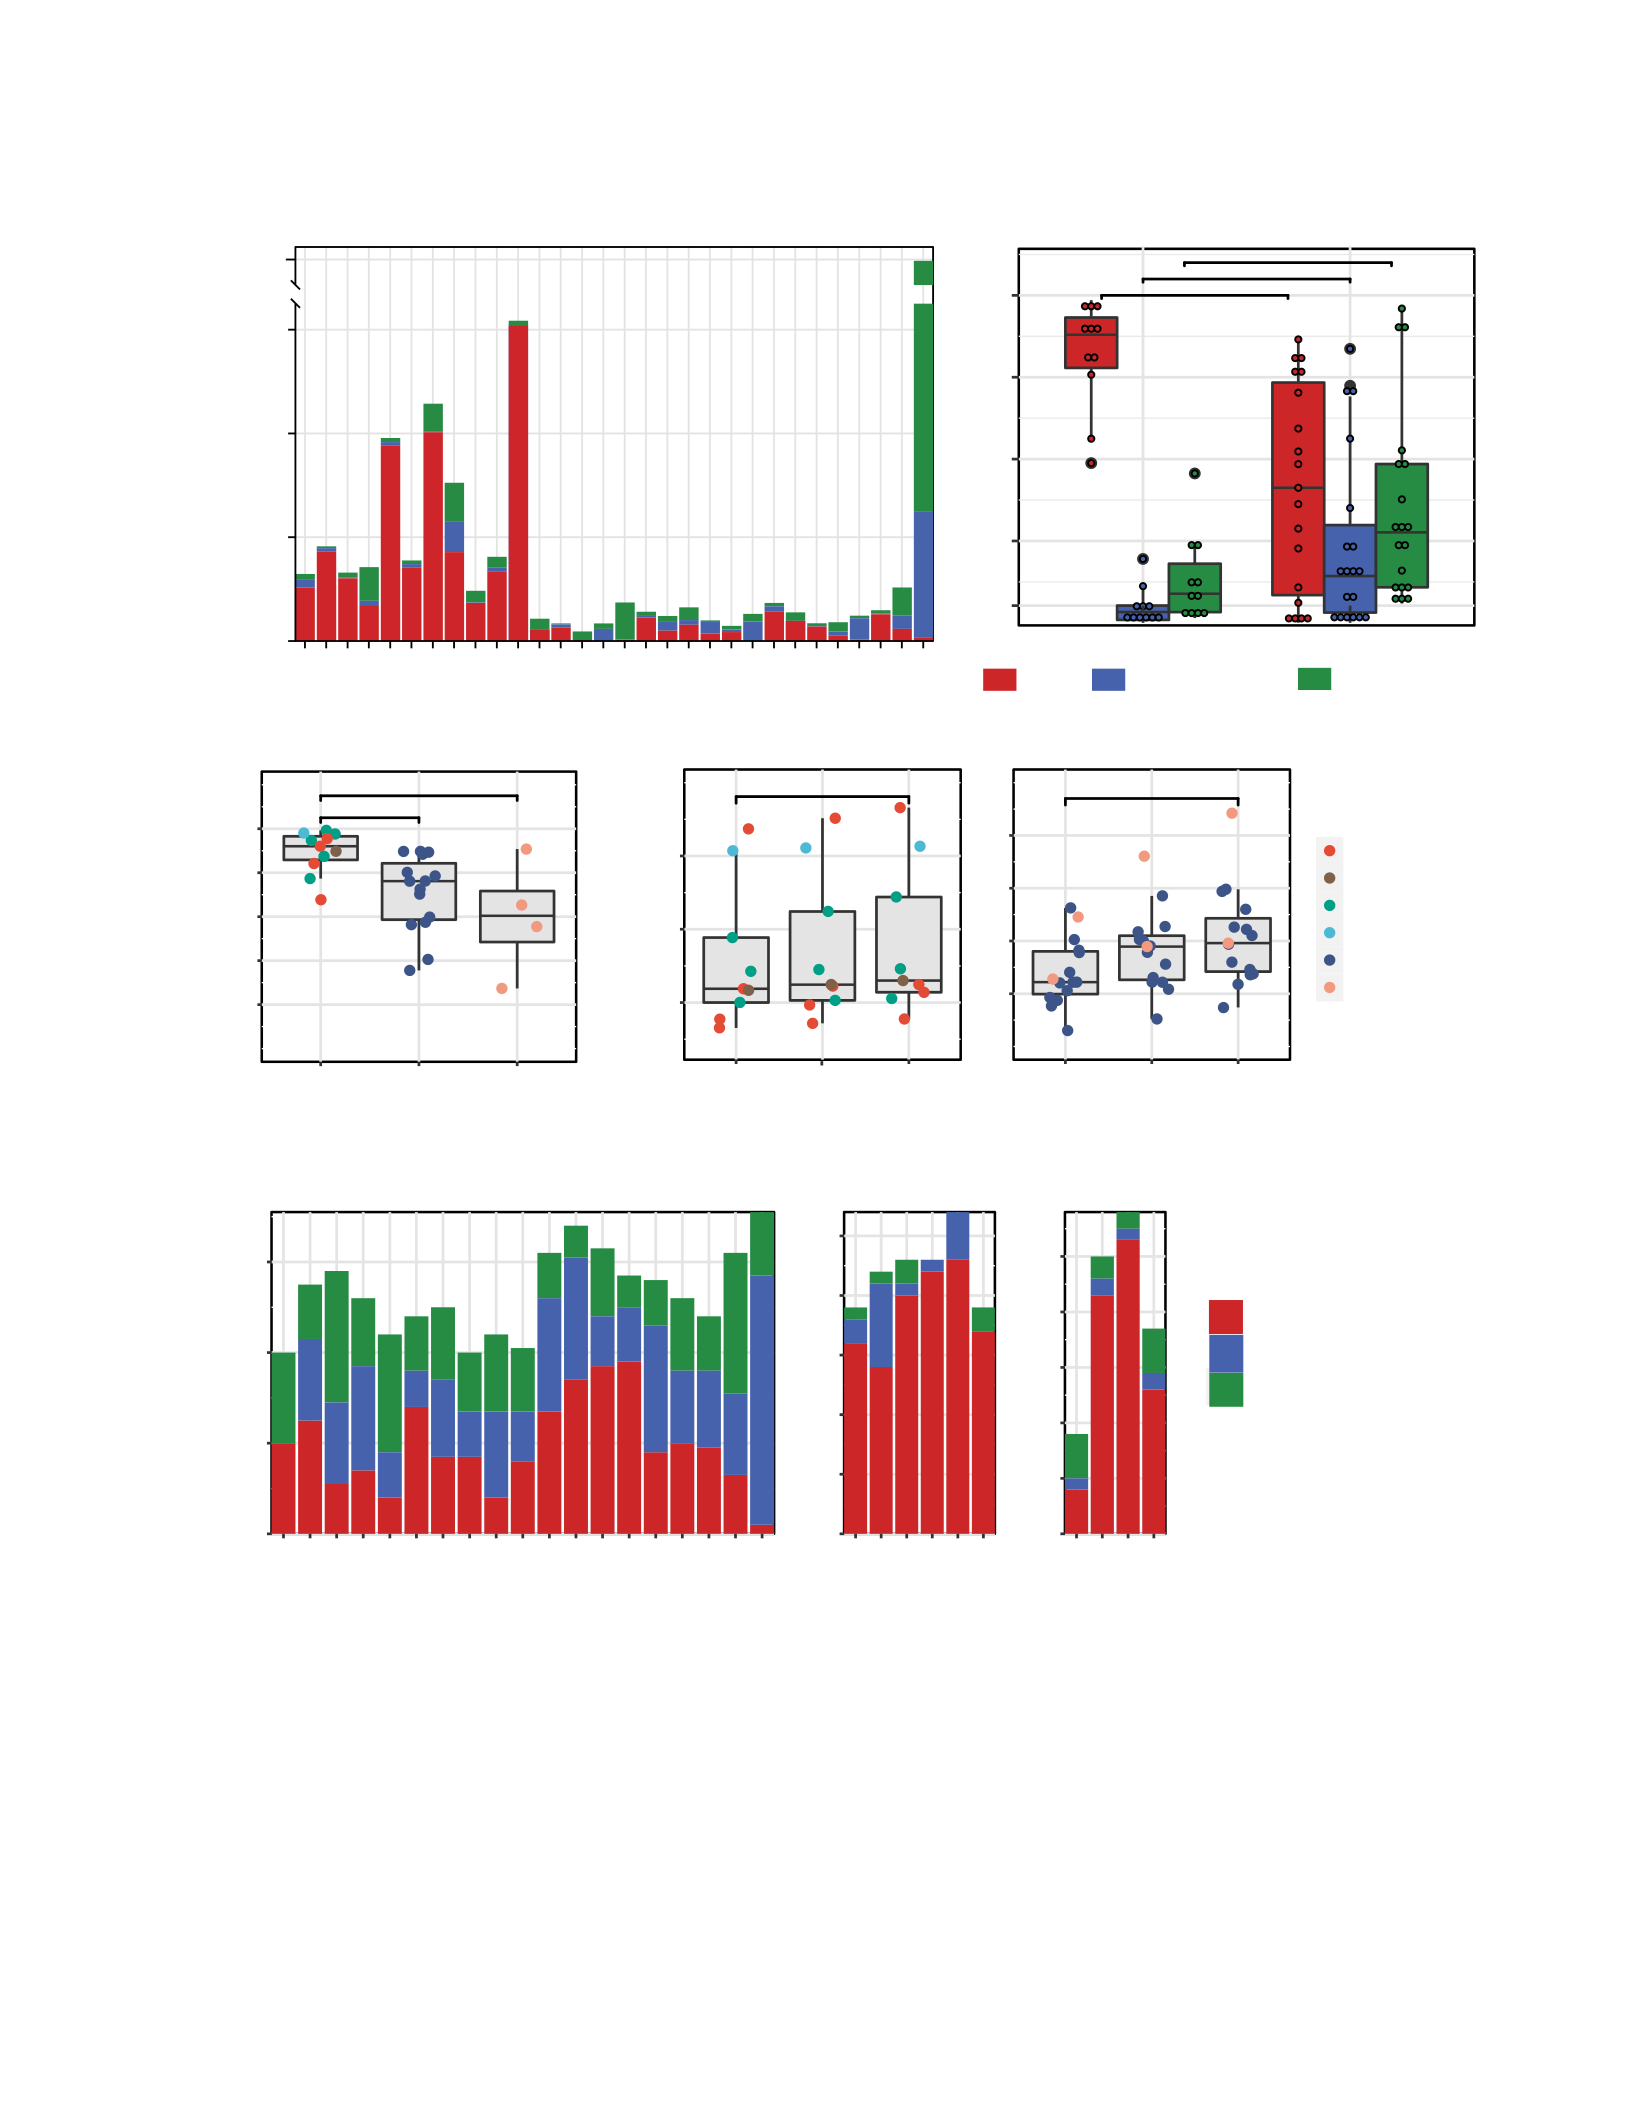
private” (only present in one region of a tumor). We observed a striking difference between tumor
types with a significantly (p<0.001; unpaired t-test) greater clonal variant fraction within the
BrMETs (median=0.88) than within gliomas (median=0.41) (Fig. 2-4a,b). Importantly, this
observation was independent of the histology of the primary malignancy, as lung, breast and
melanoma metastases all harbored a high fraction of clonal variants. In contrast, gliomas (primary
and recurrent samples pooled) contained a higher fraction of both subclonal shared (p<0.05;
unpaired t-test) and subclonal private (p<0.05; unpaired t-test) variants than did the BrMETs
(median subclonal private variant fraction 0.28 vs. 0.09) (Fig. 2-4b). Overall, approximately 43%
of mutations within the glioma cohort were categorized as clonal. While this is slightly lower than
two previous studies have reported, almost all of those tumors had only two spatially separate
regions analyzed, in contrast to the three or four sectors sequenced in our study207,219. Focusing
specifically upon cancer driver genes, mutations in TP53, PIK3CA, and KRAS were clonal in all
cases among BrMET samples. In contrast to the generalized heterogeneity of gliomas, a significant
majority of TERT promoter (13/14 clonal), TP53 (6/7), and EGFR (3/3) mutations were clonally
distributed. However, most PTEN (1/4 clonal) and NF1 (0/3) alterations were not clonal within
gliomas. These findings are largely consistent with a prior multisector sequencing study that noted
significant clonality of TERT promoter and TP53 mutations207. However, this same group did note
a majority of identified EGFR mutations were subclonal private in contrast to our cohort207.
To explore the translational implications of this heterogeneity, we calculated the fraction
of total tumor variants that would have been identified from sequencing a single glioma or BrMET
tumor site, which simulates the information that would be obtained from a single-site biopsy at
35
**
*
0.2
0.4
0.6
0.8
1.0
BrMET
Primary
Glioma
Fraction Variants Identified
Breast Cancer
Melanoma
NSCLC
SCL C
Primary Glioma
Rec. Glioma
Single Site Sequencing
N.S.
25 0
50 0
75 0
1 Site
2 Sites
3 Sites
Tot al Variants Identified
BrMET
*
50
10 0
15 0
20 0
1 Site
2 Sites
3 Sites
Glioma
0
20
40
60
GBM030
GBM032
GBM051
GBM052
GBM055
GBM056
GBM059
GBM062
GBM063
GBM064
GBM069
GBM070
GBM074
GBM079
AO083
GBM018.Re
GBM031.Re
GBM047.Re
GBM065.Re
CNV Count
Glioma
0
5
10
15
20
25
BrMET008
BrMET009
BrMET010
BrMET019
BrMET025
BrMET058
BrMET NSCLC
0
10
20
30
40
50
BrMET018
BrMET023
BrMET024
BrMET027
BrMET BRCA
*** **
0.00
0.25
0.50
0.75
1.00
BrMET
Proportion
Clonal Subclonal Shared Subclonal Privat e
Recurrent
Glioma
Subclonal Privat e
Subclonal Shared
Clonal
ab
c d
e
Glioma
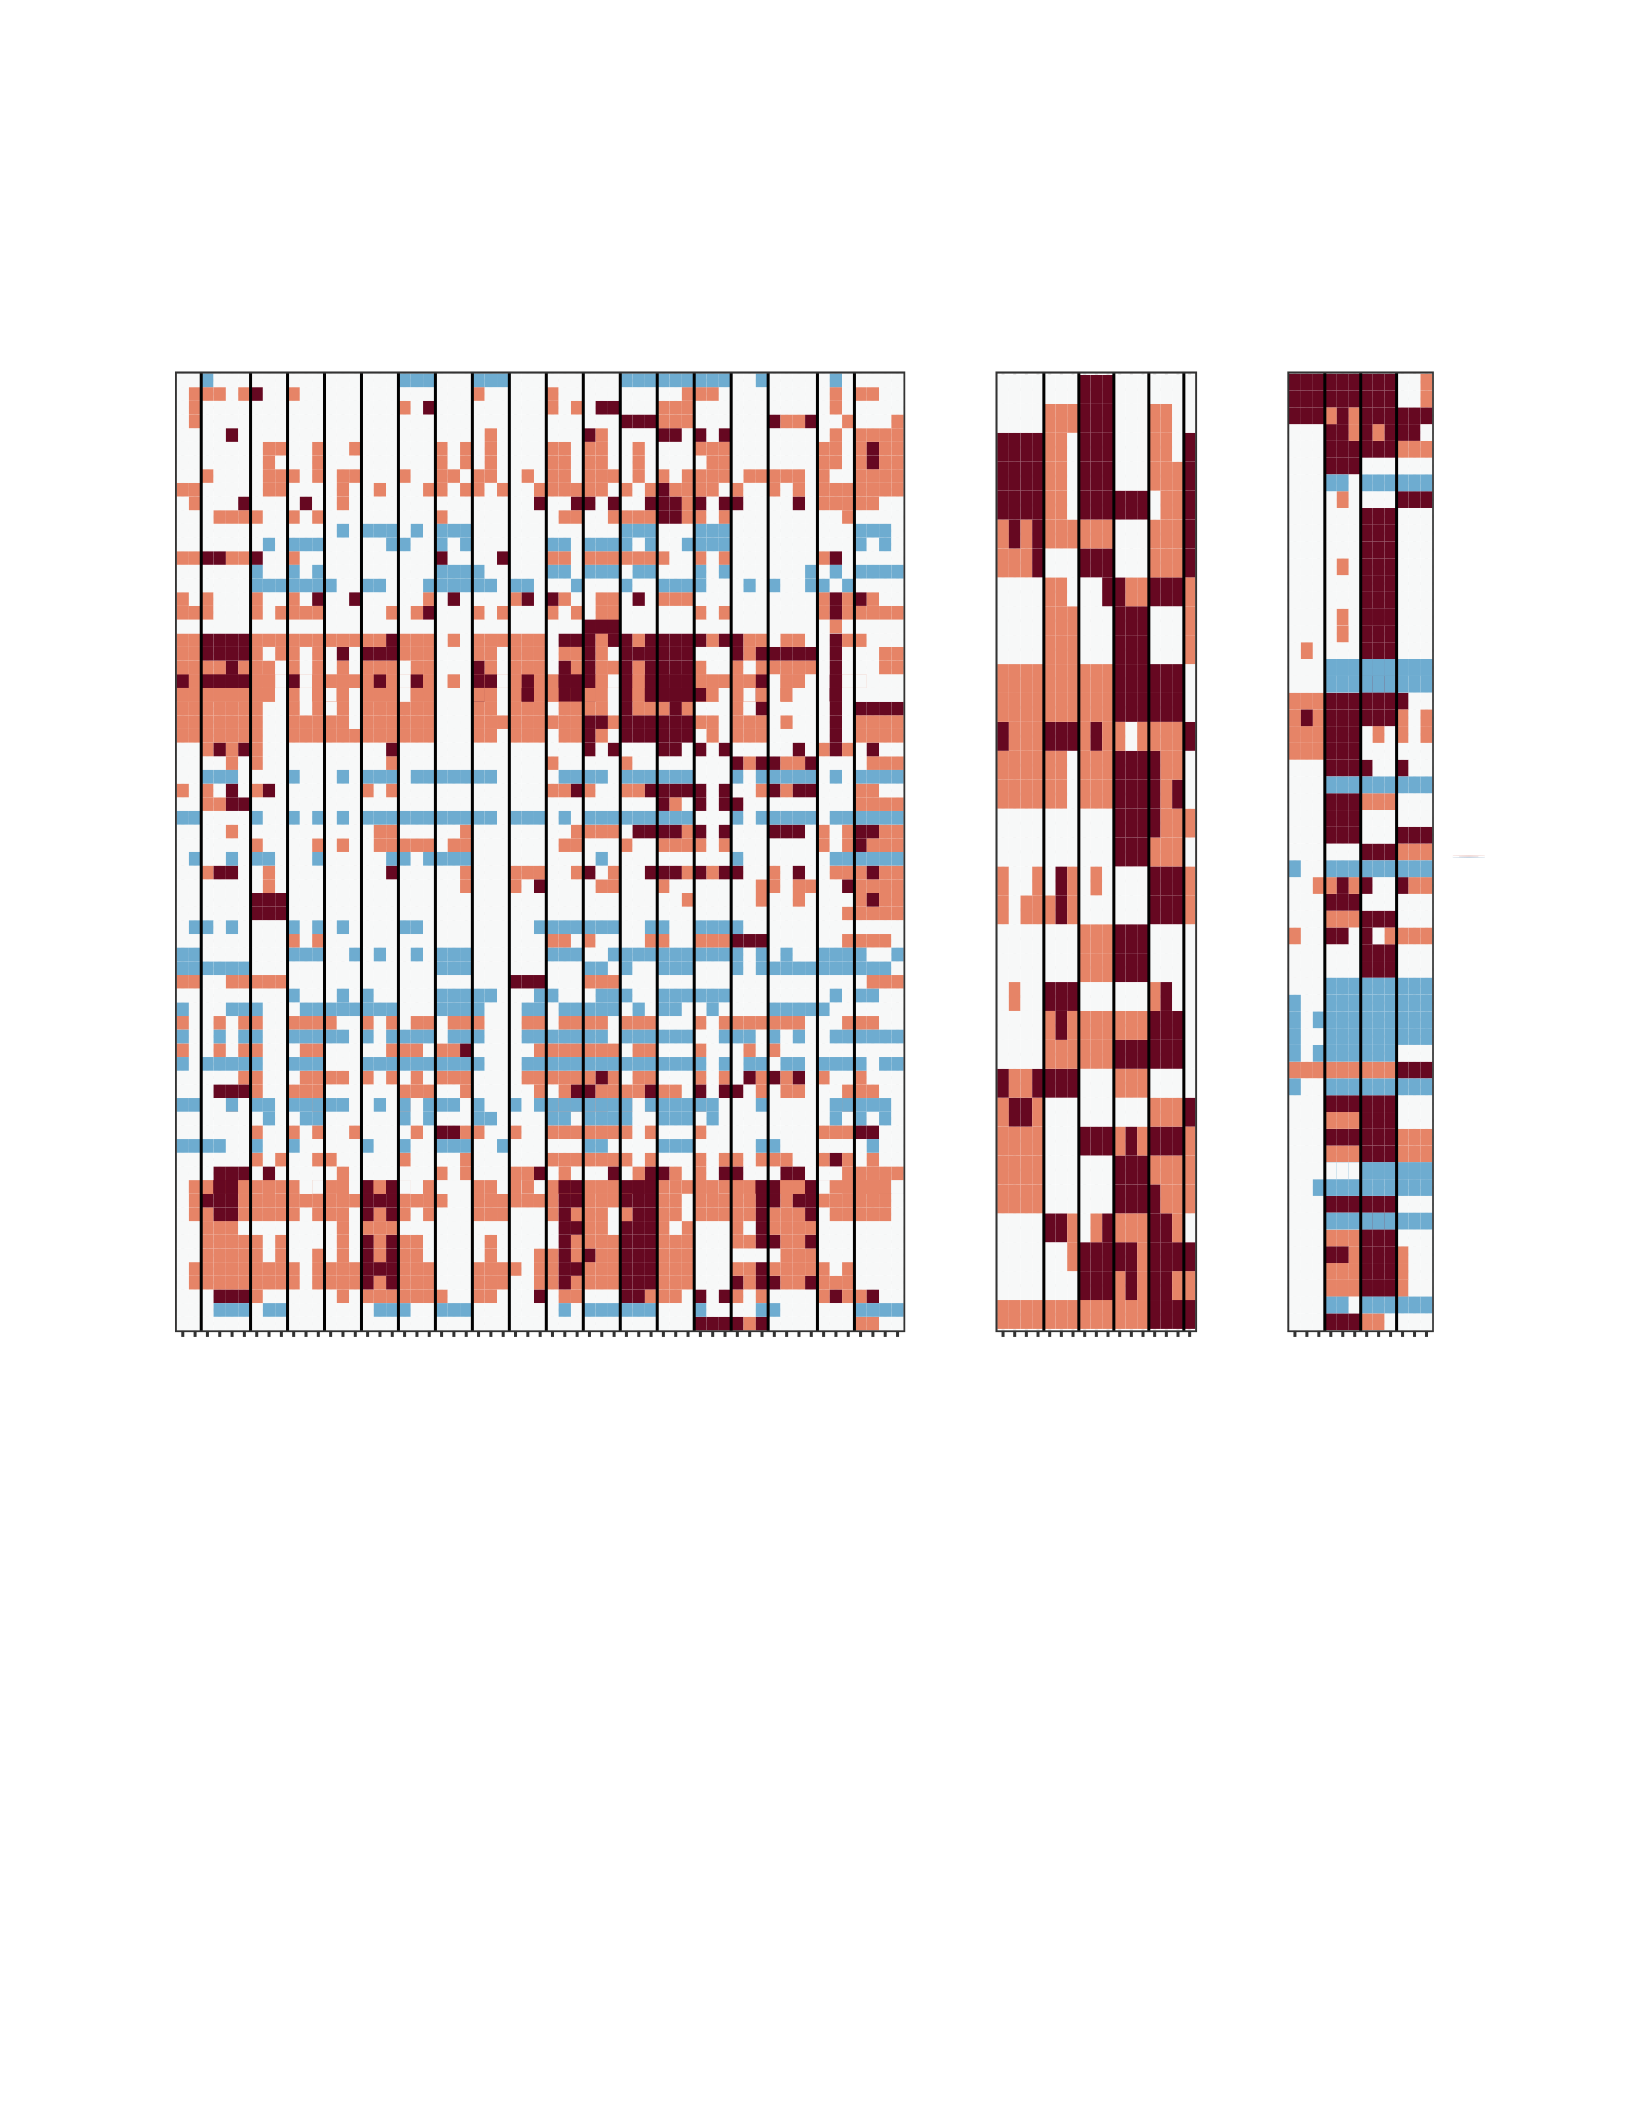
Figure 2-4: Intratumoral genomic heterogeneity of variants and copy number alterations. a, Variant
clonality per tumor. b, Proportion of clonal, subclonal shared, and subclonal private variants in brain metastases
and gliomas. Significance determined by unpaired t-test. *p< 0.05, ***p< 0.001. c, Proportion of total identified
variants that would have been captured through the sequencing of a random single site from within each tumor.
Significance determined by unpaired t-test. *p< 0.05, **p< 0.01. d, Total variants identified per tumor if one,
two, or three samples were pooled for analysis. Significance determined by unpaired t-test. *p< 0.05. e, Copy
number variation (CNV) clonality per tumor in the gliomas (left), NSCLC brain metastases (middle), and breast
cancer brain metastases (right) cohorts.
BrMET008
BrMET009
BrMET010
BrMET018
BrMET019
BrMET023
BrMET024
BrMET025
BrMET027
BrMET028
BrMET058
GBM030
GBM032
GBM051
GBM052
GBM055
GBM056
GBM059
GBM062
GBM063
GBM064
GBM069
GBM070
GBM074
GBM079
AO083
GBM018.Re
GBM031.Re
GBM047.Re
GBM065.Re
0
40 0
80 0
12 00
60 00
Variant Co unt

36
surgery. We observed that a higher fraction (p<0.01; unpaired t-test) of the total variants were
identified within BrMETs (median=0.92) compared to primary gliomas (median=0.73) when
sampling a single site (Fig. 2-4c). Given the limitations of single-site sampling to capture tumor-
wide variant information in gliomas, we determined the extent to which multi-region sequencing
could lead to the identification of additional tumor variants within our cohort. Among the BrMETs,
sampling additional tumor regions did not identify significantly more variants. However, among
glioma samples, sequencing three regions instead of one raised the median number of identified
variants from 61 to 98 (Fig. 2-4d). Thus, multi-region sequencing in gliomas captures a more
complete picture of the genomic landscape but provides only limited improvement in the
characterization of BrMETs due to their increased comparative spatial genomic homogeneity.
Having characterized glioma and BrMET genomic architecture at the variant level, we next
sought to characterize the intratumoral heterogeneity of CNAs to determine if there is evidence for
spatial architecture that is similar to that of the variants. Strikingly, the landscape of CNAs within
gliomas was markedly more spatially heterogeneous than the pattern observed within BrMETs
(Fig. 2-5). When we classified each CNA event as clonal, subclonal shared, or subclonal private,
we identified a significant fraction of clonal CNAs within BrMETs in contrast to the
predominantly subclonal CNAs within gliomas (Fig. 2-4e). Thus, at both the variant and CNA
level, gliomas are significantly more spatially heterogeneous than BrMETs.
Finally, to characterize these samples at the transcriptional level, we made use of a
previously defined gene expression-based molecular classification of GBM into proneural, neural,
classical, and mesenchymal subtypes172. We identified a distribution of transcriptional subtypes
with 12 neural, 12 classical, 16 mesenchymal, and 6 proneural subtypes across the 46 primary or
recurrent GBM tumor sectors. Intriguingly, in a majority (9/16) of the tumors with multiple regions
37
22q12.2
21q22.3
20q11.1
19q13.43
19q13.42
19q13.31
19q13.12
19q13.2
19p13.12
19p13.11
19p13.2
18p11.1
17p13.2
17p13.1
17p11.2
16q23.1
16q21
16q11.1
16p13.11
16p13.3
16p12.3
16p12.1
16p11.2
15q14
14q24.1
14q11.2
13q21.33
13q13.1
12q24.31
12q24.23
12q15
12q14.1
12q13.12
12q11
12p13.33
11q12.3
11p11.11
10q23.31
10q11.1
9q11
9p21.3
9p13.3
8p11.1
7q36.3
7q34
7q31.32
7q22.1
7q11.23
7p22.1
7p11.2
7p11.1
6q21
6p22.2
6p21.33
6p12.2
5q32
5q31.3
5p13.3
4q34.3
4p16.3
3q11.1
3p14.3
2q31.2
2q11.2
2q11.1
2p11.1
1q32.1
1q21.2
1p36.33
1p36.23
1
2
1
23
4
1
GBM051 2 3
1
GBM052 2 3
1
GBM055 2 3
1
GBM056 2 3
1
GBM059 2 3
1
GBM062 2 3
1
GBM063 2 3
1
GBM064 2 3
1
GBM069 2 3
1
GBM070 2 3
1
GBM074 2 3
1
GBM079 2 3
1
AO8 3 2 3
1
GBM018.Re 2 3
1
GBM031.Re 2 3
4
1
GBM047.Re 2 3
1
2
3
4
Glioma
20q11.22
19p13.2
19p12
18p11.1
17q25.3
17q24.1
14q11.2
13q33.2
12p12.1
11q13.2
11p11.11
9p11.1
8p21.1
8p12
7p22.1
7p11.1
6q26
6q24.3
6p25.1
6p23
6p21.33
5p15.2
5p13.2
3q27.2
3q25.1
3q11.1
2q24.2
2q11.1
1q42.2
1q21.3
1q21.2
1p36.33
1p36.12
1
Br ME T00 8 2 3
4
1
Br ME T00 9 2 3
1
Br ME T01 0 2 3
1
Br ME T01 9 2 3
1
Br ME T02 5 2 3
Br ME T05 8 2
BrMET NSCLC
21q22.3
19p13.3
17q25.1
17q24.1
17q23.2
17q21.33
17q21.31
17q12
17p12
17p11.2
16p13.11
16p11.2
15q26.3
15q26.1
15q22.2
14q32.31
13q33.3
13q14.2
13q13.1
13q12.3
12q24.23
12q24.12
12q24.11
12q11
11q13.3
11q13.1
11p11.11
10q23.31
9p24.1
8q24.13
8q21.13
8q13.3
8p21.3
8p11.1
7q31.1
7q22.1
7q11.23
7p11.1
6q27
6q25.3
6q25.1
6q24.1
6q23.3
6q22.33
6q22.31
6q21
6q15
6q14.1
6q12
6p21.1
4q35.2
4q21.1
3q26.2
3q11.1
1q44
1q32.2
1q21.2
1
Br ME T01 8 2 3
1
Br ME T02 3 2 3
1
Br ME T02 4 2 3
1
Br ME T02 7 2 3
BrMET BRCA
−2
−1
0
1
2
GBM032
GBM030
GBM065.Re
Figure 2-5: Intratumoral landscape of recurrent copy number variation events. Copy number variation
events in gliomas (left), non-small cell lung cancer brain metastases (middle) or breast cancer brain metastases
(right). Colors depict relative intensity of copy number alterations per sample. Positive scores in red indicate
amplifications and negative scores in blue indicate deletions.
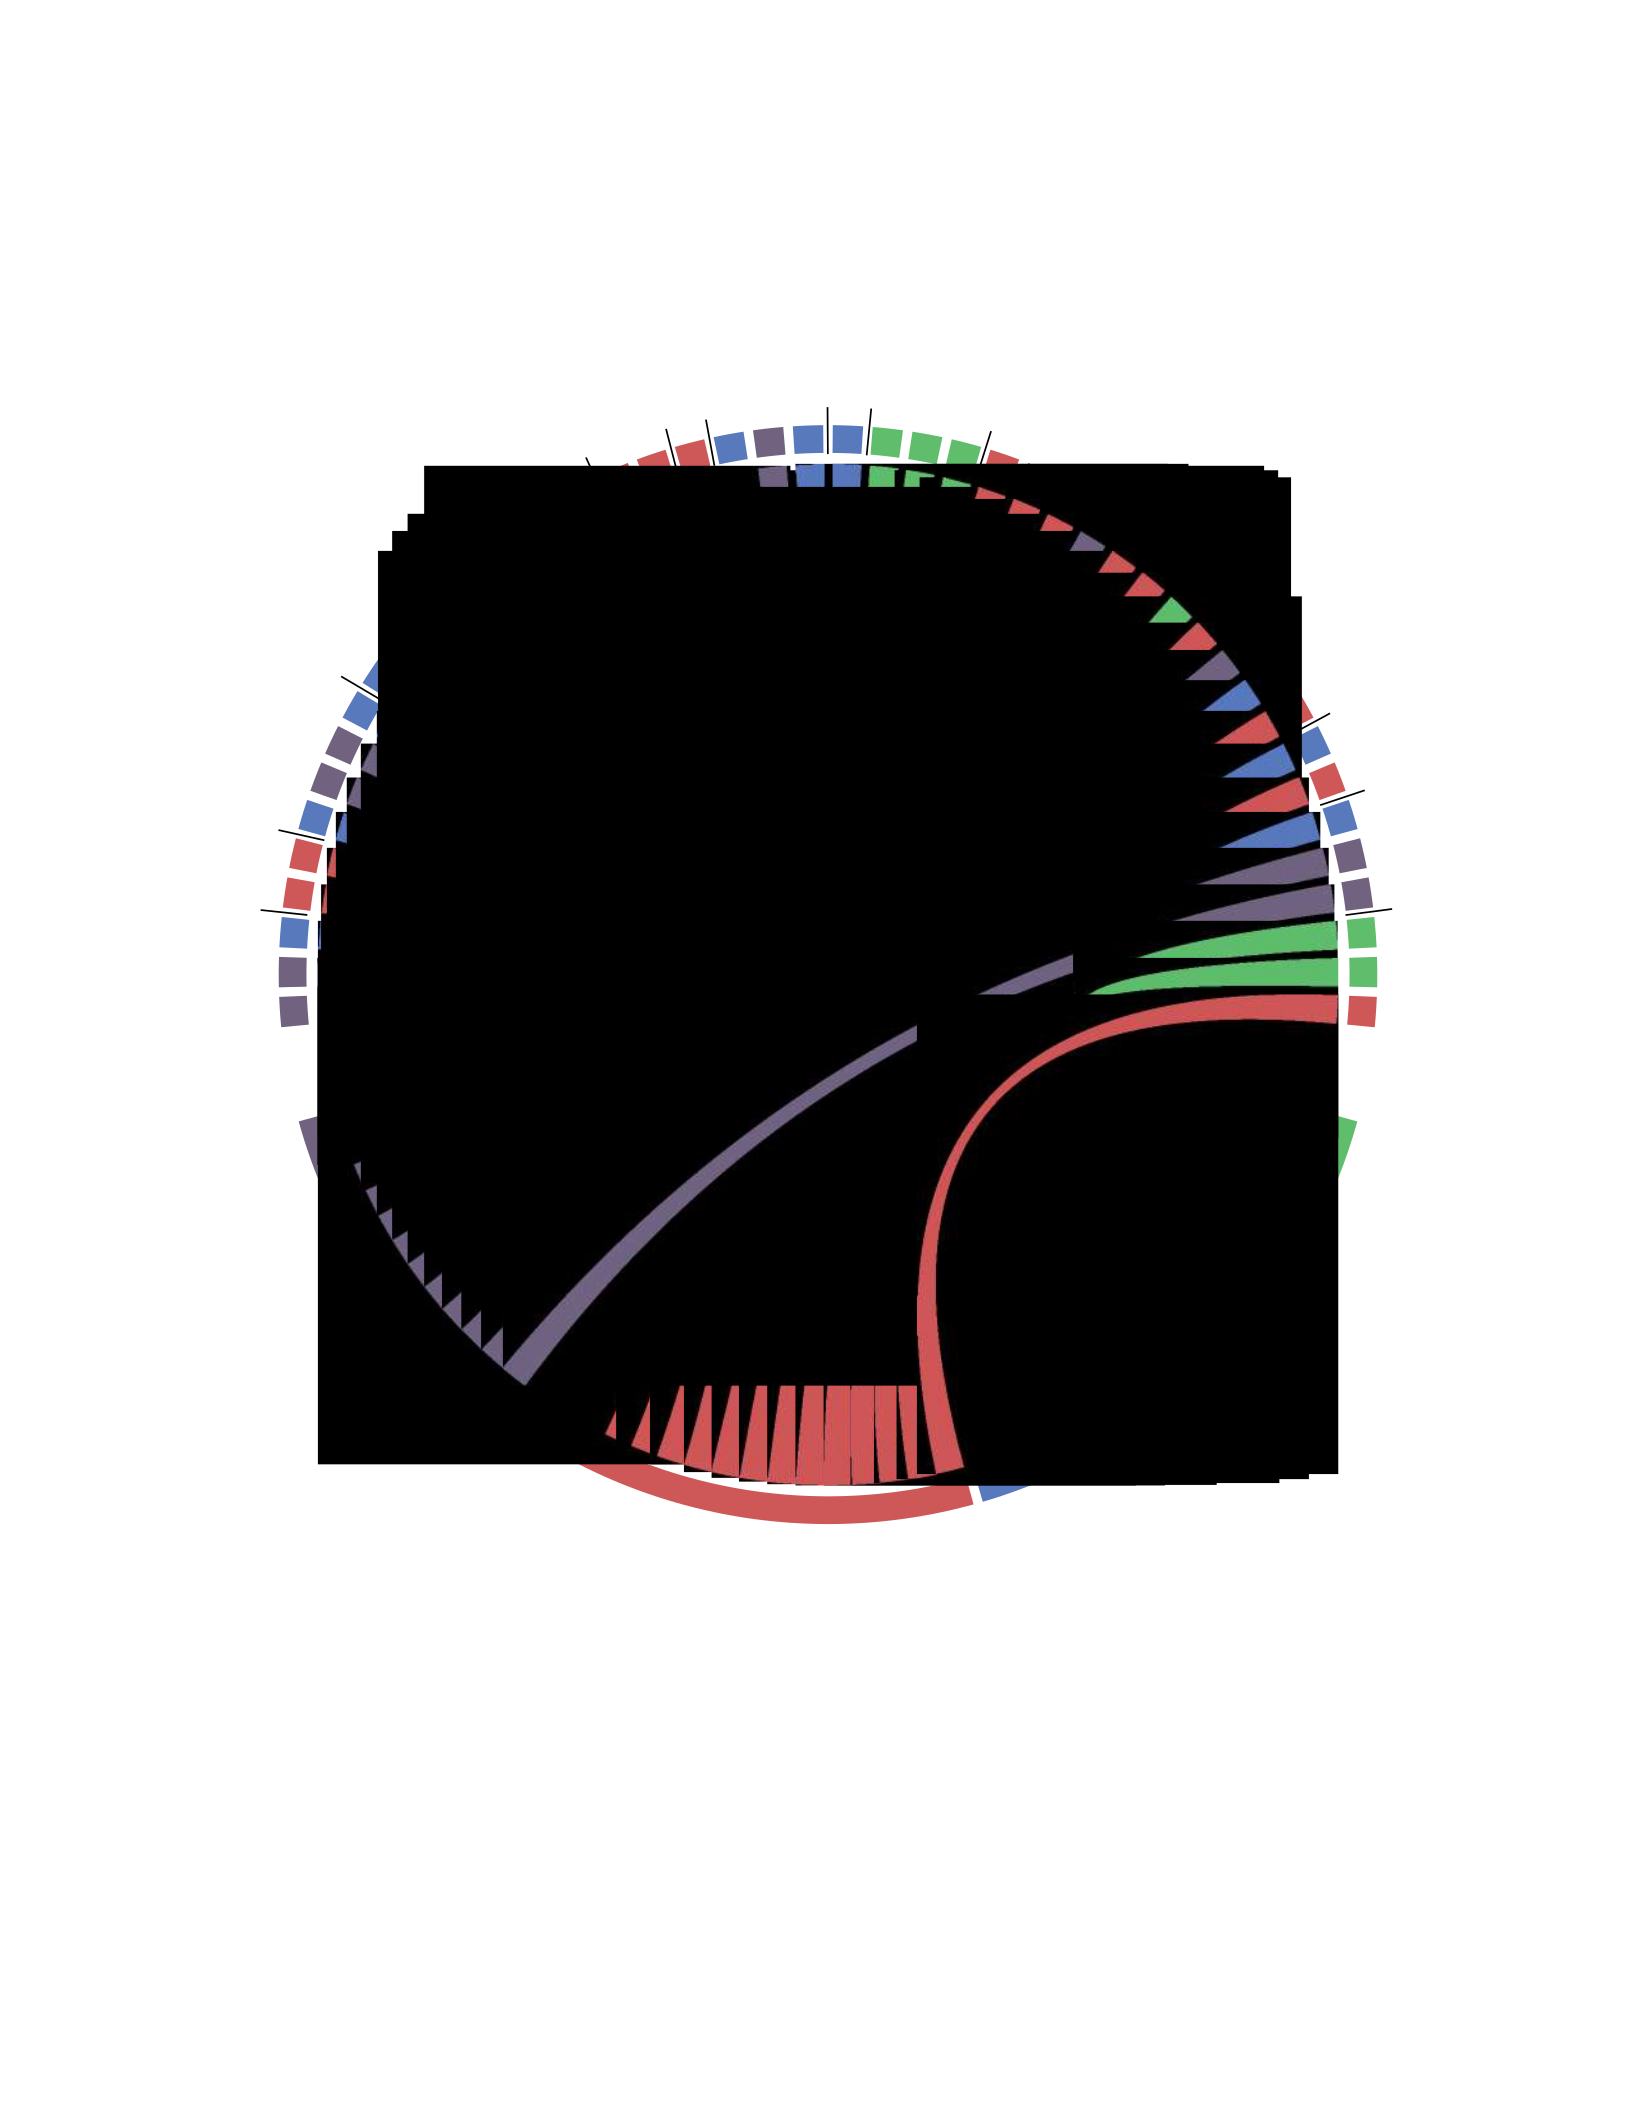
38
Figure 2-6: Molecular subtype classification of GBM. Circos plot displaying the classification of each tumor
region among the four molecular subtypes of GBM. Classification was determined by gene set enrichment
analysis on previously defined gene signatures (see Methods).
Neural
Mesenchymal
Classical
Proneural
GBM018.Re
GBM030
GBM031.Re
GBM032
GBM047.Re
}
GBM051
GBM052
}
GBM055
GBM056
}
GBM059
GBM062
GBM063
GBM064
GBM065.Re
}
GBM069
GBM070
GBM074
GBM079

39
analyzed, we observed intratumoral heterogeneity of these transcriptional subgroups (Fig. 2-6), in
line with prior reports173.
2.2.3 Intratumoral heterogeneity of tumor antigens in gliomas and BrMETs
Numerous clinical trials developing personalized neoantigen vaccines for GBM and other
brain cancers are ongoing144,145. To determine the consequences of tumor genetic heterogeneity on
immunologic features of each tumor, we applied the pVacSeq neoantigen prediction pipeline220,221
to define the neoantigen landscape across all glioma and BrMET samples. When we aggregated
the total number of predicted neoantigens for each tumor from all sampled regions, BrMETs
harbored a higher number of HLA class I neoantigens per tumor (median=186) than either primary
(median=39) or recurrent gliomas (median=51). Moreover, BrMET class I neoantigens were
significantly (p<0.001; unpaired t-test) more clonal than those identified in gliomas (Fig. 2-7a,b).
Of note, all EGFR mutations did yield predicted clonal class I neoantigens. However, despite all
carrying the IDH1 R132H mutation, only one of the four IDH-mutant patients within the cohort
had a predicted class I neoantigen from this variant, displaying the HLA haplotype dependence of
these results. BrMETs also exhibited a greater number of HLA class II neoantigens (300) than
primary (60) or recurrent gliomas (81), and these neoantigens were significantly (p<0.001;
unpaired t-test) more clonal in their tumor distribution (Fig. 2-8a,b). For most patients, the spatial
distribution of both class I and class II neoantigens closely mirrored the underlying variant
distribution (Fig. 2-9a-c). Finally, whereas BrMET HLA class I neoantigens are mostly captured
by single site tissue sampling, additional glioma neoantigens continue to be identified as additional
tissue sites are sampled (Fig. 2-7c). Taken together, these data demonstrate that neoantigens are
distributed heterogeneously in gliomas compared to BrMETs.
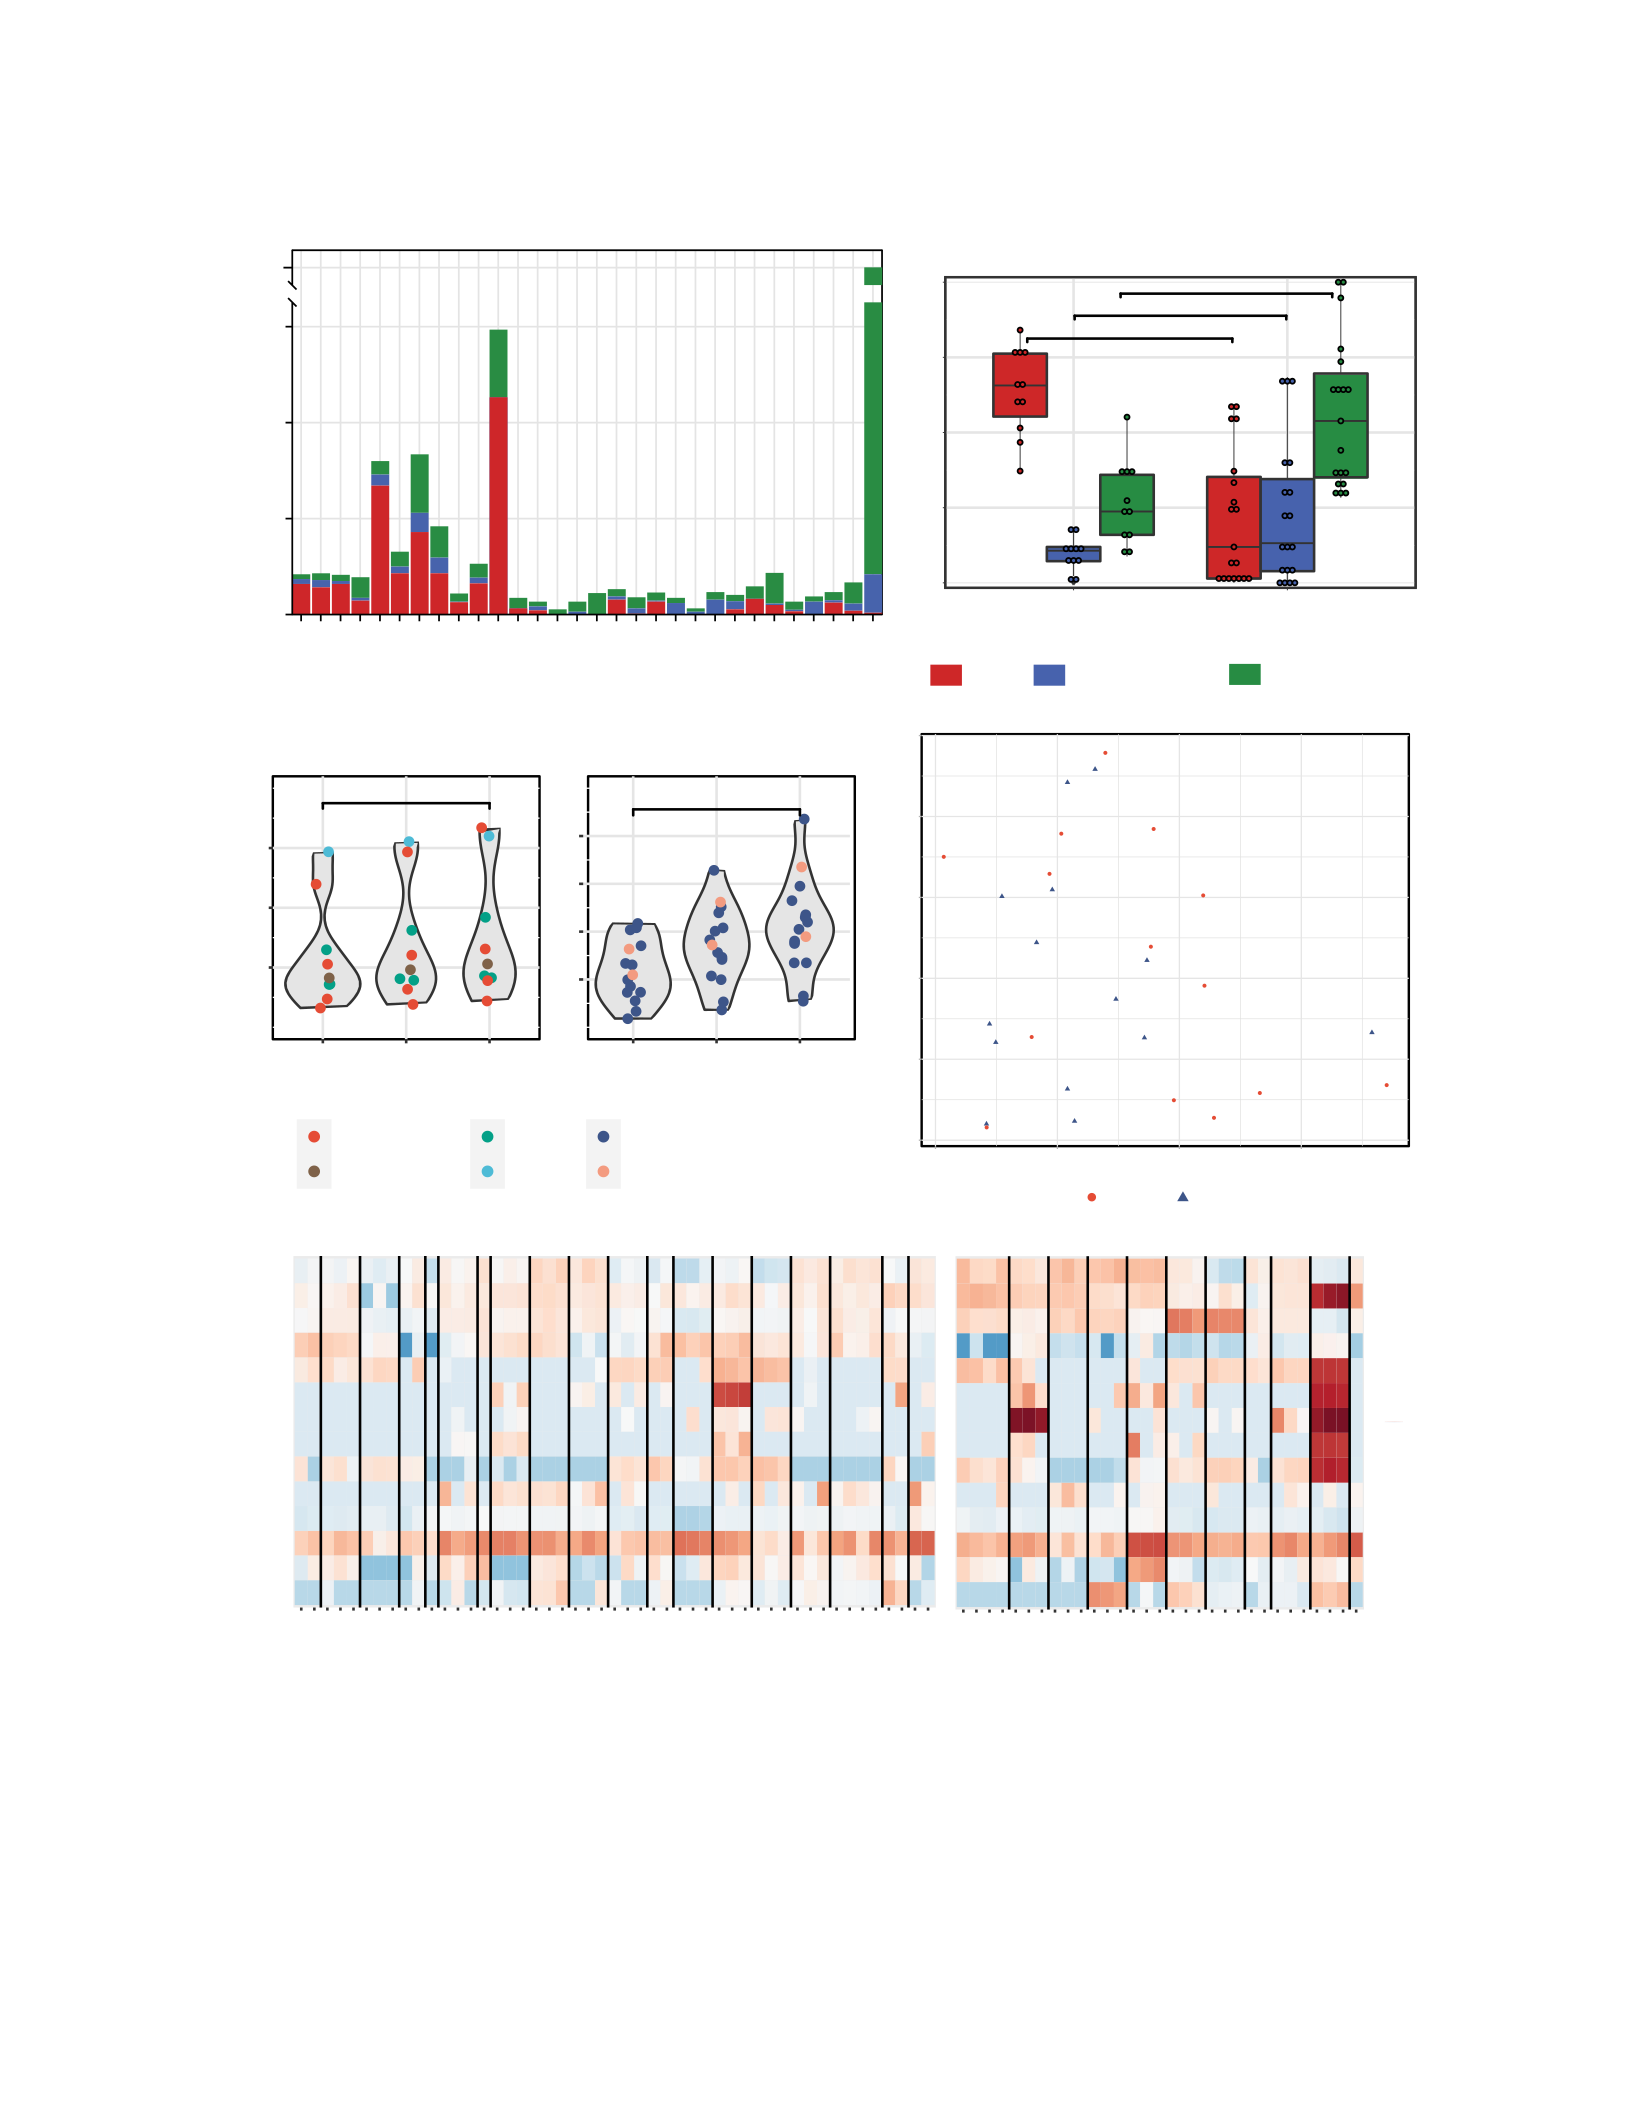
40
Survivin
NY−ESO −1
EPHA2
HER 2/Neu
IL13RA2
MAGEA3
MAGEA4
MAGEA6
MAGEA10
MART1
gp 100
SART1
TERT
WT1
Survivin
NY−ESO −1
EPHA2
HER 2/Neu
IL13RA2
MAGEA3
MAGEA4
MAGEA6
MAGEA10
MART1
gp 100
SART1
TERT
WT1
0.0
0.5
1.0
1.5
2.0
2.5
0
2
4
6
CT Antigen Score
Intrat umoral Variance
BrMET Glioma
Clonal Subclonal Shared Subclonal Privat e
N.S.
10 0
20 0
30 0
1 Site
2 Sites
3 Sites
Total Class I Neoant igens Identified
BrMET
**
20
40
60
80
1 Site
2 Sites
3 Sites
Glioma
Breast Cancer
Melanoma
NSCLC
SCL C
Primary Glioma
Recurrent Glioma
a b
c e
d
WT1
TE RT
Survivin
SART1
NY−ESO−1
MART1
MAGEA 6
MAGEA 4
MAGEA 3
MAGEA 10
IL13RA2
Her2/Neu
gp100
EPHA2
1
2
1
GBM032 2
3
1
GBM051 2
3
2
3
GBM055 1
1
GBM056 2
3
GBM059 2
1
GBM062 2
3
1
GBM063 2
3
1
GBM064 2
3
1
GBM069 2
3
1
2
1
GBM074 2
3
1
GBM079 2
3
1
AO083 23
1
GBM018.Re 2
3
1
2
3
4
2
3
1
2
Glioma
1
2
3
4
1
BrMET009 23
1
BrMET010 23
1
BrMET018 23
1
BrMET019 23
1
BrMET023 23
1
BrMET024 23
1
2
1
BrMET027 23
1
BrMET028 23
BrMET058 2
BrME T
−10
−5
0
5
10
15
GBM030
GBM052
GBM070
GBM031.Re
GBM047.Re
GBM065.Re
BrMET008
BrMET025
Figure 2-7: Intratumoral neoantigen and cancer/testis antigen heterogeneity. a, Class I neoantigen
clonality per tumor. b, Proportion of clonal, subclonal shared, and subclonal class I neoantigens in brain
metastases and gliomas. Significance determined by unpaired t-test. **p< 0.01, ***p< 0.001. c, Impact of
multi-region sequencing on total class I neoantigen load. Significance determined by unpaired t-test.
**p< 0.01. d, Heat map of cancer/testis (CT) antigen scores for each sample calculated by normalizing tumor
expression to normal “Brain-Cortex” expression (see Methods). e, Plot of the average intratumoral variation
in CT scores between regions of the same tumor by the average cancer/testis antigen score for each gene
among all brain metastases or gliomas.
BrMET008
BrMET009
BrMET010
BrMET018
BrMET019
BrMET023
BrMET024
BrMET025
BrMET027
BrMET028
BrMET058
GBM030
GBM032
GBM051
GBM052
GBM055
GBM056
GBM059
GBM062
GBM063
GBM064
GBM069
GBM070
GBM074
GBM079
AO083
GBM018.Re
GBM031.Re
GBM047.Re
GBM065.Re
0
20 0
40 0
60 0
16 00
Clas s I Neoant igen Count
0.00
0.25
0.50
0.75
1.00
Prop ortion
BrMET
Gl i om a
***
**
N.S.
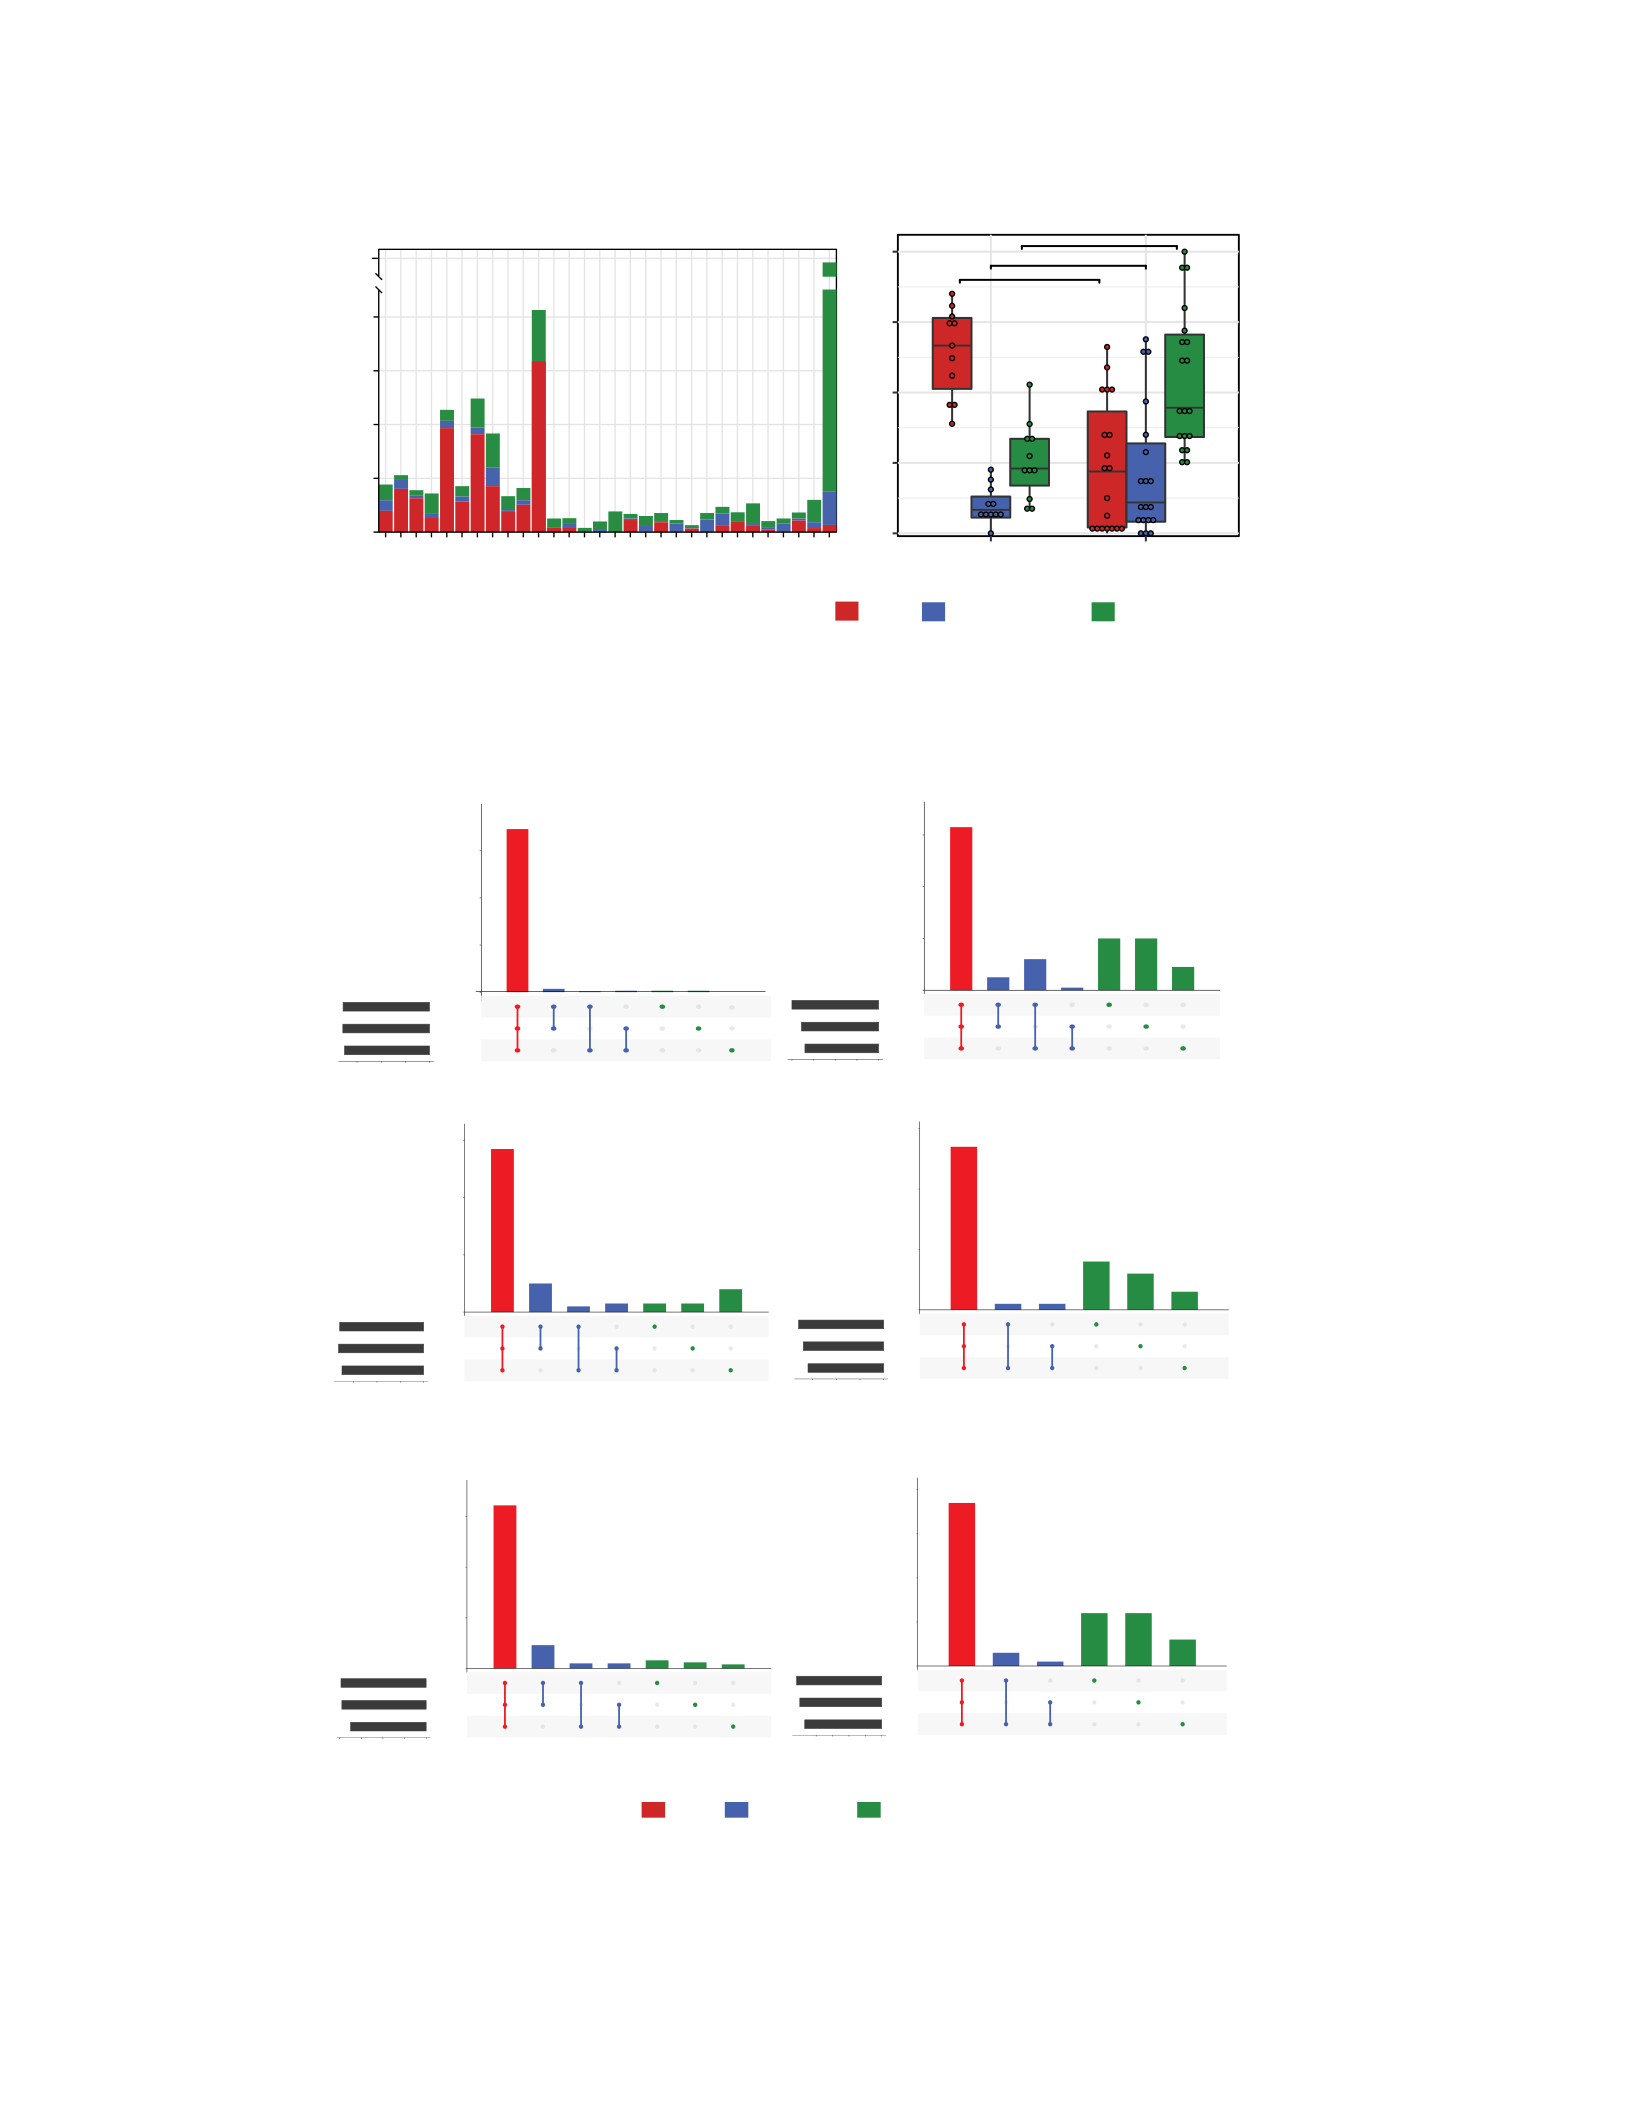
41
***
N.S. **
0.00
0.25
0.50
0.75
1.00
BrMET Glioma
Proportion
Figure 2-8: Class II neoantigen clonality. a, Class II neoantigen clonality per tumor. b, Proportion of clonal,
subclonal shared, and subclonal private class II neoantigens in brain metastases and gliomas. Significance
determined by unpaired t-test. **p< 0.01, ***p< 0.001.
Clo nal Subclonal Shared Subclonal P rivate
a b
BrMET008
BrMET009
BrMET010
BrMET018
BrMET019
BrMET023
BrMET024
BrMET025
BrMET027
BrMET028
BrMET058
GBM030
GBM032
GBM051
GBM052
GBM055
GBM056
GBM059
GBM062
GBM063
GBM064
GBM069
GBM070
GBM074
GBM079
AO083
GBM018.Re
GBM031.Re
GBM047.Re
GBM065.Re
0
200
400
600
800
3000
Class II Neoantigen Count
Cl ona l Subclonal Shared Subclonal Private
57
10
2333
8
0
20
40
60
Class I Neoantigen Intersections
BrMET009−3
BrMET009−2
BrMET009−1
0204060
Class I Neoantigens
16 1
23
55864
0
50
10 0
15 0
Class II Neoantigen Intersections
BrMET009−3
BrMET009−2
BrMET009−1
05010 0
15 020 0
Class II Neoantigens
63
5
12
1
20 20
9
0
20
40
60
Variant Intersections
GBM062−3
GBM062−2
GBM062−1
025507510 0
Varia nt s
27
1 1
8
6
3
0
10
20
30
Class I Neoantigen Intersections
GBM062−3
GBM062−2
GBM062−1
0102030
Class I Neoantigens
34 6
72 3 3 3 1
0
10 0
20 0
30 0
Varia nt Intersecti ons
BrMET009−3
BrMET009−2
BrMET009−1
010 020 030 0
Varia nt s
50
37
31
12 12
6
0
10
20
30
40
Class II Neoantigen Intersections
GBM062−3
GBM062−2
GBM062−1
010203040
Class II Neoantigens
a
b
c
FIgure 2-9: Spatial distribution of variants and neoantigens. Spatial distribution of variants (a), class I
neoantigens (b), and class II neoantigens (c) for two represenative examples. Variants/neoantigens are
grouped based upon the set of tumor regions in which they are shared.

42
In addition to neoantigens, cancer/testis (CT) antigens represent another group of tumor-
specific antigens that can be recognized by the immune system. These antigens have highly
restricted expression in normal tissue, can be expressed in reproductive cells, and are often
upregulated in malignancies. Although CT antigens are targeted in a range of clinical trial
efforts201,222–224, their expression and distribution in brain cancers has not been described
previously. We therefore sought to characterize CT antigen expression and spatial distribution
within our tumor cohort. Since CT antigens are wild-type proteins, normal tissue expression
impacts both the degree of anticipated off-target effects from directed immunotherapeutic efforts
as well as the extent of immunological tolerance during development. Thus, we scored each
candidate antigen from a curated list of CT antigens based upon its log-transformed expression
relative to normal brain tissue. Among gliomas, some of the highest scoring CT antigens were
BIRC5 (Survivin), PMEL (gp100), and IL13RA2 (Fig. 2-7d). While BIRC5 was also the highest
scoring antigen among the BrMET samples, they displayed relatively higher expression of many
prominent CT antigens such as the MAGE family proteins, gp100, MART1, and HER2/neu as
compared to gliomas. One notable exception of this was IL13RA2 which was the lowest scoring
antigen among BrMETs but ranked third among gliomas. These findings were consistent
regardless of whether brain or matched primary site tissue was used to generate BrMET CT antigen
scores (Fig. 2-10a). In contrast to the marked heterogeneity of tumor neoantigens, we observed no
significant difference in the spatial distribution of CT antigen scores overall between gliomas and
BrMETs as assessed by a cosine similarity index (Fig. 2-10b). However, these characteristics do
vary between CT antigens with TERT, CTAG1B (NY-ESO-1), and the MAGE family trending to
higher intratumoral variance (greater heterogeneity of expression) than the more clonal BIRC5 and
gp100 (Fig. 2-7e).
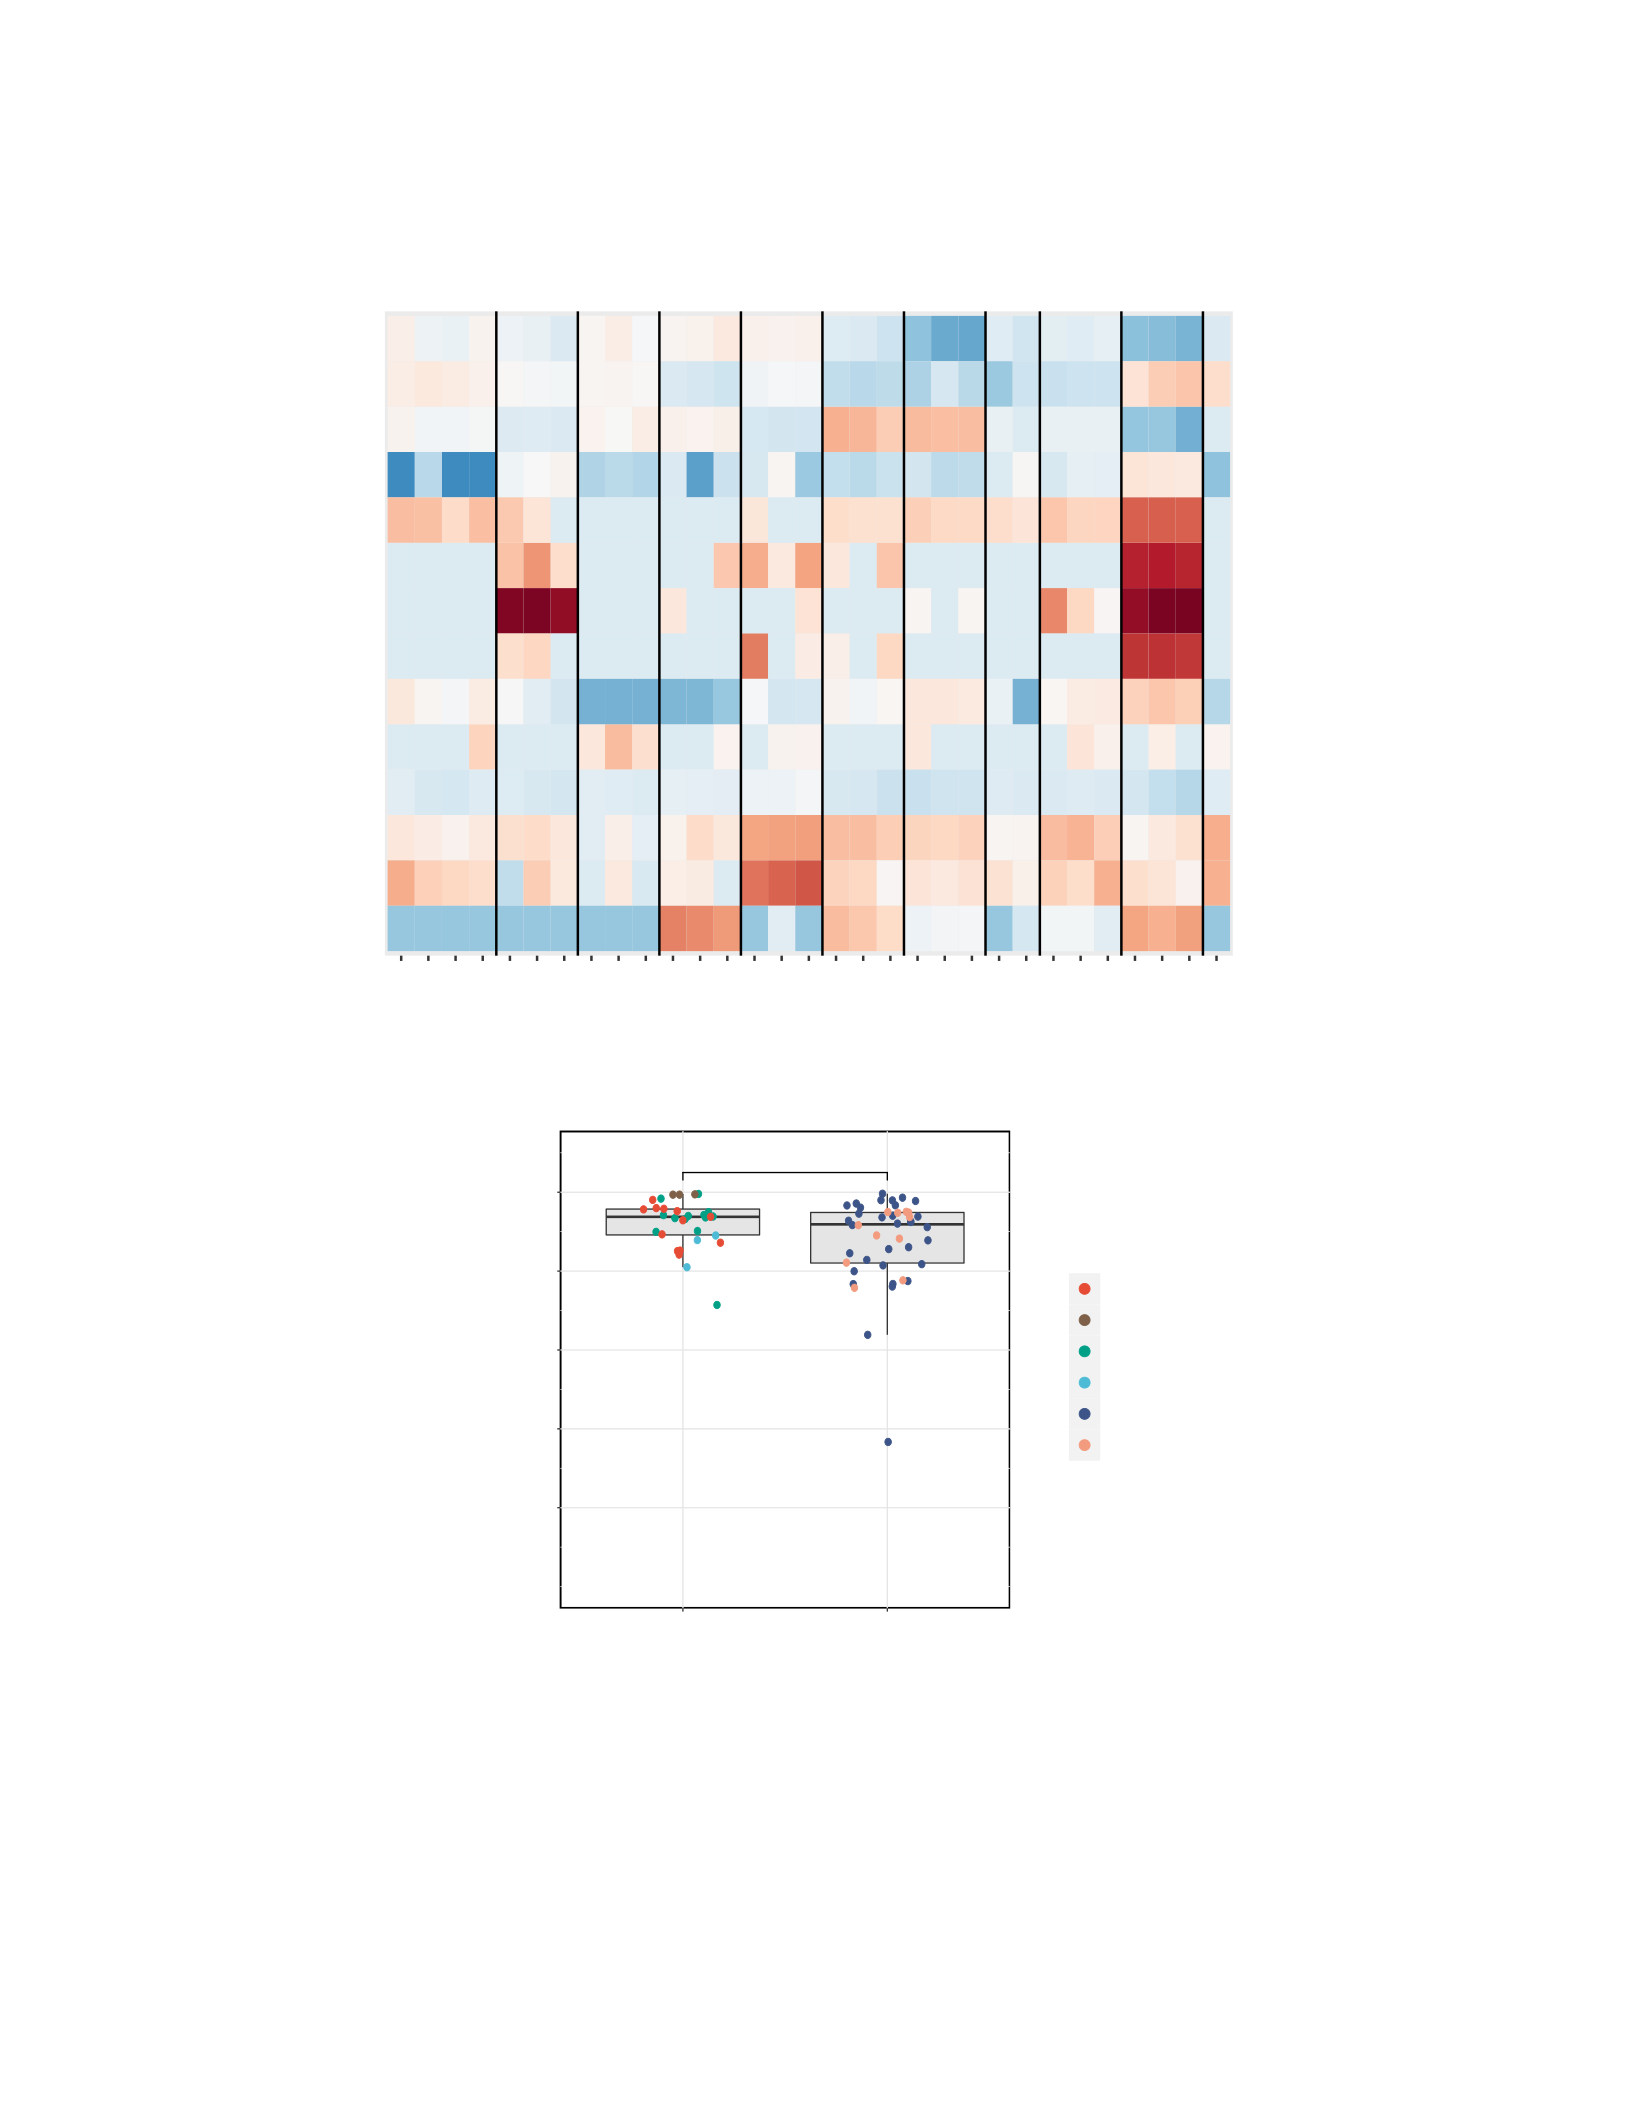
43
WT1
TE RT
Survivin
SART1
NY −ESO−1
MA RT1
MAGEA6
MAGEA4
MAGEA3
MAGEA10
IL13RA2
He r2/N eu
gp100
EPHA2
1
2
3
4
1
BrME T009 2
3
1
BrME T010 2
3
1
BrME T018 2
3
1
BrME T019 2
3
1
BrME T023 2
3
1
BrME T024 2
3
1
2
1
BrME T027 2
3
1
BrME T028 2
3
BrME T058 2
−10
−5
0
5
10
15
BrMET - normalized to primary site
N.S.
0. 2
0. 4
0. 6
0. 8
1. 0
CT Antigen Similarity
Breast Cancer
Melanoma
NSCLC
SCL C
Primary Glioma
Rec. Glioma
a
b
Figure 2-10: Intratumoral cancer/testis antigen similarity. a, Heat map of cancer/testis (CT) antigen
scores for each BrMET tumor sample calculated by normalizing tumor expression to matched primary tissue
site expression for each gene (in contrast to “Brain-Cortex” expression as done in Fig. 3). b, Comparison of
intratumoral CT antigen similarity as assessed by a pairwise cosine similarity metric on vectors composed
of the scores (normalized to “Brain-Cortex” expression) for each CT antigen.
BrMET Glioma
BrME T008
BrME T025

44
2.2.4 Spatial resolution of immune landscapes in gliomas and BrMETs
We next sought to define the immune cell infiltration within each tumor and to describe
the extent of intratumoral heterogeneity within the local immune microenvironments. We adopted
previously published immune deconvolution methods that resolve immune cell populations from
transcriptional data such as Danaher immune scores225 and CIBERSORT226 to characterize the 80
tumor regions for which there was sufficient RNA to generate RNA sequencing data. We
calculated Danaher immune scores for all regions and observed substantial intertumoral variation
specifically among “CD8 T cell” and “Cytotoxic cell” scores (Fig. 2-11a). Surprisingly, we
detected no significant difference in the aggregate immune scores between regions from glioma
and BrMET samples.
To probe potential differences in more detail, we next performed differential gene
expression analysis on tumor regions from gliomas and BrMETs. We detected significantly higher
levels of CD274 (PD-L1) and significantly lower levels of CXCL9 in gliomas compared to
BrMETs (q<0.01; t-test with multiple comparison correction), consistent with the severe
immunosuppression appreciated in the former188 (Fig. 2-11b). Additionally, because there was a
robust infiltration of macrophages in both gliomas and BrMETs as determined by CIBERSORT
(Fig. 2-12a), we explored two previously published gene sets227,228 to further characterize this
population. While we observed a slight polarization towards the immunosuppressive M2
phenotype characterized by higher expression of STAT3 and MRC1 (CD206) within gliomas, we
identified a major distinction within macrophage ontogeny. Specifically, the BrMETs had a
significant skewing towards higher expression of genes associated with monocyte-derived
macrophages relative to gliomas, which were enriched for microglial-specific genes (Fig. 2-11c).
This is consistent with recent work in the field utilizing single-cell analyses229,230.
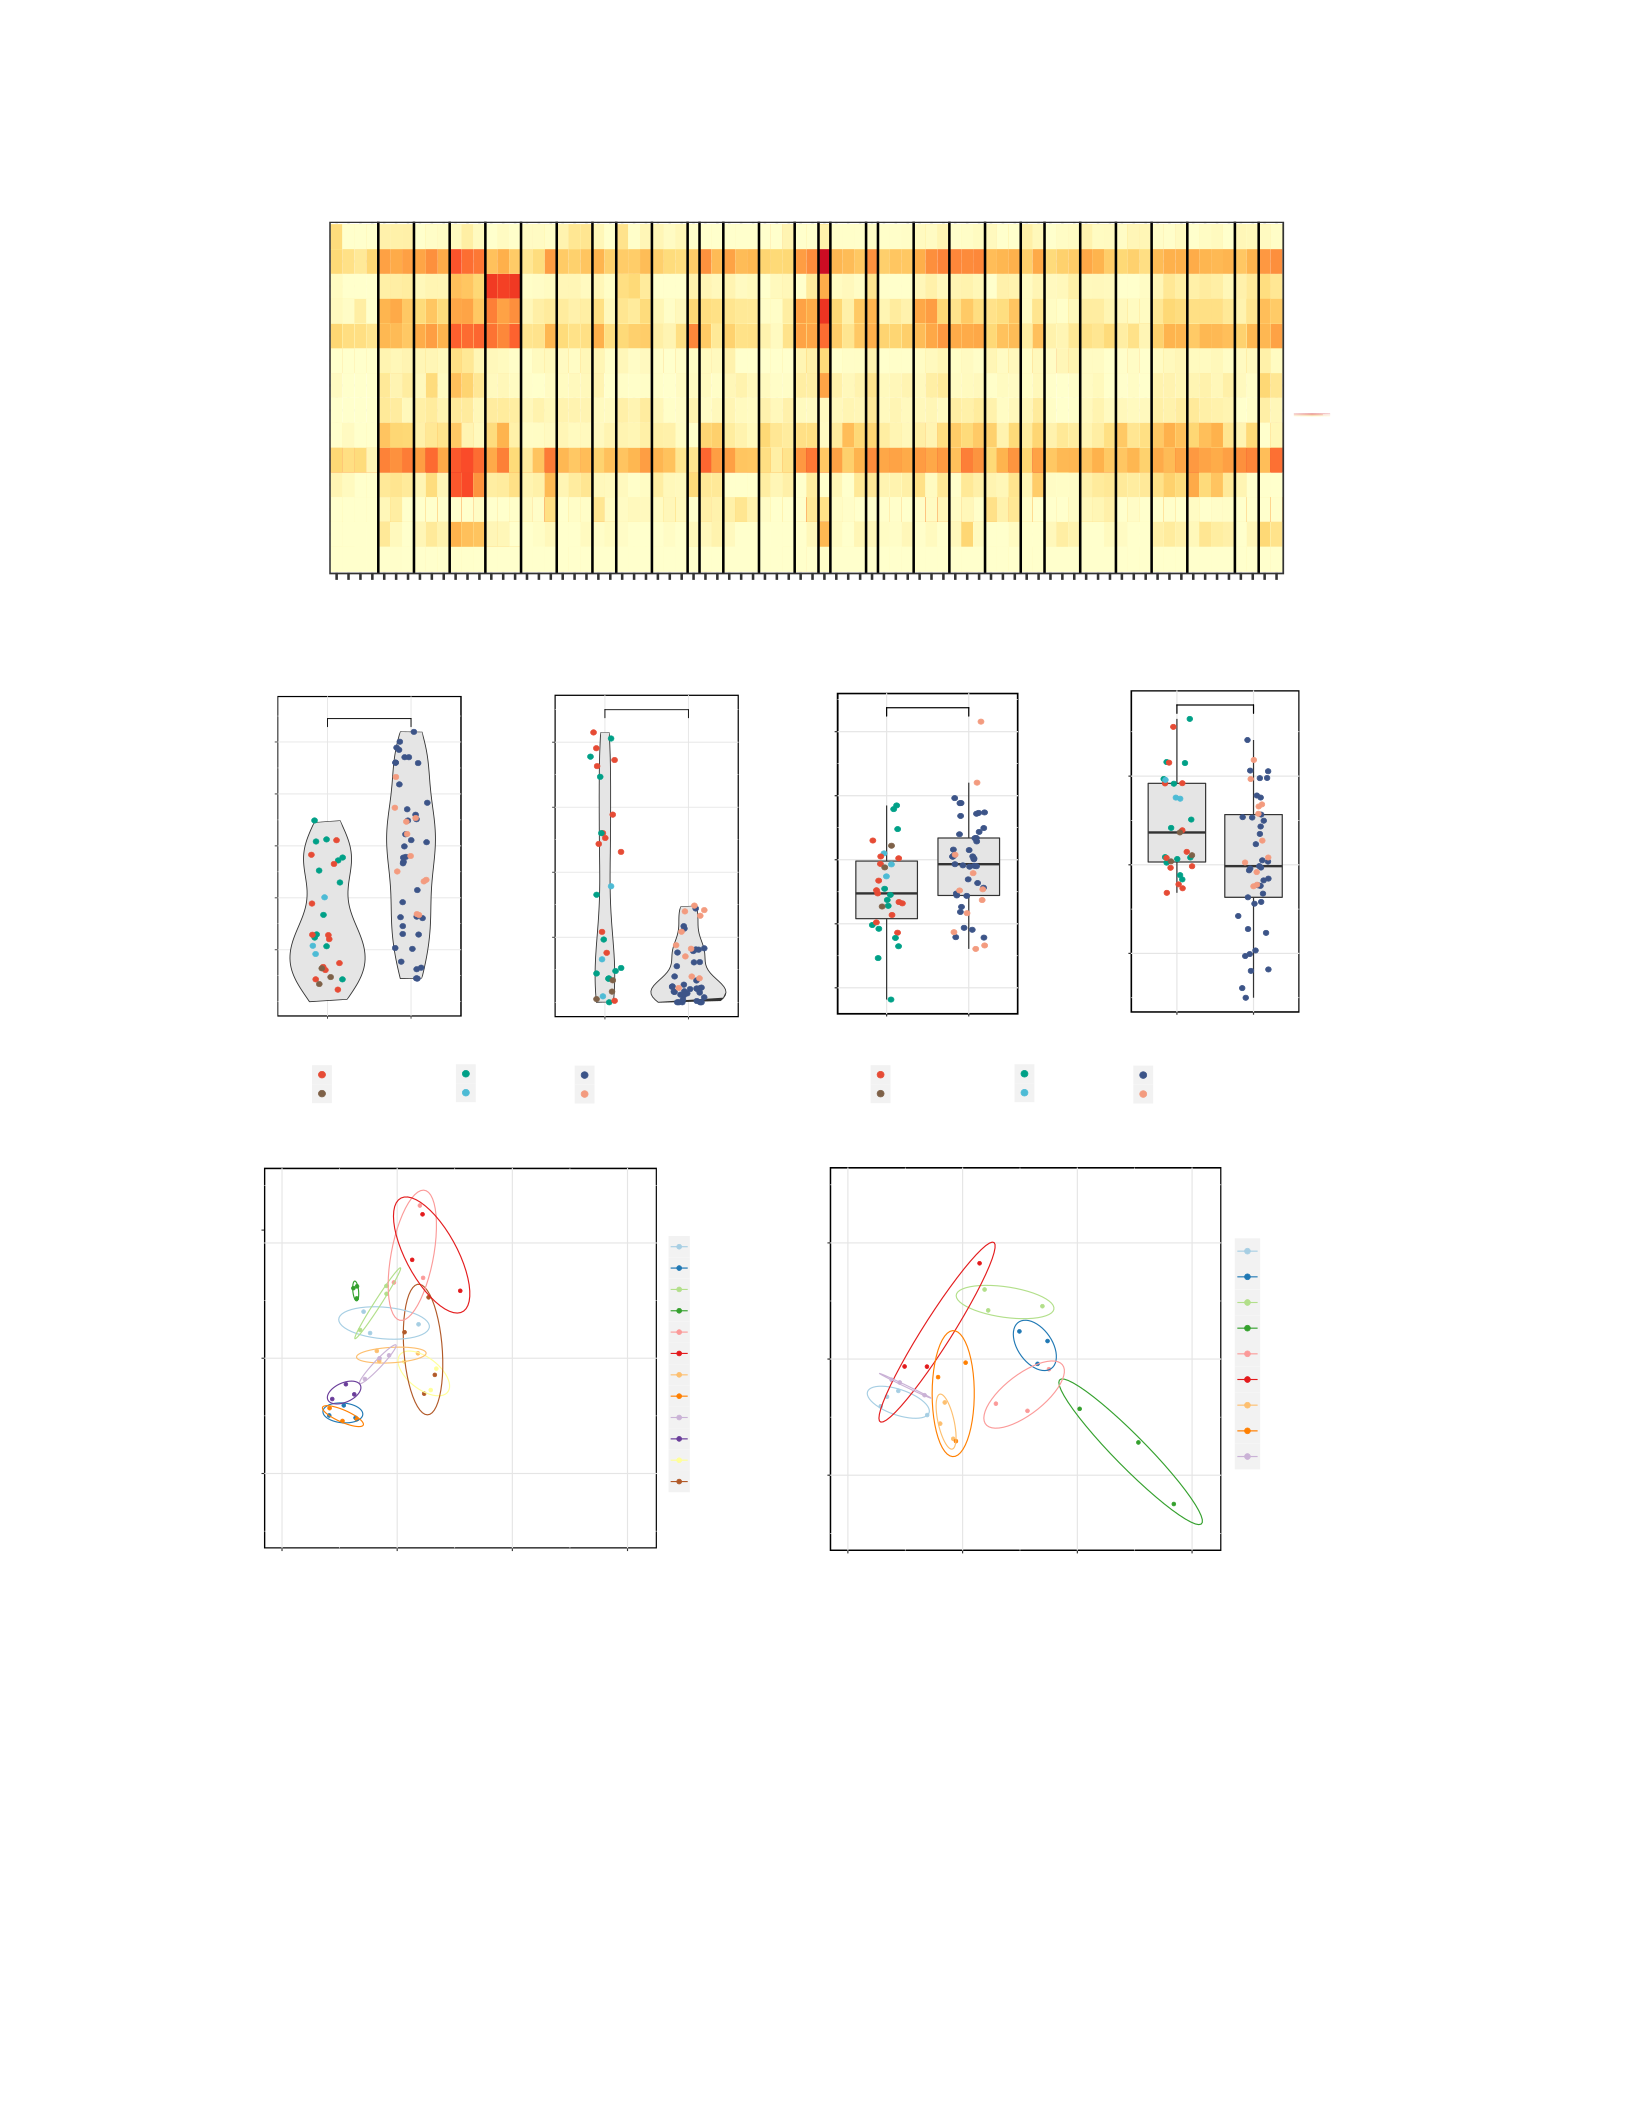
45
0
3
6
9
12
NK CD56dim cell s
NK cells
Ne utroph ils
Mast cells
Macro pha ges
DC
T-reg
Th1 cells
T ce lls
Exha usted CD8
Cytotoxic cells
CD 8 T cells
CD 45
B cells
1
2
34
1
Br ME T009 2
31
Br ME T010 2
3
1
Br ME T018 2
3
1
Br ME T019 2
31
Br ME T023 2
3
1
Br ME T024 2
31
2
1
Br ME T027 2
31
Br ME T028 2
3
Br ME T058 2
1
21
GBM032 2
31
GBM051 2
323
GBM055 1
1
GBM056 2
3
GBM059 2
1
GBM062 2
31
GBM063 2
3
1
GBM064 2
31
GBM069 2
3121
GBM074 2
31
GBM079 2
3
1
AO08 3 23
1
GBM018.Re 2
3
12342312
Br ME T 02 5
Br ME T 00 8
GBM030
GBM052
GBM070
GBM031.Re
GBM047.Re
GBM065.Re
a
bc
d
2
−2
0
−20 2 4
PC1 (5 6. 2% explained var.)
PC2 (9 .4 % explained var.)
GBM018.Re
GBM031.Re
GBM032
GBM051
GBM056
GBM062
GBM063
GBM064
GBM069
GBM074
GBM079
AO083
−2
0
2
−20 2 4
PC1 (5 6. 2% explained var.)
PC2 (9 .4 % explained var.)
BrMET008
BrMET009
BrMET010
BrMET018
BrMET019
BrMET023
BrMET024
BrMET027
BrMET028
PD−L1 CXCL9
*
0
1
2
3
4
M2−M1 Skew
BrMET Glioma
**
0.0
2.5
5.0
MDM−Microglia S kew
GliomaBrMET
Brea st Cancer
Mel ano ma
NSC LC
SCL C
Primary Gl ioma
Re curren t Glio ma
**
1
2
3
4
Lo g( TPM )
BrMET Glioma
**
1
2
3
4
5
Lo g( TPM )
BrMET Glioma
Brea st Cancer
Mel ano ma
NSC LC
SCL C
Primary Gl ioma
Re curren t Glio ma
Figure 2-11: Spatial diversity of the immune microenvironment. a, Heat map of the immune cell scores for
all samples as estimated by the method from Danaher et al (see Methods). Each column represents a tumor
region and each row represents an immune population. Scores represent the average of the log-transformed
expression of a collection of subset-specific genes. b, Difference in log-transformed expression of PD-L1 (left)
and CXCL9 (right) between tumor types for all samples within cohort. Significance determined by t-test with
Benjamini-Hochberg multiple test correction. **q < 0.01. c, Difference in macrophage polarization (left) or
ontogeny (right) based upon previously published gene sets (see Methods) between tumor types for all
samples within cohort. Significance determined by two-sided t-test. *p<0.05. **p<0.01. d, Danaher scores
for each sector from a tumor with three or more samples plotted in PC1-PC2 space following principal
components analysis.
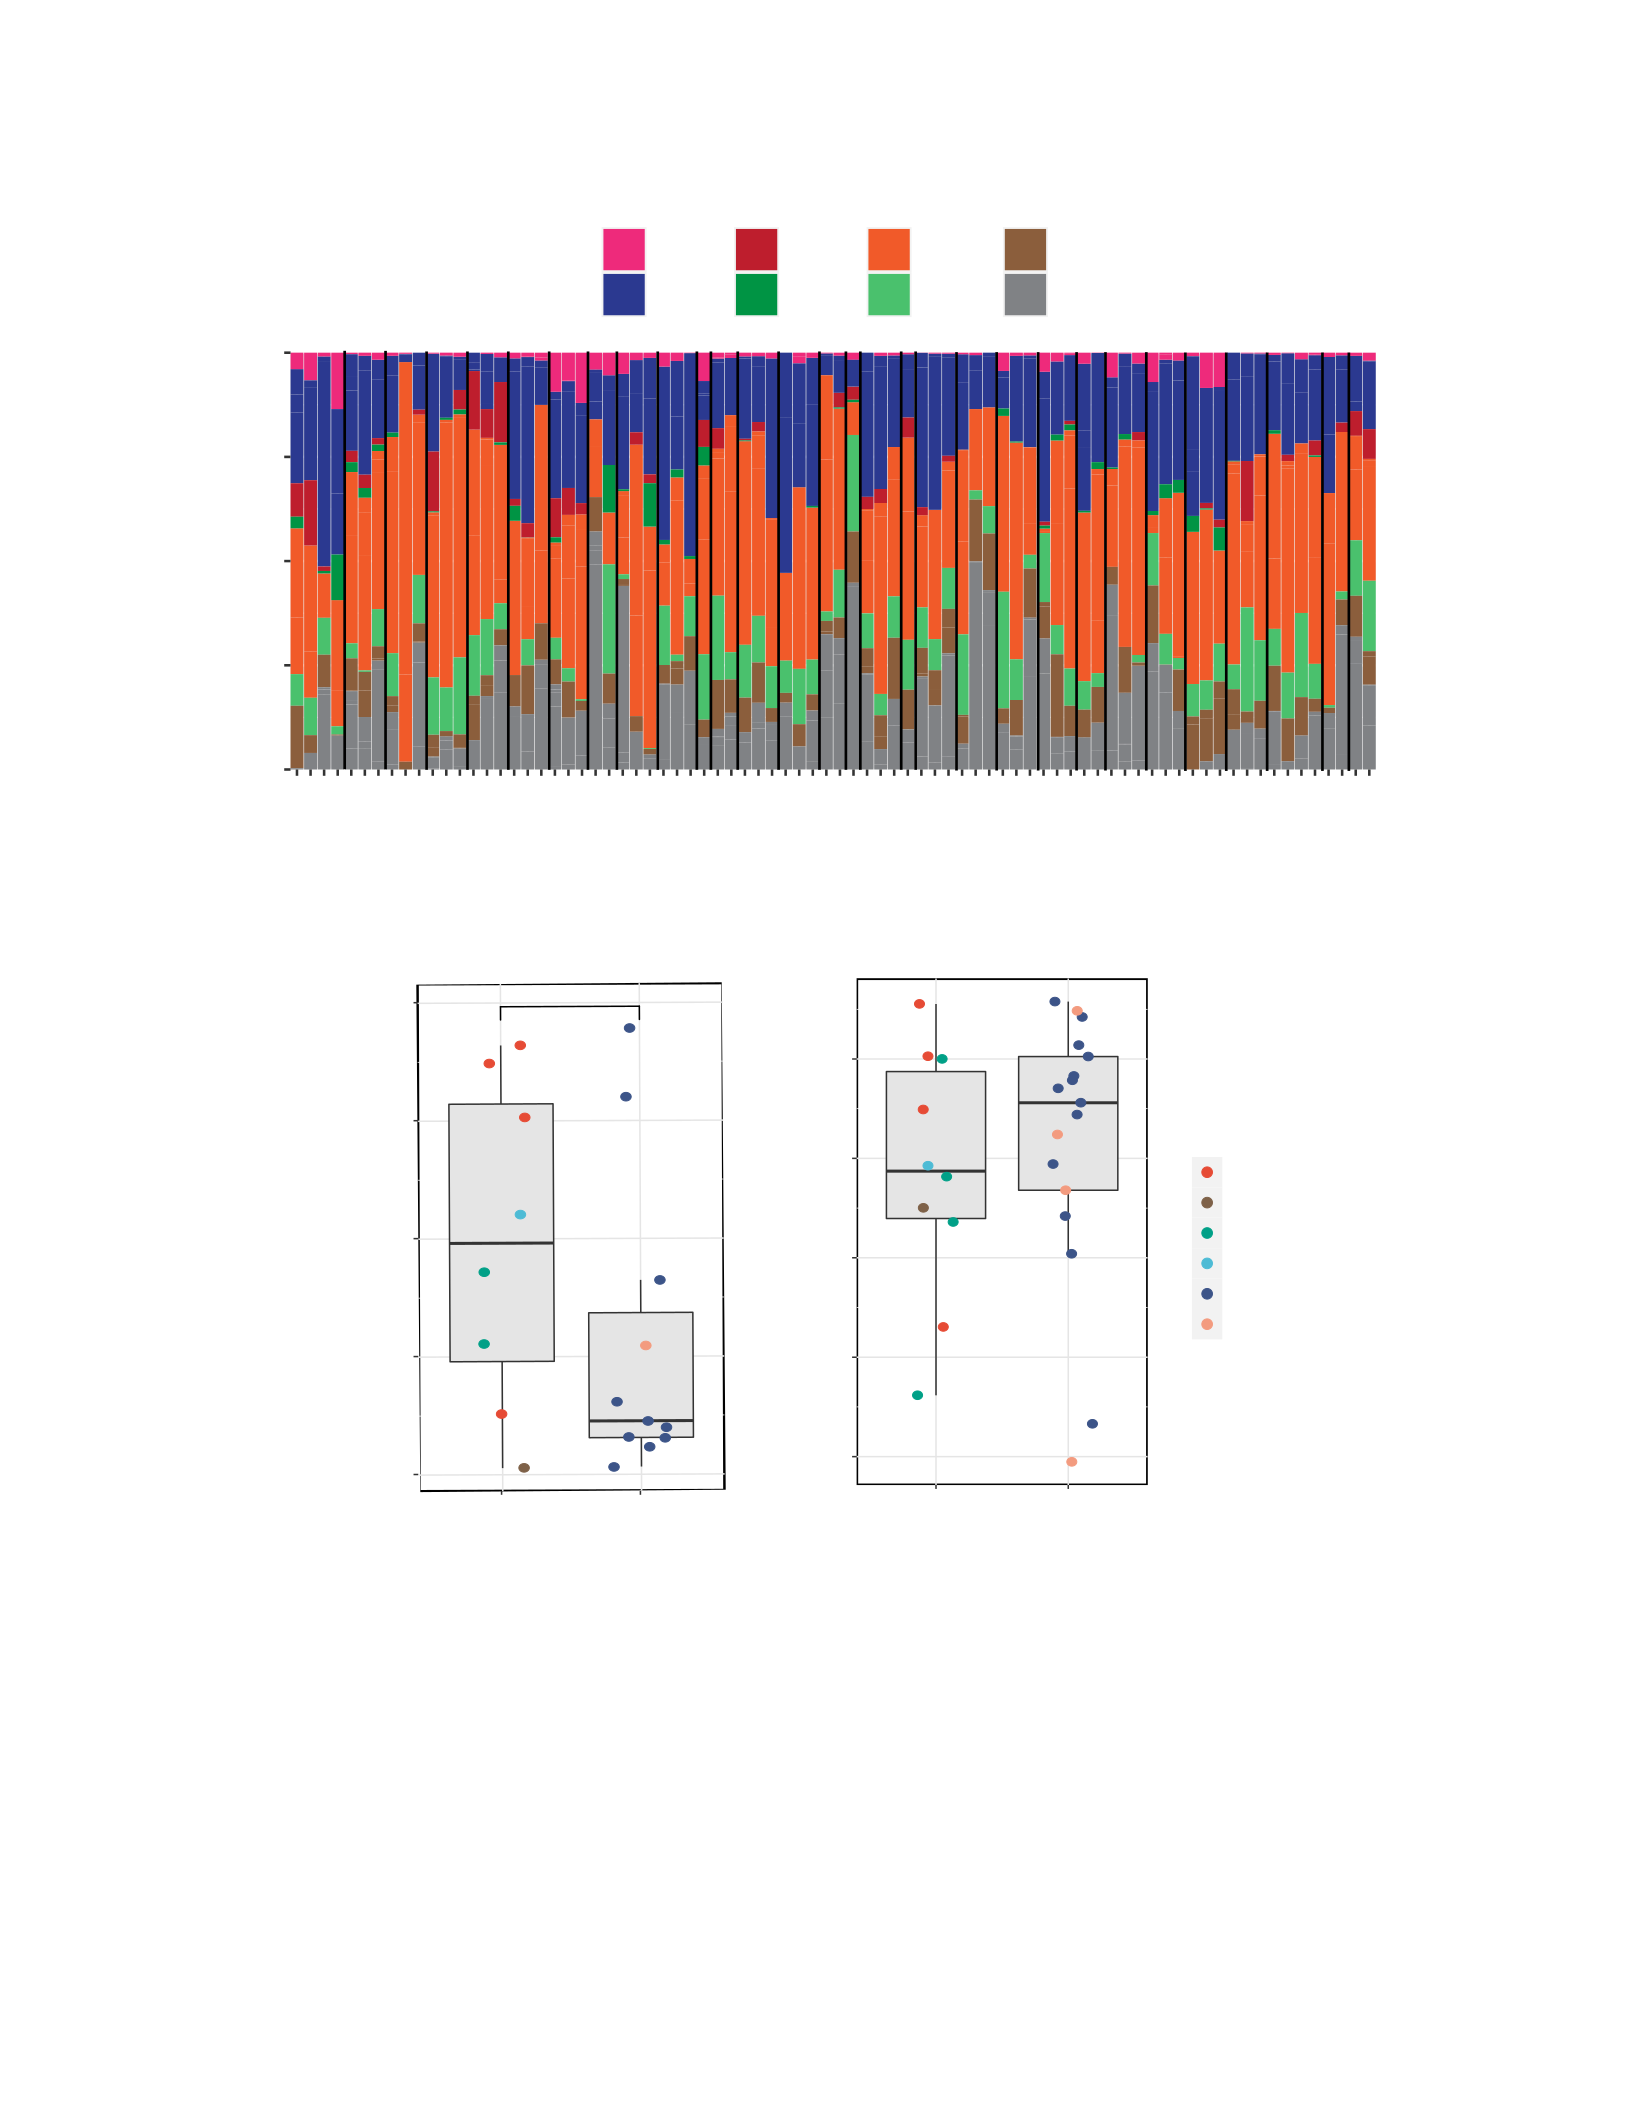
46
Figure 2-12: Immune microenvironment profiling and intratumoral heterogeneity.
a, Simplified CIBERSORT (see Methods) output estimating abundance for each immune cell type for each
tumor sample in cohort. b, Quantification of immune intratumoral heterogeneity or similarity through either
the area encompassed by regions from each tumor in PC1-PC2 space (left) or an intratumoral pairwise
cosine similarity metric on vectors composed of the Danaher immune scores for each region (right).
a
b
Breast Cancer
Melanoma
NSCLC
SCLC
Primary Glioma
Rec. G lioma
0.00
0.25
0.50
0.75
1.00
1
2
3
4
1
Br ME T009 2
3
1
Br ME T010 2
3
1
Br ME T018 2
3
1
Br ME T019 2
31
Br ME T023 2
3
1
Br ME T024 2
3
1
2
1
Br ME T027 2
3
1
Br ME T028 2
3
Br ME T058 2 1
2
1
GBM032 2
3
1
GBM051 2
3
2
3
GBM055 1
1
GBM056 2
3
GBM059 2
1
GBM062 2
3
1
GBM063 2
3
1
GBM064 2
3
1
GBM069 2
3
1
2
1
GBM074 2
3
1
GBM079 2
3
1
AO0 8 3 2 3
1
GBM018.Re 2
3
1
2
3
4
GBM047.Re 3
1
3
Prop ortion
Cell Type
B cells
CD 4+ T cells
CD 8+ T cells
DC s
Macro pha ges
Mon ocytes
NK cells
Other
Br M E T 00 8
Br M E T 02 5
GBM030
GBM052
GBM070
GBM031.Re
GBM065.Re
2
N.S.
0. 0
0. 1
0. 2
0. 3
0. 4
Area
Danaher ITH
BrMET Glioma
0. 95
0. 96
0. 97
0. 98
0. 99
Cosine Similarity
Intratumoral Danaher Similarity
BrMET Glioma

47
Finally, we assessed the degree of immunologic intratumoral heterogeneity as estimated
by the Danaher scores. We performed principal components analysis on the Danaher immune
scores for all tumors with RNA from at least three sectors. Plotting each region in PCA space, we
observed that most regions from the same tumor clustered together (Fig. 2-11d). To quantify the
extent of heterogeneity, we calculated the area in PC1-PC2 space (termed Danaher ITH) of the
triangle with vertices corresponding to each region of a tumor. In contrast to the substantial
differences in variant and neoantigen heterogeneity, we detected no difference in the degree of
intratumoral immune cell heterogeneity between the tumor types (Fig. 2-12b). A similar result was
obtained by calculating pairwise cosine similarity for Danaher immune scores between regions
from the same tumor (Fig. 2-12b). Overall, these data suggest that the intratumoral spatial variation
in the immune microenvironment is similar between gliomas and BrMETs and generally is less
than the intertumoral variation.
2.2.5 T cell receptor clonotypic diversity and heterogeneity
To evaluate the diversity, heterogeneity, and degree of clonal expansion of TCR clonotypes
within the infiltrating T cell populations of GBM and BrMET tumor samples, we performed TCR
sequencing on 65 regions from 22 tumors in the cohort. The TCR b-chain complementarity-
determining region 3 (CDR3) is highly diverse and plays a significant role in antigen recognition.
Therefore, the TCR b chain CDR3 sequences can function as unique barcodes of individual T cell
clones as they are activated and undergo clonal expansion within the tumor. We classified
clonotypes within each tumor region as either the dominant clone (Clone 1) or in predetermined
clonotype groups based on frequency (i.e., Clones 2-5, 6-20, 21-100, 101-1000, or more than 1000
clones) (Fig. 2-13a & Fig. 2-14a). Unexpectedly, we observed substantial clonal expansion within
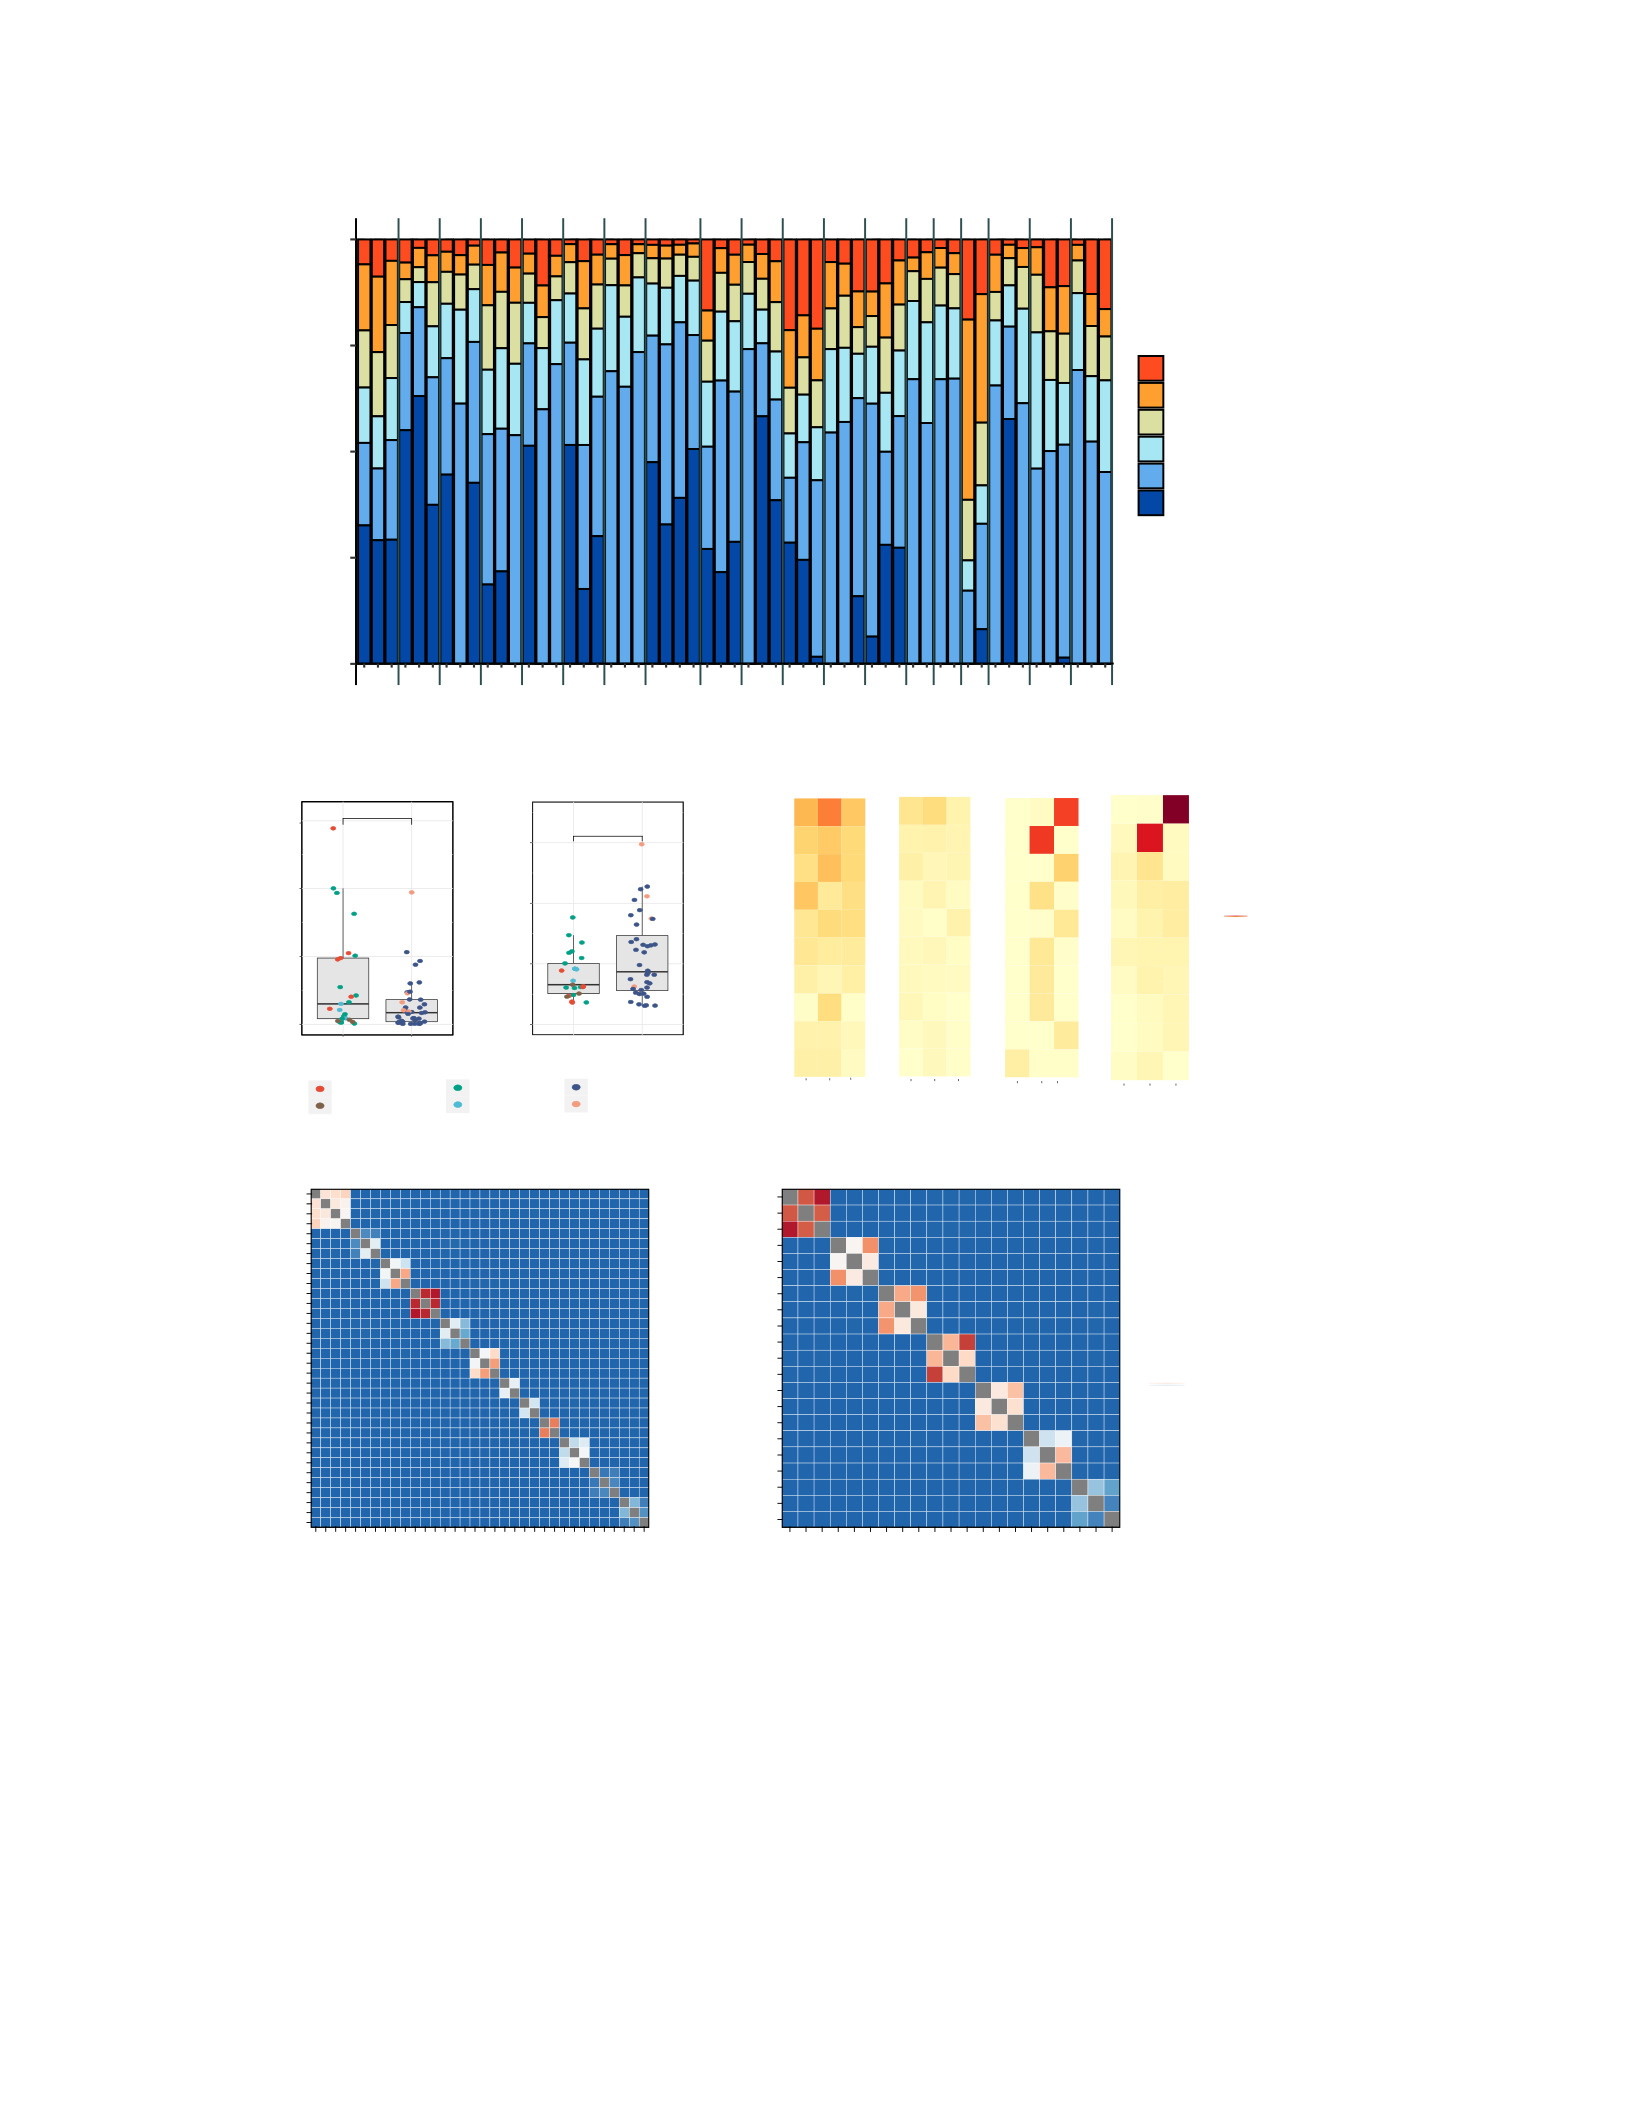
48
*
0.00
0.04
0.08
0.12
T Cell Fraction
*
0.0
0.1
0.2
0.3
Simpson Clonality
Breast Cancer
Melano ma
NSC LC
SCLC
Primary GBM
Recurren t GBM
a
c
d
b
0%
25 %
50 %
75 %
10 0%
1
BrMET009 2
3
1
BrMET010 2
3
1
BrMET018 2
3
1
BrMET019 2
3
1
BrMET025 2
3
1
BrMET027 2
3
1
BrMET028 2
3
1
2
3
4
1
3
1
GBM052 2
3
1
GBM055 2
3
1
GBM056 2
3
1
GBM059 2
3
1
3
2
3
2
1
GBM070 2
3
1
GBM074 2
3
1
GBM079 2
3
Percentage of Repe rtoire
GBM032
GBM063
GBM064
1
Clone 1
Clones 2−5
Clones 6−20
Clones 21−100
Clones 101−1000
Clones 1000+
GBM047.Re 2
GBM065.Re
3
GBM079 2
1
3
GBM074 2
1
2
GBM070 2
2
1
3
3
3
1
3
GBM059 2
1
GBM056 2
3
GBM055 2
1
3
GBM052 2
1
3
GBM047.Re 2
1
4
3
2
1
1
2
3
4
1
GBM047.Re 2
3
1
GBM052 2
3
1
GBM055 2
3
1
GBM056 2
3
1
GBM059 2
3
1
3
2
3
1
2
1
GBM070 2
3
1
GBM074 2
3
1
GBM079 2
3
GBM
3
BrMET028 2
1
3
BrMET027 2
1
3
BrMET025 2
1
3
BrMET019 2
1
3
BrMET018 2
1
3
BrMET010 2
1
3
BrMET009 2
1
1
BrMET009 2
3
1
BrMET010 2
3
1
BrMET018 2
3
1
BrMET019 2
3
1
BrMET025 2
3
1
BrMET027 2
3
1
BrMET028 2
3
BrMET
0. 00
0. 25
0. 50
0. 75
Morisita Overlap
1
GBM064
GBM063
GBM065.Re
1
3
GBM032
GBM032
GBM063
GBM064
GBM065.Re
Figure 2-13: Intratumo ral T cell repertoire clonality and diversity. a, The proportion of each sample’s T cell
repertoire consisting of clones from a given rank position when all TCR sequences are ordered by
descending frequency in the sample. b, Comparison of T cell fraction (left) and Simpson clonality (right)
between regions from GBMs or BrMETs. T cell fraction and Simpson clonality were calculated as described
in Methods. P values calculated by two-sided t-test: *P<0.05. c, Heat maps showing the frequencies of
the ten most expanded intratumoral beta-chain sequences per tumor in different regions. Each row
represents one unique sequence and each column a tumor region. d, Quantification of TCR intratumoral
heterogeneity by calculation of the Morisita overlap (see Methods) between pairs of distinct tumor regions
in either GBM (left) or BrMETs (right). Values range from 0 (indicating no similarity) to 1 (identical
TCR repertoires).
BrMET
GBM
BrMET
GBM
Clono type
9
10
6
8
7
5
3
2
4
1
Reg. 1
Reg. 2
Reg. 3
BrMET009
Reg. 1
Reg. 2
Reg. 3
BrMET018
Reg. 1
Reg. 2
Reg. 3
GBM074
Reg. 1
Reg. 2
Reg. 3
GBM079
0.00
0.04
0.08
0.12
0.16
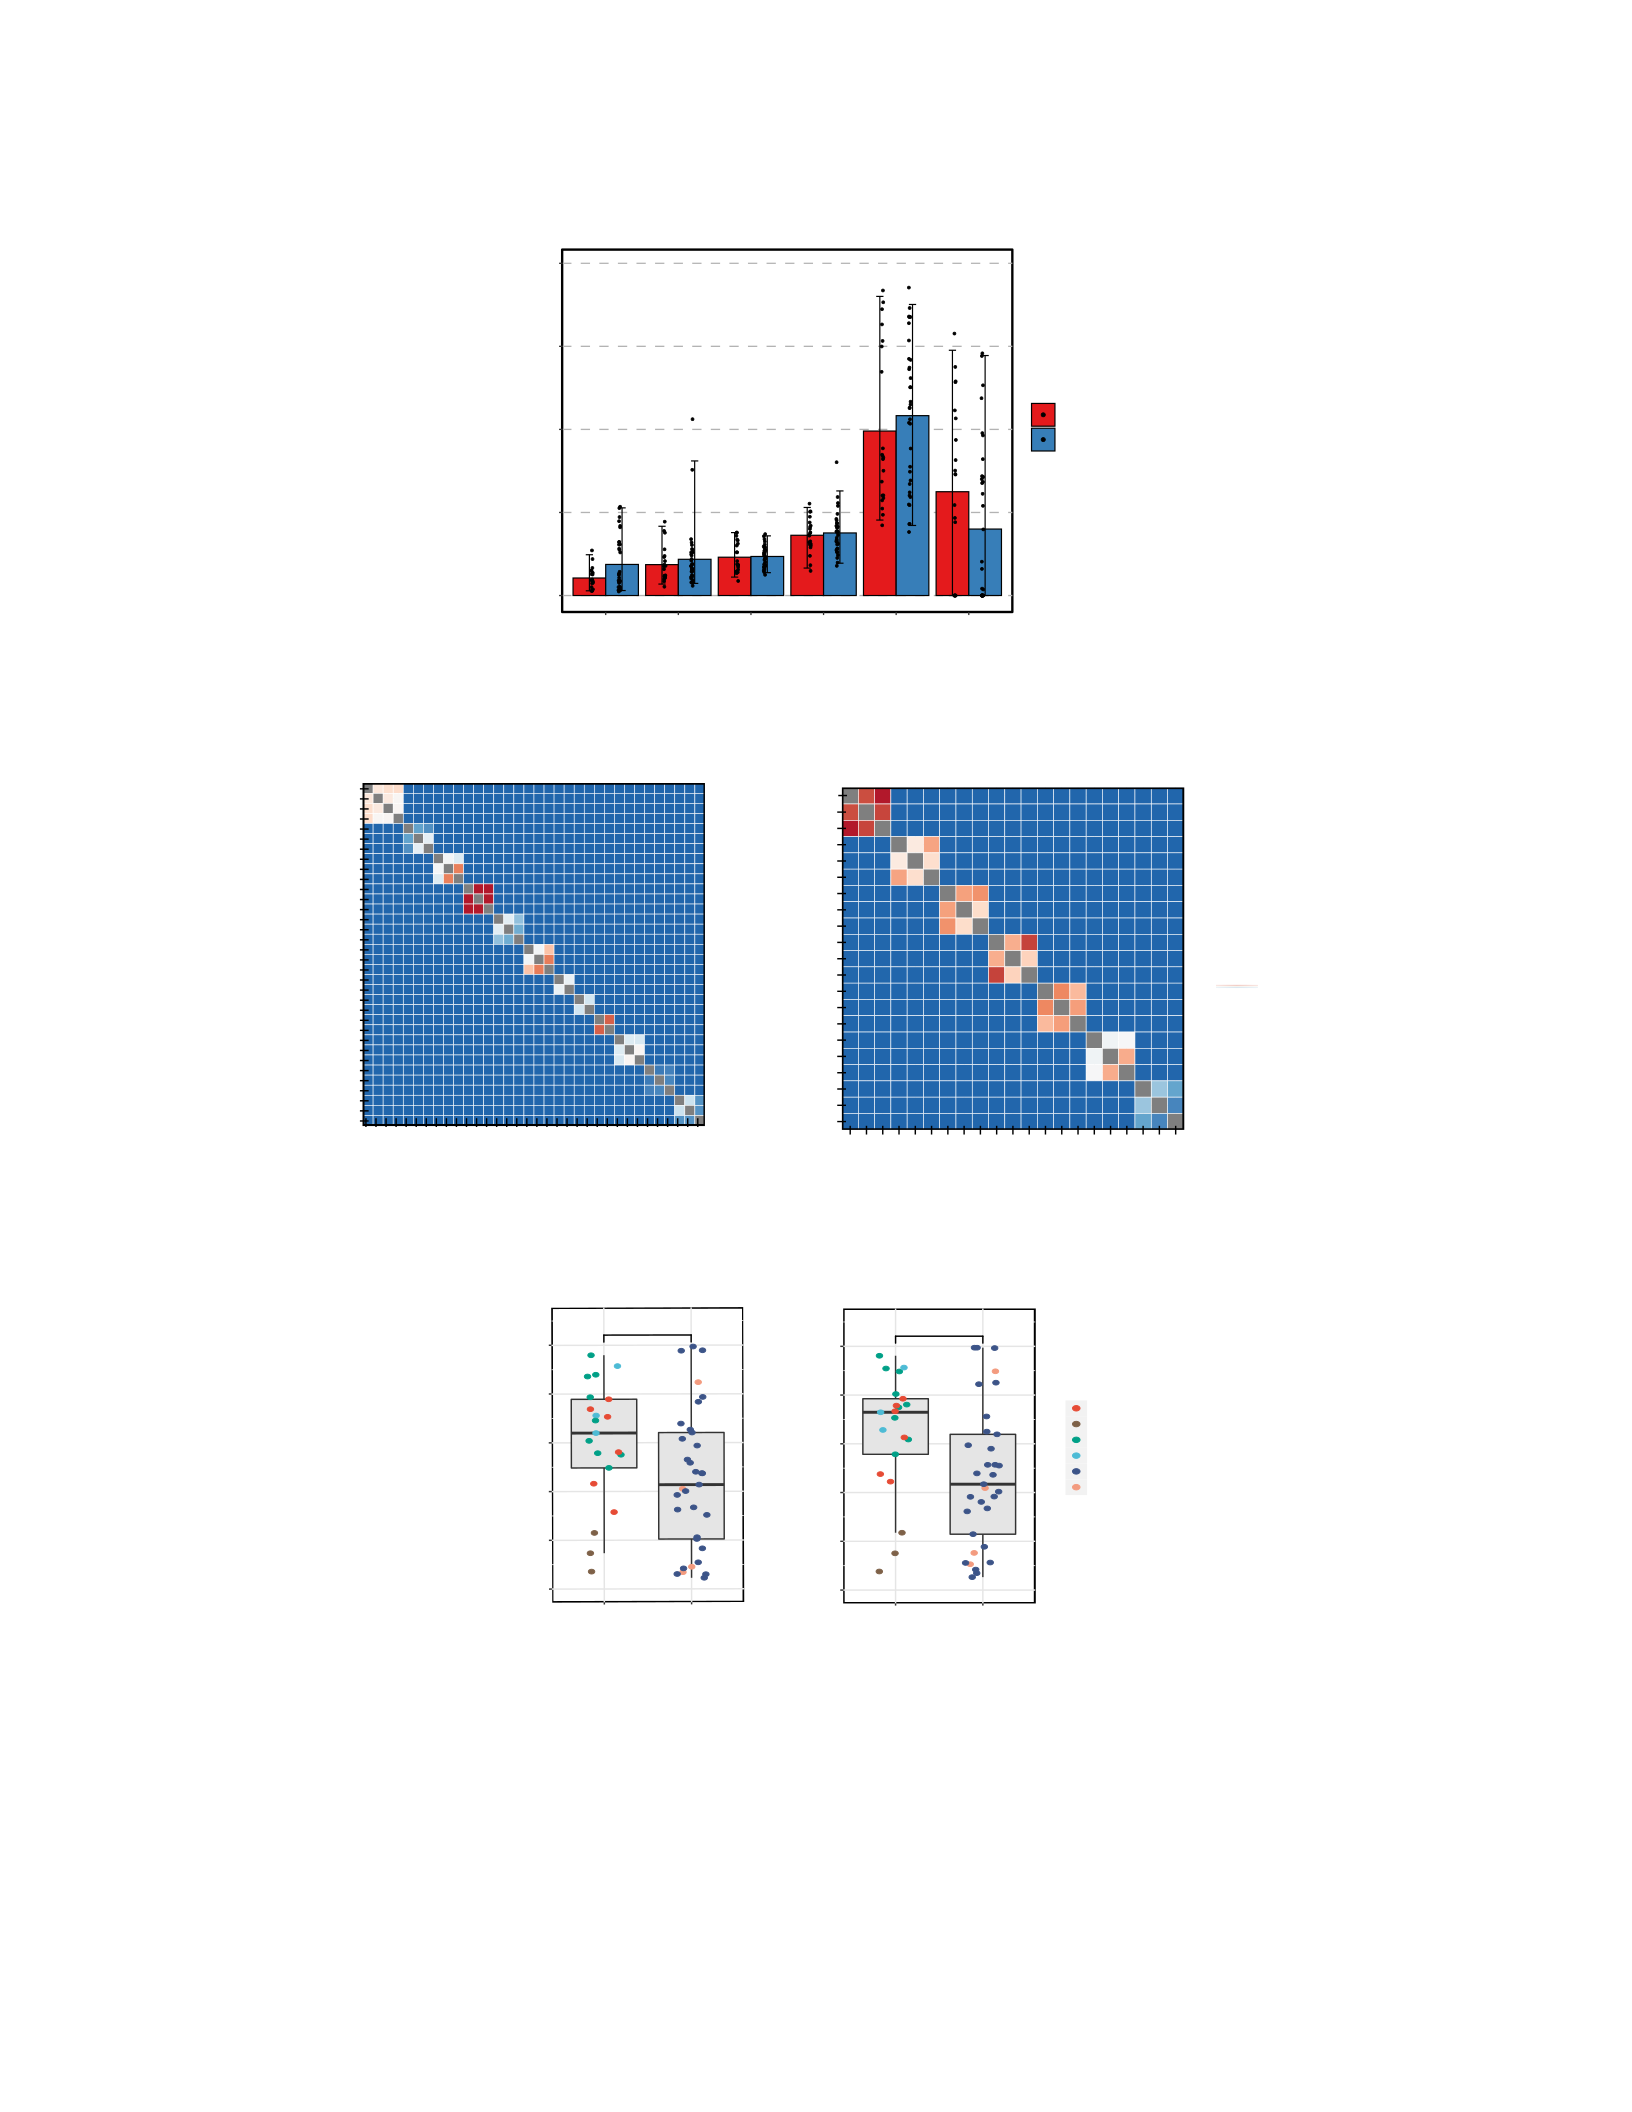
49
0%
20 %
40 %
60 %
80 %
Cl one 1
Cl one s 2-5
Cl one s 6-20
Cl one s 21-10 0
Cl one s 101-1 ,000
Cl one s 1,0 01 - 20,000
Proportion of repertoire
BrMET
GBM
0.00
0.25
0.50
0.75
Co sine Similarity
3
GBM079 2
1
3
GBM074 2
1
3
GBM070 2
1
2
1
3
2
3
1
3
GBM059 2
1
3
GBM056 2
1
3
GBM055 2
1
3
GBM052 2
1
3
GBM047.Re 2
1
4
3
2
1
1
2
3
4
1
GBM047.Re 2
3
1
GBM052 2
3
1
GBM055 2
3
1
GBM056 2
3
1
GBM059 2
3
1
3
2
3
1
2
1
GBM070 2
3
1
GBM074 2
3
1
GBM079 2
3
GBM
GBM032
GBM063
GBM064
GBM065.Re
GBM032
GBM063
GBM065.Re
GBM064
3
BrMET028 2
1
3
BrMET027 2
1
3
BrMET025 2
1
3
BrMET019 2
1
3
BrMET018 2
1
3
BrMET010 2
1
3
BrMET009 2
1
1
BrMET009 2
3
1
BrMET010 2
3
1
BrMET018 2
3
1
BrMET019 2
3
1
BrMET025 2
3
1
BrMET027 2
3
1
BrMET028 2
3
BrMET
a
b
Br e ast Ca nc er
Melanom a
NSCLC
SC L C
Primary GBM
Recurrent GBM
*
0.0
0.2
0.4
0.6
0.8
1.0
Intratumoral C osine Simil arit y
1.0
*
0.0
0.2
0.4
0.6
0.8
Intratumo ral Mo risi ta Overla p
c
Figure 2-14: Intratumoral T cell repertoire heterogeneity. a, The proportion of the T cell repertoire for
each sample comprised of clones within a given clonotype group when clones are ranked in descending
order of frequency. b, Quantification of TCR intratumoral heterogeneity by calculation of the cosine similari-
ty (see Methods) between pairs of distinct tumor regions in either GBM (left) or BrMETs (right). Values
range from 0 (indicating no similarity) to 1 (identical TCR repertoires). c, Comparison of intratumoral T cell
repertoire similarity between GBM and BrMETs via either Morisita overlap (left) or cosine similarity (right).
Each data point represents the pairwise comparison between regions from the same tumor. Significance
determined by unpaired t-test. *p<0.05.
BrMET GB M BrMET GBM

50
GBM. For example, each region of GBM055 harbored a dominant clone comprising >17% of the
T cell repertoire. In addition, regions from GBM047.Re, GBM056, GBM059, GBM065.Re, and
GBM079 all contained dominant clones present at frequencies >12%. In contrast, of the sequenced
BrMETs, only 1 region from BrMET025 (NSCLC) harbored a dominant T cell clone present at a
frequency >10%. Overall, the T cell fraction among all cells (estimated through TCR sequencing;
see Methods) was significantly (p<0.05; unpaired t-test) higher within the BrMETs, while the TCR
repertoires within GBM were determined to have a higher degree of clonality (p<0.05; unpaired
t-test) (Fig. 2-13b).
To investigate the degree of intratumoral heterogeneity of the T cell repertoires, we next
explored the distribution of the top 10 clones within each tumor. The distribution of the expanded
TCRs within each tumor differed greatly between patients, with some exhibiting marked T cell
homogeneity among all examined regions while others showed profound intratumoral diversity
(Fig. 2-13c). Several of the GBMs were particularly heterogeneous with locally expanded T cell
clones present at frequencies greater than 10% within one region of the tumor but significantly
less than 1% in all other regions. We then quantified this diversity at a repertoire-wide level
through pairwise comparisons using the Morisita overlap index (MOI), a measure of similarity
between populations based on the number of shared sequences and their relative frequencies. As
expected, the MOI values approached 0 (no similarity) for repertoires from different patients but
were variable within patients (Fig. 2-13d). Comparing the tumor types, we detected a higher level
of intratumoral repertoire similarity among BrMETs than among GBM whether the MOI or a
similar cosine similarity index was used (Fig. 2-14b,c). Therefore, the increased spatial
heterogeneity of variants and neoantigens within GBM is recapitulated at the TCR repertoire level.

51
Ultimately, to further validate that the expanded clones were specifically enriched within
tumor tissue, we performed TCR sequencing on the peripheral blood from 8 of these patients (5
GBM/3 BrMET). As expected, the T cell repertoire from peripheral blood (PBMC) trended
towards lower clonality than the matched TIL (Fig. 2-15a). Intriguingly, the degree of repertoire
similarity between PBMC and TIL appeared greater (p=0.07) within BrMETs than within GBM,
perhaps suggestive of a stronger systemic immune response in patients with metastatic disease
(Fig. 2-15b). Tracking the most highly expanded intratumoral clones across each patient confirmed
that the majority were detectable in peripheral blood but at substantially reduced frequencies (Fig.
2-15c). In addition to this clonotypic diversity, we also observe differential V and J gene usage
between peripheral blood and matched TIL, suggestive of a combination of both VJ-dependent
and VJ-independent divergence as previously described (Fig. 2-16)231.
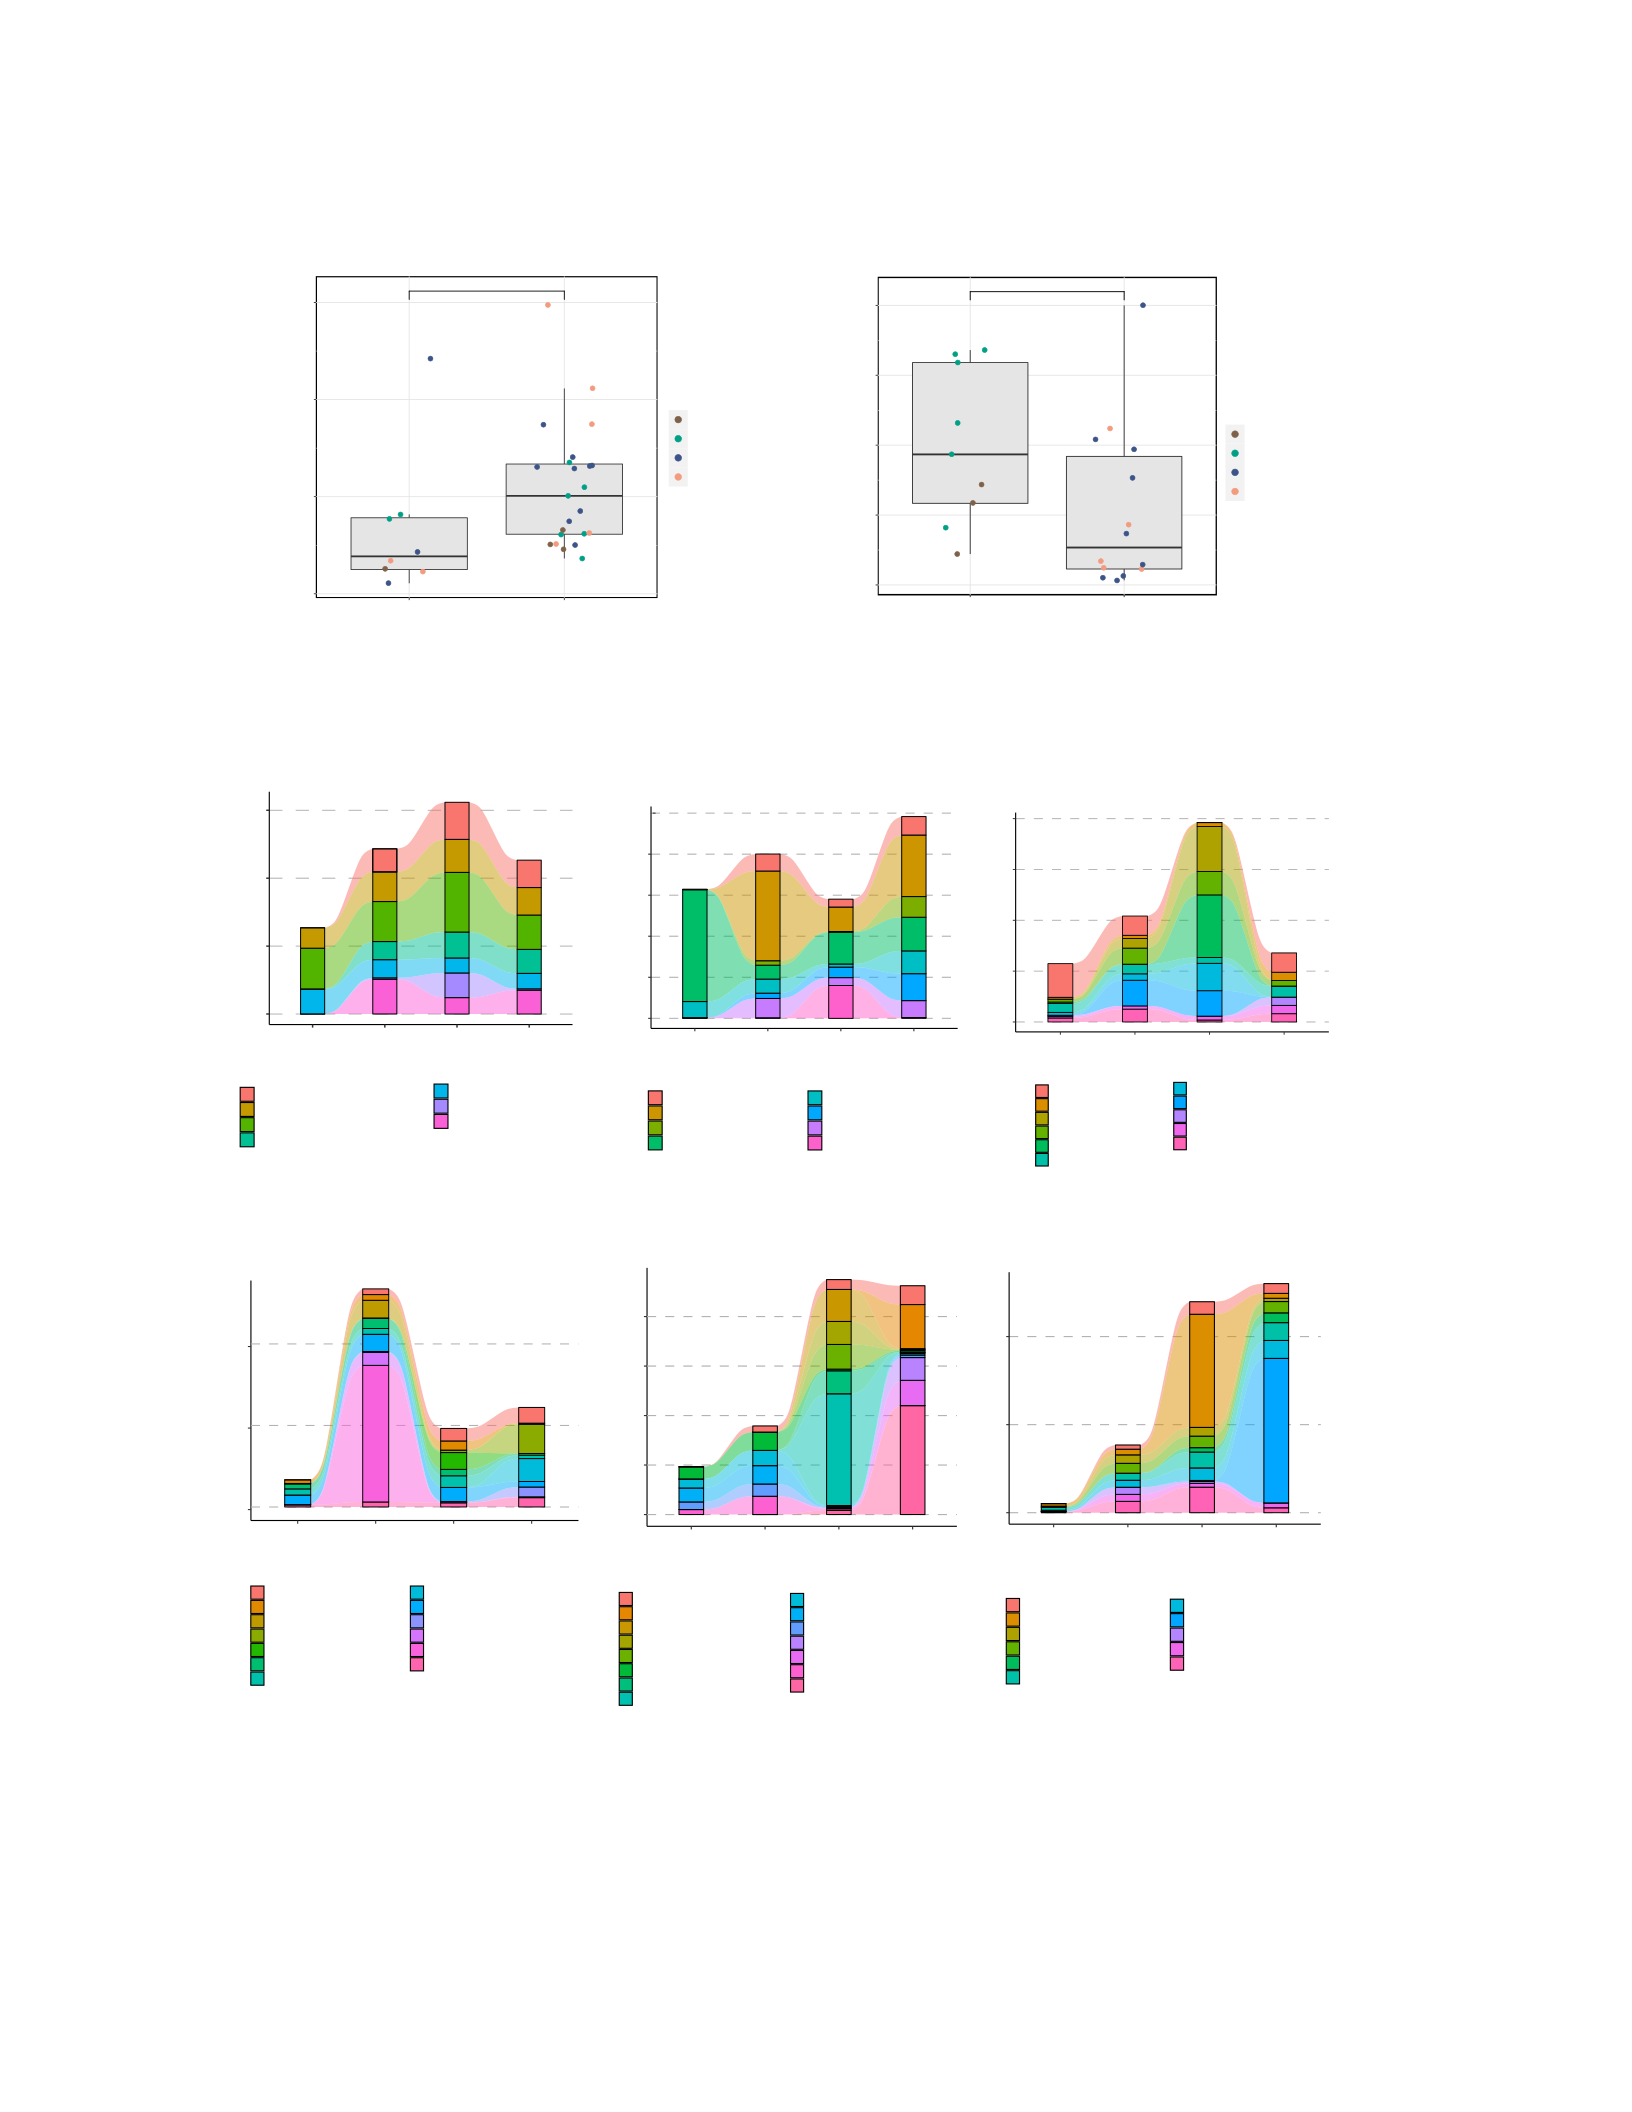
52
Figure 2-15: Clonality and similarity of peripheral blood T cell repertoire. a, Comparison of T cell
repertoire Simpson clonality between peripheral blood and matched TIL. b, Quantification of TCR similarity
between peripheral blood and matched TIL through calculation of the Morisita overlap (see Methods).
Values range from 0 (indicating no similarity) to 1 (identical TCR repertoires). c, Alluvial plots tracking the
frequencies of the top 5 clonotypes from within each region of the tumor. Each clonotype is defined below
the associated plot by the amino acid sequence of its CDR3 and the V gene used.
p= 0.13
0.0
0.1
0.2
0.3
Simpson Clonality
Melanom a
NSCLC
Primary GBM
Recurrent GBM
PB MC
TIL
Clonotype
CASRHVQET QYF TRBV6−5
CASSQQGAGDNSPLHF TRBV7−9
CASSQVIWDRDRSSYNSPL HF TRB V14−1
CASSSAWRTY E Q Y F T RB V 5−1
CASSY QGTTEAFF TRBV6−2/ 06−3
CAST IKSGRDTG ELFF TRBV6−1
CSARDGTSGSPSYE QYF TRBV20−1
BrMET009
Clon ot ype
CASRTG L AH E Q Y F T R BV 11 −2
CASSLKAGLYGYTF TRBV7−9
CASSLRGAGNQPQH F TRBV 13−1
CASSLTW Q S S YE QY F T R BV 28 −1
CASSPAGGSGYN EQF F T RBV 7−9
CASSS GLAGEST DTQY F TRB V11 −1
CASSSLYVAGGPFF TRB V 28−1
CASSS TSVRAYEQYF TRBV7−8
CASSTKQGDYGYTF TRBV5−1
CASSY MEYEQYF TRBV6−2 /06−3
CAST SPSVYY EQYF TRBV6 −5
CATS VAGGYE QYF TRBV24−1
RASSLTG NQ PQH F TR B V7 −3
GBM047.Re
0.0
0.1
0.2
Prop ortion
PBMC Tumor
Re g. 1
Tumor
Re g. 2
Tumor
Re g. 3
Clon ot ype
CARSLAQGS P LHF T RBV5−3
CASSAGGGS SYE QY F T RBV 9−1
CASSHVPGQGESEQ YF TRBV4 −3
CASSIGWARNNEQFF TRBV19−1
CASSLGGGET QYF TRBV12−3 /12−4
CASSLGGRANSYE QYF TRBV11−1
CASSLTE Q GE Q F F T RB V 7−2
CASSP SYSYEQYF T RBV 9−1
CASSQDFGTGVAYEQYF TRBV1 4−1
CSARMG SEPAEAFF TRBV20−1
CSATP GR A N NSP L H F TR B V20 −1
GBM079
0.0
0.1
0.2
Prop ortion
PBMC Tumor
Re g. 1
Tumor
Re g. 2
Tumor
Re g. 3
0.0
0.1
0.2
0.3
Prop ortion
PBMC Tumor
Re g. 1
Tumor
Re g. 2
Tumor
Re g. 3
PBMC Tumor
Re g. 1
Tumor
Re g. 2
Tumor
Re g. 3
Clonotype
CASRLAAEQAFF TRBV12−2
CASRPQGRPDEQYV TRBV6 −5
CASSAGT GGNQPQ HF TRB V 2−1
CASSFQG SFNTEAF F TRBV28−1
CASSGGTGGNSPLHF TRBV2 −1
CASSHGRSNQPQHF TRBV1 1−2
CASSLDAGGSY EQY F TRBV5−5
CASSRDTLPGETQYF TRBV12−1
0.00 0
0.02 5
0.05 0
0.07 5
0.10 0
0.12 5
Prop ortion
PBMC Tumor
Re g. 1
Tumor
Re g. 2
Tumor
Re g. 3
BrMET010
Clon ot ype
CASSFGNT IYF TRBV5−4
CASSFSGQNEAF F TRBV27 −1
CASSLLEGNYEQYF TRBV7 −9
CASSMTGGGTEAFF TRBV5 −6
CASSP GNEQFF TRBV11−2
CASSQETGSYEQYF TRBV4−1
CASSQGTGDTGELFF TRBV4−3
CASSQSQNTEAF F TRBV4−1
CASSRRVGGY TF TRB V 11−2
CATRAGE GY GYT F T RBV 5−1
CSARGYTF TRBV29−1
BrMET028
0.00
0.03
0.06
0.09
0.12
Prop ortion
PBMC Tumor
Re g. 1
Tumor
Re g. 2
Tumor
Re g. 3
0.00
0.05
0.10
0.15
0.20
Prop ortion
GBM074
PBMC Tumor
Re g. 1
Tumor
Re g. 2
Clon ot ype
CAAKGLTE P TKLVANEKLF F TRBV10−1
CASLSPSRSYEQYF TRBV2 8−1
CASRAGVD EQF F T RBV2−1
CASSE TPNSPLHF TRBV10−1
CASSFRGL QETQYF TRBV5−4
CASSLTG MTE A FF TRB V5 −4
CASSP GFNYGYTF TRBV11 −1
CASSP GLAGT YY SYNEQFF TRBV18−1
CASSQDGTAISNQPQHF TRBV3−1/03 −2
CASSQRTG EP S YE QY F T R BV 7−9
CASSWGTGVDQGYTF TRBV7 −9
CSASLGPFDEQFF TRBV20−1
CSASRPG HG YTF TRBV20−1
CSVEDRDRGDYGYTF TRBV29 −1
CSVGEGGWEL FF TRB V2 9−1
Tumor
Re g. 3
a
c
p= 0.07
0.0
0.2
0.4
0.6
0.8
PB MC/TIL Morisita Overlap
BrMET
GBM
Melanom a
NSCLC
Primary GBM
Recurrent GBM
b
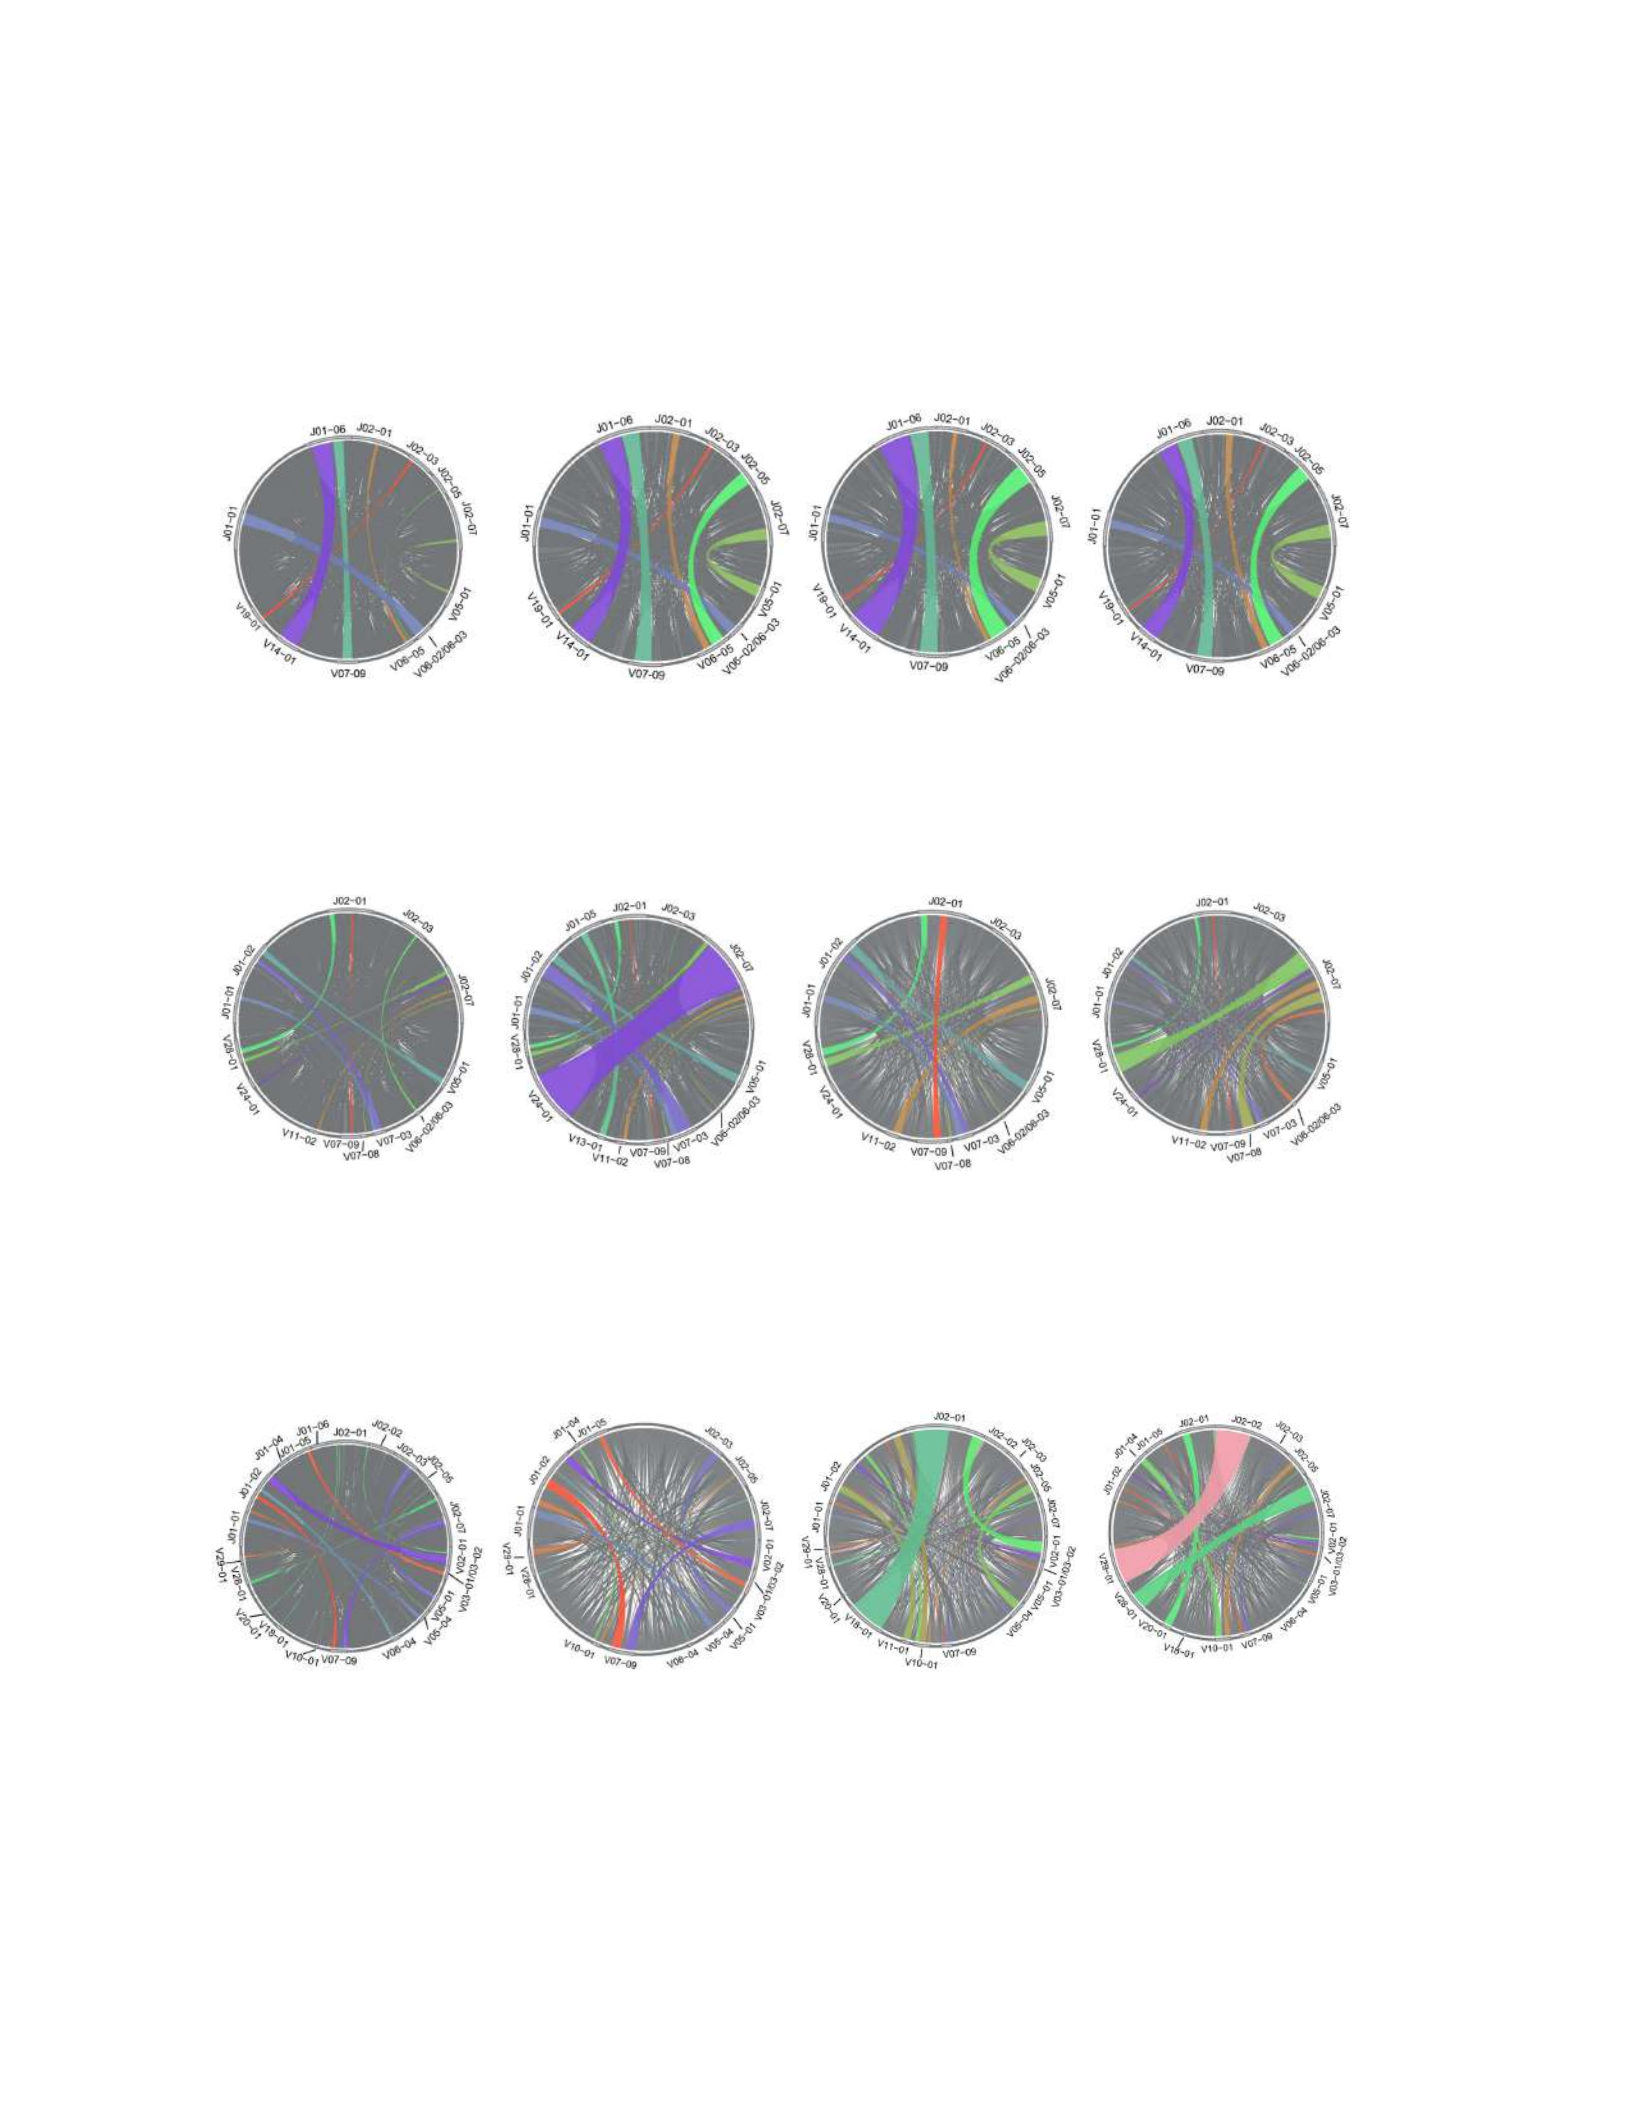
53
Figure 2-16: Distribution of T cell repertoire V-J usage. Modified circos plots displaying the prominent
V-J gene combinations within select tumors and matched peripheral blood. The frequency of a given V or J
gene segment within the repertoire is represented by its arc length along the circle, while the width of the
connection between a given V-J pair corresponds to the frequency of that combination. Within each patient,
the top 5 V-J pairs within any one region are highlighted across all matched samples. All plots correspond
to V-J usage among TCR β chain sequences.
BrMET009
GBM047.Re
GBM074
PBMC Tumor Reg. 1 Tumor Reg. 2 Tumor Reg. 3
PBMC Tumor Reg. 1 Tumor Reg. 2 Tumor Reg. 3
PBMC Tumor Reg. 1 Tumor Reg. 2 Tumor Reg. 3

54
2.3 Discussion, Future Directions and Conclusions
Despite numerous advances in both targeted and immune-based therapies, the prognosis
for patients with malignant brain tumors such as GBM or BrMETs remains poor. Within GBM,
one potential rationale for the high rate of treatment failure is the extensive intratumoral cellular
and molecular heterogeneity168 owing to complex tumor clonal dynamics. However, the impact of
this tumor cell diversity upon the tumor-immune microenvironment remains unclear. Furthermore,
the spatial heterogeneity of both tumor and immune landscapes within BrMETs requires further
study.
To address these knowledge gaps, we performed comprehensive immunogenomic profiling
on multiple spatially distinct regions from a cohort of 30 patients with primary or secondary
malignant brain tumors. We observed a striking distinction in the distribution of somatic variants,
with a majority of mutations usually shared by all analyzed regions within BrMETs while gliomas
were markedly heterogeneous and subclonal. This dichotomy extended to the distribution of
candidate neoantigens within these tumors, whereas the intratumoral distribution of targetable CT
antigens was more homogeneous. Furthermore, the intratumoral TCR repertoire was significantly
more similar between spatially distinct regions of BrMETs than gliomas, which often harbored
locally expanded T cell clones.
Previous studies have reported on the significant genomic and transcriptional variability
between spatially distinct regions of gliomas173,206,207 and hypothesized as to the consequences of
heterogeneity on treatment resistance. However, our results suggest that this spatial heterogeneity
of genomic alterations is minimal within metastatic brain tumors, which instead display a
markedly more clonal distribution. We envisage that this difference may be due to the separate
evolutionary trajectories of these tumor types. Recent studies suggest that GBMs arise from the

55
slow accumulation of somatic mutations in neural stem cells during which time multiple subclones
can develop before presenting as a clinically apparent tumor232. However, secondary BrMETs
likely develop quickly from the rapid growth of an already transformed subclone upon arrival into
the CNS. This malignant clone will quickly develop into an apparent tumor allowing less time for
the development of genetically disparate subclones. Previous studies have shown that these
metastatic clones can accumulate additional genomic alterations relative to the matched primary,
thereby providing potentially unique therapeutic targets that are likely clonal within the metastatic
tumor208,233. Future work should explore whether this tumor spatial homogeneity represents a
specific feature of BrMETs or is a more general characteristic of secondary metastatic tumors.
Importantly, the comparative distinctions we observed extend to the distribution of
candidate class I and class II neoantigens, as patients with metastatic tumors harbor a significantly
higher proportion of clonal neoantigens. This dichotomy between BrMETs and gliomas could have
profound implications on anti-tumor immunity as studies have reported that T cell
immunoreactivity against clonal neoantigens drives sensitivity to checkpoint blockade
treatment174,175. However, additional work is needed to characterize the degree of anti-tumor
immunity within malignant brain tumors and determine the relative contributions of clonal and
subclonal neoantigens in stimulating immune responses. In particular, detailed analysis of the
antigenic targets of the T cell clones within tumors will be critical to understanding how antigen
clonality shapes immunogenicity.
Recent studies have broadened our understanding of the immune microenvironment within
gliomas and BrMETs through methods such as mass cytometry, RNA sequencing, and
immunofluorescence229,230. Our work builds on this by exploring the spatial heterogeneity of the
immune response and performing a deeper analysis on the tumor infiltrating lymphocyte

56
populations. Through immune profiling from RNA-seq data, we did not detect significant
intratumoral differences in either the immune infiltrate or activation state for either tumor type in
contrast to the significant heterogeneity of variants and neoantigens within gliomas. However,
many of the immune profiling analyses performed are to some extent limited in their ability to
resolve specific immune cell populations and activation states owing to their reliance on bulk
RNA-seq data. Further spatial analysis with more sensitive metrics such as flow cytometry,
immunofluorescence, single-cell RNA-seq, and/or spatial transcriptomics would be needed to
clarify whether this is true immune homogeneity or a limitation of bulk RNA-seq analysis.
In contrast, TCR repertoire sequencing did uncover substantial spatial heterogeneity. While
both GBM and BrMETs demonstrated evidence of expanded intratumoral T cells, many of the
dominant clones within GBM samples were highly spatially restricted. These data suggest that
tumors harbor complex immune microenvironments in which a given tumor may contain pockets
of clonally expanded T cells adjacent to regions with minimally expanded T cells. Whether this T
cell heterogeneity is due to the recognition of spatially diverse subclonal antigens or the result of
extrinsic regional features such as inflammatory cytokines that promote clonal expansion requires
further study.
Taken together, these results carry immediate significance for the design and
implementation of clinical studies in malignant brain tumors. The extensive intratumoral
heterogeneity within gliomas indicates that single-site genomic analysis will not capture the
totality of targetable mutations and neoantigens. This is of particular importance in the design of
targeted therapy studies and/or neoantigen vaccines, as the analysis of multiple regions identifies
a significantly higher number of targetable neoantigens than one site alone. We have already begun
to implement this approach in a trial of a personalized neoantigen vaccine in patients with newly

57
diagnosed GBM (NCT03422094). An additional benefit of this approach is increased confidence
in the clonality of targeted antigens, as clonal neoantigens would presumably represent ideal
targets. However, it remains to be seen whether sampling additional regions beyond the number
in this study and the aforementioned clinical trial would shed further light on the molecular
landscape. Furthermore, the complexity of the intratumoral T cell repertoire argues that multiple
sites should be analyzed for the potential expansion of neoantigen-reactive T cells or isolation of
tumor-specific TCRs for therapy. On the other hand, the relative homogeneity of BrMETs suggests
that a single region is sufficient for genomic and immunological phenotyping.
Overall, this chapter provides an immunogenomic profile of malignant brain tumors
through a multi-sector approach showcasing substantial intratumoral heterogeneity within gliomas
while highlighting surprising homogeneity among BrMETs. These distinctions hold for both
cancer cell-intrinsic (genomic alterations) and cancer cell-extrinsic (TCR repertoire) features. A
growing understanding of the tumor-immune microenvironment and an appreciation of its spatial
complexity may improve the efficacy of immunotherapy in patients with malignant brain tumors.

58
CHAPTER THREE
Immunological characterization of malignant brain tumors
3.1 Introduction
In contrast to the low efficacy of ICB therapy in the treatment of primary brain
malignancies such as GBM, metastatic brain tumors have shown a surprising degree of
responsiveness161,162. This suggests that despite decades of skepticism rooted in the notion of CNS
immunoprivilege, the immune system can be leveraged to eradicate intracranial malignancies.
However, it also points to fundamental distinctions in the immunological state of primary tumors
such as GBM and secondary BrMETs. Despite extensive genomic profiling of these tumors,
comparatively less is known about their immunological microenvironments.
Furthermore, while primary GBM classically presents with fewer than 100 exome-wide
mutations, a unique subset of approximately 20-30% of recurrent gliomas exhibit a treatment-
induced hypermutated phenotype157,158,206,219. Conventional standard-of-care treatment for GBM
includes the chemotherapeutic Temozolomide (TMZ) which functions by alkylating DNA at
guanine residues. Mutations in components of the DNA mismatch repair pathway including MSH6
have been implicated in mediating TMZ resistance and are suspected to be involved in the
development of the hypermutated recurrent state234–236. This is likely due to an inability to detect
TMZ-induced DNA damage resulting in continued cancer cell proliferation and incorporation of
genomic defects into resulting daughter cells. Meanwhile, several studies across different cancer
types have reported enhanced aPD-1 therapy responsiveness in tumors with a high mutational
burden due to mismatch repair deficiency237,238. Thus, there has been immense interest in applying
this principle to the treatment of hypermutated recurrent GBM with ICB therapy. Early reports

59
have suggested some degree of responsiveness in patients with a hypermutated phenotype owing
to germline defects in DNA repair pathways, but the generalizability of these results to treatment-
induced hypermutation is not clear166,167,194. Furthermore, there has been no comprehensive
immunological profiling of these hypermutated recurrent tumors to assess their similarities and
differences to primary GBM.
Recent advances in single-cell phenotyping such as mass cytometry (CyTOF) and single-
cell RNA sequencing (scRNA-seq) have allowed for a more detailed picture of the immunological
state of GBM and BrMETs to emerge. A predominant focus of much immune profiling in
malignant brain tumors has been the tumor infiltrating myeloid cells, specifically those of the
macrophage or microglial lineage. This spotlight is well earned as tumor-associated macrophages
(TAMs) and microglia have been shown to comprise a significant fraction of the bulk tumor mass
in GBM and play a critical role in promoting tumor invasion, survival, and proliferation239–242.
Recent studies have utilized modern technologies to more deeply probe the immunological
microenvironment of both GBM and BrMETs with particular interest in the tumor-infiltrating
myeloid compartment. One study using CyTOF on a cohort of human tumors identified
significantly greater overall leukocyte infiltration into BrMETs with a higher fraction of
monocyte-derived tumor-associated myeloid cells230. Another study utilizing several
complementary methods produced a similar result with greater monocyte-derived macrophages
within BrMETs that appeared to express more pro-inflammatory mediators than the more
immunosuppressive microglia present in GBM229. These findings are consistent with our own data
outlined earlier that utilized bulk transcriptomics.
Perhaps owing to the relative scarcity of lymphocytes within gliomas, comparatively less
is known about the expression programs and functional states of tumor infiltrating T cells within

60
GBM and BrMETs. Flow cytometry-based profiling has revealed a state of severe exhaustion
among T cells within GBM characterized by the upregulation of numerous inhibitory receptors
such as PD-1, CTLA-4, and LAG-3187,188. A recent study utilizing scRNA-seq technology
identified NK cell-like expression signatures among cytotoxic glioma-infiltrating T cells with
expression of inhibitory receptors such as CD161243. However, these works did not provide a
comparative analysis between GBM and BrMETs of the expression programs and functional states
of tumor-infiltrating T cells. Furthermore, the TCR b chain sequencing described in the previous
chapter unveiled a substantial degree of intratumoral clonal expansion among both tumor types,
with GBM often harboring significantly expanded but spatially restricted T cell clones. Thus, we
sought to more deeply characterize the immune microenvironment within a subset of the 30 tumors
that underwent the spatial characterization described in chapter two. To do so, we performed
scRNA-seq on sorted CD45+ immune cells from within 5 primary GBM, 1 hypermutated recurrent
GBM, and 5 BrMET samples.
3.2 Results
3.2.1 Single-cell immunological characterization of GBM & BrMET cohorts
From the previously discussed cohort of 30 patients (15 primary glioma, 4 recurrent
glioma, and 11 brain metastases), a group of samples had direct ex vivo TIL frozen down at the
time of resection. In total, we sorted live CD45+ cells from 11 of these for scRNA-seq with
additional 5’ VDJ enrichment to provide T cell clonotype information. These 11 samples were
pooled for subsequent analysis performed with the aid of Anthony Wang, a graduate student in
our lab. Focusing specifically on CD3+ T cells, we identified 18 clusters that were grouped into 9
distinct cell types based upon canonical marker expression (Fig. 3-1). These cell types included
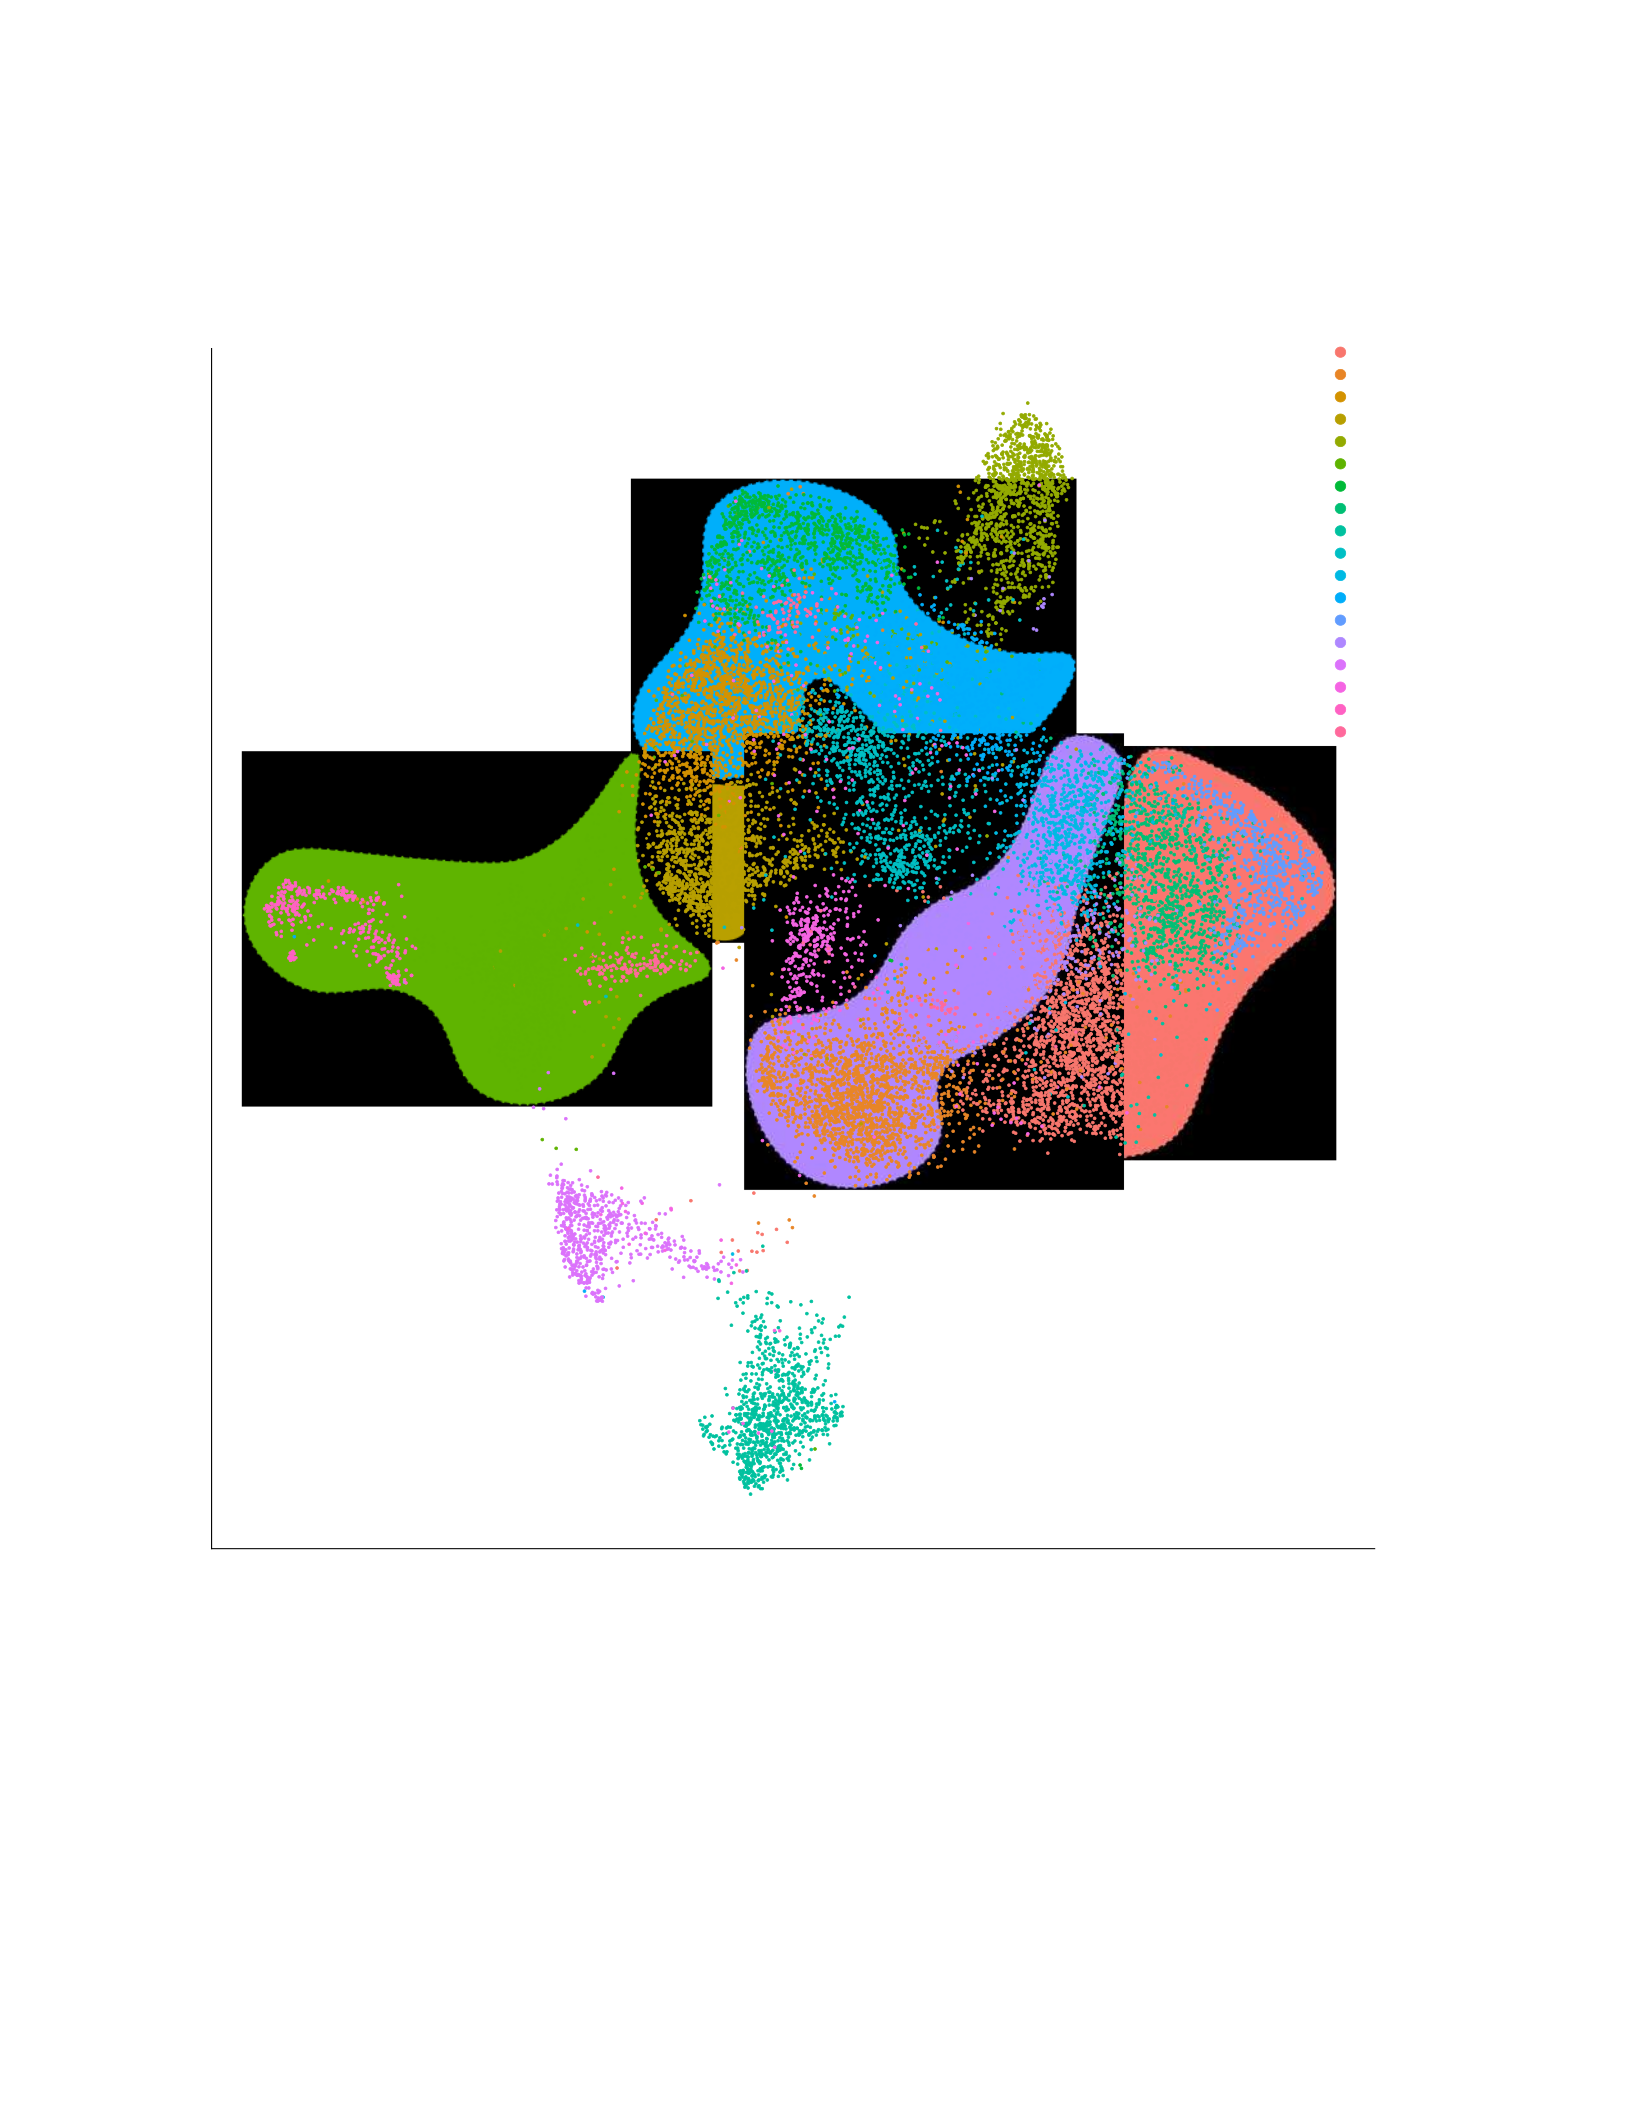
61
UMAP1
UMAP2
0
1
2
3
4
5
6
7
8
9
10
11
12
13
14
15
16
17
3
0
2
1
4
5
6
7
8
910
11
12
13
14
15
16
17
CD4+ Effector
T cells 2
Treg
Exhausted CD8+ T cells
Cytotoxic CD8+ T cells
Terminally Differentiated CD8+ T cells
Naive/CM T cells
CD4+ Memory T cells
CD8+ EM T cells
CD4+
Effector
T cells 1
Figure 3-1: T cell profile of GBM and BrMET cohorts. UMAP visualization of T cells collected from 5 BrMET and 6 GBM
samples identified by cell types (C0, C7, C12: Naive/CM T cells; C1, C10, C13: CD4+ Memory T cells; C15: CD4+ Effector T
cells 1; C3, C9: CD8+ EM T cells; C2, C6, C11: Cytotoxic CD8+ T cells; C4: Terminally Differentiated CD8+ T cells; C5,
C16, C17: Exhausted CD8+ T cells; C14: CD4+ Effector T cells 2; C8: Tregs).

62
four groups of CD8 T cells (Exhausted CD8+ T cells, CD8+ Effector Memory T cells, Cytotoxic
CD8+ T cells, Terminally Differentiated CD8+ T cells), four groups of CD4+ T cells (CD4+
Effector T cells 1, CD4+ Effector T cells 2, CD4+ Memory T cells, Tregs) and a population of
naïve T cells. Strikingly, we observed significant segregation by tumor type with certain clusters
and cell types belonging almost exclusively to GBM or BrMET samples, respectively (Fig. 3-2).
This distinction was present among both CD4 and CD8 T cell subsets, pointing to substantially
discordant T cell states between the two tumor types.
In contrast to prior reports on dramatic T cell exhaustion in GBM, we observed
comparatively few GBM CD8 T cells within the canonically exhausted CD8 T cell group (clusters
5, 16, 17) characterized by higher expression of LAG3, HAVCR2, TIGIT, and PDCD1 (Fig. 3-3).
Meanwhile, T cells from GBM displayed enrichment for a CD8 T+ cell subset (cluster 4)
characterized by expression of KLRG1. The expression of KLRG1 has been associated with a
terminally differentiated T cell subset characterized by proliferative dysfunction and decreased
effector functions in various models of chronic viral infection244–246. Notably, while these cells
expressed similar levels of cytotoxic molecules such as GNLY and GZMB relative to the exhausted
CD8 T cell groups, they expressed lower levels of exhaustion-associated markers such as LAG3,
PDCD1, and TOX (Fig. 3-3).
Furthermore, GBM and BrMET tumors appear to contain dramatically different CD4 T
cell compartments. Cluster 14 (CD4+ effector T cells 2) is comprised of effector CD4+ T cells
almost exclusively derived from BrMET samples, while cluster 15 (CD4+ effector T cells 1) is
predominant CD4+ T cells from GBM. Comparing the two groups, we observe substantially higher
levels of the co-stimulatory molecule TNFRSF4 (OX40) and pro-inflammatory cytokine IFNG
among the cluster 14 CD4+ T cells within BrMETs (Fig. 3-3). However, these CD4 T cells also
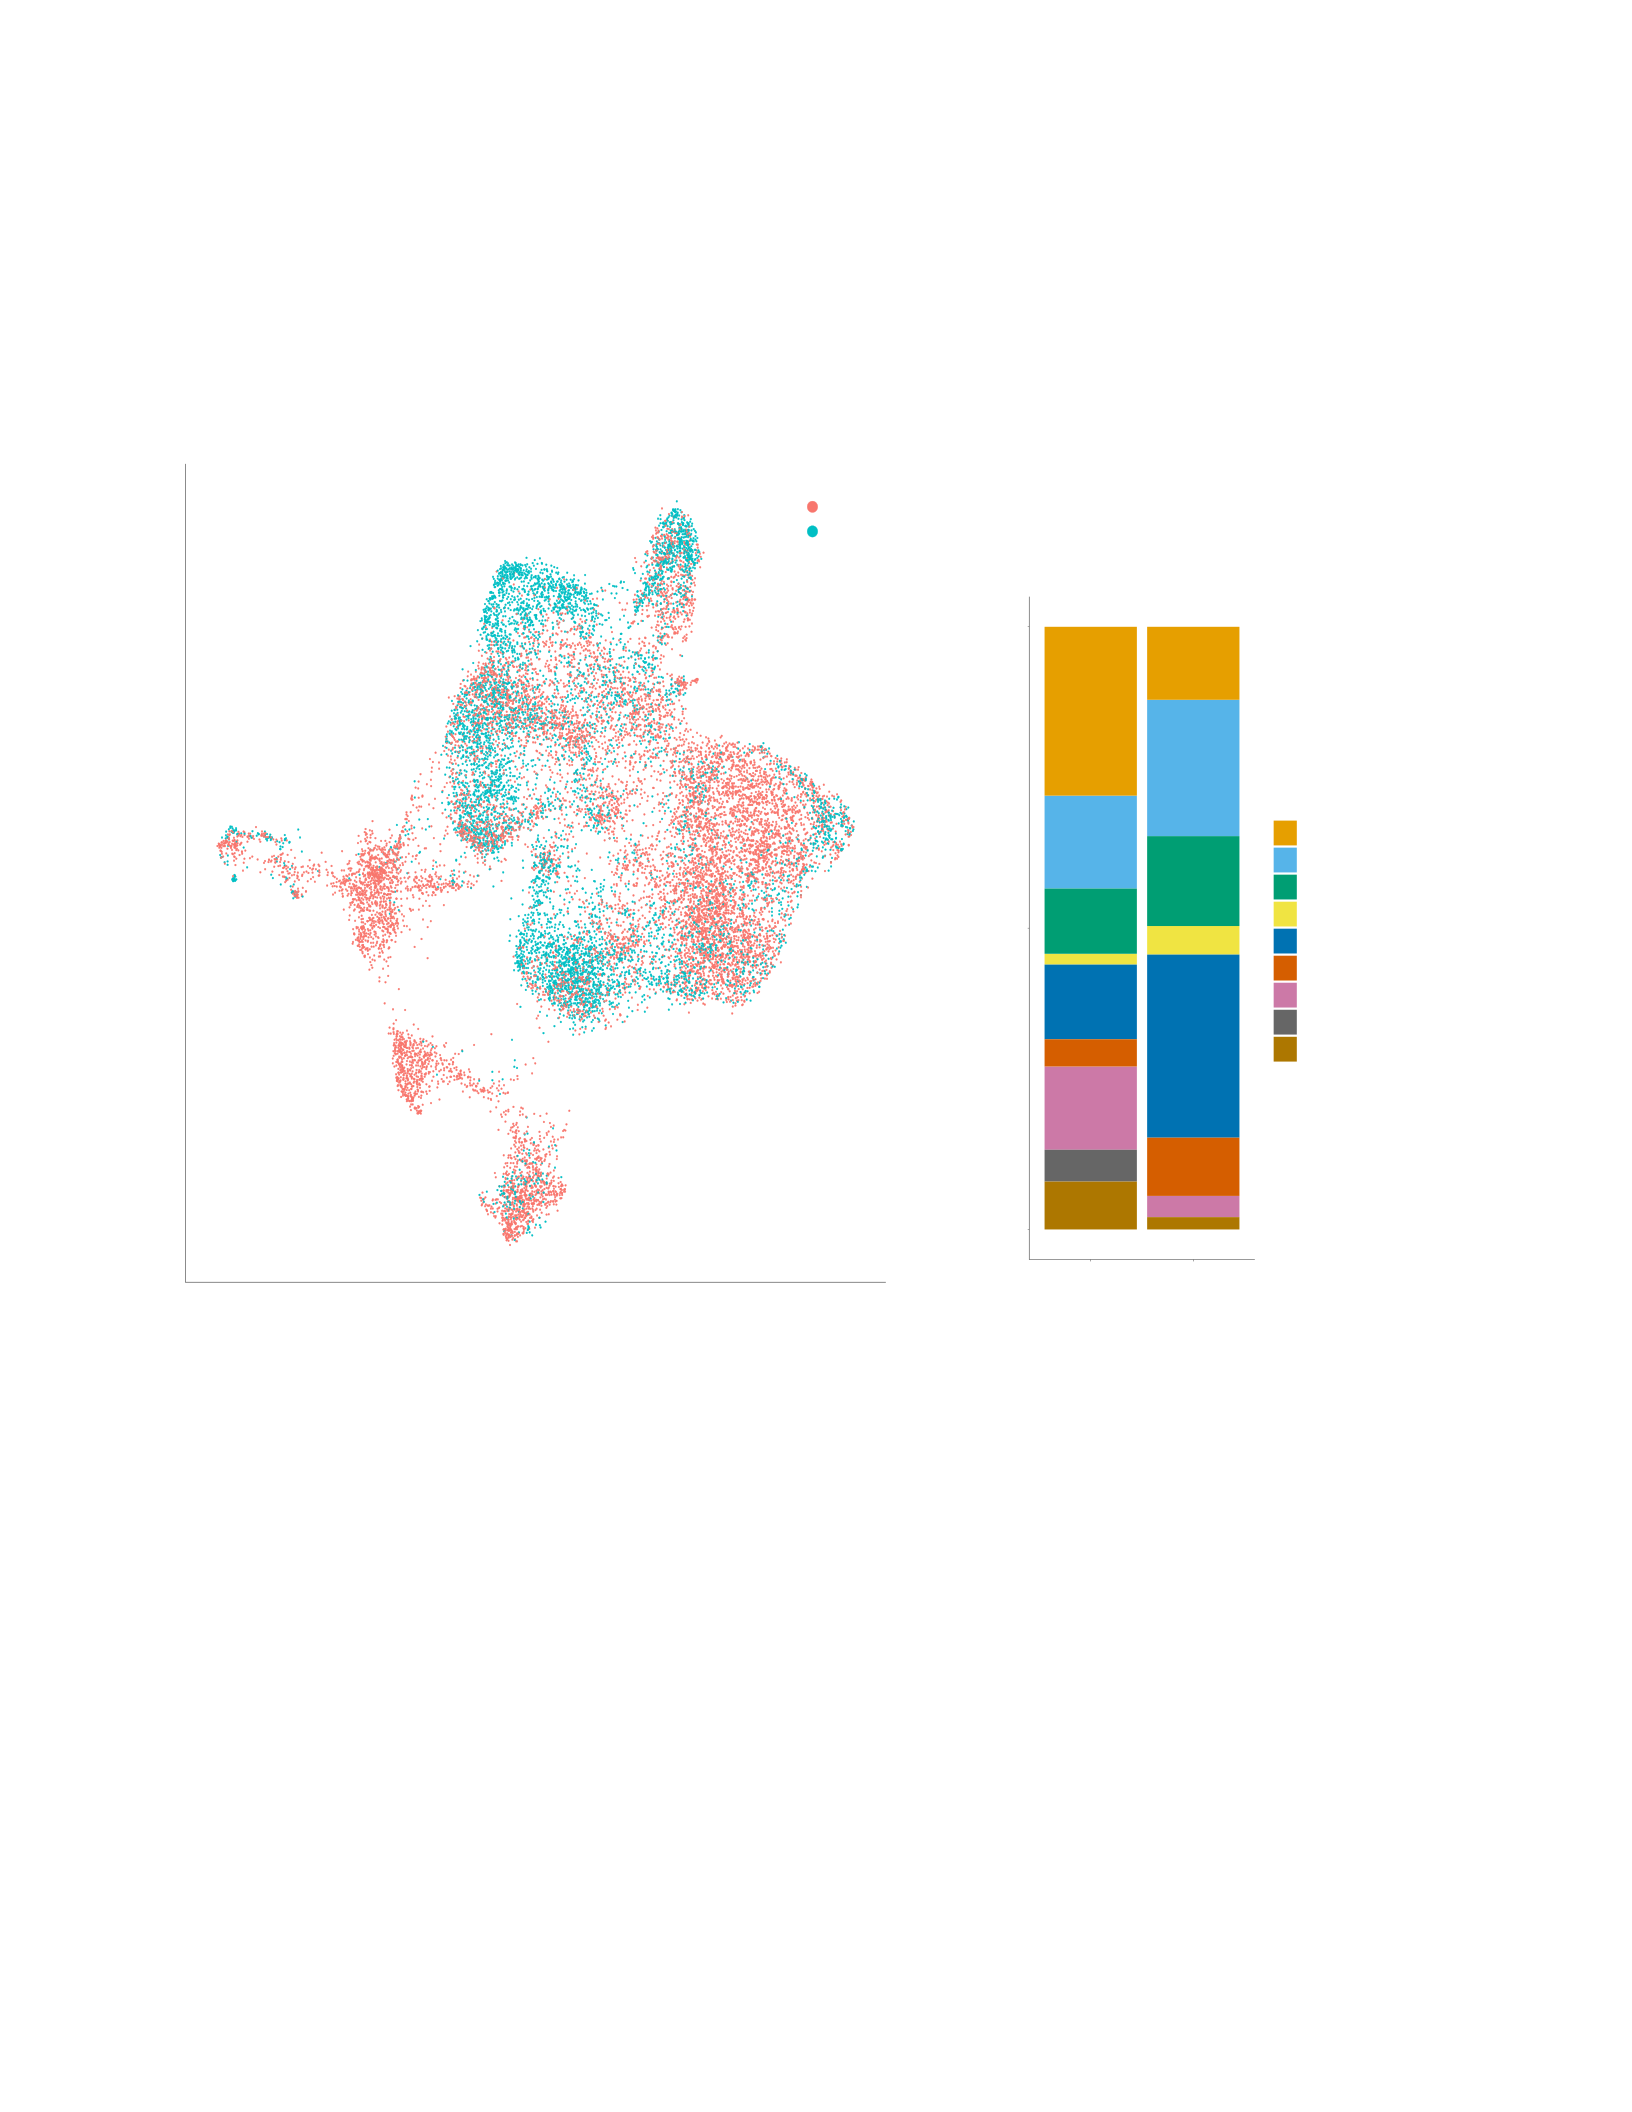
63
BrMET
GBM
UMAP 1
UMAP 2
0.0
0.5
1.0
BrMET GB M
Proportion of cells
Naive/CM T cell
CD4+ Memory T cell
CD8+ Memory T cell
CD4+ Effector T cell 1
CD8+ Cytotoxic T cell
CD8+ Ter minally Differentiated T cell
CD8+ Exhausted T cell
CD4+ Effector T cell 2
Tr egs
Figure 3-2: Distribution of T cell states by tumor typ e. a, UMAP projection of T cells collected from GBM & BrMET tumors
labeled by sample tumor type. b, Bar plot displaying relative frequency of cell types among each tumor type.
a b
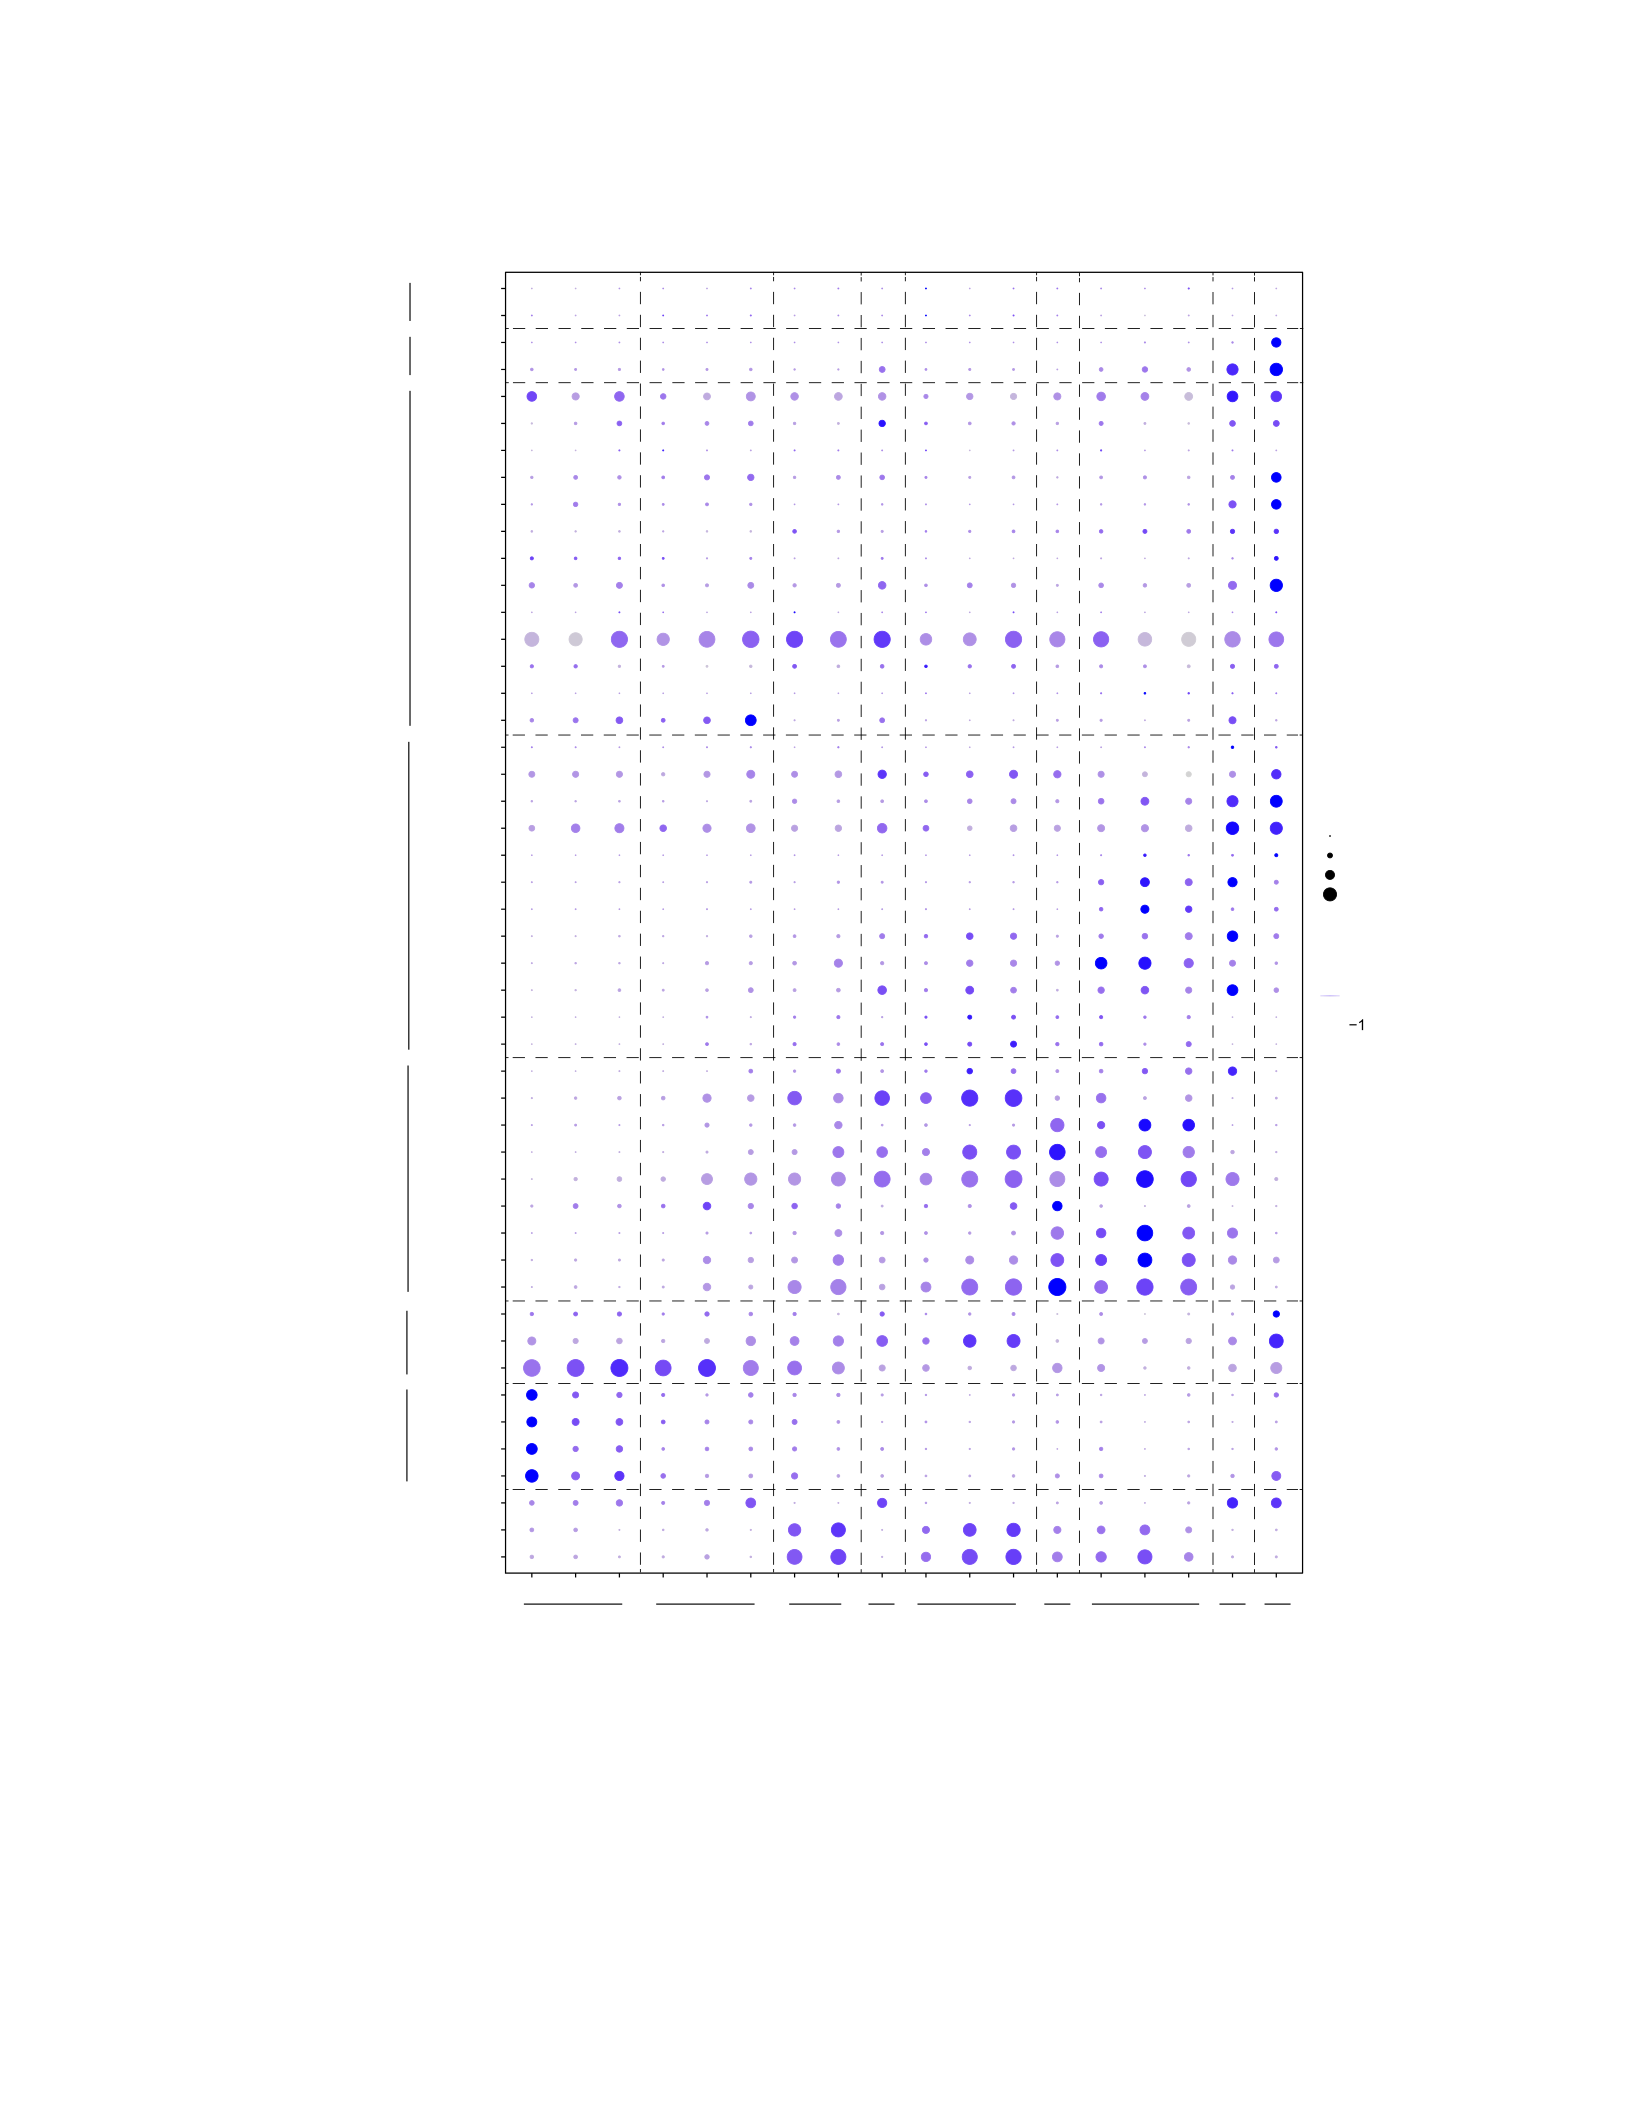
64
CD8A
CD8B
CD4
SELL
CCR7
TCF 7
LEF1
IL7R
CD27
CD28
NKG7
PRF1
GZ MB
KLRG1
GZ MA
GZ MH
GN LY
GZ MK
IFNG
EOMES
SLAMF7
PDCD1
LAG3
TOX
ENTPD1
HAVCR2
TNF RSF 9
PRDM1
TIG IT
TNF RSF 14
BTLA
CD40LG
B3GAT1
CD84
CXCR4
CXCR5
ICOS
IL6R
IL21R
TNF RSF 4
SLAMF1
BCL6
MAF
STAT3
CTLA4
FOXP3
CD14
SPI1
12 7 0 10 13 1 9 3 15 11 6 2 4 17 516 14 8
Percent Expressed
0
25
50
75
0
1
2
Average Expression
Naive markers
Memory markers
Cytotoxic mar kers
Exhaustion markers
TF H-li k e markers
Treg mark ers
Naive/CM T cell
CD4+ Memory
T cell
CD8+ Memory
T cell
CD4+ Effector
T cell I
CD8+ Cytotoxic
T cell
CD8+ Terminally
Differentiated T cell
CD8+ Exhausted
T cell
CD4+ Effector
T cell 2 Tregs
Myeloid markers
Figure 3-3: Gene expression of T cell clusters. Dotplot of gene expression values across clusters for select cell type-
associated markers.

65
express substantially higher levels of markers typically associated with CD8 T-cell exhaustion
such as TIGIT, HAVCR2, and TOX. These two clusters also express unique cytotoxicity markers
with enrichment of GZMB and PRF1 among cluster 14 in BrMETs but higher levels of GZMK and
GZMH among cluster 15 in GBM samples. Additionally, in line with previous work utilizing
CyTOF, BrMET tumors display a substantially greater fraction of immunosuppressive Tregs230.
Finally, we investigated the degree of clonal expansion and gene expression profile of
clonally expanded T cells within both tumor types. Despite the regional clonal expansion described
for GBM in the previous chapter, at a bulk level most gliomas do not contain significantly
expanded clones (Fig. 3-4a). The notable exception to this is GBM065.Re which will be discussed
in detail in the next section. BrMET009 and BrMET010 (both NSCLC) have the most significant
clonal expansion among the BrMETs, and these expanded clones primarily lie within cluster 5
which was classified as an exhausted CD8 T cell cluster (Fig. 3-4b). In contrast, the expanded
clones from GBM065.Re lie within cluster 6 and did not express very high levels of canonical
exhaustion-associated genes despite significant clonal enrichment. Interestingly, the moderately
expanded clones observed in a majority of GBM samples did fall within the terminally
differentiated cluster 4 characterized by KLRG1 expression. While most of the expanded clones
belonged to CD8 T cells, the previously described cluster 14 consisting predominantly of BrMET
CD4 T cells with expression of TNFRSF4 (OX40) and IFNG did contain some of the only clonally
expanded CD4 T cells across all samples (Fig 3-4b).
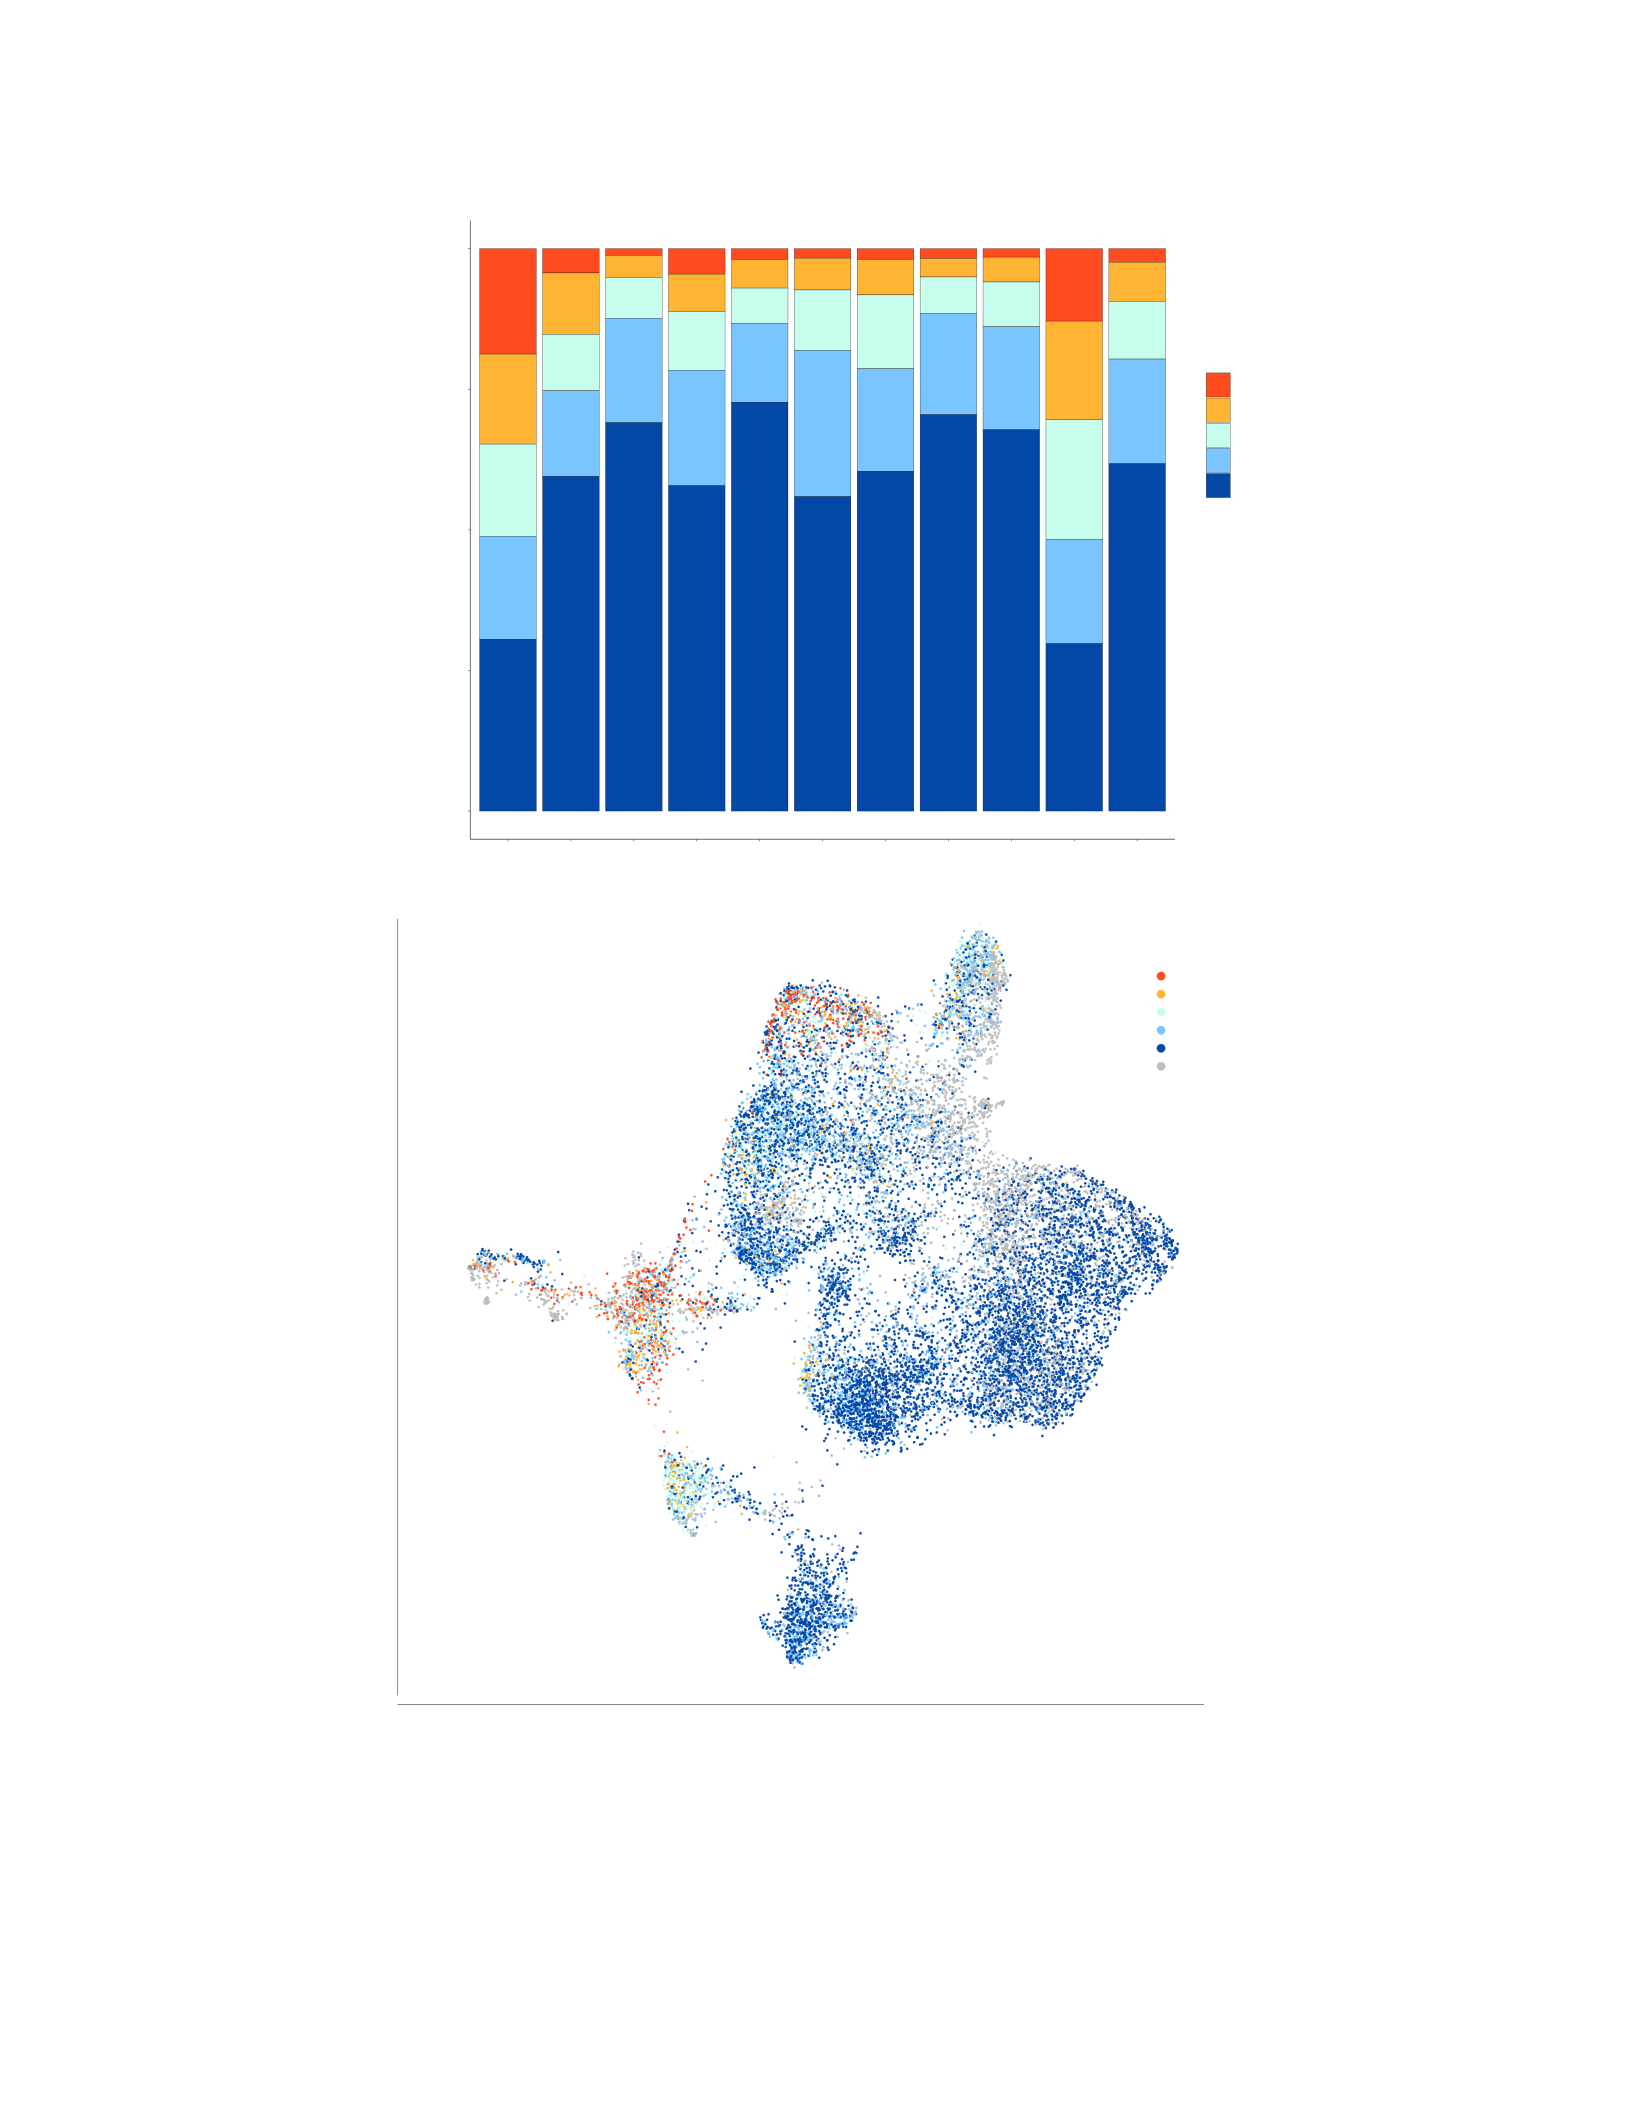
66
0.00
0.25
0.50
0.75
1.00
Oc cupi ed Repe rtoir e Space
Clonal Indices
[1:1]
[2:5]
[6:20]
[21:100]
[101:1000]
Br ME T 00 9 Br ME T 01 0 Br ME T 01 8 Br ME T 02 7 Br ME T 02 8 GBM056 GBM062 GBM063 GBM064 GBM065Re GBM074
Hyperexpanded (50 < X <= 500)
Large (20 < X <= 50)
Medium (5 < X <= 20)
Small (1 < X <= 5)
Single (0 < X <= 1)
NA
Figure 3-4: T cell clonal expansion among GBM & BrMETs. a, Representation of the proportion of total T cell repertoire space
occupied by T cell clones with a given clonal index in each sample. b, UMAP representation of T cells with clonal frequently overlaid.
a
b
UMAP2
UMAP1

67
3.2.2 Genomic and immunological profiling of a hypermutated recurrent GBM
Owing to a unique immunogenomic profile and growing literature studying the genomics
of hypermutated GBM, we devote the following section to an in-depth analysis of a specific tumor
with this phenotype. GBM065.Re presented with tumor progression of an IDH1 mutant anaplastic
astrocytoma 5 years after initial resection. In the interim, the patient was treated with four cycles
of vincristine, CCNU, and procarbazine, proton radiation therapy, and six cycles of high-dose
temozolomide (TMZ) (Fig. 3-5a). Using DNA WES of 4 tumor regions, we observed a substantial
increase in the mutational burden across all regions of the recurrent tumor (mean 1587
variants/sector) relative to the prior primary tumor (219 variants) (Fig. 3-5b). Variant analysis
revealed that two regions from the recurrent tumor contained the MSH6 T1219I variant previously
identified in Lynch syndrome and known to act in a dominant-negative manner247,248 (Fig. 3-6a).
The other two regions both contained unique MSH6 mutations not previously reported (G1148S
& G1116D) but computationally predicted as “likely to impair molecular function” by a previously
published tool for the prediction of MSH6 variant significance249. Additional mutations in DNA
mismatch repair genes such as MLH3 and POLD3 were detected in some but not all regions of the
recurrent tumor. This heterogeneity of potentially pathogenic mismatch repair defects in
hypermutated recurrent GBM was observed in one prior patient and suggests either the emergence
of multiple unique routes to hypermutation occurring within the same tumor or a common
alternative mechanism unrelated to these genes219. An analysis of the mutational signatures within
the recurrent tumor revealed a significant enrichment for signature 11, known to be associated
with prior treatment with TMZ213,214 and previously reported to be enriched in hypermutated
recurrent gliomas218.
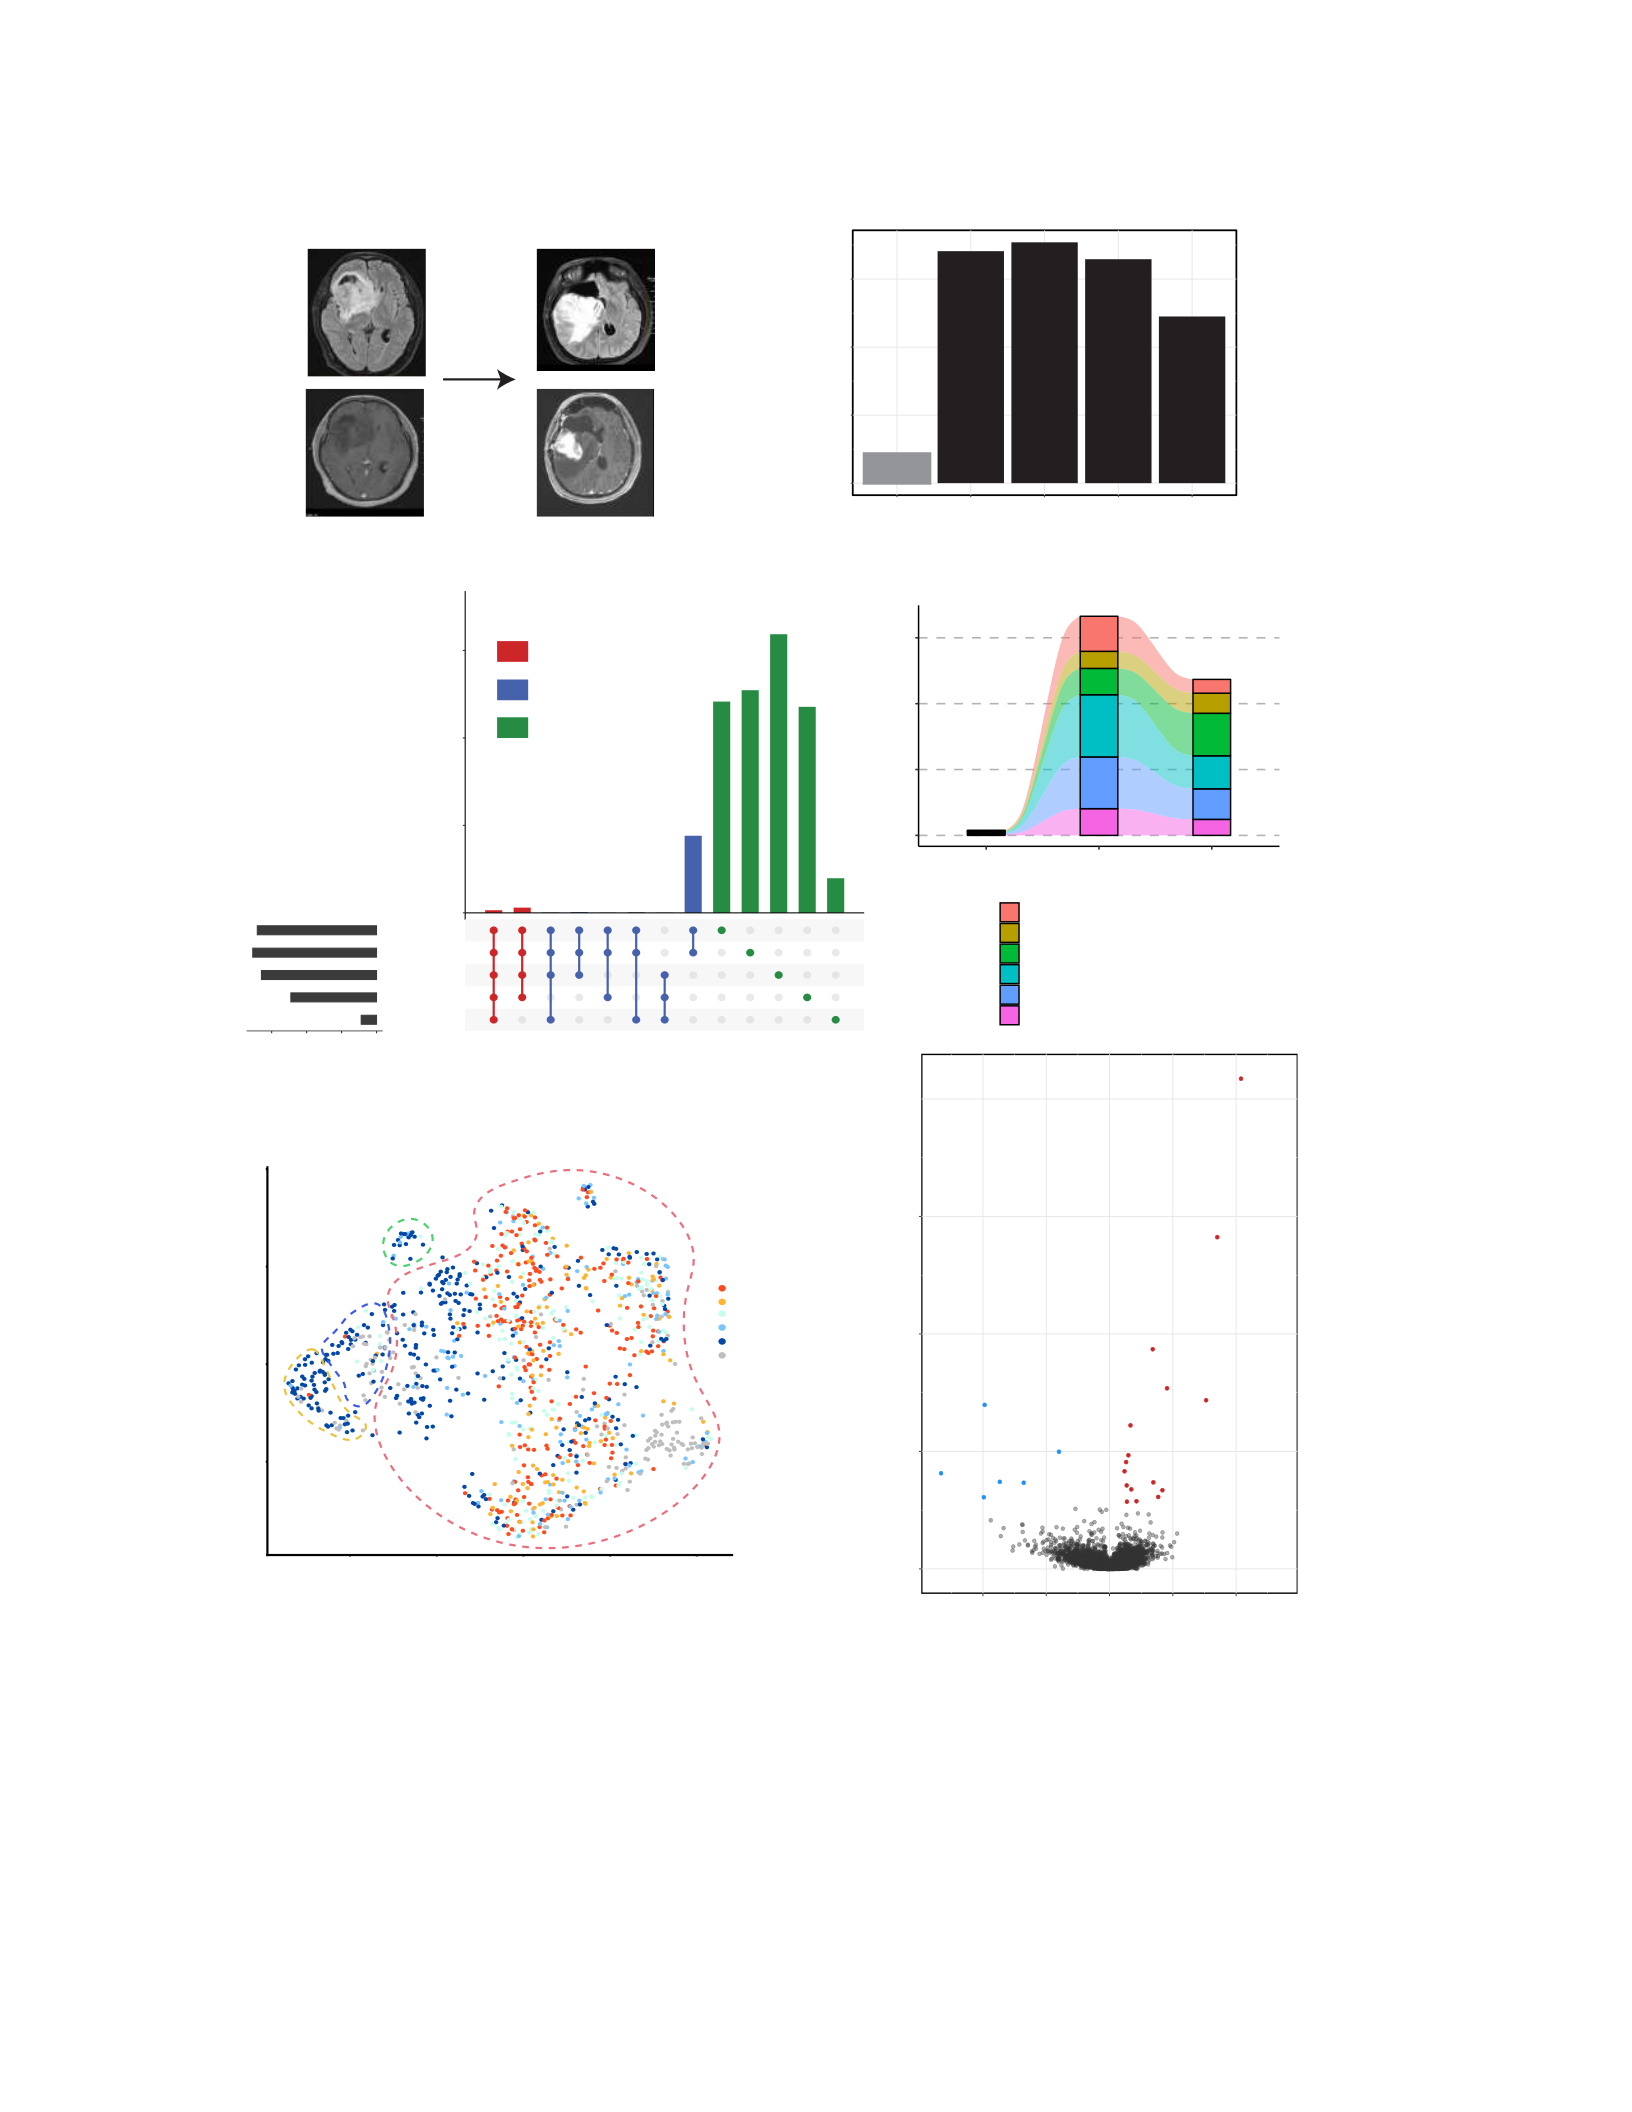
68
FLAIRT1- po st
GB M065 P rim ar y
Anaplastic Ast ro cytoma
GB M065.Re
RT
4X PCV
6X TMZ
2013 2018
40
2
TRBV14
TRGV10
TRBV12−4
TRAV5
KLRC3
ANXA1
HL A−DPA1
IFITM2 HL A−DRB1
CD7 4
GZ M K
TRAV1 4 DV4
GPR 18 3 KLRC4
TRBC1
CPNE2
SLAMF1
0
10
20
30
−2−1012
lo g (Fold Cha nge)
−log
10(P−Val ue)
0
50 0
10 00
15 00
GBM065.Prima ry
GBM065.Re 1
GBM065.Re 2
GBM065.Re 3
GBM065.Re 4
Variant Count
a b
c
15 30 25131
441
1208
1273
1593
1178
198
0
500
1000
1500
Variant Intersections
GBM065.P
rimar y
GBM065.Re−4
GBM065.Re−3
GBM065.Re−2
GBM065.Re−1
0
500
1000
1500
Varia nts p er Sampl e
d
Fig. 3-5: Immunogenomic profile of hypermutated recurrent GBM. a, Description of clinical course.
RT: radiation therapy. PCV: procarbazine, CCNU, and vincristine. TMZ: temozolomide. b, Total variants
identified from whole-exome sequencing for primary tumor and each analyzed region of recurrence.
c, UpSet plot of the distribution of all identified variants grouped by the set of tumor samples in which a variant
is shared. d, Alluvial plot displaying the frequency of the five most expanded intratumoral TCR β-chain
sequences from either region of recurrent tumor across peripheral blood and tumor samples. e, Uniform
manifold approximation and projection (UMAP) dimensionality reduction of the scRNA-seq data of T cells
from GBM065.Re. The dashed outline delineates the general population each cell belongs to and the color
indicates the degree of expansion for that T cell clone (defined by alpha/beta pair). f, Volcano plot of
differentially expressed genes within hyperexpanded clones relative to rest of T cells.
e f
−2.5
0.0
2.5
5.0
−5.0 −2.5 0.0 2. 5 5. 0
UMAP 1
Hyper
expanded (50 < X )
Large (20 < X <= 50)
Medium (5 < X <= 20)
Sm all ( 1 < X <= 5)
Sin gle ( 0 < X <= 1)
NA
Cytotoxic C D8+ T cells
CD4+ re gul atory-li ke T cel ls
Effe ctor Me mory
T ce lls
Naive/Central
Memory T cells
UMAP 2
Clonal
Subclonal Shared
Subclonal Private
Clono type
CASS AYS GTGAFF TR BV 6−6
CASSDGTVKSYEQYV TRBV2−1
CASSLGL AGHEQFF TRBV 12−1
CASSQRSGELFF TRBV12−3/12−4
CASSYQSGTQHF TRBV12−3/12−4
CATR RTSGGFNEQFF TRB V24−1
0.0
0.2
0.4
0.6
Cl ona l Propo rtion
PBMC Re g. 2
Re g. 1

69
cluster
1
2
3
4
5
6
0
20
40
60
1 2 3 4 5 6
GBM065.Primary
0
20
40
60
1 2 3 4 5 6
GBM065.Re 1
0
20
40
60
1 2 3 4 5 6
GBM065.Re 2
0
20
40
60
1 2 3 4 5 6
GBM065.Re 3
0
20
40
60
1 2 3 4 5 6
Cluster
GBM065.Re 4
a
b
GBM065−Pri GBM065.Re−1 GBM065.Re−2 GBM065.Re−3 GBM065.Re−4
GBM065−Pri GBM065.Re−1 GBM065.Re−2 GBM065.Re−3 GBM065.Re−4
00.25 0.50 0. 75 1. 00 0. 25 0. 50 0. 75 1.00 0.25 0. 50 0. 75 1. 00 0.25 0. 50 0. 75 1. 00 00.25 0.50 0.75
0
0.25
0.50
0.75
0
0.25
0.50
0.75
1.00
0
0.25
0.50
0.75
1.00
0
0.25
0.50
0.75
1.00
0
0.25
0.50
0.75
1.00
Variant
Other
TP53 R280G
TP53 T125T
IDH1 R132H
MSH6 T12 19I
00 0
Fig. 3-6: Clonal landscape of GBM065. a, Pairwise VAF comparisons for GBM065 primary and recurrent
samples. b, Clonal architecture of GBM065 primary and recurrent tumor samples generated by ClonEvol.
Overall clonal composition of each sample is represented by fraction of shaded spheres

70
We observed that the vast majority of variants identified within each region of the recurrent
tumor were subclonal private and not spatially distributed (Fig. 3-5c & Fig. 3-6b). A small fraction
(30 total) of variants were shared between all regions of the recurrent tumor, and an even smaller
number (15 total) were shared by the primary and all sectors of the recurrence. Importantly, these
included likely drivers of the tumor such as TP53 and IDH1 alterations. This remarkable
heterogeneity is consistent with a prior report in which two regions of a hypermutated recurrent
tumor were sequenced and shared less than 2% of all identified mutations219. In contrast to the
variant and neoantigen heterogeneity within this tumor, the TCR Vb repertoires within two
analyzed regions were more similar (MOI = 0.85) and had the highest clonality across all samples
in the cohort. Remarkably, the top three T cell clonotypes within GBM065.Re made up more than
37% of the intratumoral repertoire, suggesting a significant degree of clonal expansion.
Additionally, these dominant clones were all present at substantially reduced frequencies (<1%)
within the patient’s peripheral blood, confirming the specific intratumoral expansion of these cells
(Fig. 3-5d).
Finally, to more deeply characterize the immunological landscape of GBM065.Re, we
performed single-cell RNA sequencing (scRNA-seq) with TCR enrichment on sorted CD45+
immune cells (n=1,728) isolated from this tumor immediately following surgical resection. We
found that a majority of the cells were of the lymphoid lineage and were predominantly cytotoxic
CD8 T cells (59% of sequenced cells) with smaller populations of naïve and CD4 regulatory-like
T cells (Fig. 3-5e). The highly expanded T cell clones identified through bulk TCR Vb sequencing
also were represented in the scRNA-seq data but were found dispersed throughout the CD8 T cell
clusters. We performed differential expression analysis on the hyperexpanded clonotypes and
found them enriched for markers of activation such as KLRC3, KLRC4, and GZMK together with

71
MHC Class II genes classically upregulated by activated T cells (Fig. 3-5f). Thus, despite
substantial heterogeneity at the variant and neoantigen level, the hypermutated GBM065.Re
contains clonally expanded T cells with an activated phenotype distributed throughout the tumor.
3.3 Discussion, Future Directions, and Conclusions
Owing to significantly different responses to ICB therapy and shared location within a
unique anatomical site, several recent comparative studies have provided insight into the
immunological microenvironment of GBM and BrMETs229,230. However, these initial studies have
been primarily focused upon dissecting the tumor myeloid population that makes up a majority of
intratumoral immune cells. Herein, we provide a scRNA-seq-based characterization of tumor
infiltrating T cells in a cohort of 11 malignant brain tumors. To our knowledge, this is the largest
comparative study of the lymphoid compartment between GBM & BrMETs and uncovered tumor
type specific differences.
Our results suggest that BrMETs and GBM harbor significantly different intratumoral T
cell infiltrates with BrMETs containing clonally expanded CD8 T cells characterized by
expression of canonical exhaustion markers. In contrast, most GBM tumors do not contain
significantly clonally expanded CD8 T cells in bulk but rather harbor regions of local expansion
as discussed in chapter 2. Furthermore, the moderately expanded clones in GBM appear to adopt
a terminally differentiated phenotype characterized by expression of KLRG1 but do not express
the same levels of inhibitory receptors observed in clonally expanded CD8 T cells in BrMETs.
The expression of KLRG1, canonically considered a marker of T cell senescence, has also been
demonstrated to restrict antitumor T cell function245,246,250. It is intriguing to consider whether this
distinction is a factor in the differential responses to ICB therapy, as the CD8 T cells in GBM in

72
our data do not develop into classically exhausted CD8 T cells with high expression of multiple
inhibitory checkpoints. This would suggest that the PD-1/PD-L1 axis is not always a prominent
aspect of immune escape in GBM. The factors responsible for this dichotomy between canonically
exhausted CD8’s in BrMETs and KLRG1+ terminally differentiated CD8’s in GBM necessitate
further study.
Another significant feature of the immune microenvironment within BrMET tumors
relative to GBM is the existence of moderately clonally expanded CD4 T cells. These cells appear
to have an activated phenotype characterized by expression of OX40 and relatively high levels of
IFN-g in addition to numerous inhibitory checkpoints such as PD-1, TIGIT, and TIM-3. The exact
role of CD4 T cells in mediating anti-tumor immune responses is an area of active research, but
numerous studies have demonstrated their essential roles in the development of anti-tumor CD8 T
cells and maintenance of a pro-inflammatory tumor microenvironment251–254. The relative absence
of activated CD4 T cells within GBM coupled to the generalized CD4 lymphopenia observed in
these patients suggests that CD4 T cell dysfunction is a prominent mode of immune escape in
GBM183–185.
The hypermutated recurrent tumor GBM065.Re stood in stark contrast to the relative lack
of clonal expansion and CD8 T cell activation in most GBM tumors. Tumor mutational burden
has been shown to correlate with checkpoint blockade response in some studies107,175, and
hypermutated tumors resulting from germline or acquired DNA repair deficiencies have been
shown to be uniquely responsive to immunotherapy across other tumor types237. Within
hypermutated GBM, which occurs in up to 20% of recurrent disease, the efficacy of checkpoint
blockade and other immunotherapies remains an open question. Several reports have observed
clinical responses from checkpoint blockade in patients with hypermutant GBM harboring

73
germline DNA repair defects, but a recent retrospective analysis found no benefit in mismatch
repair deficient GBM patients treated with PD-1 blockade166,167,194. Ongoing clinical trials are
designed to address this question, such as Alliance study A071702/NCT04145115 [A Study
Testing the Effect of Immunotherapy (Ipilimumab and Nivolumab) in Patients With Recurrent
Glioblastoma With Elevated Mutational Burden]. Although characterization of more patients is
needed to generalize our findings, the immunogenomic profiling of GBM065.Re revealed
potentially unique features of these tumors. First, an overwhelming majority of mutations and
associated neoantigens within this hypermutant tumor were subclonal private. These data, together
with our other findings and published work207, indicate that single-site profiling analysis would be
inadequate and dramatically underestimate both tumor complexity and neoantigen burden.
Second, despite this dramatic heterogeneity of variants, we observed remarkably similar TCR
repertoires with highly expanded CD8+ T cell clones within different regions. scRNA-seq analysis
on these expanded clones shows evidence of T cell activation suggesting potential tumor
reactivity. Whether these clones react to the small subset of clonal neoantigens, the thousands of
regional neoantigens, overexpressed CT antigens, or are responding in a non-specific way to
inflammatory stimuli will require further analysis. However, our data indicates that hypermutant
tumors can contain highly activated and clonally expanded T cells while also representing an
extreme of mutational and neoantigen heterogeneity. Ongoing work is directed at understanding
how the immune system may direct responses to antigen targets in the context of this
heterogeneity.

74
CHAPTER FOUR
Approaches to mouse and human neoantigen identification
4.1 Introduction
The foundational work of Thierry Boon, Lloyd Old, Steve Rosenberg and many others led
to the identification of the first mouse and human tumor antigens, launching a flurry of activity
focused on determining the antigenic basis for anti-tumor immunity73,80. These initial studies were
slow, arduous, and difficult to replicate across a variety of tumor types and under various treatment
conditions. Since that time, the advent of high-throughput next generation sequencing has
drastically changed the field, allowing relatively rapid identification of a complete set of putative
neoantigens and expressed CT antigens from patient tumors. This has led to a collection of studies
that have defined tumor neoantigens recognized by infiltrating T cells in the settings of ACT and
ICB therapy135,137. However, an equally critical avenue of research has been the characterization
of endogenous neoantigen reactivity in a wide array of human tumors, including those resistant to
conventional immunotherapy.
The earliest reports that comprehensively profiled neoantigen reactivity arose shortly after
the approval of ICB therapy in the early 2010’s. The underlying methodology behind most of these
studies was the screening of expanded TIL against libraries of candidate peptides or tandem
minigenes containing tumor mutations that were introduced to either patient peripheral blood or
artificially engineered APCs. The ultimate functional read-out was generally cytokine production
from the patient TIL. Initial studies were predominantly focused upon immunotherapy-responsive
tumors such as metastatic melanoma and NSCLC and demonstrated the presence of endogenous
CD4 and CD8 neoantigen-specific responses106,137,138,255,256. However, more recent work has

75
expanded these findings to lower-mutational burden tumors and identified neoantigen-specific
CD8 responses across a host of tumor types including ovarian, bladder, and pancreatic cancer257–
260. Intriguingly, a recent study even reported high rates of neoantigen-specific responses in
pediatric acute lymphoblastic leukemia, suggestive of the potential for reactivity in very low
mutational burden tumors261. However, despite immense interest in the development of
immunotherapy for the treatment of GBM, the antigen specificity of the endogenous anti-tumor T
cell response has not been characterized. A deeper understanding of the nature and breadth of the
antigens recognized by the TIL in GBM could aid in the development of novel therapies.
In the past decade, there has been immense interest in the development of unbiased high-
throughput screening systems for the identification of tumor antigens. While recent technological
advancements have allowed for broad high-throughput screens of the antigens recognized by the
humoral immune response in various settings, the correspondingly higher affinity of the
antibody:antigen interaction relative to the TCR:pMHC interaction does not allow these
techniques to be easily generalized262. Meanwhile, the widespread adoption of scRNA-seq has
provided previously unparalleled insight into the tumor-infiltrating T cell compartment across a
variety of malignancies, including the capacity to obtain both expression signatures and paired
TCR a/b chains from individual T cells. Several groups have utilized scRNA-seq for tumor
antigen detection by introducing intratumoral TCRs into donor T cells and subsequent co-culture
with matched peripheral blood loaded with peptides or tandem minigenes263,264. At the same time,
numerous groups have reported novel approaches to identify TCR:pMHC pairs without extensive
reliance on patient-derived reagents. For example, Christopher Garcia’s lab developed a yeast-
display system utilizing a diverse peptide library expressed on yeast subjected to an affinity-based
selection using bead-multimerized TCRs265. Furthermore, several recent studies from David

76
Baltimore’s group have developed unique systems based upon trogocytosis or the generation of
APCs containing fusion proteins of peptide:HLA’s linked to signaling domains266,267. However,
all these approaches are not easily generalizable to additional HLA alleles beyond HLA-A*02:01
or to collections of TCRs isolated from tumors with no known MHC restriction. Thus, there exists
a need for approaches to screen TCRs isolated from intratumoral T cells against candidate antigens
in a way that minimizes reliance on patient-derived reagents but is properly scalable beyond model
systems.
Finally, the identification of tumor antigens in preclinical murine systems allows for more
deeply mechanistic studies on the role of neoantigen-specific responses, either endogenously or in
response to targeted therapies such as vaccination or cellular therapy. Previous work in our lab
identified the Imp3D81N (mImp3) and Odc1Q129L (mOdc1) point mutations as endogenously
recognized class I neoantigens within the murine glioma models GL261 and SMA-560,
respectively268. Additional work from our lab demonstrated that the Epb4H471L, Pomgnt1R497L, and
Plin2G332R mutations are endogenously recognized class I neoantigens in the more aggressive and
infiltrative CT2A glioma model269. Furthermore, we showed that neoantigen vaccine against these
epitopes synergized with ICB therapy and led to tumor regression in some mice, displaying the
potential utility of neoantigen identification in murine and ultimately human systems. However,
we have yet to identify tumor antigens recognized by CD4 T cells, despite clear evidence of their
necessity in mediating anti-tumor immune responses (unpublished data). Furthermore, we are
interested in the identification of additional class I restricted neoantigens to more deeply
characterize these workhorse mouse models.
Thus, we sought to develop flexible systems to probe for antigen reactivity among the TIL
in both human patients and mouse preclinical systems through the extraction of TCR a/b chains

77
from scRNA-seq data and incorporation into reporter systems. These approaches enable screening
for tumor antigens in both human and mouse tumors in a flexible manner that minimizes the need
for patient-derived reagents.
4.2 Results
4.2.1 Development of system for human tumor antigen identification
With the ultimate goal of identifying tumor antigens, we developed a protocol for the
expansion of tumor-infiltrating lymphocytes from malignant brain tumors. In this process, brain
tumors were minced into several millimeter sections and cultured in media containing high-dose
IL-2. Following a week of expansion in this media, myelin and acellular debris was removed prior
to lymphocyte expansion in media containing high-dose IL-2 and aCD3/28 beads for a period of
3-5 weeks. The period of expansion necessary was determined by serial assessments of each TIL
culture via flow cytometry. For a majority of tumors, we were able to generate expanded TIL
cultures consisting of almost exclusively T cells with variable ratios of CD8/CD4 T cells (Fig. 4-
1a). This TIL expansion protocol was performed for all 30 tumors in the previously discussed
cohort.
In order to characterize the expanded TIL, we performed TCR sequencing on DNA isolated
from a select group of TIL cultures and matched patient tumor. As mentioned in a prior chapter,
this data allows us to use the Vb chain CDR3 as a barcode for specific T cell clones to assess their
maintenance over the expansion process. Strikingly, we observed a significant difference with
most of the enriched intratumoral T cell clones either not present in the expanded TIL or present
at substantially decreased frequencies (Fig. 4-1b). This effect was seen in TIL cultures derived
from either GBM or BrMET tumors and was similarly observed in TIL grown with just high-dose
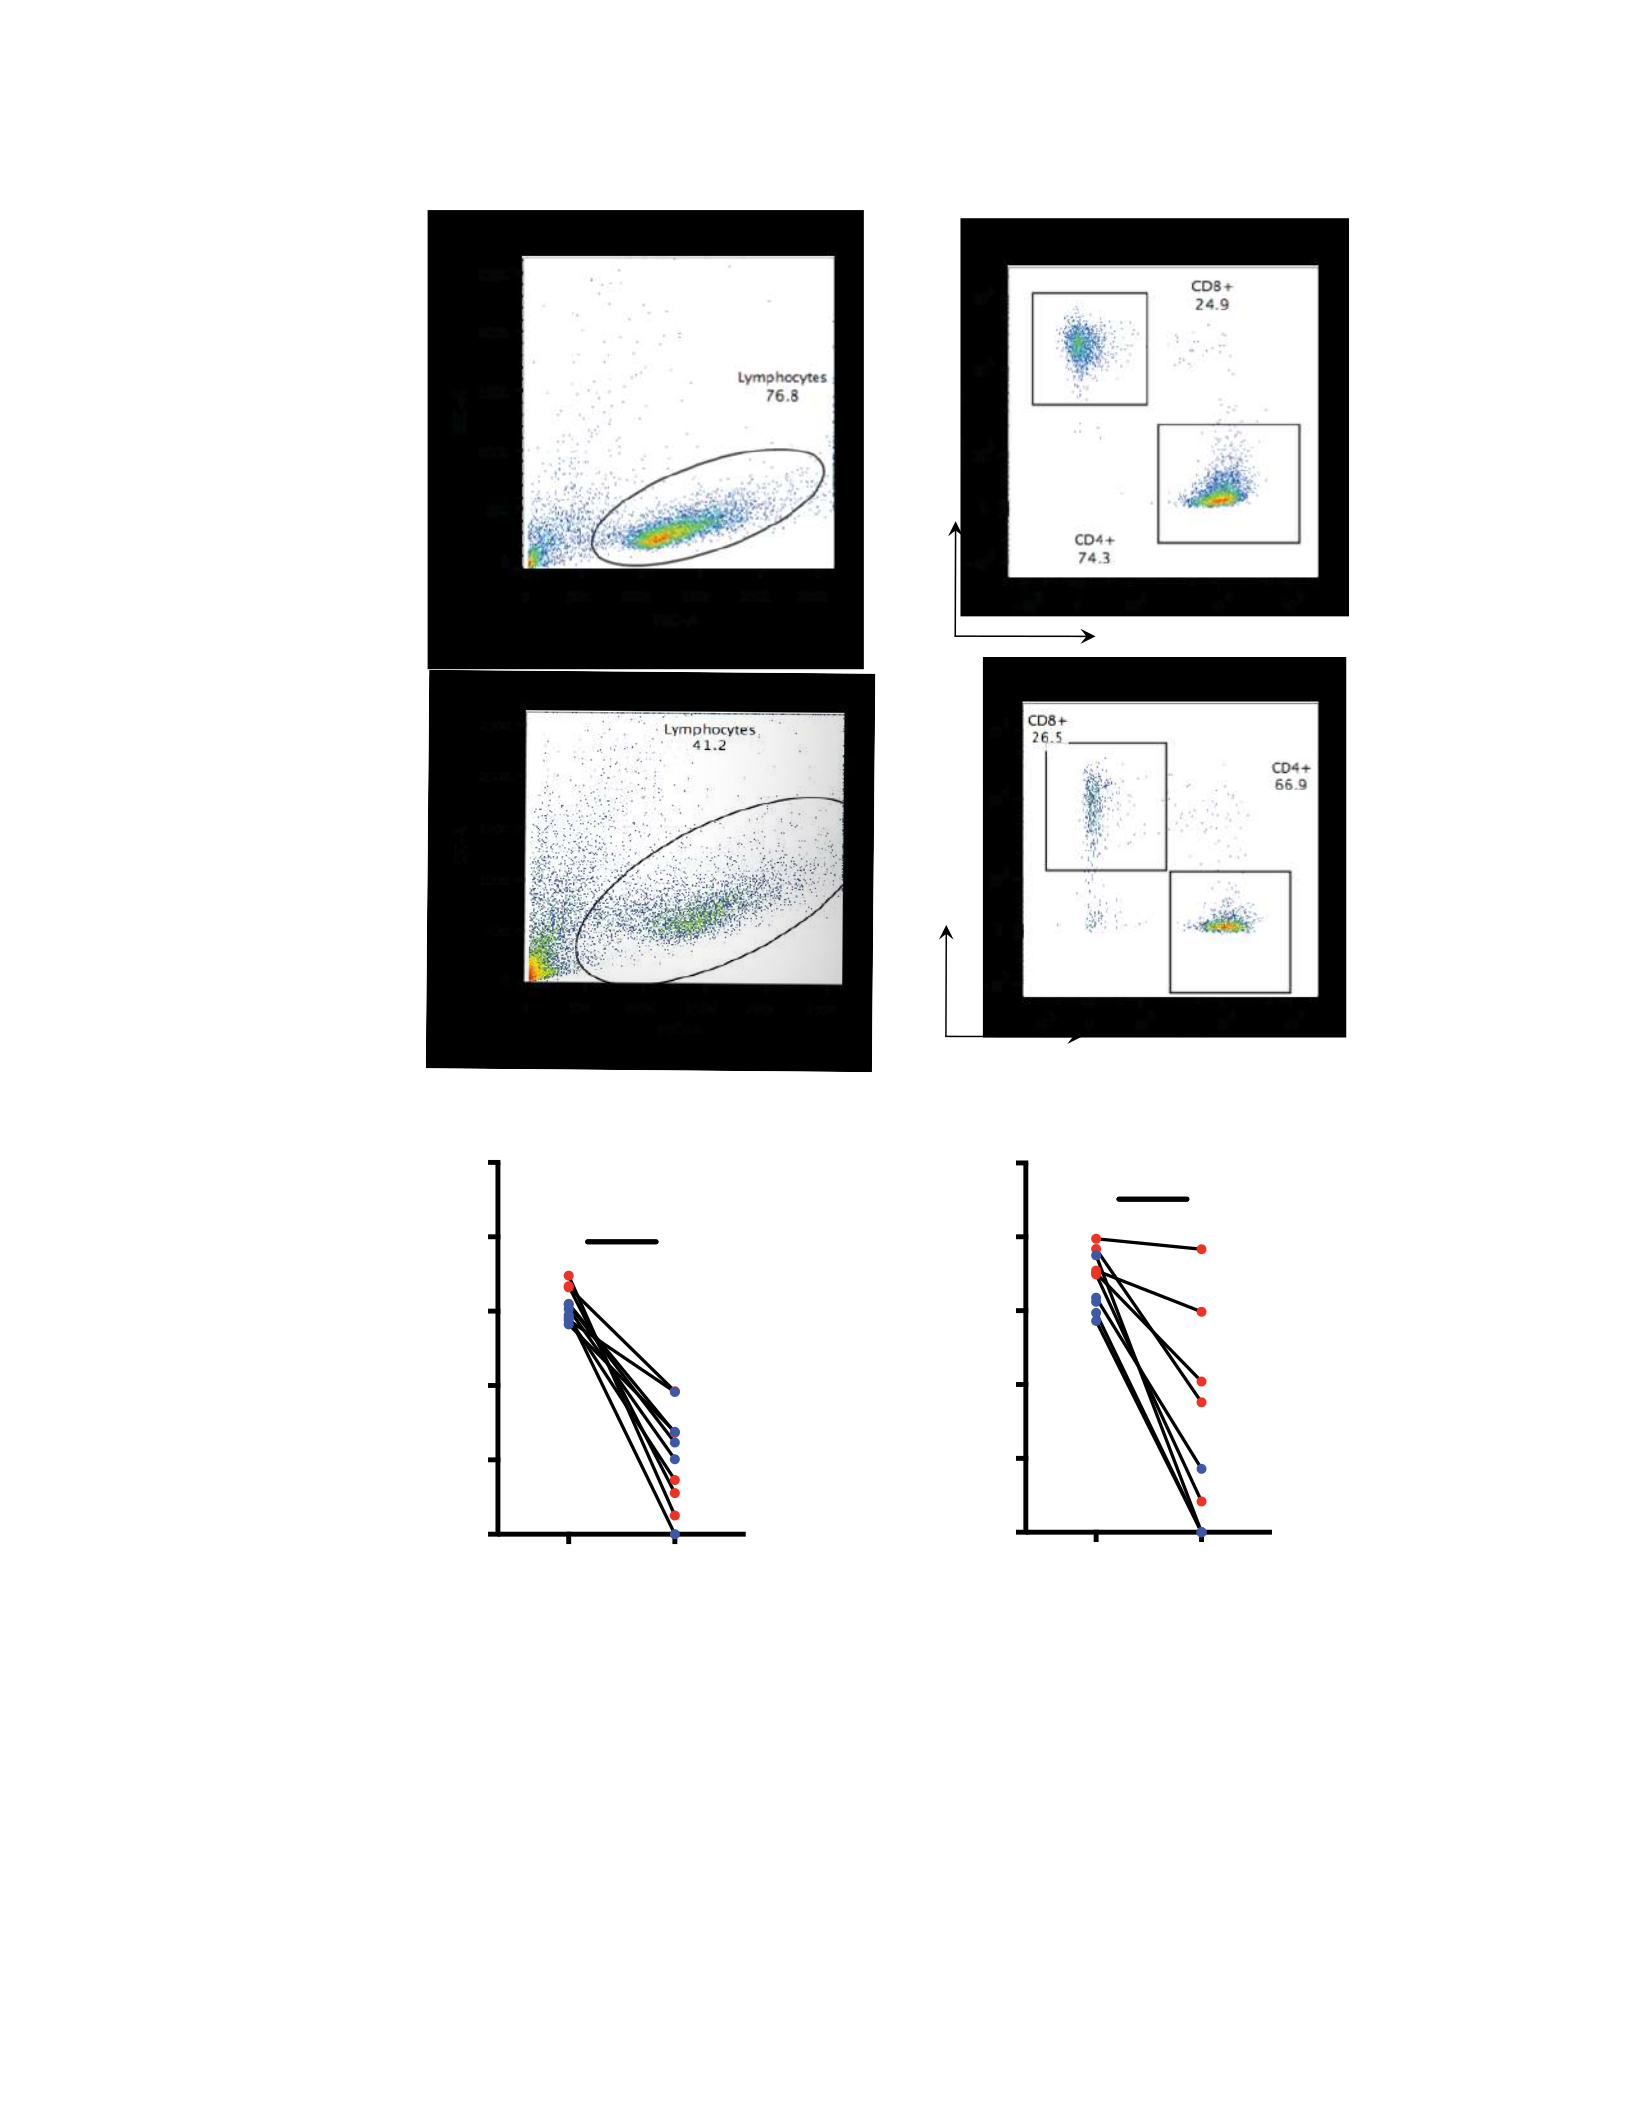
78
a
b
Figure 4-1: Characterization of expanded brain tumor TIL cultures. a, Representative flow cytometry plots
of 3-5 week expanded TIL cultues derived from a GBM (top) or BrMET patient (bottom). b, Frequency
comparison of the top 5 most expanded clones in matched tumor and expanded TIL cultures in BrMET (left)
and GBM (right). Each color indicates a specific patient. Significance calculated by paired t-test.
CD 4
CD 8
CD 4
CD 8
Tumor
Expanded TIL
0.00001
0.0001
0.001
0.01
0.1
1
Frequ ency
Brain Metastase s
** *
Tumor
Expanded TIL
0.00001
0.0001
0.001
0.01
0.1
1
Frequ ency
GBM
**
GBM047.Re
TIL
BrMET009
TIL

79
IL-2 (data not shown). Meanwhile, the most expanded clones within the TIL cultures were often
present at significantly lower frequencies in the matched tumor. This significant clonal drift upon
expansion suggested that the use of the TIL cultures for antigen identification would be flawed
and potentially lead to false negatives and false positives. Thus, we sought to develop an
alternative approach to tumor antigen identification in this cohort of patients.
As described in the previous chapter, we accumulated extensive scRNA-seq data on a
subset of these GBM and BrMET tumors. In addition to providing insight on the expression profile
of TIL in these two tumor types, this data also allowed for the isolation of specific TCR a/b pairs.
Across both tumor types, we observed significantly expanded TCRs in some tumors that were
predominantly belonging to CD8 T cells (Fig. 4-2a). Presumably, these clones would be the ideal
candidates to screen for the identification of tumor antigens owing to their intratumoral
enrichment. Therefore, we aimed to generate a system through which these expanded T cell clones
could be screened for antigen reactivity in a TCR-specific manner.
A predominant focus in developing this system was to minimize the need for patient-
derived reagents to allow for the flexible application of this approach across patient samples.
Accordingly, we chose to engineer several immortalized cell lines including K562’s and a TCR-
deficient clone of Jurkat cells for this approach (Fig. 4-2b). Owing to their lack of endogenous
MHC class I expression and rapid proliferative capacity, K562’s have been previously engineered
to express HLA-A*02:01 to function as an artificial APC (aAPC) for the stimulation of CD8 T
cells270,271. We significantly broadened this approach by generating a panel of K562 aAPCs
expressing 30 single HLA-A/B/C molecules (Fig. 4-3a). Furthermore, the K562’s were made to
express CD80 to facilitate their ability to stimulate target cells. As an effector cell, we obtained
the TCR-deficient clone of Jurkat cells from Paul Thomas’s lab that had been engineered to
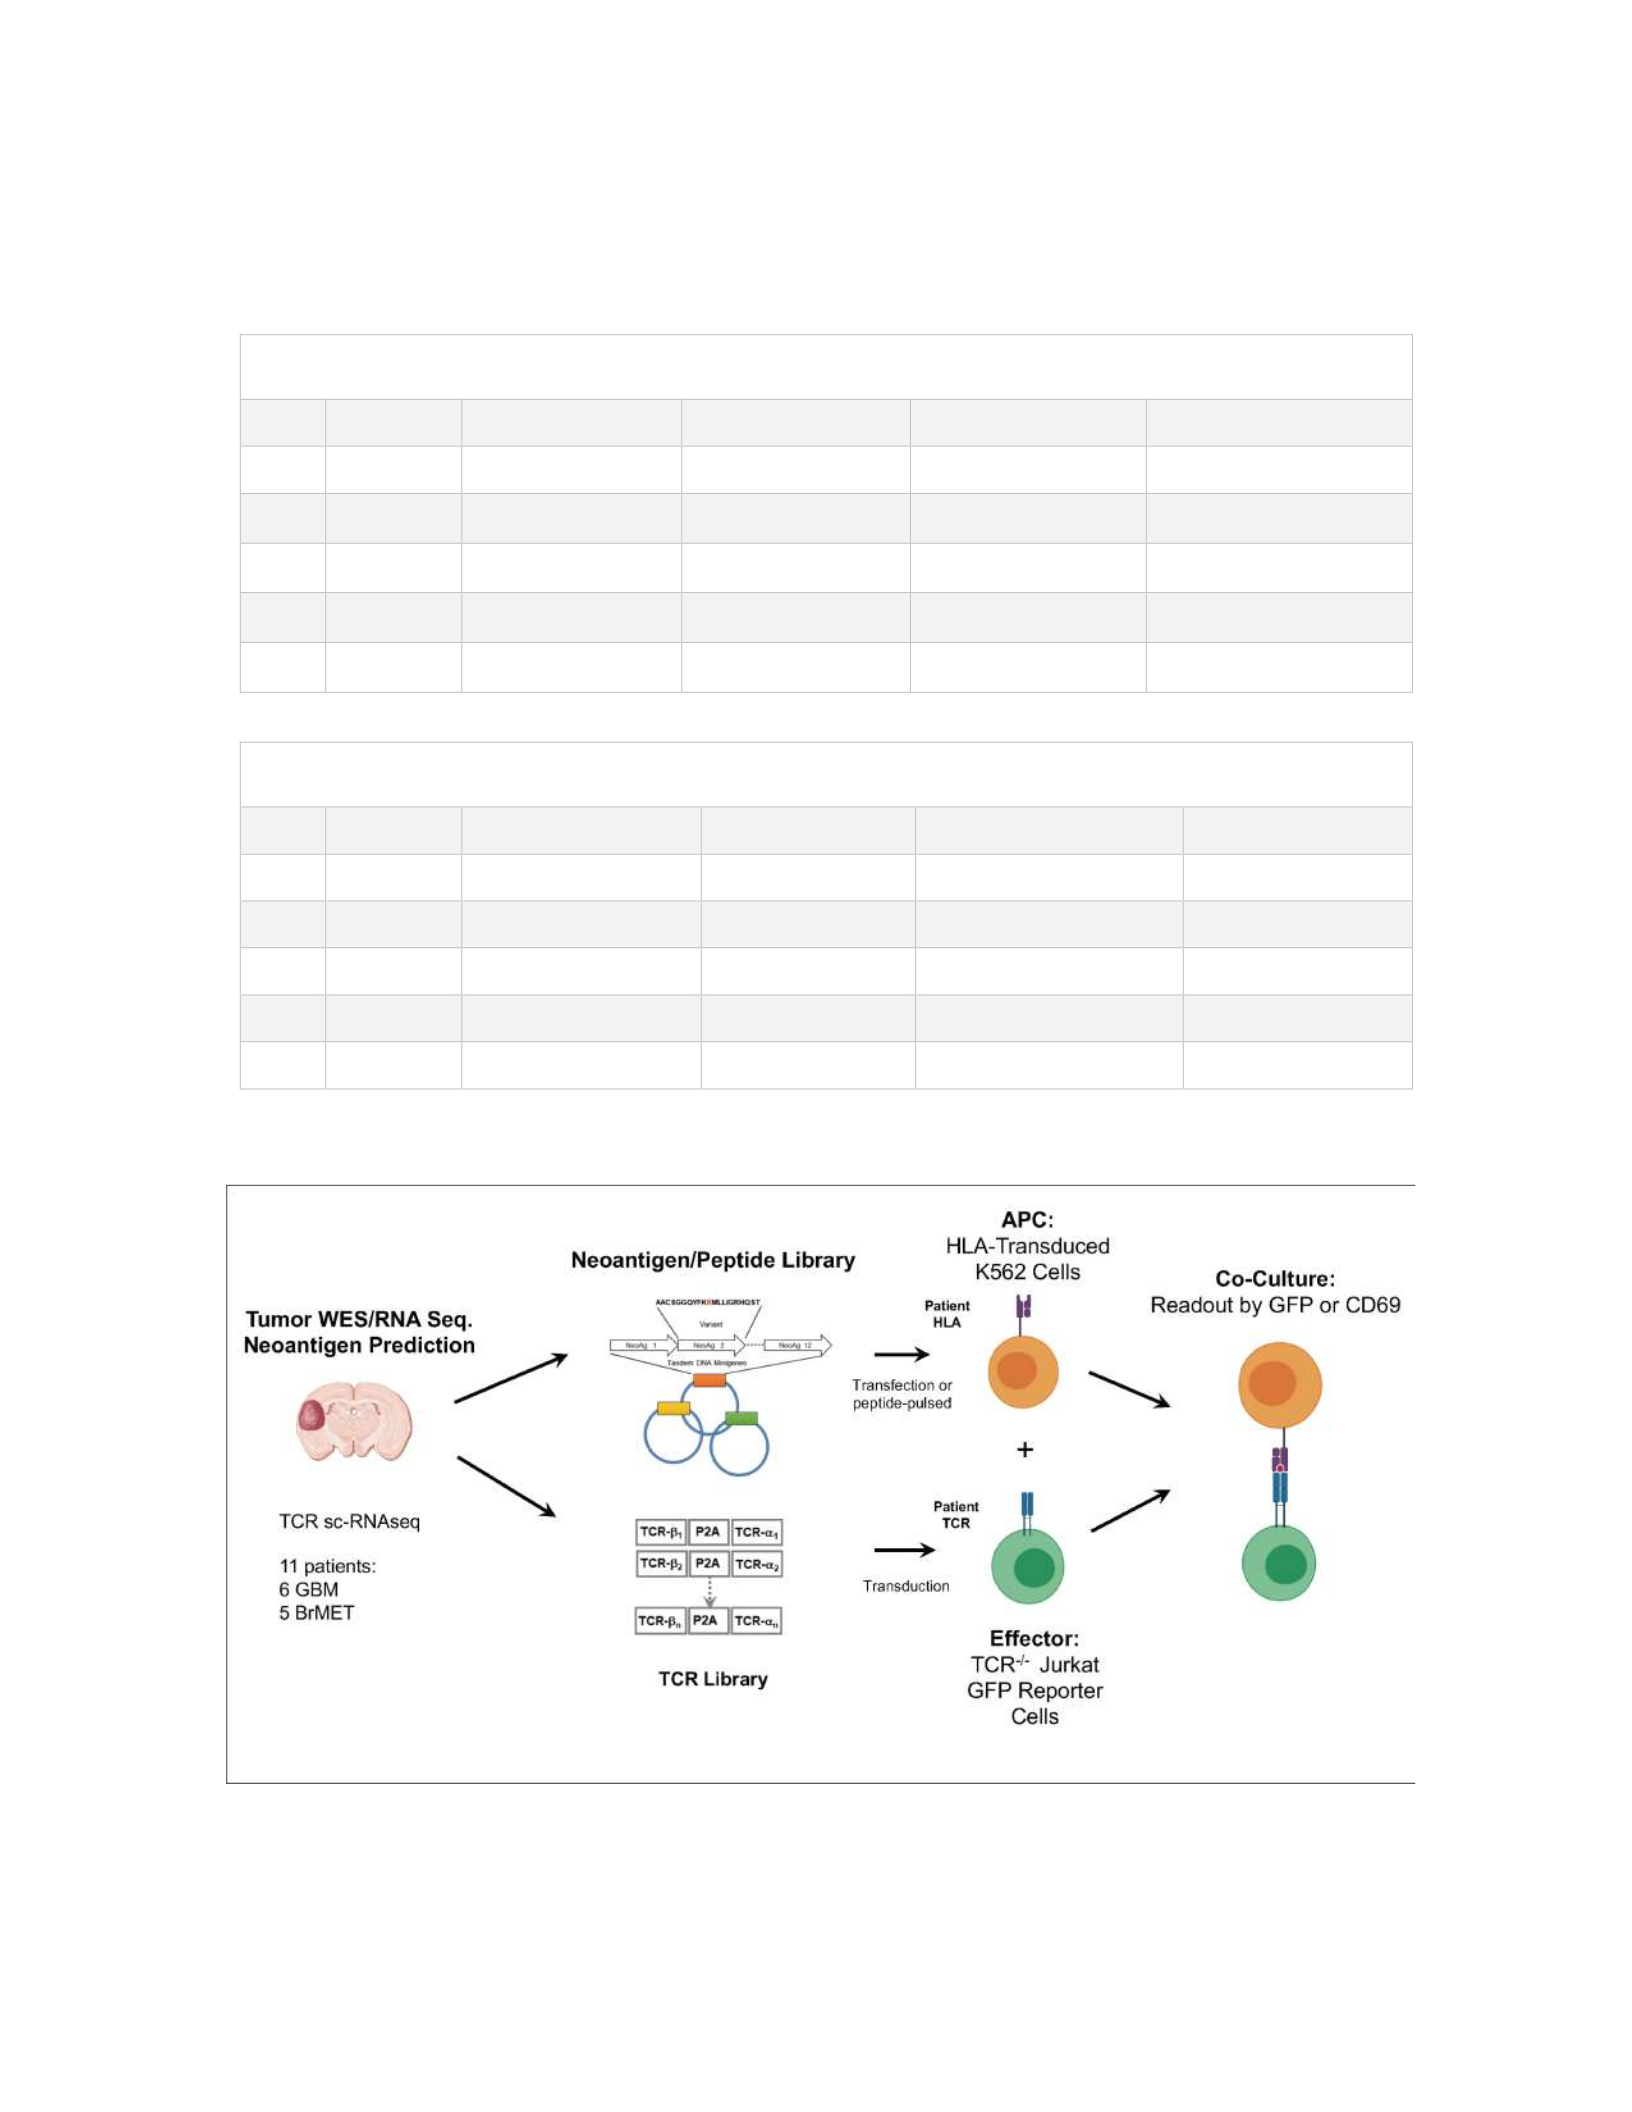
80
a
b
Figure 4-2: Outline of human neoantigen screening system. a, Tables describing the top 5 most clonally
expanded CD8 TCRs within a representative BrMET (top) and GBM (bottom) tumor. b, Outline of neoantigen
screening system generated for TCR antigen identification.
BrMET009
Clone
Fr equency
Alpha Chain
Alpha CD R3
Beta Chain
Beta CD R3
1
23.6%
TRAV20/TRAJ21/ TRA C
CAVLLYNFNKFYF
TRBV6-2/TRBJ2-
5/ TRB C2
CASRHVQETQYF
2
8.2%
TRAV19/TRAJ45/ TRA C
CALSEWPGGGADGLTF
TRBV30/TRBD1/TRBJ2-
5/ TRB C2
CAWSRGQEGETQYF
3
4.4%
TRAV20/TRAJ17/ TRA C
CAVQAVAAG NK LTF
TRBV30/TRBJ1-
2/ TRB C1
CAWSVYYGYTF
4
4.2%
TRAV29/TRAJ53/ TRA C
CAVSGGSNYKLTF
TRBV9/TRBD2/TRBJ1-
5/ TRB C1
CASSAWMGNQPQHF
5
2.5%
TRAV29/TRAJ56/ TRA C
CAASGRIGANSKLTF
TRBV5-1/ T RB D2 /TRBJ2-
7/ TRB C2
CASSSAWRTYEQ YF
GBM074
Clone
Fr equency
Alpha Chain
Alpha CD R3
Beta Chain
Beta CD R3
1
2.8%
TRAV17/TRAJ17/ TRA C
CATDAGIKAAG NK LTF
TRBV6-5/ T RB D1 /TRBJ2-
4/ TRB C2
CASSYSRTGGWDIQYF
2
2.2%
TRAV3/TRAJ9/TRAC
CAVRDEDTGGFKTIF
TRBV29-1/ TRB D2 /TRBJ2-
2/ TRB C2
CSVGEGGWELFF
3
1.9%
TRAV24/TRAJ4/TRAC
CAFREGGYNKLI F
TRBV11-1/ TRB D1 /TRBJ1-
2/ TRB C1
CASSPGFNYGYTF
4
1.7%
TRAV12-1/ TRAJ35/TRAC
CVVNGGFGNVLHC
TRBV6-1/ T RB D2 /TRBJ2-
1/ TRB C2
CASSVRTSGLNE QFF
5
1.5%
TRAV21/TRAJ27/ TRA C
CAVLNAGKSTF
TRBV6-5/ T RB D1 /TRBJ1-
2/ TRB C1
CASRGAGTNYGYTF
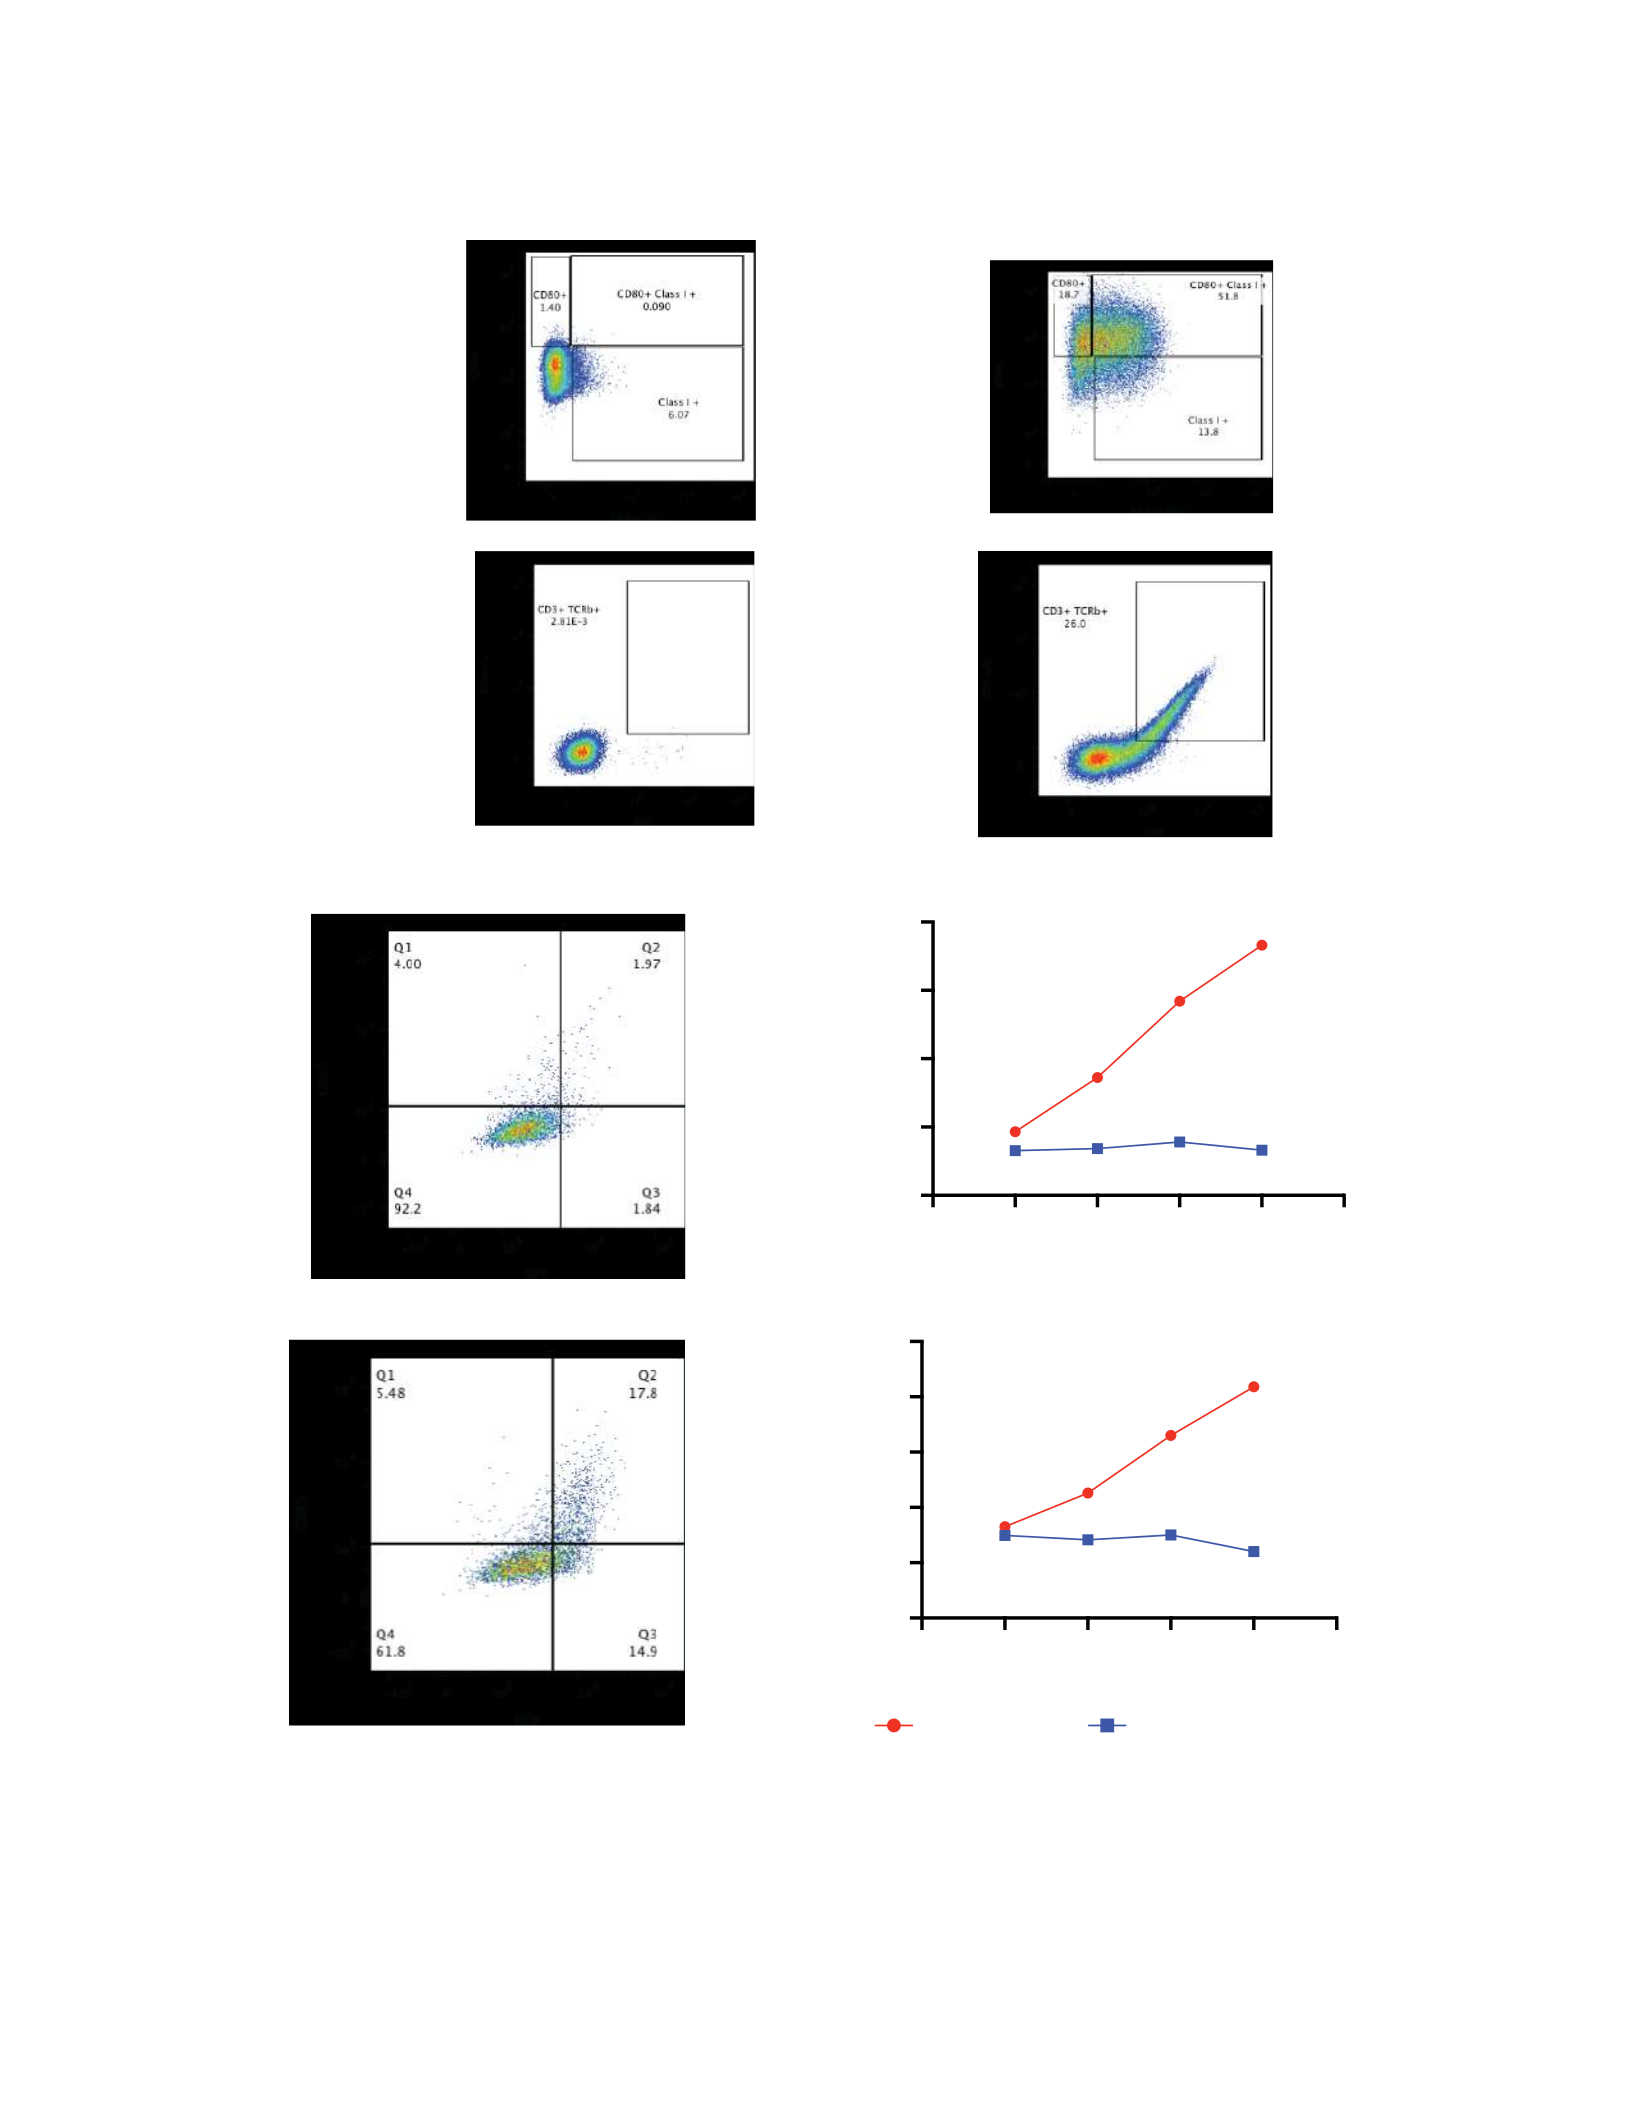
81
a
b
cd
Figure 4-3: Generation and validation of human neoantigen screening system. a, Representative flow
cytometry plots of the generation of the K562:CD80:HLA-A*02:01 cell line. b, Representative flow cytometry plots
of the generation of the Jurkat:Nur77-GFP:MART1-TCR reporter cell line. c, Jurkat:Nur77-GFP:MART1-TCR
reporter cells were co-cultured with K562:CD80:HLA-A*02:01 cells loaded with either irrelevant peptide or the
MART1 epitope for 24 hours prior to flow analysis for GFP & CD69 upregulation. d, Dose-response titration of
GFP and CD69 upregulation in response to MART1 epitope.
0.001 0.01 0.1 110 100
0
5
10
15
20
Co ncent ration Peptide (uM )
% GFP+
GFP Response Titration
Irrelevant peptideMART1
0.001 0.01 0.1 110 100
0
5
10
15
20
25
Concentration Peptide (uM)
% CD69+
CD69 Response Titration
K562
K562:CD80:
HLA-A*02:01
Jurk at :Nur7 7-GFP
Jurk at :Nur7 7-GFP:
MART1-TCR
MART1 peptide
Irrelevant peptide

82
express GFP under control of the Nur77 promoter, one of the initial genes downstream of TCR
stimulation. To facilitate our antigen screens, we engineered these Jurkat cells to express either
CD8 or CD4 and patient-specific TCRs.
To validate the functionality of our system, we transduced the Jurkat:Nur77-GFP cells with
a TCR specific for the MART1 epitope previously targeted in several adoptive transfer
studies117,223 (Fig. 4-3b). Following co-culture of these transduced cells with K562:CD80:A*02:01
cells loaded with the MART1 peptide, we observed robust antigen-specific stimulation with
concordant upregulation of GFP and the T cell activation marker CD69 (Fig. 4-3c). Furthermore,
this response displayed a clear dose-dependency with a loss of detectable signal as peptide
concentrations reached below 100 nM (Fig. 4-3d). This response was not observed if
Jurkat:Nur77-GFP cells were lacking the MART1-specific TCR or if K562 aAPCs were not
engineered to express HLA-A*02:01 (data not shown). Therefore, this system appears to function
as intended in the detection of antigen-specific responses in a TCR-specific manner. We are now
actively applying this approach for the extensive screening of expanded intratumoral TCRs against
candidate neoantigens, CT antigens, and viral antigens across this cohort of patients.
4.2.2 Development of system for mouse tumor antigen identification
While prior work from our lab identified endogenous class I neoantigens in a collection of
murine glioma models, we are interested in more comprehensively profiling the class I-restricted
neoantigen-specific responses and identifying class II-restricted neoantigens in these systems. Our
previous studies utilized IFN-g ELISPOT screens on intracranial TIL for the detection of these
responses. Since that time, we have more extensively profiled these tumors including scRNA-seq
with 5’ VDJ enrichment to provide T cell clonotype information in both untreated and ICB treated

83
conditions. Similarly to the human tumors, we have utilized this approach for the identification of
the most expanded intratumoral TCRs (Fig. 4-4a). Noting the high levels of clonal expansion from
CD8 T cells in both of these models, particularly after ICB therapy, we sought to develop a system
for the screening of CD8 and CD4 T cells for neoantigen reactivity in a TCR-specific manner (Fig.
4-4b). In contrast to the significant HLA polymorphism and polygenism in humans, in-bred
C57BL/6 mice only express two MHC class I molecules, Db and Kb, and one MHC class II
molecule, I-Ab. Thus, we chose immortalized mouse embryonic fibroblasts (MEFs) isolated from
a C57BL/6 mouse as a source of b haplotype immortalized antigen presenting cells for class I
antigen detection. For the detection of CD4 T cell antigens, we made use of the immortalized
C57BL/6-derived dendritic cell line JAWSII, which has previously been shown to express
significant MHC class II and the ability to stimulate CD4 T cells following LPS stimulation272.
As an effector cell, we obtained the TCR-deficient 58 hybridoma cell line from David
Kranz’s lab273. Following introduction of a TCR and antigen-specific stimulation, this cell line has
been shown to express canonical T cell-associated transcription factors such as NFAT and robustly
produce IL-2274,275. To facilitate these antigen screens, the original 58 hybridoma cell line was
engineered to express either CD4 or CD8 (Fig. 4-5a). Furthermore, to allow for flow cytometry-
based screens, we introduced an NFAT-GFP reporter construct into these cells in which expression
of GFP is controlled by an NFAT-inducible promoter (provided by Ken Murphy with human CD4
as a selection marker).
To validate the functionality of our system, we made use of the canonical model antigen
ovalbumin and its associated class I and class II TCRs. Following introduction of the OTI TCR
into the 58 reporter system, we observed robust CD69 and GFP upregulation after co-culture with
MEFs loaded with the SIINFEKL peptide (Fig. 4-5b). This response is paralleled by significant
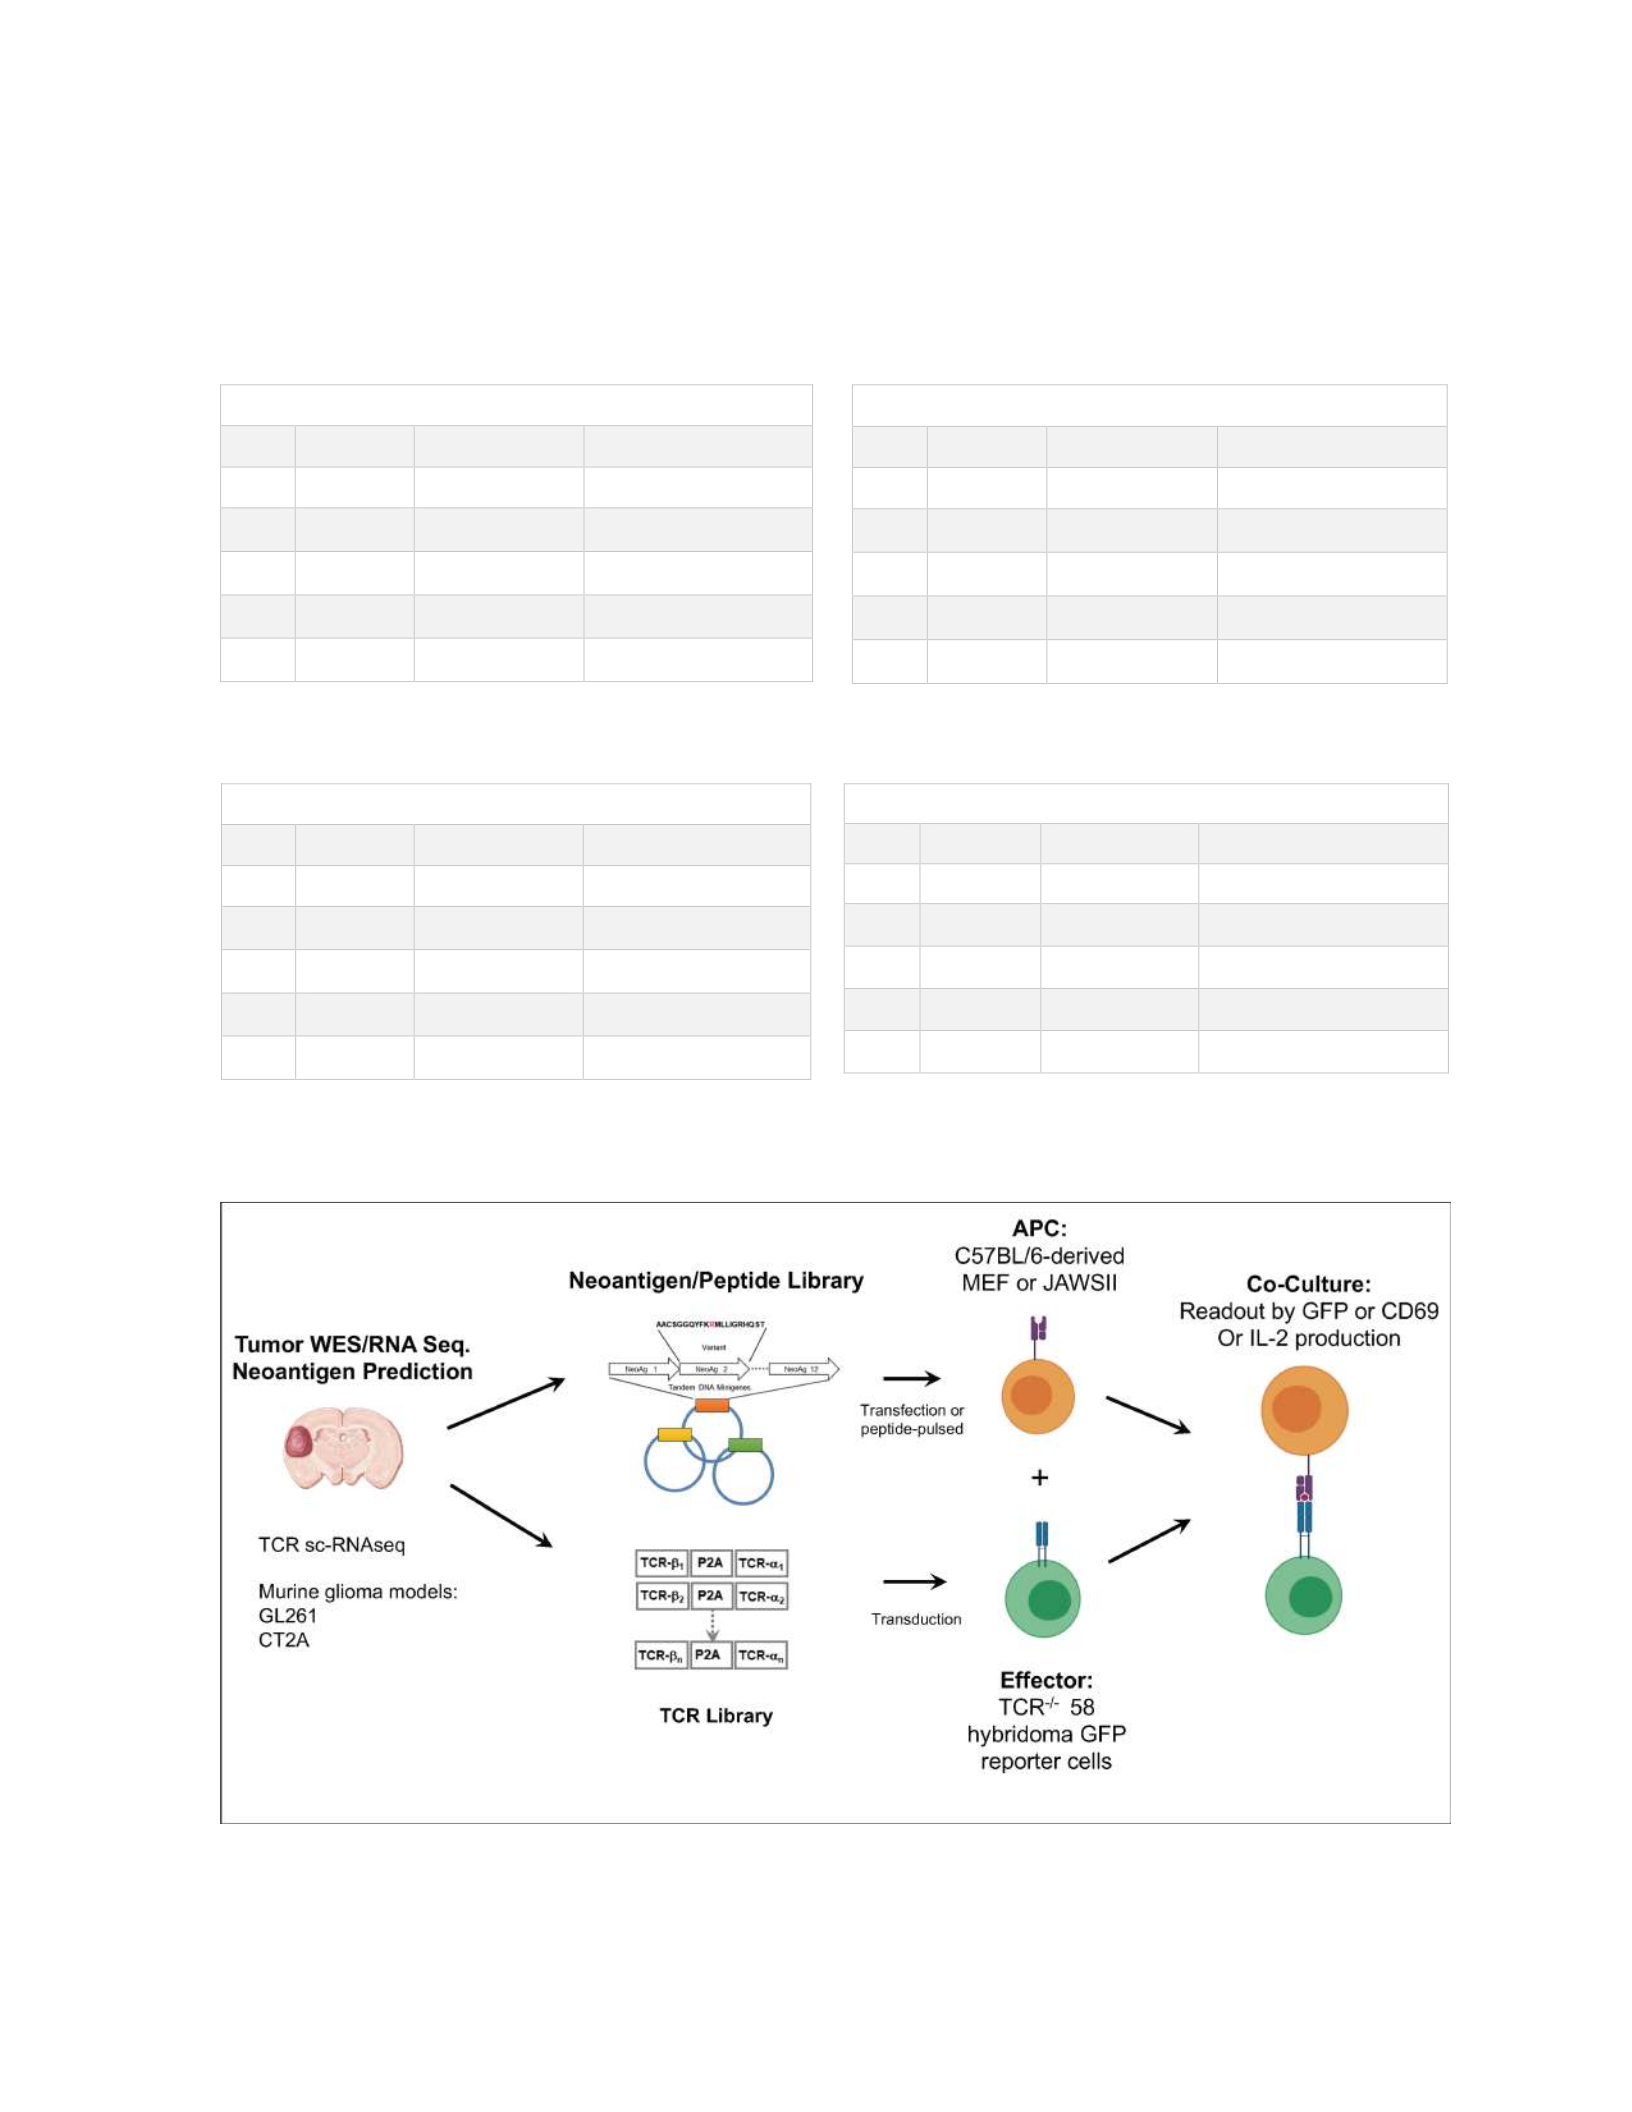
84
a
Figure 4-4: Outline of murine neoantigen screening system. a, Tables describing the top 5 most clonally
expanded CD8 TCRs within two murine tumor models with and without anti-PD-L1 therapy. b, Outline of
neoantigen screening system generated for TCR identification.
GL261
Clone
Frequency
Alpha Chain
Beta Chain
1
2.7%
TRAV6 -
6/TRAJ43/T RAC
TRBV26/TRBJ2 -7/ T RBC1
2
2.0%
TRAV7D -
2/TRAJ7/T RAC
TRBV16/TRBD2 /TRBJ2 -
7/T RBC1
3
1.3%
TRAV13 -
1/TRAJ39/T RAC
TRBV20/TRBJ1 -1/ T RBC1
4
1.2%
TRAV12D -
2/TRAJ16/T RAC
TRBV20/TRBJ1 -1/ T RBC1
5
1.1%
TRAV7 -
4/TRAJ4/T RAC
TRBV5/TRBD1/TR BJ2-
1/T RBC1
GL261+anti-PD-L1
Clone
Frequency
Alpha Chain
Beta Chain
1
18.4%
TRAV14 -
3/TRAJ45/T RAC
TRBV12 -1/T RBD2 /T RBJ2 -
3/T RBC2
2
5.8%
TRAV12 -
2/TRAJ57/T RAC
TRBV13 -2/T RBD1 /T RBJ2 -
4/T RBC1
3
2.8%
TRAV12N -
1/TRAJ48/T RAC
TRBV12 -2/T RBD1 /T RBJ2 -
5/T RBC1
4
1.9%
TRAV8N -
2/TRAJ5/T RAC
TRBV14/TRBD2 /TRBJ1 -
1/T RBC1
5
1.6%
TRAV14 -
3/TRAJ37/T RAC
TRBV2/TRBJ1 -1/ T RBC1
CT2A
Clone
Frequency
Alpha Chain
Beta Chain
1
5.5%
TRAV12D -
2/TRAJ17/T RAC
TRBV13 -1/T RBD2 /T R BJ2 -
4/T RBC1
2
5.3%
TRAV10N/TRAJ 7/
TRAC
TRBV13 -1/T RBD2 /T R BJ2 -
4/T RBC1
3
3.5%
TRAV14D -
2/TRAJ40/T RAC
TRBV13 -2/T RBD2 /T R BJ2 -
7/T RBC1
4
2.5%
TRAV5 -
4/TRAJ49/T RAC
TRBV1/TRBD1/TR BJ1-
5/T RBC1
5
2.3%
TRAV8N -
2/TRAJ26/T RAC
TRBV4/TRBD2/TR BJ2-
1/T RBC1
CT2A+anti-PD-L1
Clone
Frequency
Alpha Chain
Beta Chain
1
19 .6%
TRAV12 -
1/TRAJ26/T RAC
TRBV16/TRBD2 /TRBJ2 -
5/T RBC1
2
4.4%
TRAV7D -2/TRAJ7
/TRAC
TRBV5/TRBD1/TR BJ2-
2/T RBC1
3
2.6%
TRAV16N/TRAJ 12
/TRAC
TRBV13 -1/T RBD2 /T RBJ2 -
3/T RBC1
4
2.1%
TRAV10N/TR AJ7
/TRAC
TRBV5/TRBD1/TR BJ1-
1/T RBC1
5
1.9%
TRAV13 -1/TRAJ7
/TRAC
TRBV20/TRBD2 /TRBJ2 -
7/T RBC1
b
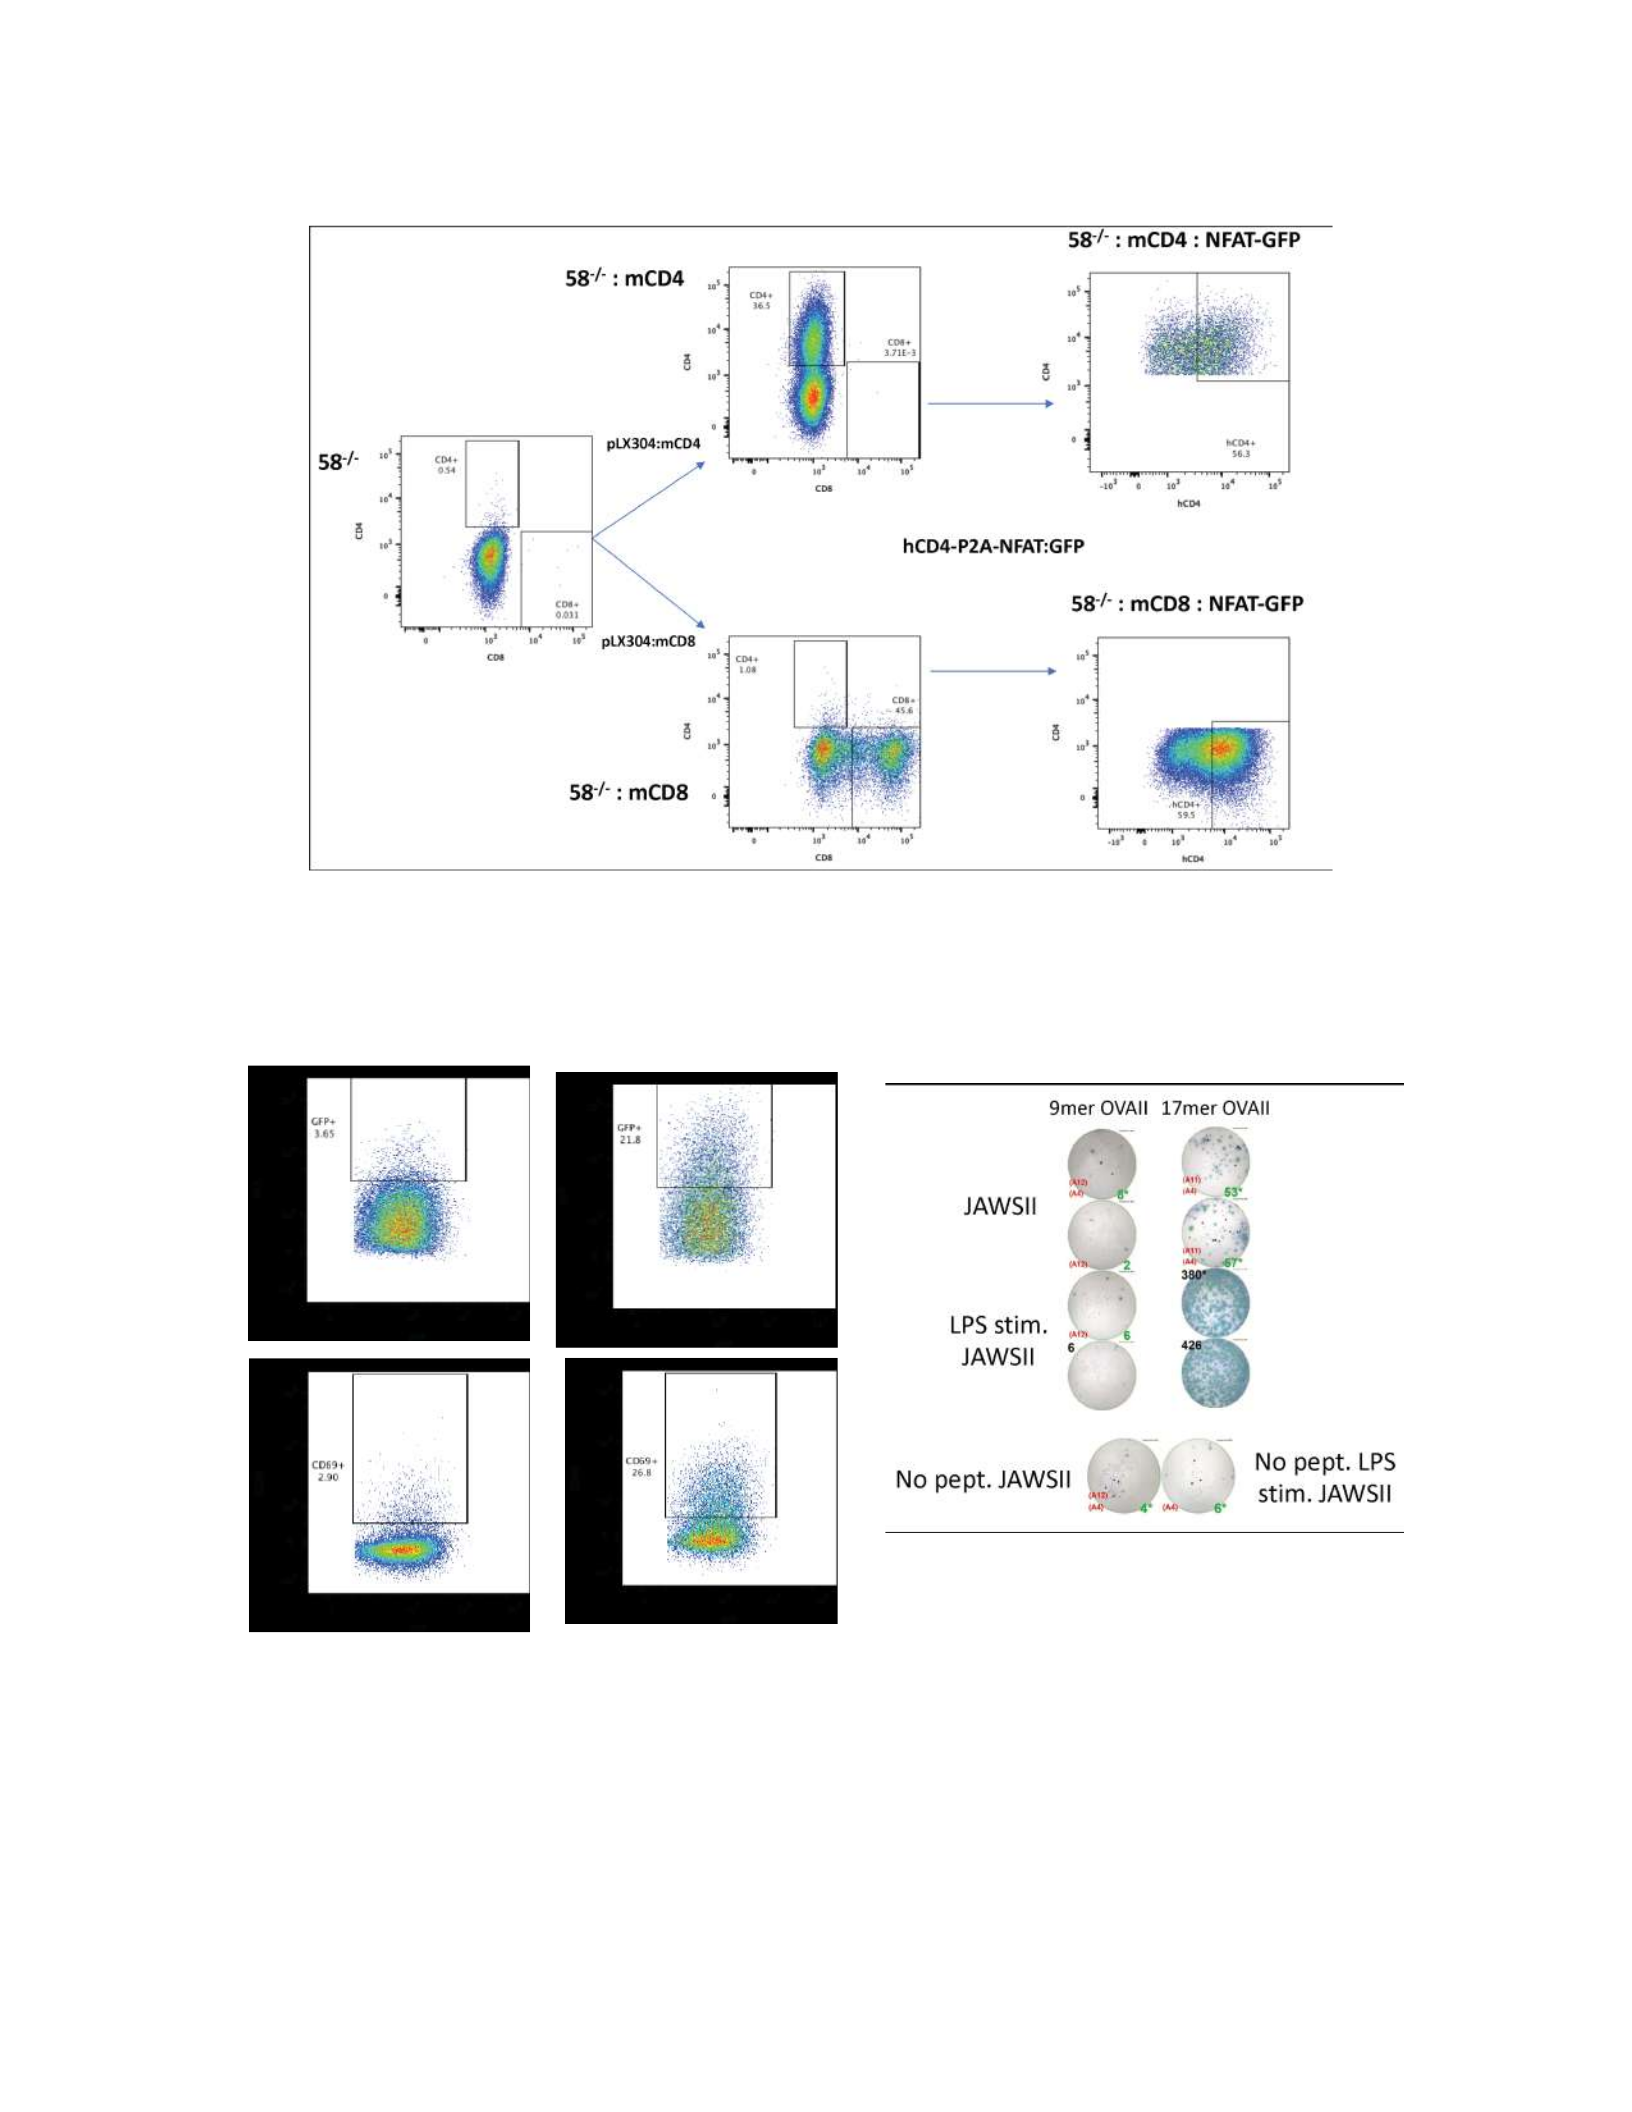
85
a
b
Figure 4-5: Validation of murine antigen screening system. a, Schematic depicting generation of 58
hybridoma reporter lines expressing mouse CD4/CD8 and NFAT-GFP reporter construct. b, Co-culture of
58:CD8:NFAT-GFP:OTI cells co-cultured with MEFs loaded with either an irrelevant peptide or SIINFEKL. Flow
cytometry analysis performed after 24 hours of stimulation. c, IL-2 ELISPOT of 58:CD8:NFAT-GFP:OTII cells
co-cultured with JAWSII cells loaded with either the minimal OTII epitope or a longer frament following overnight
LPS stimulation of JAWSII cells.
c
Irrelevant peptide SIINFEKL
58:CD8:NFAT-GFP:OTI 58:CD8:NFAT-GFP:OTII

86
IL-2 production detected by an IL-2 ELISPOT (data not shown). To assess the ability of the system
to identify class II-restricted antigens, we introduced the OTII TCR into the 58 reporter cell line
and observed significant IL-2 production following co-culture with stimulated JAWSII cells
loaded with the ovalbumin class II epitope (Fig. 4-5c). We are now actively applying this approach
using the 58:CD8 and 58:CD4 reporters for the extensive screening of expanded intratumoral
TCRs against candidate neoantigens in our murine preclinical models.
4.3 Discussion, Future Directions and Conclusions
The identification of the antigens driving anti-tumor immune responses has been a core
facet of cancer immunology since its inception. While the earliest tumor antigens were identified
through laborious and strenuous protocols, significant advances in both immunology and
genomics have made the process more rapid and high-throughput. Despite this, the antigen
specificity of most intratumoral T cell clones in patient tumors remains undefined, and the extent
of tumor antigen-reactivity within the TIL of many cancer types is unknown. With the growing
interest in the targeting of neoantigens as a form of personalized immunotherapy, the
characterization of both endogenous and treatment-induced neoantigen-specific responses will
only grow in importance.
The last decade has seen an explosion of new techniques for T cell antigen discovery, many
of them utilizing advances in next generation sequencing technologies to facilitate high-throughput
screens. Unfortunately, most of these approaches are validated in idealized model systems and
difficult to generalize to the broad scale needed for the diversity of TCR candidates and HLA
alleles in patient samples. Therefore, we sought to generate flexible systems to screen for mouse
and human tumor antigen reactivity in a TCR-specific manner. Ultimately, we hope this approach

87
utilizing TCRs identified through scRNA-seq will enable us to pair T cell reactivity to expression
profile, defining the populations enriched for tumor-specificity. However, it is likely that
significant evolution of the antigen screening systems will be needed to more completely define
the landscape of T cell reactivity. For now, we have been unsuccessful in generating a tandem
minigene-based approach that would enable us to migrate away from large scale peptide screens.
This is likely due to the lower sensitivity of the Jurkat-based reporter, which suggests that
introduction of TCRs into matched PBMC might yield a more sensitive effector readout. Our
reliance on peptide screens in turn necessitates a reliance on neoantigen prediction pipelines.
While these approaches are continuously improving, their predictions for class II antigens and rare
HLA’s are considerably less accurate276,277. Furthermore, the detection of reactivity to self-
antigens is significantly hindered by a peptide-based approach, as one is restricted to defined
epitopes as a manner of practicality. Thus, while the described system can perform peptide-based
screens with a high degree of flexibility for patient or mouse tumors, the development of more
generalized and less biased screening approaches should be a top priority.
One indirect approach to the targeting of neoantigens that began with Steve Rosenberg’s
group in the 1980’s is the significant ex vivo expansion of patient TIL prior to subsequent re-
infusion. These same expanded TIL cultures have been shown to have robust neoantigen reactivity
and anti-tumor efficacy in a sizeable portion of patients with metastatic melanoma and some
epithelial malignancies114,137,278. We sought to follow a similar protocol for the subsequent
expansion and screening of brain tumor TIL within our cohort of patients. However, we observed
significant clonal drift with a majority of expanded intratumoral TCRs present at much lower
frequencies in the TIL cultures. The inability of the most expanded intratumoral T cell clones to
proliferate following stimulation is somewhat consistent with the phenotype observed on scRNA-

88
seq in which the dominant clones in GBM or BrMET tumors were either terminally differentiated
or significantly exhausted. However, this points to a significant problem in attempting to pursue
adoptive TIL therapy in patients with GBM. Numerous studies have hinted that clonally expanded
T cells within the tumor are enriched for tumor antigen reactivity279,280. As these clones are
specifically lost following ex vivo expansion, the resulting TIL cultures may have lost any pre-
existing tumor reactivity. Any attempts at pursuing adoptive TIL therapy in malignant brain tumors
must wrestle with this issue and develop protocols to maintain tumor clonal architecture such as
modified stimulation conditions or treatment with genetic or epigenetic modifiers to reverse
tumor-induced senescence. These difficulties in the expansion of potentially tumor-specific T cells
only emphasizes the need for linking tumor antigen specificity to expression profiles within TIL
samples for the potential identification of TCRs to be used in ACT.
Driven by the immense success of cancer immunotherapy in certain tumor types, large-
scale analyses of endogenous neoantigen-specific T cell responses have now been performed in a
number of patients across numerous malignancies135,137,138,255,258,260. These studies clearly describe
T cell immune responses against both class I and class II-restricted neoantigens in a variety of
tumor types. However, they also all demonstrate that only a very small fraction of potential
neoantigen targets produce detectable reactivity among tumor-infiltrating T cells. Why is the
fraction of potential targets eliciting a response so low and what does this mean for neoantigen
targeted therapy in tumors with a lower mutational burden? One possibility is that a majority of
immunogenic candidates have been edited out in the course of tumor formation, leaving only
neoantigens that drive relatively poor immune responses. Therefore, a high mutational burden, as
is frequently seen in metastatic melanoma, may be needed to generate enough neoantigen
candidates to produce a strong anti-tumor response. However, recent data showing frequent

89
neoantigen-specific responses in pediatric patients with acute lymphoblastic leukemia, a very low
mutational burden tumor, suggests that a high neoantigen load is not necessary to induce anti-
tumor immunity261. Another possibility is the concept of immunodominance. This phenomenon,
well-described in viral immune responses, occurs when the immune system becomes fixated in its
response to a particular antigenic epitopes at the expense of alternative targets281. Previous
preclinical studies have demonstrated its relevance in the response to murine sarcoma antigens282.
Finally, it is possible that the endogenous anti-tumor T cell response is more diverse than
previously appreciated but simply produces responses not detected through conventional
approaches. Regardless, the development of personalized immunotherapy against tumor-specific
neoantigens will necessitate a deeper understanding of the endogenous anti-tumor T cell response
to aid in the development of neoantigen vaccine or adoptive cellular therapy approaches. While
the presence of neoantigen-specific TCRs within GBM has not been definitely proven, studies in
preclinical mouse models and other immunologically suppressive human tumors hints at their
existence. The remainder of this work will be focused upon how the identification of neoantigen-
specific TCRs can be leveraged for both mechanistic and therapeutic studies.

90
CHAPTER FIVE
Generation of a neoantigen-specific TCR transgenic
5.1 Introduction
One of the initial focuses of our lab was the immunogenomic profiling of a collection of
murine glioma lines (GL261, CT2A, SMA-560) to facilitate deeper analyses of the mechanisms
underlying neoantigen-specific responses and how to leverage these responses therapeutically. By
screening TIL in tumor-bearing mice for IFN-g production in response to candidate neoantigens,
we identified the endogenous neoantigens mImp3, mOdc1, and mEpb4 in GL261, SMA-560, and
CT2A, respectively268,269. Recent studies from our lab demonstrated that neoantigen vaccination
against the mImp3 epitope led to a survival benefit in GL261 and that a polyvalent neoantigen
vaccine combined with ICB therapy produced cures in a majority of CT2A-bearing mice269.
However, vaccine approaches do not allow in vivo tracking of adoptively transferred cells and
necessitate very early treatment (day 3 post-tumor implantation) to achieve an effect. An
alternative approach for neoantigen targeting is the adoptive transfer of neoantigen-specific T cells
derived either from bulk TIL cultures or genetic modification of infused cells. For that purpose,
we sought to isolate a mImp3-specific TCR and generate a preclinical system for studying
neoantigen-specific adoptive cell therapy.
The identification of paired TCR a/b chains has historically necessitated the laborious
process of generating T cell clones. However, within the last decade, numerous methods have been
reported for the cloning of antigen-specific TCRs without the establishment of T cell clones. Some
of these approaches utilize deep sequencing technologies and attempt to identify TCR a/b pairs
through statistical analysis or DNA barcoding283–285. Lately, the widespread use of scRNA-seq

91
technology has provided the ability to simultaneously isolate TCRs and gene expression profiles
from thousands of individual cells, dramatically altering this field of TCR identification286. An
alternative technique utilizes single-cell RT-PCR on sorted T cells, which allows greater flexibility
in its ability to isolate TCRs from a much smaller starting population287–290. Recent studies have
greatly streamlined this process, allowing the identification of antigen-specific TCRs in less than
one week’s time, offering a significantly faster, more flexible, and more cost-effective route to
TCR identification than NGS technologies.
Numerous approaches exist for the generation of mouse T cells with a defined antigen-
specific TCR including viral gene transduction and the generation of retrogenic or transgenic
mice. While the transduction of primary mouse T cells represents the quickest and most flexible
option, achieving a consistently high efficiency of transduction is difficult and would be
enormously laborious for large-scale projects291,292. Retrogenic mice, in which hematopoietic
stem cells are retrovirally transduced with a given TCR prior to reintroduction into otherwise
lethally irradiated hosts, allow for relatively rapid generation of mice bearing a single TCR on
peripheral T cells293,294. However, as these mice do not integrate the TCR into their germline,
they cannot pass it on to their progeny and would need to be consistently remade for use in larger
studies. Transgenic mice, in which the specific TCR is encoded by transgenes introduced into the
mouse’s genome, represent the slowest but ultimately best approach for long-term studies owing
to the ability to generate large colonies of transgenic mice bearing a single TCR.
Thus, we aimed to isolate a mImp3-specific TCR and generate a transgenic mouse
bearing this TCR. This platform will enable a wide range of studies on the role of neoantigen-
specific T cell responses in malignant brain tumors.

92
5.2 Results
5.2.1 Identification of neoantigen-specific TCRs
To provide cells for the isolation of a mImp3-specific TCR, three separate populations of
mImp3-specific T cells were generated. Splenocytes were taken from mice that had rejected
GL261 once following aPD-L1 therapy (1X), once following aPD-L1 therapy and an additional
two times from memory rechallenge (3X), or had been vaccinated in a prime-boost manner with
mImp3 synthetic long peptide and Poly(I:C) adjuvant (Vax). Each of these populations were
separately stimulated with low-dose mImp3 peptide and IL-2 with a weekly replacement with
fresh naïve splenocytes as APCs. Following 6-8 weeks of stimulation, single mImp3-specific CD8
T cells were tetramer sorted into PCR plates (Fig. 5-1a).
In order to isolate mImp3-specific TCRs, we adapted a previously published single-cell
PCR protocol290. In brief, a two-step nested PCR reaction was performed in which the first RT-
PCR reaction included a pool of 41 Va and 39 Vb primers specific to the leader sequences of all
possible TCR a or b chains. Subsequent PCR reactions utilized the common 5’ adapter added to
the end of the first PCR product (Fig. 5-1a). The second-step PCR products were ran on a gel and
purified prior to undergoing sanger sequencing. The benefit of this specific approach relative to
other single-cell PCR protocols is the incorporation of primers specific to leader sequences and
addition of a 5’ adapter for the second PCR reaction. This ensures that the resulting second-step
PCR product will contain the entirety of a Va or Vb gene segment from the start codon through
past the CDR3. Alternative protocols often produce TCR fragments lacking the 5’ end of the Va
or Vb gene segment, necessitating the comparison to reference sequences and potentially
ambiguous assignment of specific Va or Vb gene segments. In total, we obtained TCR a/b pairs
from a total of 42 tetramer-sorted single-cells across three distinct populations (Fig. 5-1b). All of
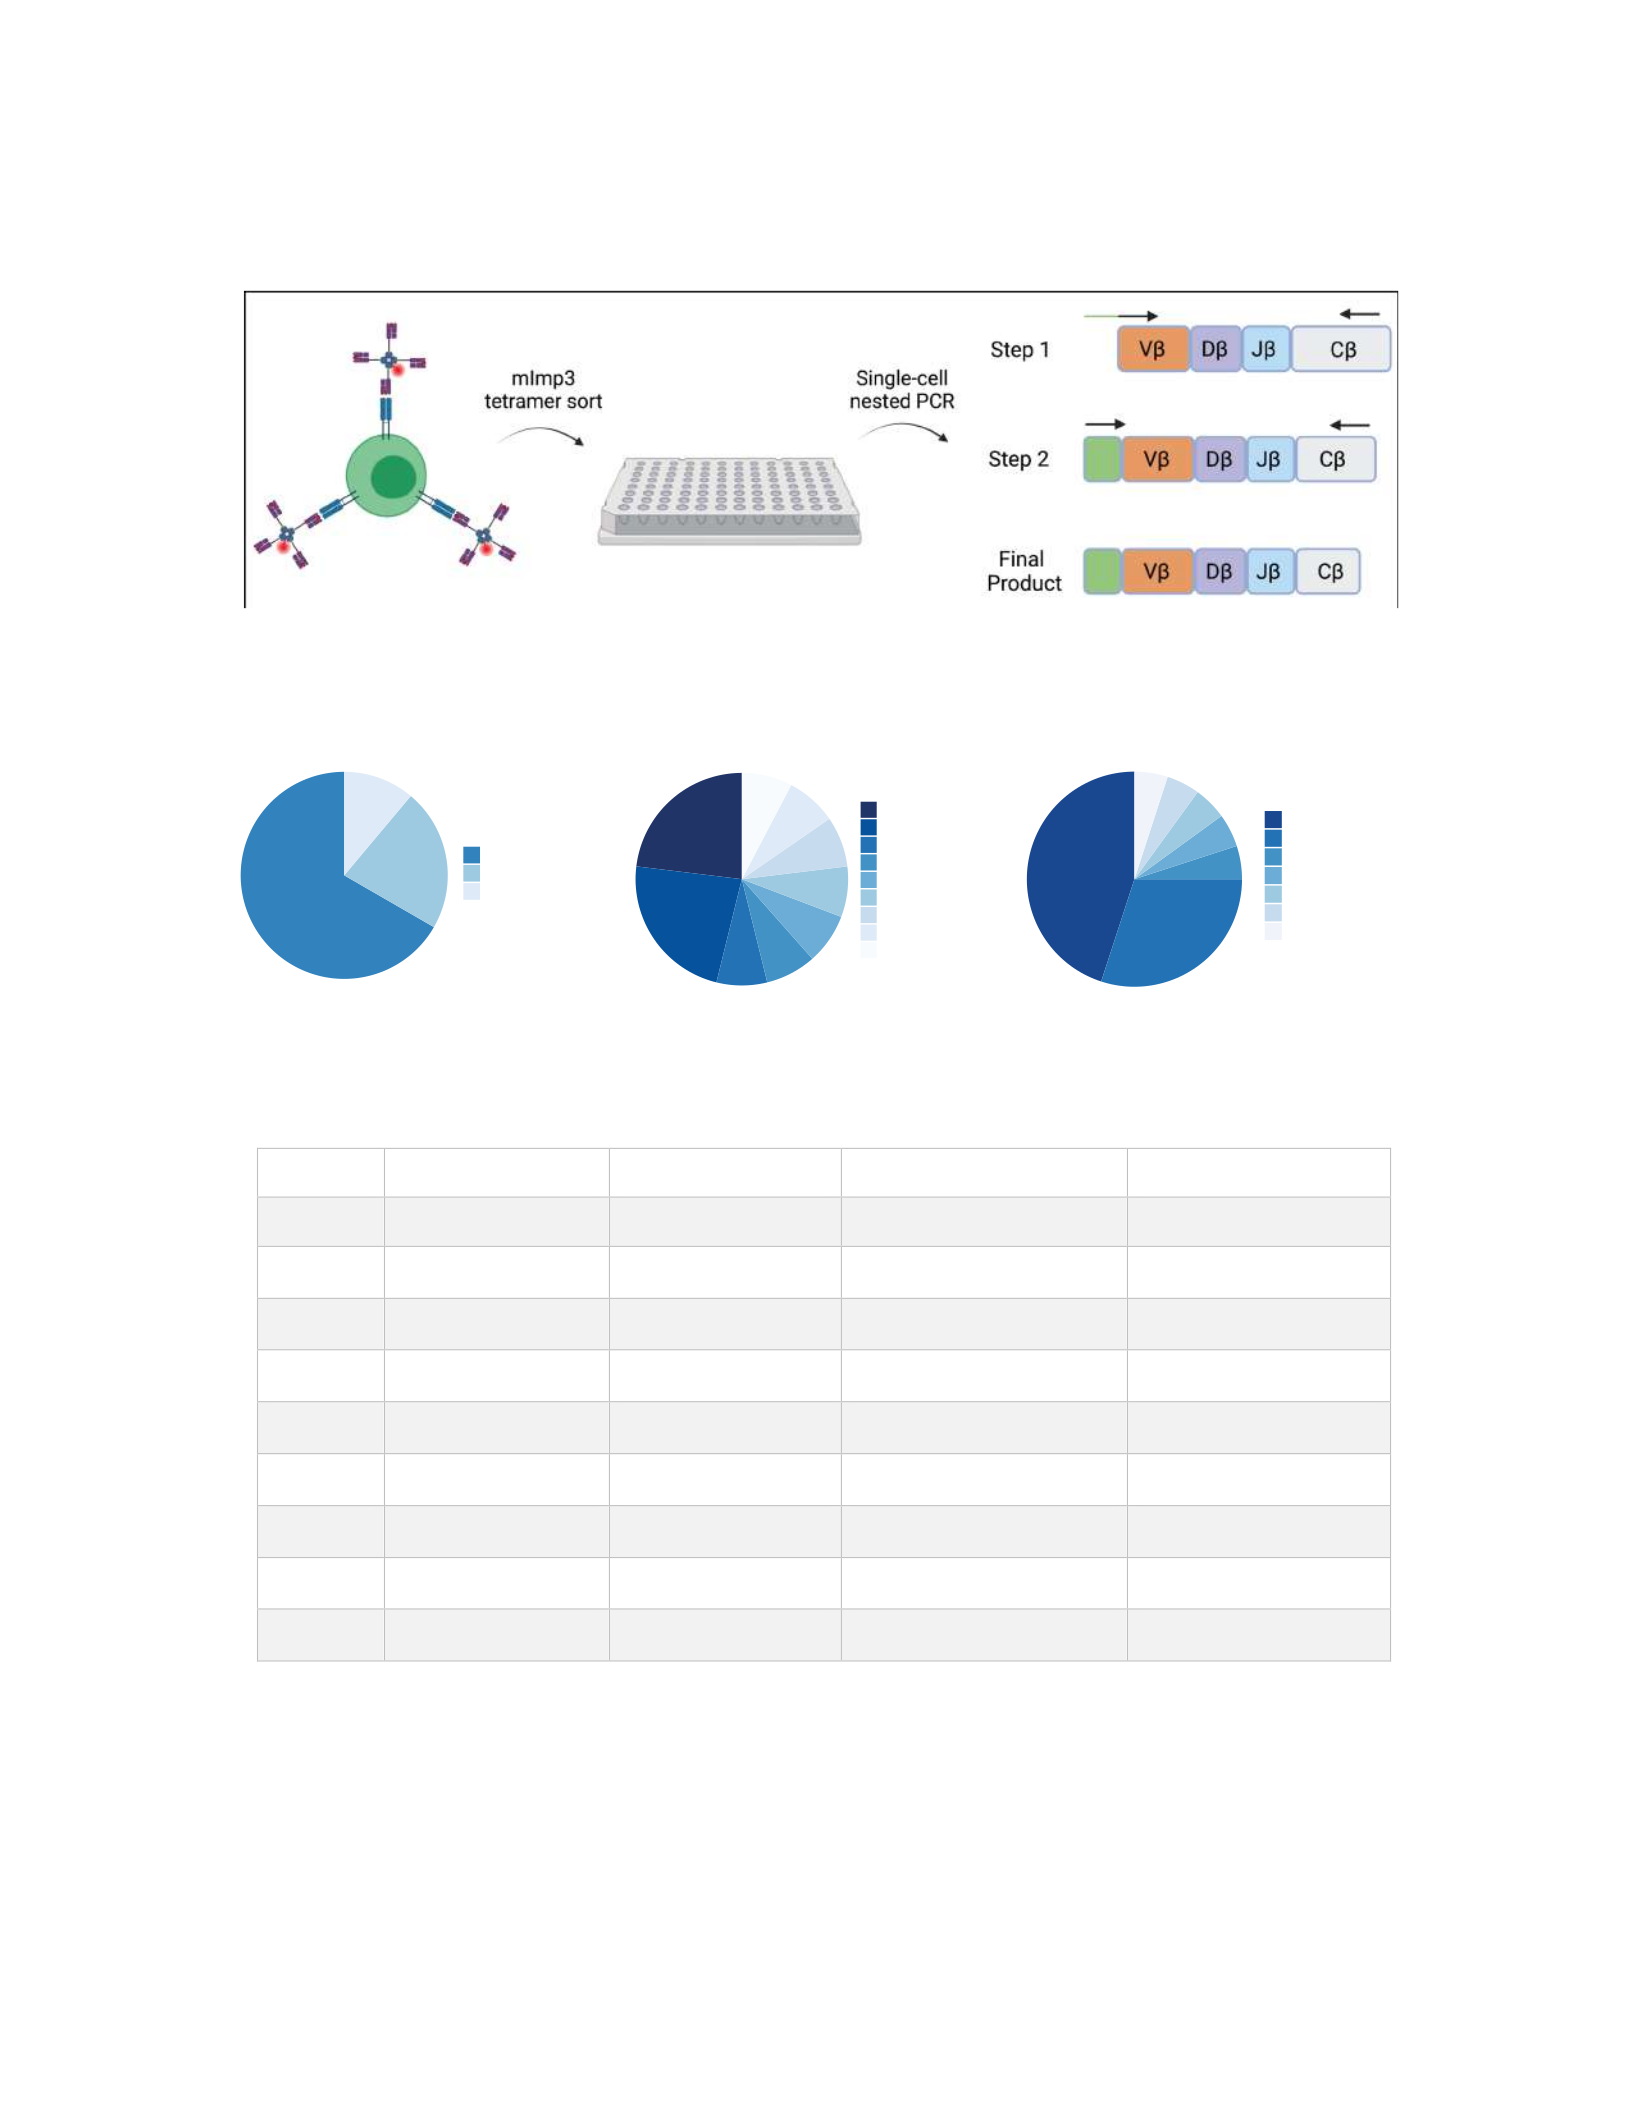
93
a
b
c
Figure 5-1: Identification of candidate mImp3-specific TCRs. a, Schematic depicting the isolation of
candidate mImp3-specific TCRs. Tetramer-positive T cells were single-cell sorted into PCR plates prior to
a nested multiplexed PCR reaction. b, Distribution of T cell clonotypes isolated from three separate sources
of mImp3-specific cells. c, Table describing the final TCR candidates selected for further characterization.
TCR
4.3 D − TR AV13D/TRBV13−2
4.1 B − TRAV6D−6/TRBV13 −2
TR AV6/TRBV13−2
6
2
13
3
11
1
1
1
1
1
TCR
3x.2 .5C − TRAV12D/TRBV26
3x.2 .4D − TRAV12D/TRBV26
3x.1 .1C − TRAV3D/TRBV12
3x.1 .4A − T RAV12D/TRBV26
TR AV6/TRBV13
TR AV13D/TRBV14
TR AV12D/TRBV31
TR AV7/TRBV5
TR AV6D/TRBV13
TCR
V1.1D − TRAV6/TRBV13
V1.6C − TRAV6/TRBV29
V1.3E − TRAV12D/TRBV3
TR AV12D/TRBV15
TR AV13D/TRBV13
TR AV3D/TRBV12
TR AV9D/TRBV15
9
6
1
1
1
1
1
1x Rej ect e d 3x Rej ect e d Vaccinated
TCR
Alpha Chain
Alpha CDR3
Beta Chain
Beta CDR3
4.1B
TRAV6D/TRAJ47
CALGAEDYANKMIF
TRBV13/TRBJ 2/TRBD1
CASGDWVGAETLYF
4.3D
TRAV13D/TRAJ 26
CALEYAQGLTF
TRBV13/TRBJ 2/TRBD2
CASGGLGDQDTQYF
V1.1D
TRAV6/TRAJ22
CVLGDSGSWQLIF
TRBV13/TRBJ 2/TRBD2
CASGDAMGGAETLYF
V1.6C
TRAV6/TRAJ22
CVLAHASSGSWQLIF
TRBV29/TRBJ 2/TRBD2
CASPTGGLAK TLYF
V1.3E
TRAV12D/TRAJ 18
CALSDRGSALG RL HF
TRBV3/TRBJ2/TRBD1
CASSLEQGGG YNYA EQFF
3x1.1C
TRAV3D/TRAJ17
CAVGGSNSAG NK LTF
TRBV12/TRBJ 1/TRBD1
CASSLEDREGS DY TF
3x1.4A
TRAV12D/TRAJ6
CALVPGGNYKPTF
TRBV26/TRBJ 2/TRBD1
CASSPDSYEQ YF
3x2.4D
TRAV12D/TRAJ6
CALIPGGNYKPTF
TRBV26/TRBJ 2/TRBD1
CASSPDSYEQ YF
3x2.5C
TRAV12D/TRAJ6
CALSEGGNYKPTF
TRBV26/TRBJ 2/TRBD1
CASSPDSYEQ YF

94
the expanded populations displayed the enrichment of specific T cell clones with a collection of
lower frequency clonotypes only observed once. From these isolated TCRs, we selected nine
candidates for further analysis, with specific focus given to the TCRs present at greatest frequency
in the expanded populations (Fig. 5-1c).
5.2.2 Characterization of neoantigen-specific TCRs
To characterize these nine TCR candidates, full-length TCR chains were generated by
combining sequencing results with IMGT reference sequences for a or b chain constant regions.
For each TCR, gene blocks were ordered consisting of b chain – P2A - a chain and cloned into
the pMIG vector backbone. For screening each candidate, we utilized the previously described 58
hybridoma cell line that lacks an endogenous TCR but generates robust antigen-specific responses
following introduction of a specific TCR274,275. Each TCR was retrovirally introduced into these
58 hybridoma cells, generating a library of TCR-expressing immortalized cell lines. Initially, all
nine candidate TCRs were screened for their ability to bind the mImp3 tetramer. Despite being
isolated from tetramer-sorted CD8 T cells, the V1.3E and 3x.1.4A TCRs did not bind to the mImp3
tetramer (Fig. 5-2b). However, the other seven TCRs all displayed variable levels of tetramer
binding, with the 3x.1.1C TCR demonstrating the strongest response. Notably, the 3x.1.1C TCR
was the only candidate to bind to the mImp3 tetramer in a CD8-independent manner (data not
shown).
The seven candidate TCRs with appreciable levels of tetramer binding were then assessed
for their ability to stimulate cytokine production in TCR-expressing 58 hybridoma cells. To do so,
each 58 hybridoma cell line expressing a given TCR was co-cultured with naïve splenocytes
loaded with either the mImp3 epitope or an irrelevant Db-restricted antigen (mOdc1). While all
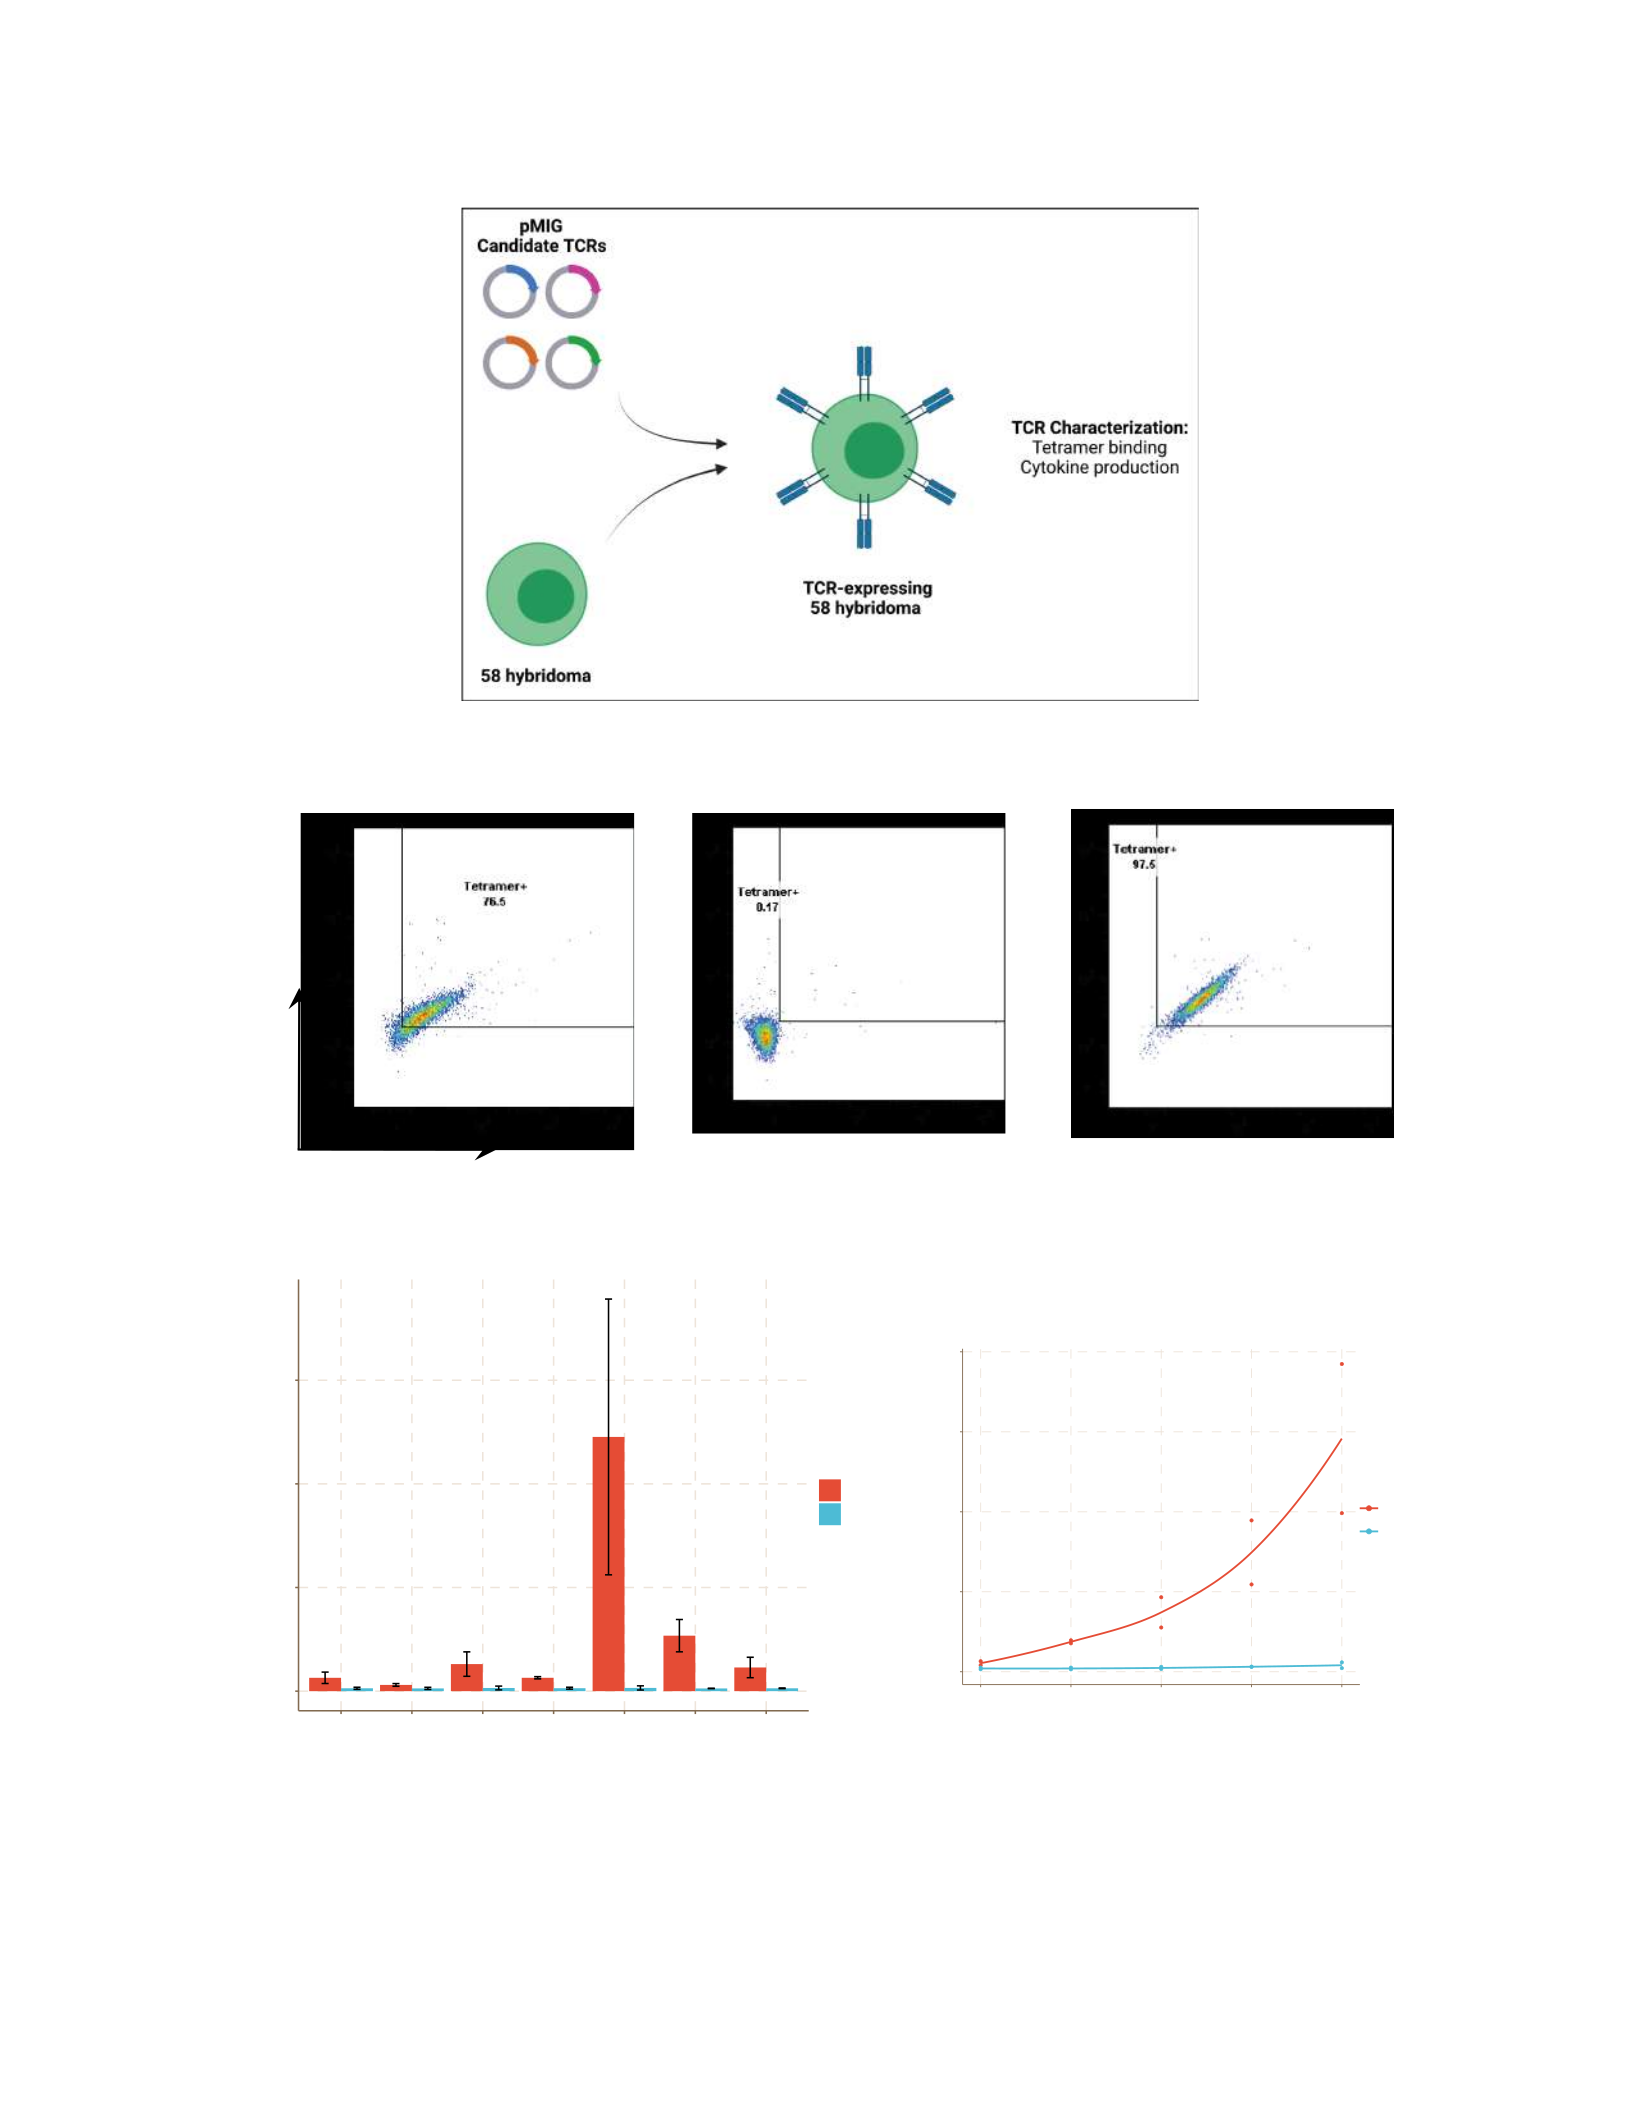
95
a
Figure 5-2: Functional characterization of candidate mImp3-specific TCRs. a, Schematic of system for
screening TCRs by introduction into 58 hybridoma cells. b, Representative tetramer stains on 58 hybridoma
cells transduced with candidate TCRs. c, IL-2 production from TCR-expressing 58 hybridoma cells following
overnight co-culture with splenocytes loaded with 10 micromolar peptide. d, Dose-response titration of 3x.1.1C
TCR-expressing 58 cells following overnight co-culture with splenocytes loaded with indicated peptide.
b
c d
mImp3 Tetramer
mImp3 Tetramer
V1.1D V1.3E 3x.1.1C
0
50
10 0
15 0
4.1B 4.3D V1.1D V1.6C 3x.1.1C 3x.2.4D 3x.2.5C
IL−2 (pg/mL)
Peptide
mImp3
mOdc1
0
30
60
90
120
110 100 1000 10000
Co ncen tratio n (nM)
IL−2 (pg/mL)
Peptide
mImp3
wtI mp3

96
candidates demonstrated the ability to induce IL-2 production from the 58 hybridoma cells, the
3x.1.1C TCR produced significantly higher levels than all other TCRs (Fig. 5-2c). To further
profile this TCR, we assessed its potential cross-reactivity to the wild-type Imp3 epitope. In a
similar co-culture experimental design, no wild-type reactivity was observed across a range of
concentrations (Fig. 5-2d). Meanwhile, the 3x.1.1C TCR displayed a clear dose-dependent
response to the mImp3 antigen (Fig. 5-2d). Thus, the 3x.1.1C TCR was an ideal candidate for
further study owing to clear tumor neoantigen reactivity.
5.2.3 Generation of neoantigen-specific TCR transgenic
Owing to the challenges of viral transduction in primary murine splenocytes and the
desire for a large supply of mImp3-specific T cells, we proceeded to generate a TCR transgenic
expressing the 3x.1.1C TCR. To do so, we made use of the previously validated pCD2 and p428
transgene vectors provided by the lab of Paul Allen295,296. The TCR a/b chains of the 3x.1.1C
TCR were cloned into the pCD2 and p428 vectors, respectively. Following linearization of the
transgene fragments, they were co-injected into the pronucleus of C57BL/6 zygotes in work
performed by the Transgenic, Knockout, and Micro-Injection core. An initial group of 54
C57BL/6 mice were screened by PCR on genomic tail DNA with TCR transgene-specific
primers. Unfortunately, none of these initial mice carried either transgene fragment. Owing to
increased success using mice on a mixed background, we proceeded to perform microinjections
in C57BL/6 x 129 hybrid mice. In the first batch of 19 C57BL/6 x 129 mice, we identified two
potential founders (Fig. 5-3a).
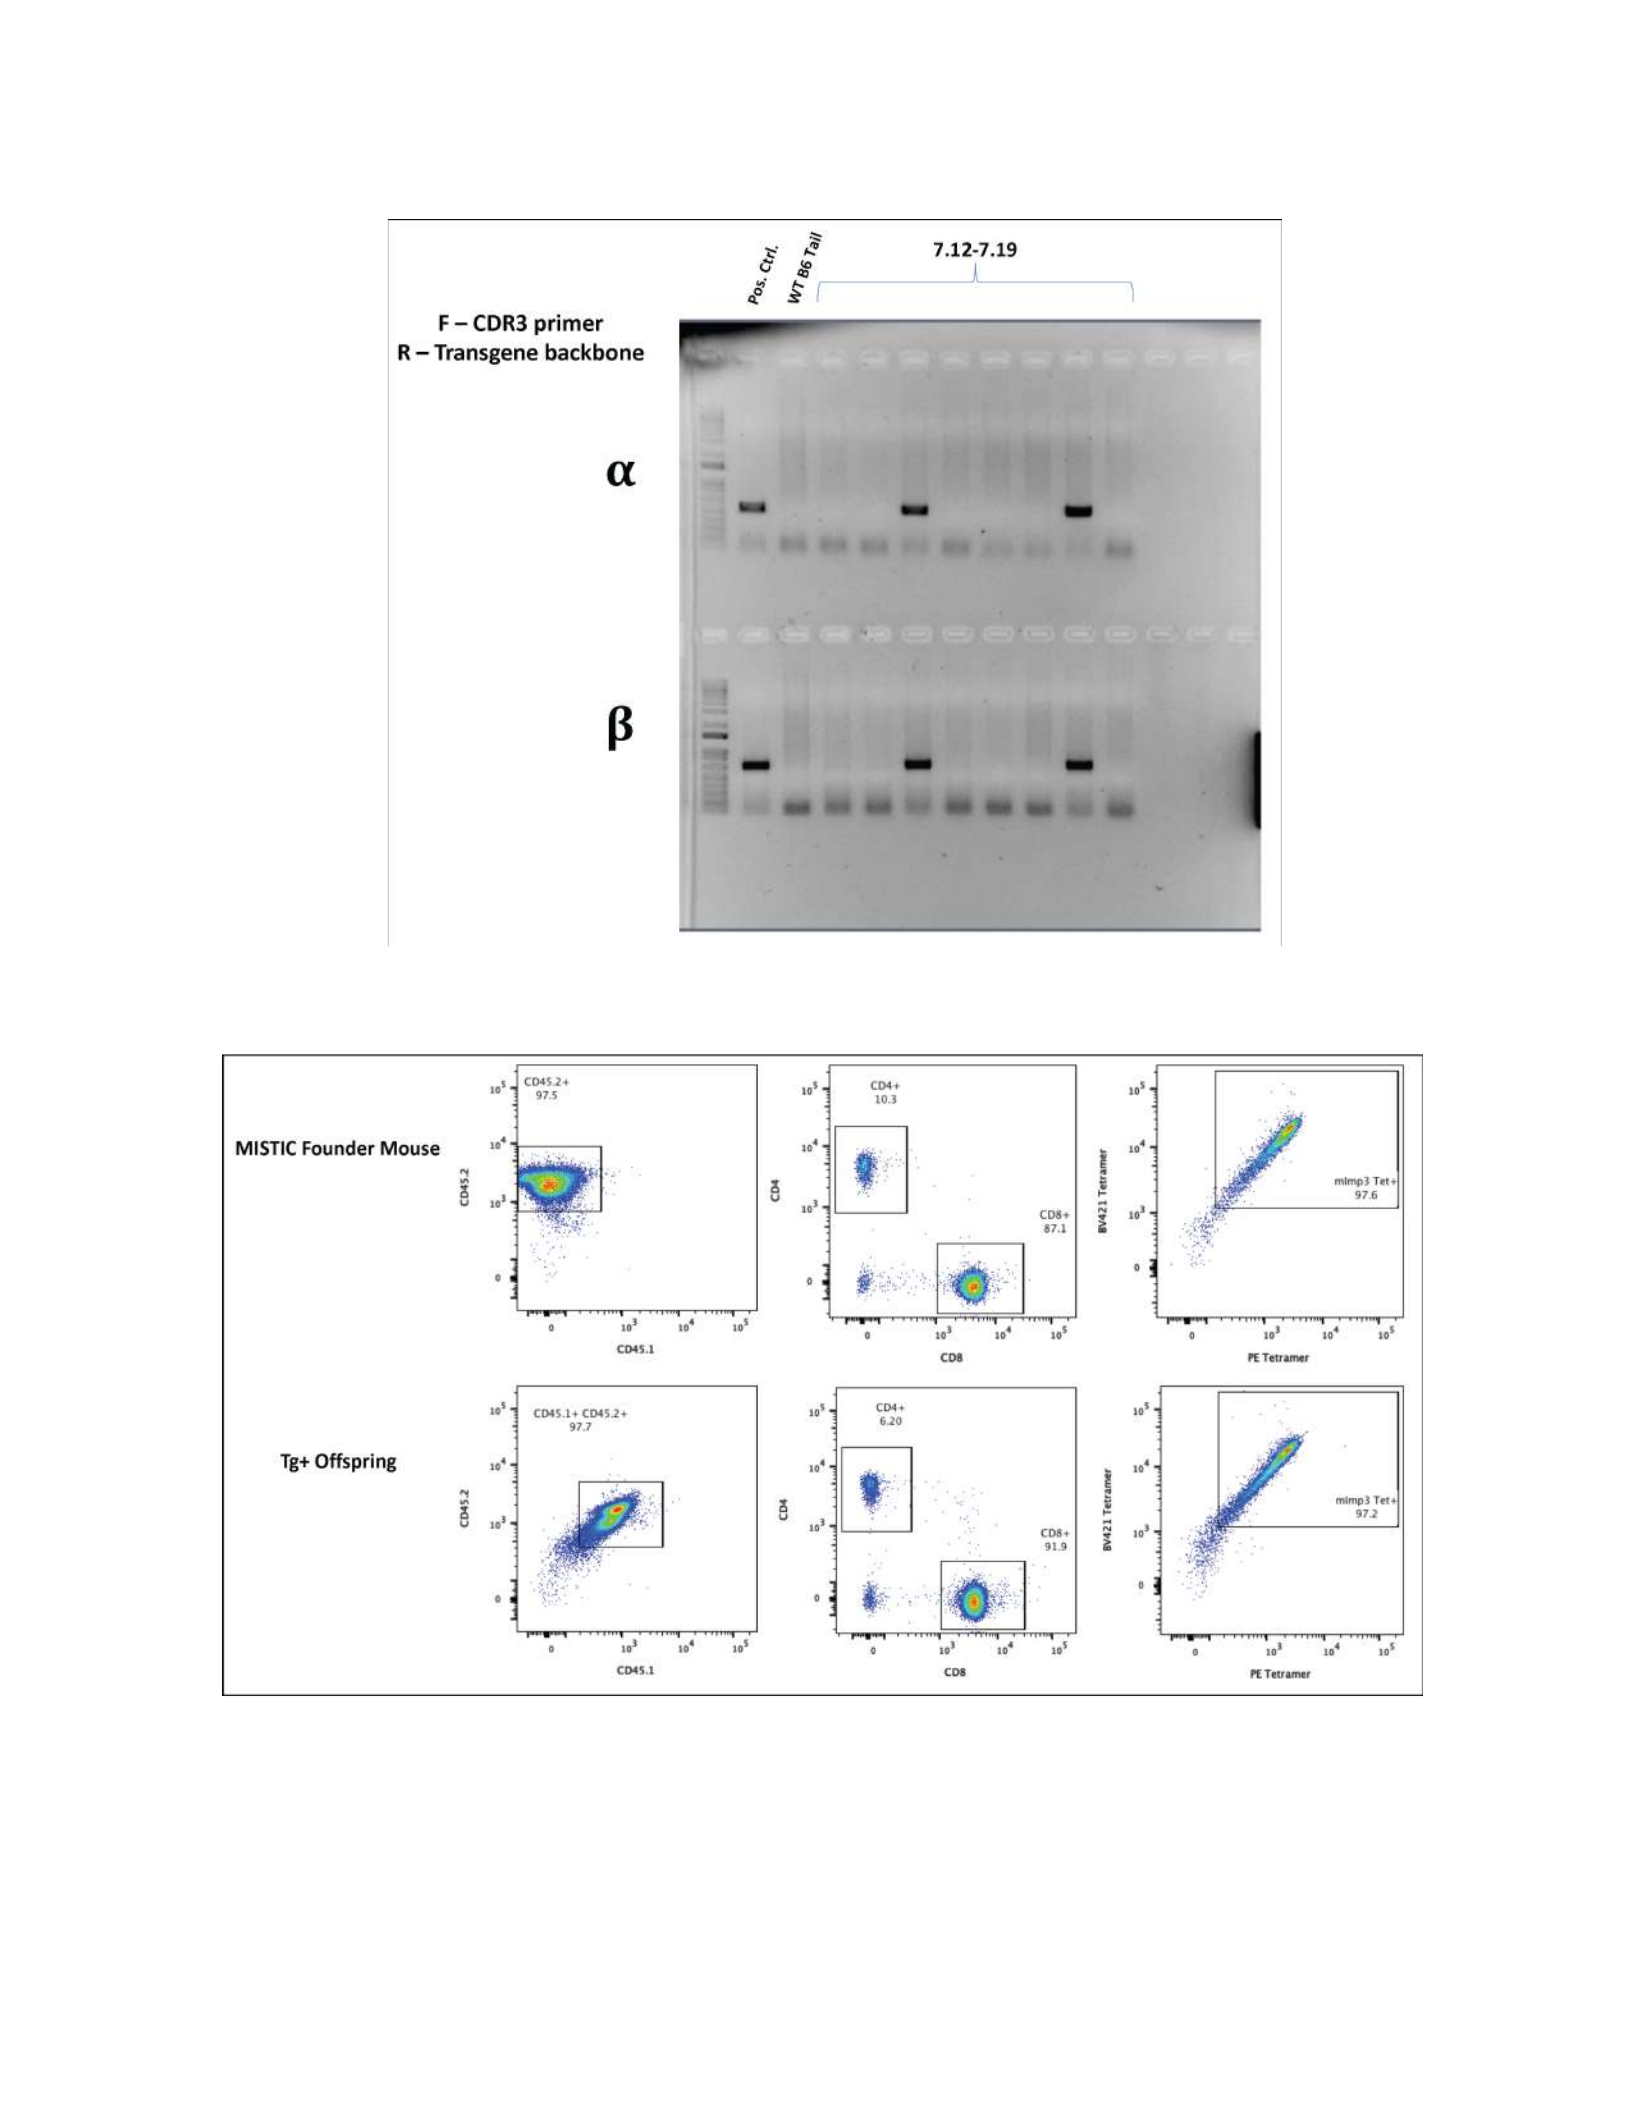
97
a
b
Figure 5-3: Generation of MISTIC Transgenic Mouse. a, Genotyping result confirming integration of
transgenes containing both alpha and beta chains of 3x.1.1C TCR in two mice (7.14 & 7.18). b, Flow
cytometry profiling of the peripheral blood of the transgenic founder mouse and resulstant offspring after
crossing with a CD45.1+ congenic.
!"#$%&'()*

98
To characterize these potential founder mice, we profiled their peripheral blood via flow
cytometry. In contrast to naïve mice, a significant majority of the T cells in these mice were CD8
T cells, all of which bound strongly to the mImp3 tetramer (Fig. 5-3b). Following crossing of these
founder mice with CD45.1+ C57BL/6 males, we confirmed the germline integration of the
transgene in resulting offspring. These transgenic mice expressing the 3x.1.1C TCR are hereafter
referred to as Mutant Imp3-Specific TransgenIC (MISTIC) mice.
5.3 Discussion, Future Directions and Conclusions
With the tremendous interest in the targeting of neoantigens for mechanistic and
therapeutic studies, the rapid identification of TCRs with defined specificity becomes critical. In
the past, the identification of a TCR against a defined antigen would usually entail the generation
of a T cell clone. However, recent approaches utilizing either deep sequencing technologies or
single-cell nested multiplexed PCR have greatly streamlined this process resulting in candidate
TCR identification in as little as one week’s time. For our studies, we adapted a previously
published nested multiplexed PCR protocol for the isolation of a set of TCR candidates specific to
the mImp3 neoantigen within GL261.
While we were ultimately successful in the identification of a set of neoantigen-specific
TCR candidates, the approach does carry some significant drawbacks. Owing to the exquisite
sensitivity of nested PCR reactions, we encountered significant challenges with contamination
upon initial optimization. Ultimately, the single-cell nested PCR protocol necessitated the use of
specialized equipment and bench space to eliminate these concerns. Furthermore, performing PCR
reactions on 96-well plates and isolating the resulting products via gel purification is both
technically challenging and laborious. Widespread utilization of scRNA-seq now enables the

99
identification of TCR a/b pairs for an entire population and presents an appealing alternative to
our chosen approach. However, the identification of TCRs via scRNA-seq is slower, more costly,
and requires far greater cell numbers than single-cell PCR protocols. The ideal procedure for
identifying TCRs with a defined specificity is ultimately very project-specific.
It is generally assumed that clonally expanded T cell populations within a given tissue will
be enriched for antigen-specificity due to localized antigen-driven expansion. This phenomenon
has been clearly demonstrated in both human and murine systems279,280. On the other hand, our
data set offers an intriguing counterpoint. While the most clonally expanded T cells within our
analyzed populations were all mImp3-specific, the most highly reactive TCR that was ultimately
chosen for incorporation into the MISTIC mouse was only detected once among thirteen
sequenced cells from that population. It is not clear whether this is the result of clonal drift over
the course of the antigen-specific expansion, or whether this clone was never present at a
significant frequency from the onset. Regardless, the high affinity and reactivity of the 3x.1.1C
TCR points to the complex factors governing T cell expansion both in vivo and in vitro and
cautions against over-reliance on clonotype frequency in inferring T cell functionality.

100
CHAPTER SIX
Characterization of neoantigen-specific adoptive cell therapy
6.1 Introduction
There is immense interest in adoptive T cell therapies for tumors such as GBM lacking
significant baseline intratumoral T cell infiltration. The earliest attempts at adoptive T cell
therapies were Steve Rosenberg’s landmark studies in the 1980’s which demonstrated impressive
results in the treatment of metastatic melanoma with expanded TIL112,114. Since then, his group
has broadened this treatment to a wide array of malignancies such as cholangiocarcinoma and
colon carcinoma and demonstrated that these infusion products often contain significant
neoantigen reactivity137,139,140. However, this approach necessitates the expansion of incredibly
large numbers of T cells from the patient TIL, and these infusion products are likely broad
polyclonal populations of cells both with and without tumor specificity. Thus, since the
identification of the first tumor antigens in the 1990’s, Rosenberg and others have had an interest
in adoptive cell therapies using T cells engineered to express a given TCR with defined tumor
antigen specificity.
Throughout the last two decades, this approach has been utilized for the targeting of CT or
differentiation antigens such as MART-1, NY-ESO-1, and MAGE-A3 in a broad variety of solid
tumors117,118,297. These studies have been simultaneously promising for the degree of anti-tumor
immunity observed but also deeply troubling for the significant toxicities. Despite seeming tumor
specificity, the targeting of these shared self-antigens has resulted in severe on-target off-tumor
effects such as neurological toxicity or severe colitis due to low level expression of these antigens
in normal host tissues297–299. These studies have indirectly led to increased enthusiasm for the

101
targeting of neoantigens, as they represent ideal therapeutic targets owing to the lack of any pre-
existing immune tolerance against them and their tumor-specific expression. However, unlike the
targeting of CT antigens, which utilize TCRs against epitopes presented by common HLA alleles,
cell therapy with engineered T cells targeting tumor-specific neoantigens would also necessitate
the identification of patient-specific TCRs. Despite this, the widespread utilization of both tumor
genomic sequencing and scRNA-seq profiling of TIL has made this approach far more feasible
than it once seemed300,301.
Despite significant interest in adoptive T cell therapy for solid tumors such as GBM and
the clear benefits of targeting tumor-specific neoantigens, very few preclinical systems exist to
accurately model it. This is largely based on practicality, as relatively few endogenous tumor
neoantigens have been identified in murine models and even fewer transgenic systems exist to
easily target them. Most preclinical systems for studying adoptive T cell immunotherapy target
significantly overexpressed and highly immunogenic foreign proteins introduced into the tumors
or shared antigens also expressed by normal tissue302,303. However, neither overexpressed foreign
proteins nor shared antigens accurately recapitulate the tumor-specific expression profile and
degree of immunogenicity of an endogenous tumor neoantigen. Thus, there exists a need for a
platform to investigate neoantigen-directed cellular therapy and the role of neoantigen-specific T
cells in GBM.
To that end, we generated and characterized the Mutant Imp3-Specific TransgenIC
(MISTIC) mouse engineered with a TCR specific for the mImp3 neoantigen within the murine
GBM model GL261. To our knowledge, this is the first TCR transgenic generated against a tumor-
specific neoantigen in a mouse GBM model. This system displays the potential for neoantigen-

102
targeted cellular therapy in the treatment of GBM and serves as a platform for both translational
and basic investigation on the role of neoantigen-specific T cells in GBM.
6.2 Results
6.2.1 Functional validation of MISTIC T cells
We first sought to characterize the in vitro functionality of MISTIC T cells in response to
their cognate antigen. To do so, we harvested splenocytes from MISTIC mice and stimulated this
bulk population for 5 days with mImp3 peptide and low-dose IL-2. Over this short time frame, we
observed substantial proliferation, and CD8 T cells represented an overwhelming majority of the
population at day 5. Virtually all of these CD8 T cells had an activated phenotype characterized
by high levels of CD44, and a majority also expressed CD62L indicative of a central memory
phenotype (Fig. 6-1a). To confirm the active proliferation of these cells, we isolated and CFSE-
labeled CD8 T cells from MISTIC mice and incubated them for 72 hours with naïve splenocytes
loaded with different peptides at 100 nM. Using the CD45.1 congenic marker for identification of
MISTIC T cells, we demonstrated significant proliferation in response to the mImp3 peptide but
no stimulation by either the wild-type Imp3 epitope or an irrelevant peptide (SIINFEKL) (Fig. 6-
1b). To assess the responses of activated MISTIC T cells, we stimulated MISTIC splenocytes for
5 days as previously described, isolated CD8 T cells from the resulting population, and rested them
for 6 hrs without peptide or IL-2. These rested cells were then co-cultured with naïve splenocytes
loaded with different peptides at varying concentration, and the level of IFN-g secreted into the
supernatant was measured. The activated MISTIC T cells produced high levels of IFN-g in
response to the mImp3 antigen but again showed no response to the wild-type epitope or an
irrelevant peptide (mOdc1) (Fig. 6-1c). Finally, we wished to investigate the capacity of these
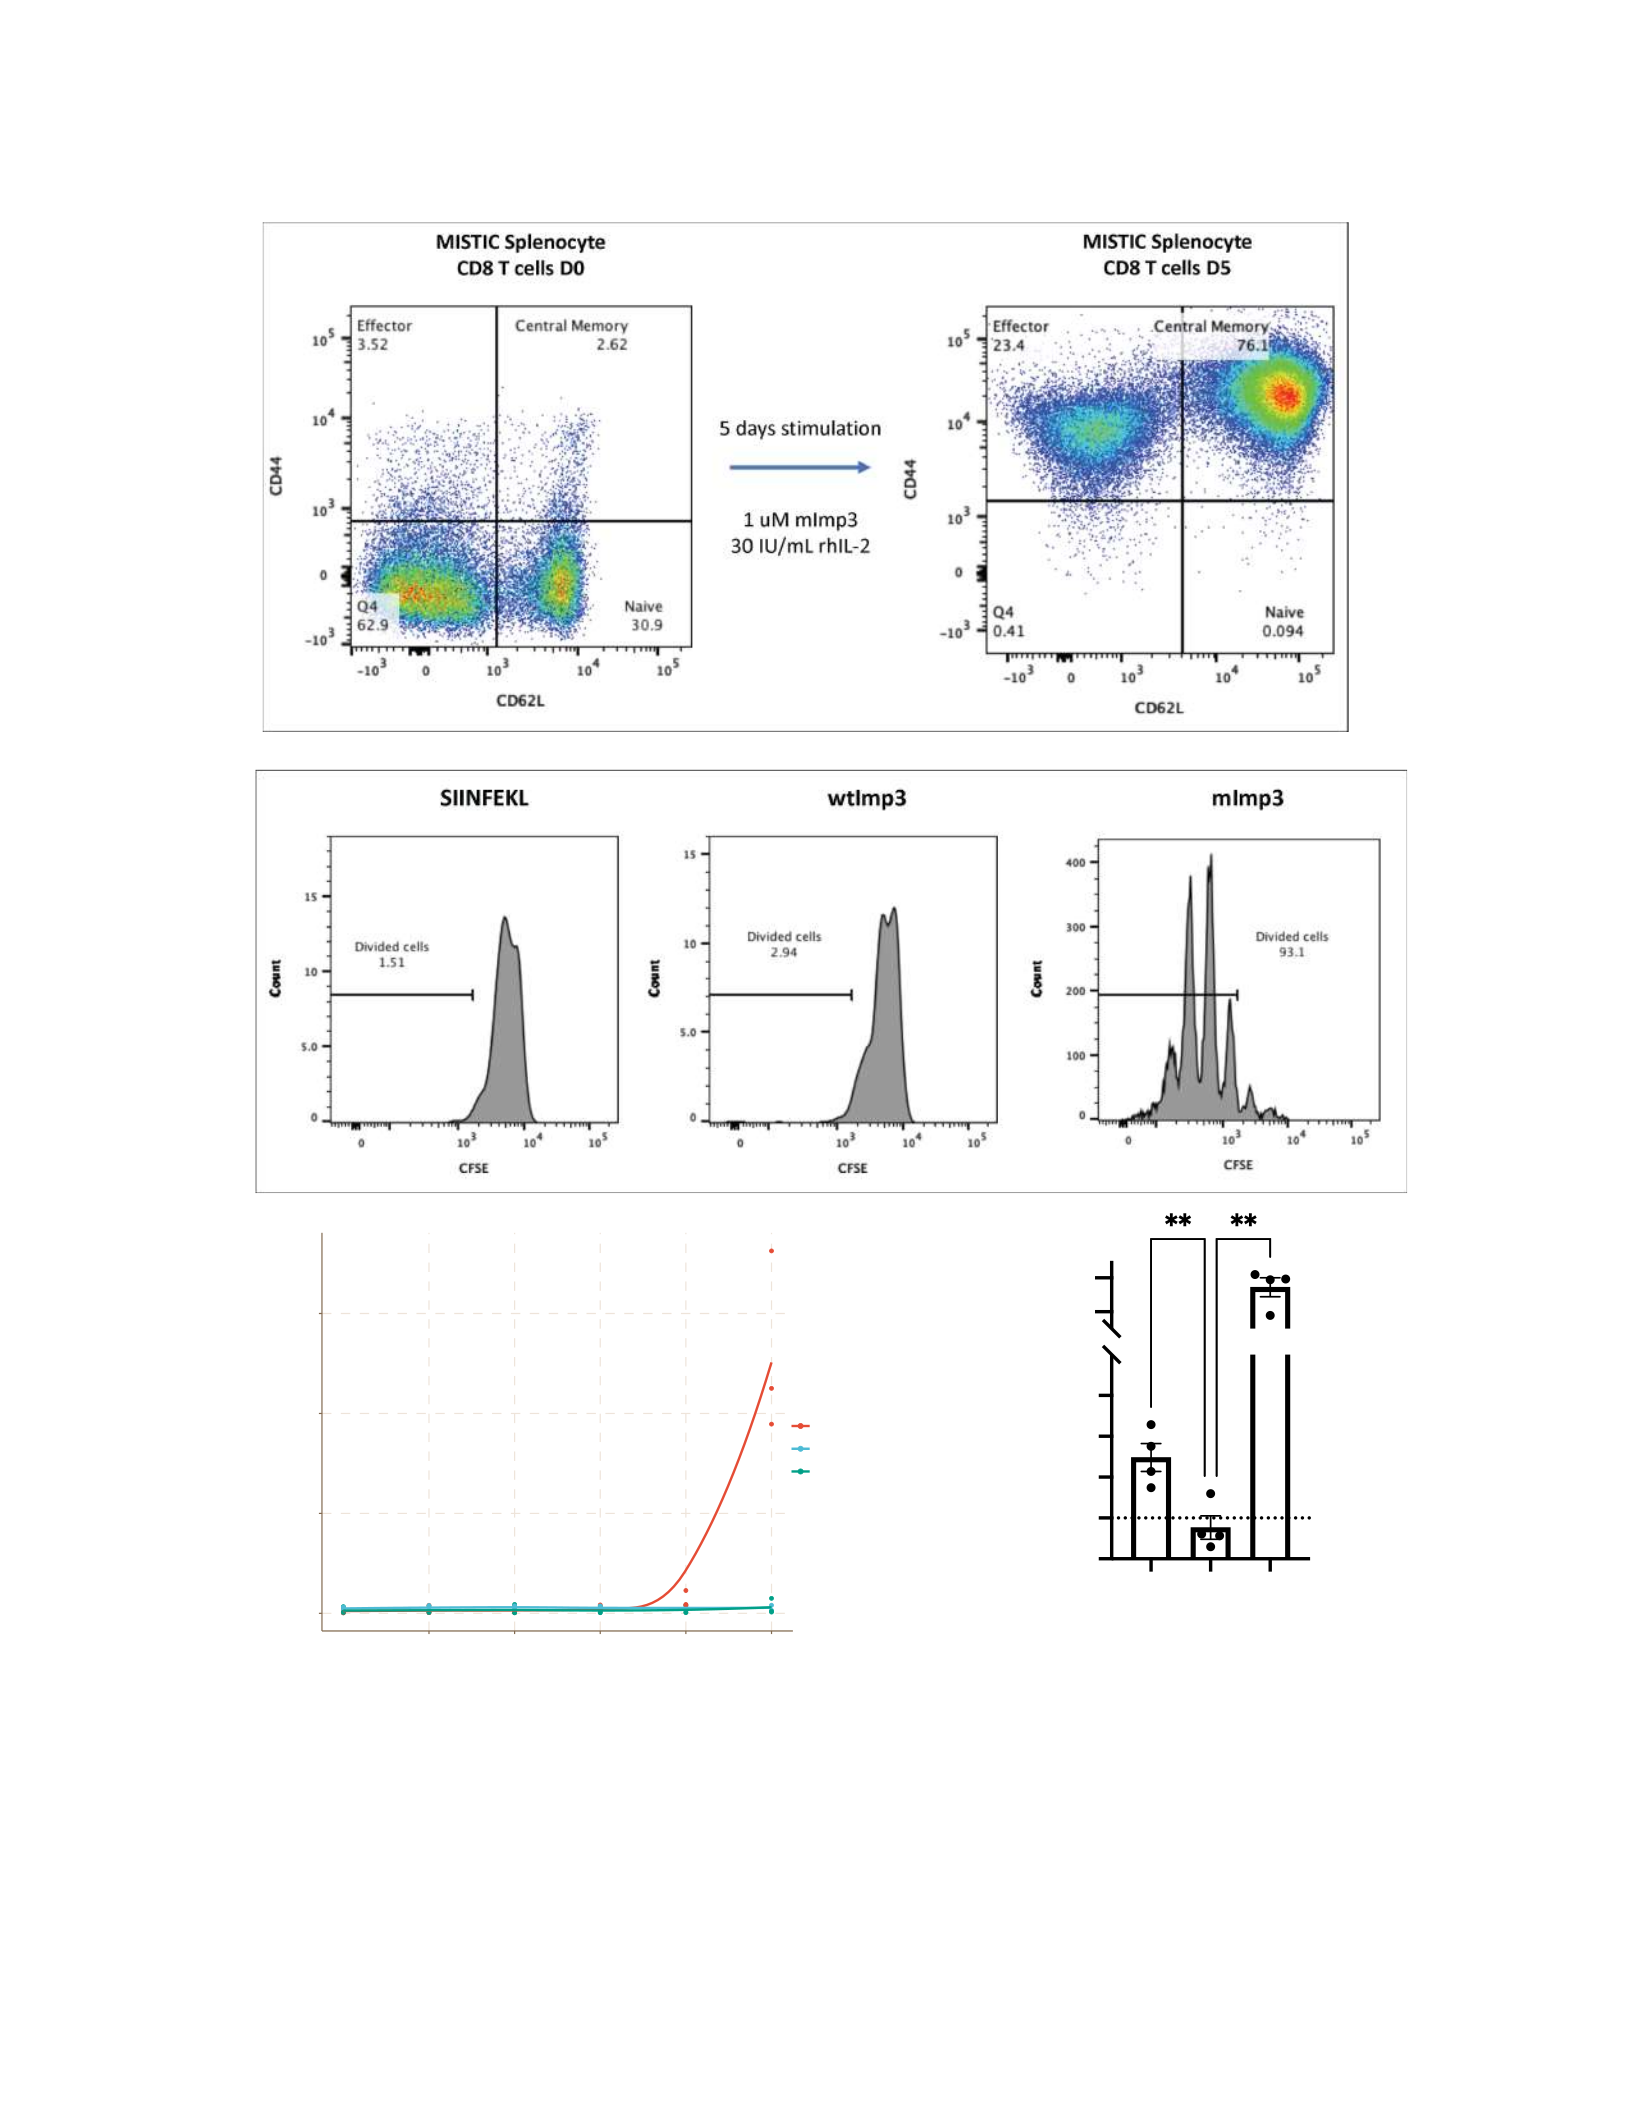
103
0
50
100
150
0.1 110 100 1000
Concent ration (nM)
IFN−γ (pg/mL)
Peptide
mImp3
mOdc1
wtI mp3
a
b
c
Figure 6-1: Functional characterization of MISTIC T cells. a, Flow cytometry profiling of CD8 T cells from
the spleens of MISTIC mice both before (left) and after (right) in vitro stimulation with mImp3 peptide. b, Naive
MISTIC T cells were CFSE-labeled and stimulated for 72 hrs with mImp3 pepitde prior to assessment of cell
division. c, IFN-γ dose-response from D5-stimulated MISTIC T cells following overnight co-culture with naive
splenocytes loaded with peptides at the indicated concentration. d, Relative IFN-γ following co-culture of
D5-stimulated MISTIC T cells with IFN-γ-stimulated tumor targets.
d
GL261
CT2A
CT2A:mImp3
0
1
2
3
4
5
30
50
Fold Change IFN-γ

104
MISTIC T cells to respond to antigen-bearing tumor targets. To do so, we again utilized D5-
stimulated/rested MISTIC T cells that were co-cultured with IFN-g stimulated tumor targets. The
MISTIC T cells produced high levels of IFN-g in response to mImp3-expressing GL261 but
significantly less in response to CT2A, which does not express the mImp3 antigen (Fig. 6-1d).
When CT2A was engineered to overexpress the mImp3 antigen, we again detected significant
levels of IFN-g, suggesting the mImp3 antigen is sufficient to mediate this response.
6.2.2 Adoptive cell therapy with MISTIC T cells
We next aimed to test the efficacy of our MISTIC T cells in a model of adoptive cellular
therapy (ACT) against mice with intracranial GL261. Most established techniques for cellular
therapy in patients necessitate in vitro stimulation for the purpose of either genetic engineering or
TIL expansion. Thus, we developed an ACT protocol in which tumor-bearing mice receive an
intravenous infusion of in vitro expanded CD8 MISTIC T cells on day 7 following tumor
implantation (Fig. 6-2a). These mice all receive a lymphodepleting dose of 5 Gy total body
irradiation the day prior to cell therapy infusion and are given supplemental IL-2 for several days
thereafter. Control mice receive the same total body irradiation and supplemental IL-2 but no T
cell infusion. The MISTIC T cell therapy resulted in a significant treatment benefit to GL261-
bearing mice, with a majority of mice cured of their tumors (Fig. 6-2b). When the tumor was given
a longer duration to establish and the initiation of treatment was delayed until day 14, this treatment
benefit is lost (Fig. 6-2c).
To assess the potential mechanisms underlying this treatment effect, we performed the
same survival analysis in RAG2-/- mice lacking any endogenous B or T cells. In this system, the
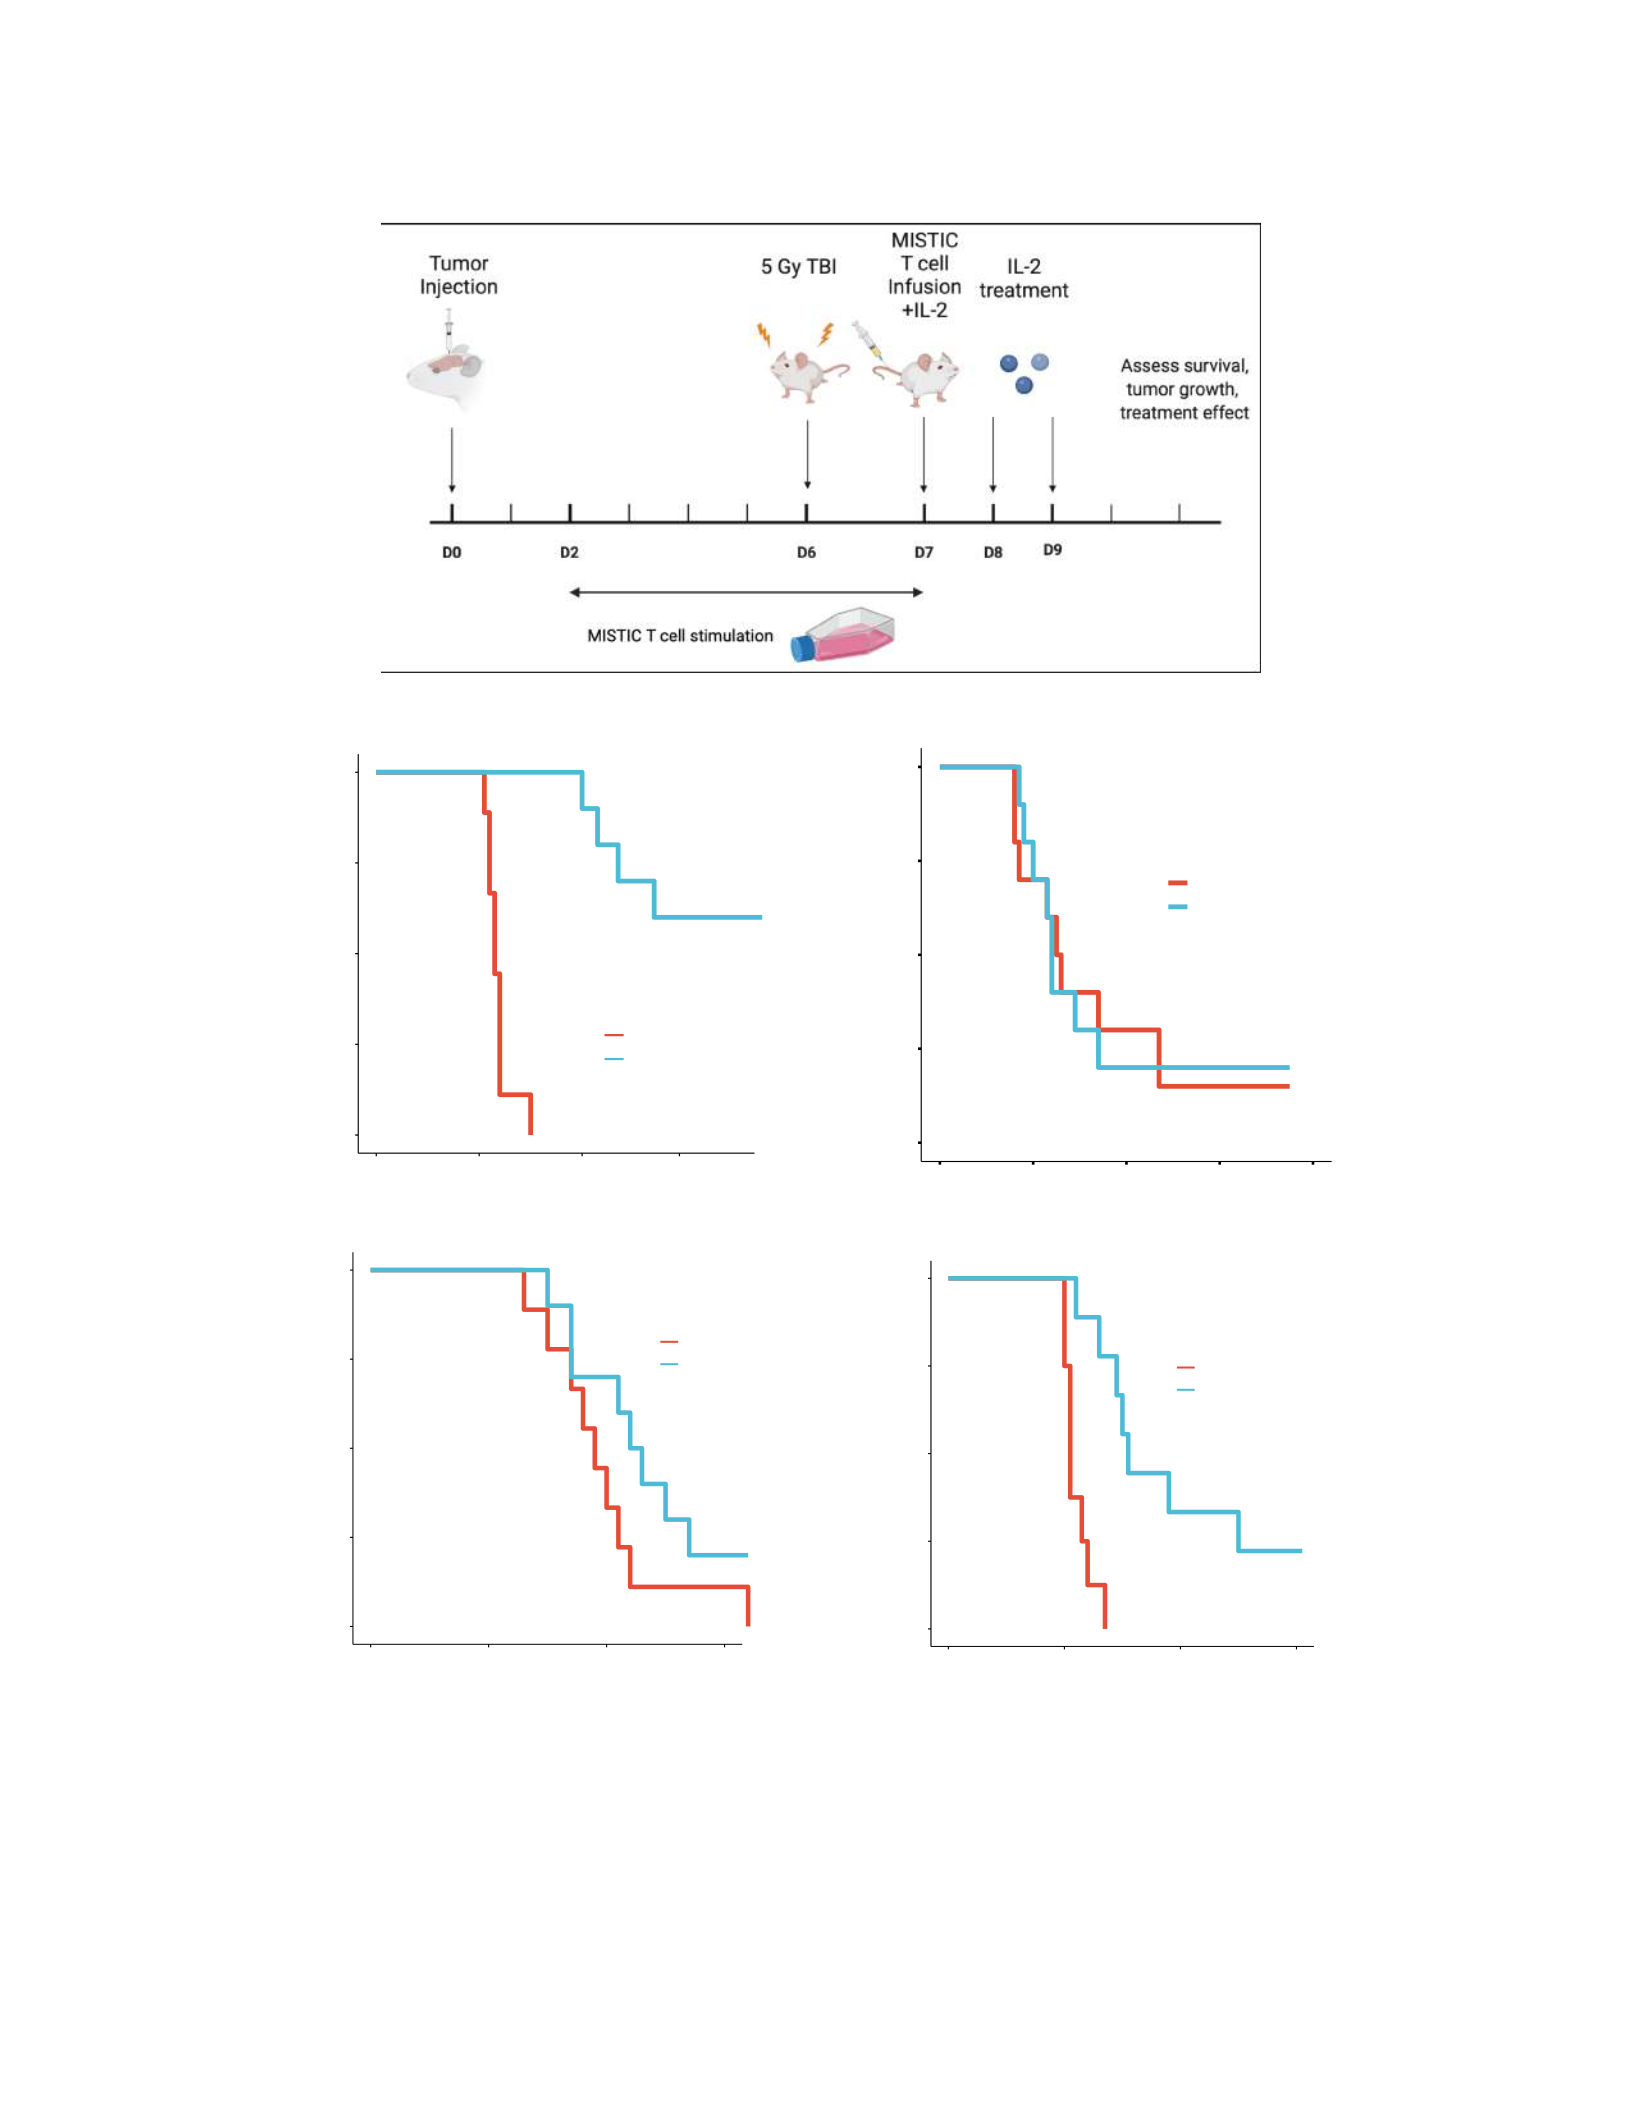
105
a
b c
d
Figure 6-2: MISTIC T cell therapy against GL261. a, Schematic depicting the treatment protocol for MISTIC
T cell therapy. b, Survival curve of GL261-bearing mice treated with MISTIC cell therapy on day 7 post-tumor
implantation. c, Survival curve of GL261-bearing mice treated with MISTIC cell therapy on day 14 post-tumor
implantation. d, Survival curve of GL261-bearing RAG KO mice treated with MISTIC cell therapy on day 7
post-tumor implantation. e, Survival curve of GL261-bearing Delta32 mice treated with MISTIC cell therapy
on day 7 post-tumor implantation. All data represents two separate biological replicates.
60
p < 0.000 1
0.00
0.25
0.50
0.75
1.00
020 40
Days
Survival P roba bility
Treatment
+
+
Control
MISTIC Treated
+
+
+ +
p = 0.89
0.00
0.25
0.50
0.75
1.00
020 40 60 80
Days
Su rvival P roba bility
Treatment
+
+
Control
MISTIC Treated
e
+
p = 0 .1
0.00
0.25
0.50
0.75
1.00
010 20 30
Days
Survival Probability
Treatment
+
+
RAG -- Control
RAG -- MISTIC Treated
+
p = 3 e−0 4
0.00
0.25
0.50
0.75
1.00
020 40 60
Days
Survival Probability
Treatment
+
+
Delta32 -- C ontrol
Delta32 -- MISTIC Treated

106
profound survival benefit is lost, indicating the necessity of endogenous host lymphocytes for
mediating the response to MISTIC T cell therapy (Fig. 6-2d). We then sought to investigate the
role of the conventional dendritic cell 1 (cDC1) subset in MISTIC T cell therapy. Prior studies
from our lab and others has demonstrated the essential role of these cells in cross-presenting tumor
antigens and priming naïve CD8 and CD4 T cells304,305. Recent work from Ken Murphy’s lab has
identified the transcriptional network controlling cDC1 differentiation and generated a knockout
mouse (Delta32) lacking a crucial enhancer necessary for cDC1 development306. When GL261-
bearing Delta32 mice were given MISTIC T cell therapy, the survival benefit was diminished but
not completely abrogated as in the RAG2-/- system (Fig. 6-2e). Therefore, cDC1’s are also required
for optimal therapeutic effect but not to the same extent as endogenous host lymphocytes.
Finally, we sought to confirm the anti-tumor effect by direct in vivo imaging. For this, a
cohort of control and treated mice underwent serial MRI imaging on a weekly basis following
MISTIC T cell therapy. All of the control mice eventually developed aggressive and infiltrative
tumors clearly visible on T1-weighted MRI (Fig. 6-3). However, most of the treated mice either
did not develop a detectable tumor or demonstrated significantly delayed tumor formation.
6.2.3 Distribution and maintenance of MISTIC T cells
Immune cell infiltration into brain tumors is often considered restricted by the blood-brain
barrier. Additionally, several studies have hinted at T cell sequestration in the bone marrow as a
means for preventing intratumoral T cell infiltration185,302. Thus, we sought to characterize the
distribution of MISTIC T cells following their infusion into tumor-bearing mice. To do so, mice
were harvested three days following MISTIC T cell therapy (10 days post-tumor implantation),
and the localization of MISTIC T cells was assessed via flow cytometry. Just three days following
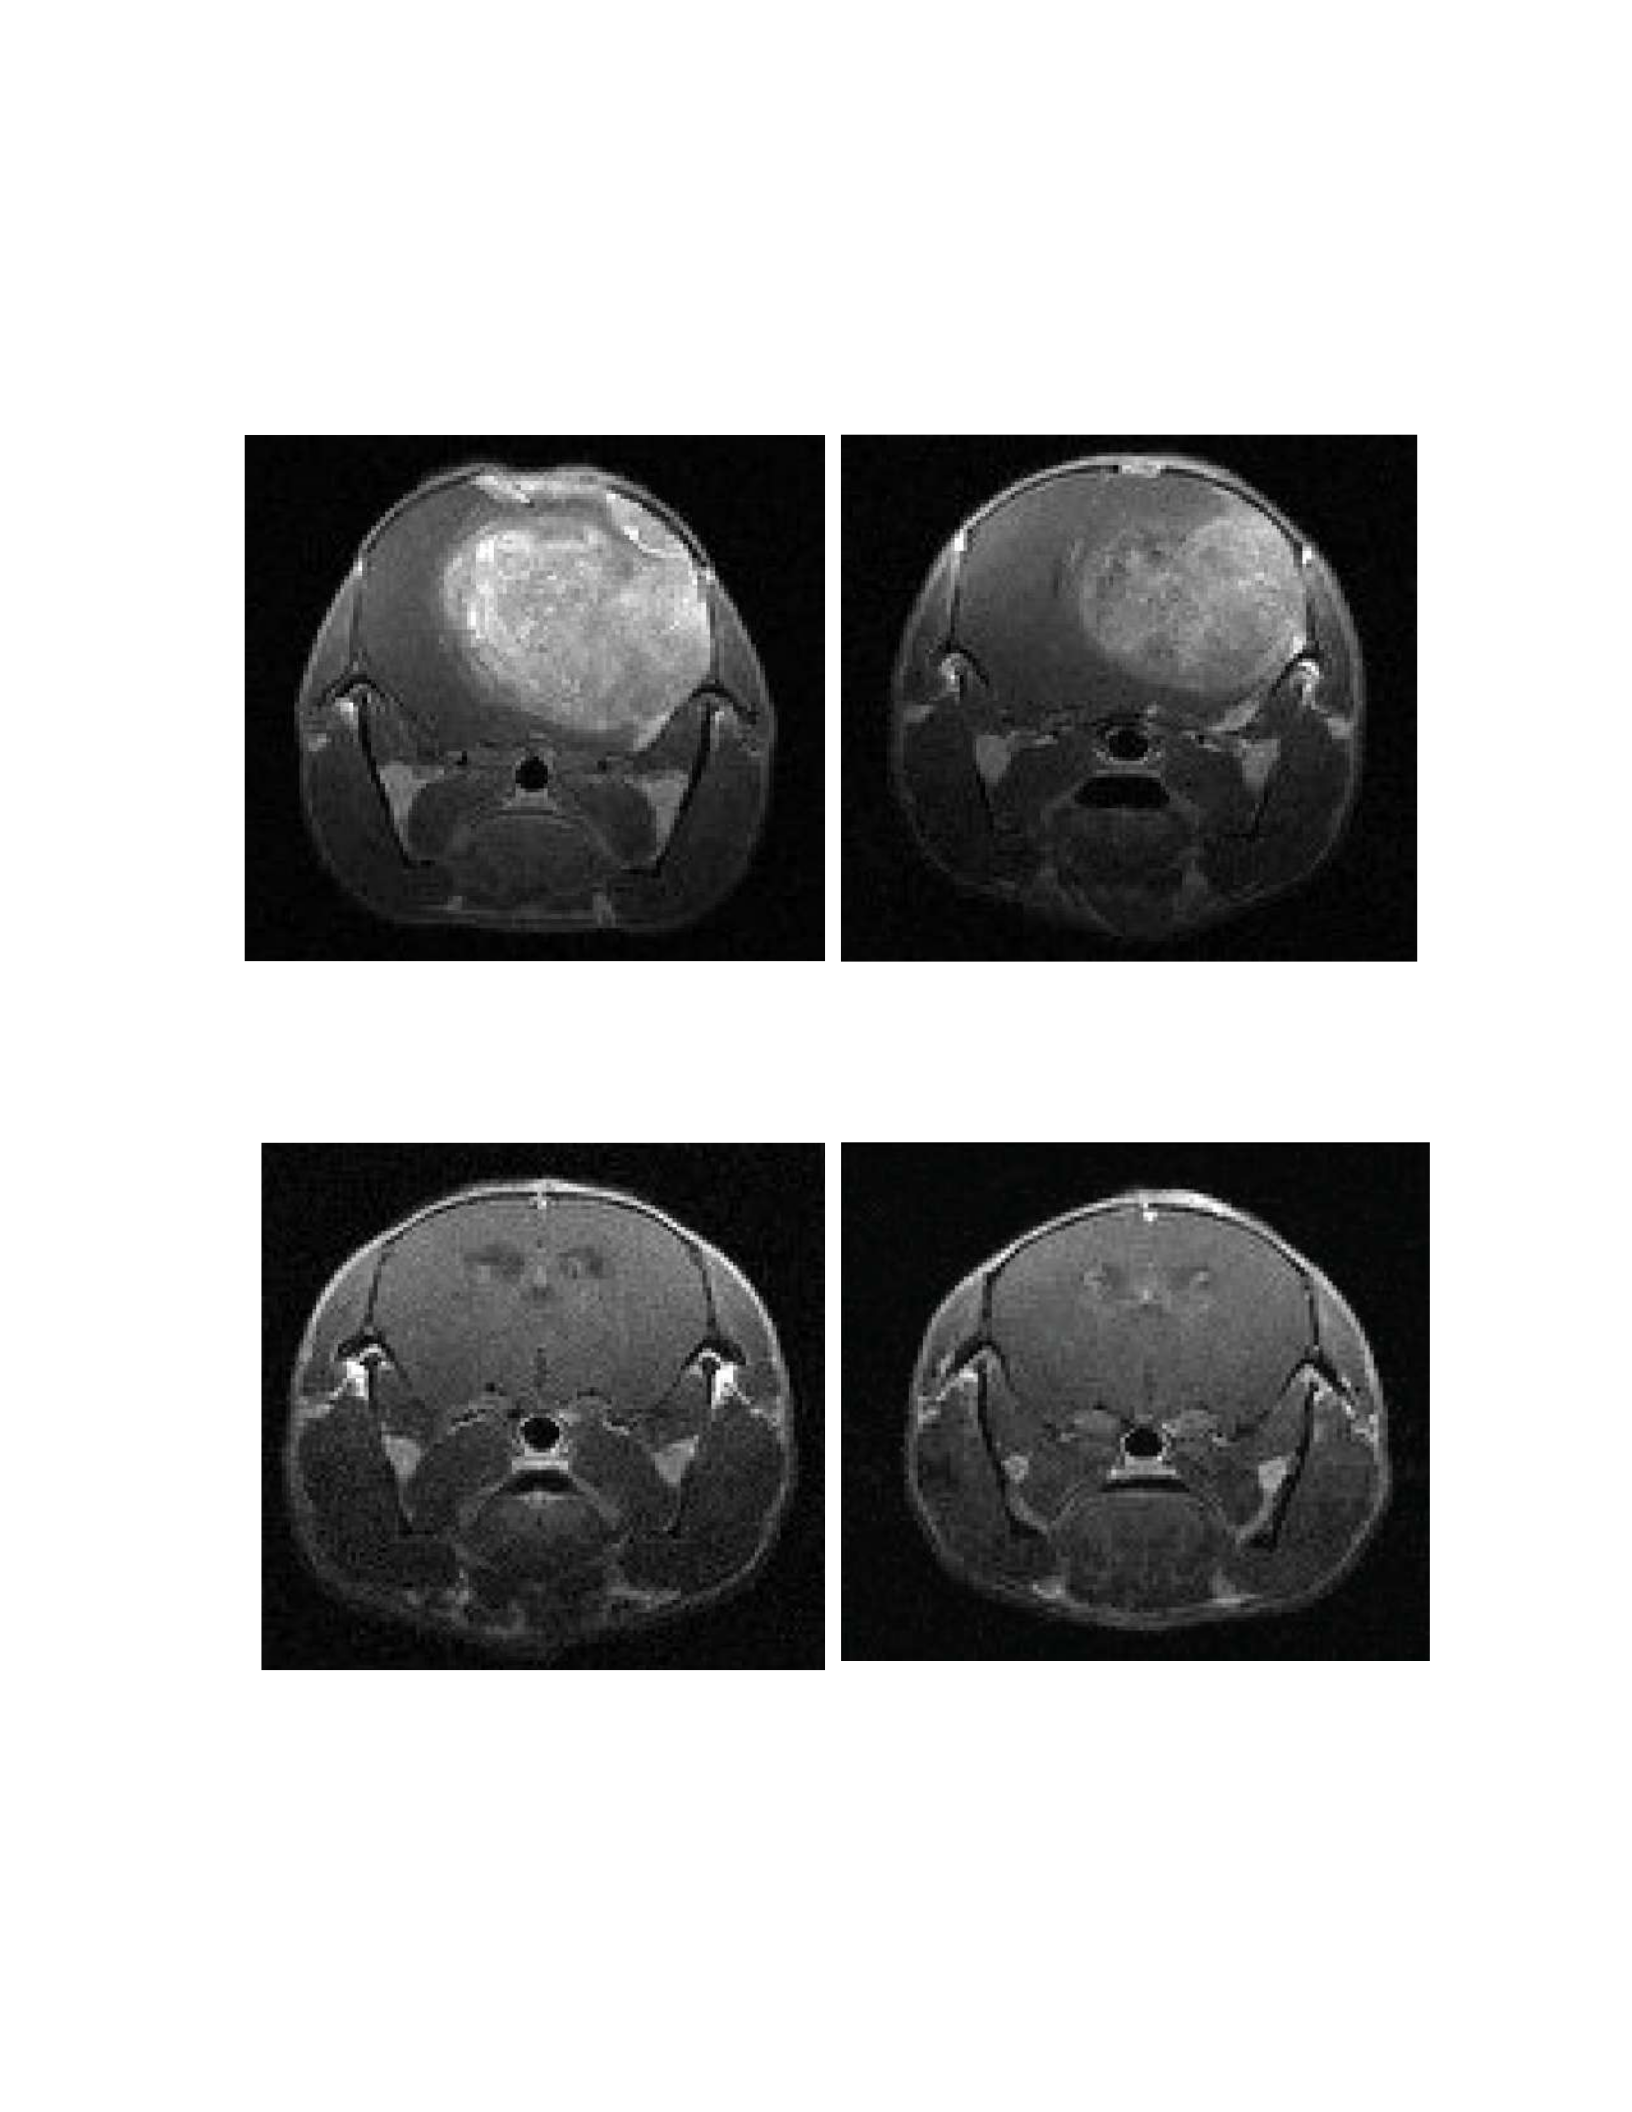
107
Figure 6-3: MRI profiling of treated mice. T1-weighted MRI images of GL261-bearing mice treated on day 7
with MISTIC T cell therapy. Each panel represents an individual mouse on day 21 post-tumor implantation and
is representative of the cohort overall.
D21 Control
D21 MISTIC Treated

108
cell therapy infusion, a significant fraction of CD8 T cells in the tumors were the adoptively
transferred MISTIC T cells (Fig. 6-4a). In contrast to the cells in other tissue sites, the intratumoral
MISTIC T cells had already significantly upregulated expression of PD-1 (Fig. 6-4a). The MISTIC
T cells also comprised a very high fraction of CD8 T cells in the bone marrow, spleens, and
peripheral blood of treated mice (Fig. 6-4b). Furthermore, they were present in both tumor-
draining and non-draining lymph nodes at comparable frequencies (Fig. 6-4b).
This significant intratumoral MISTIC T cell infiltration resulted in profound changes to the
immunological microenvironment of these tumors. In agreement with our prior studies, a majority
of control mice contained CD4-predominant TIL (Fig. 6-4c). However, treatment with the MISTIC
T cell infusion resulted in a significant skewing of the tumor microenvironment towards being
CD8-predominant (Fig. 6-4c). Additionally, this treatment resulted in the formation of long-lasting
MISTIC T cell populations. On day 50 post-tumor implantation, more than 6 weeks after T cell
infusion, virtually all of the treated mice retained significant levels of circulating MISTIC T cells.
In contrast to the predominance of effector cells within the tumor microenvironment, these cells
appeared to be a circulating central memory population (Fig. 6-4d).
6.2.4 Limitations of MISTIC T cell therapy
Despite the considerable treatment benefit from MISTIC T cell therapy in GL261-bearing
mice, it is noteworthy that a select group of mice will still succumb to disease from tumors
escaping immune control. We sought to comprehensively profile these tumors for the purpose of
identifying crucial immune evasion mechanisms. When the mice succumbed to disease, we
analyzed the immune infiltrate into these escape tumors by flow cytometry. Strikingly, the CD8 T
cell infiltrate within these tumors was comprised almost entirely of MISTIC T cells (Fig. 6-5a).
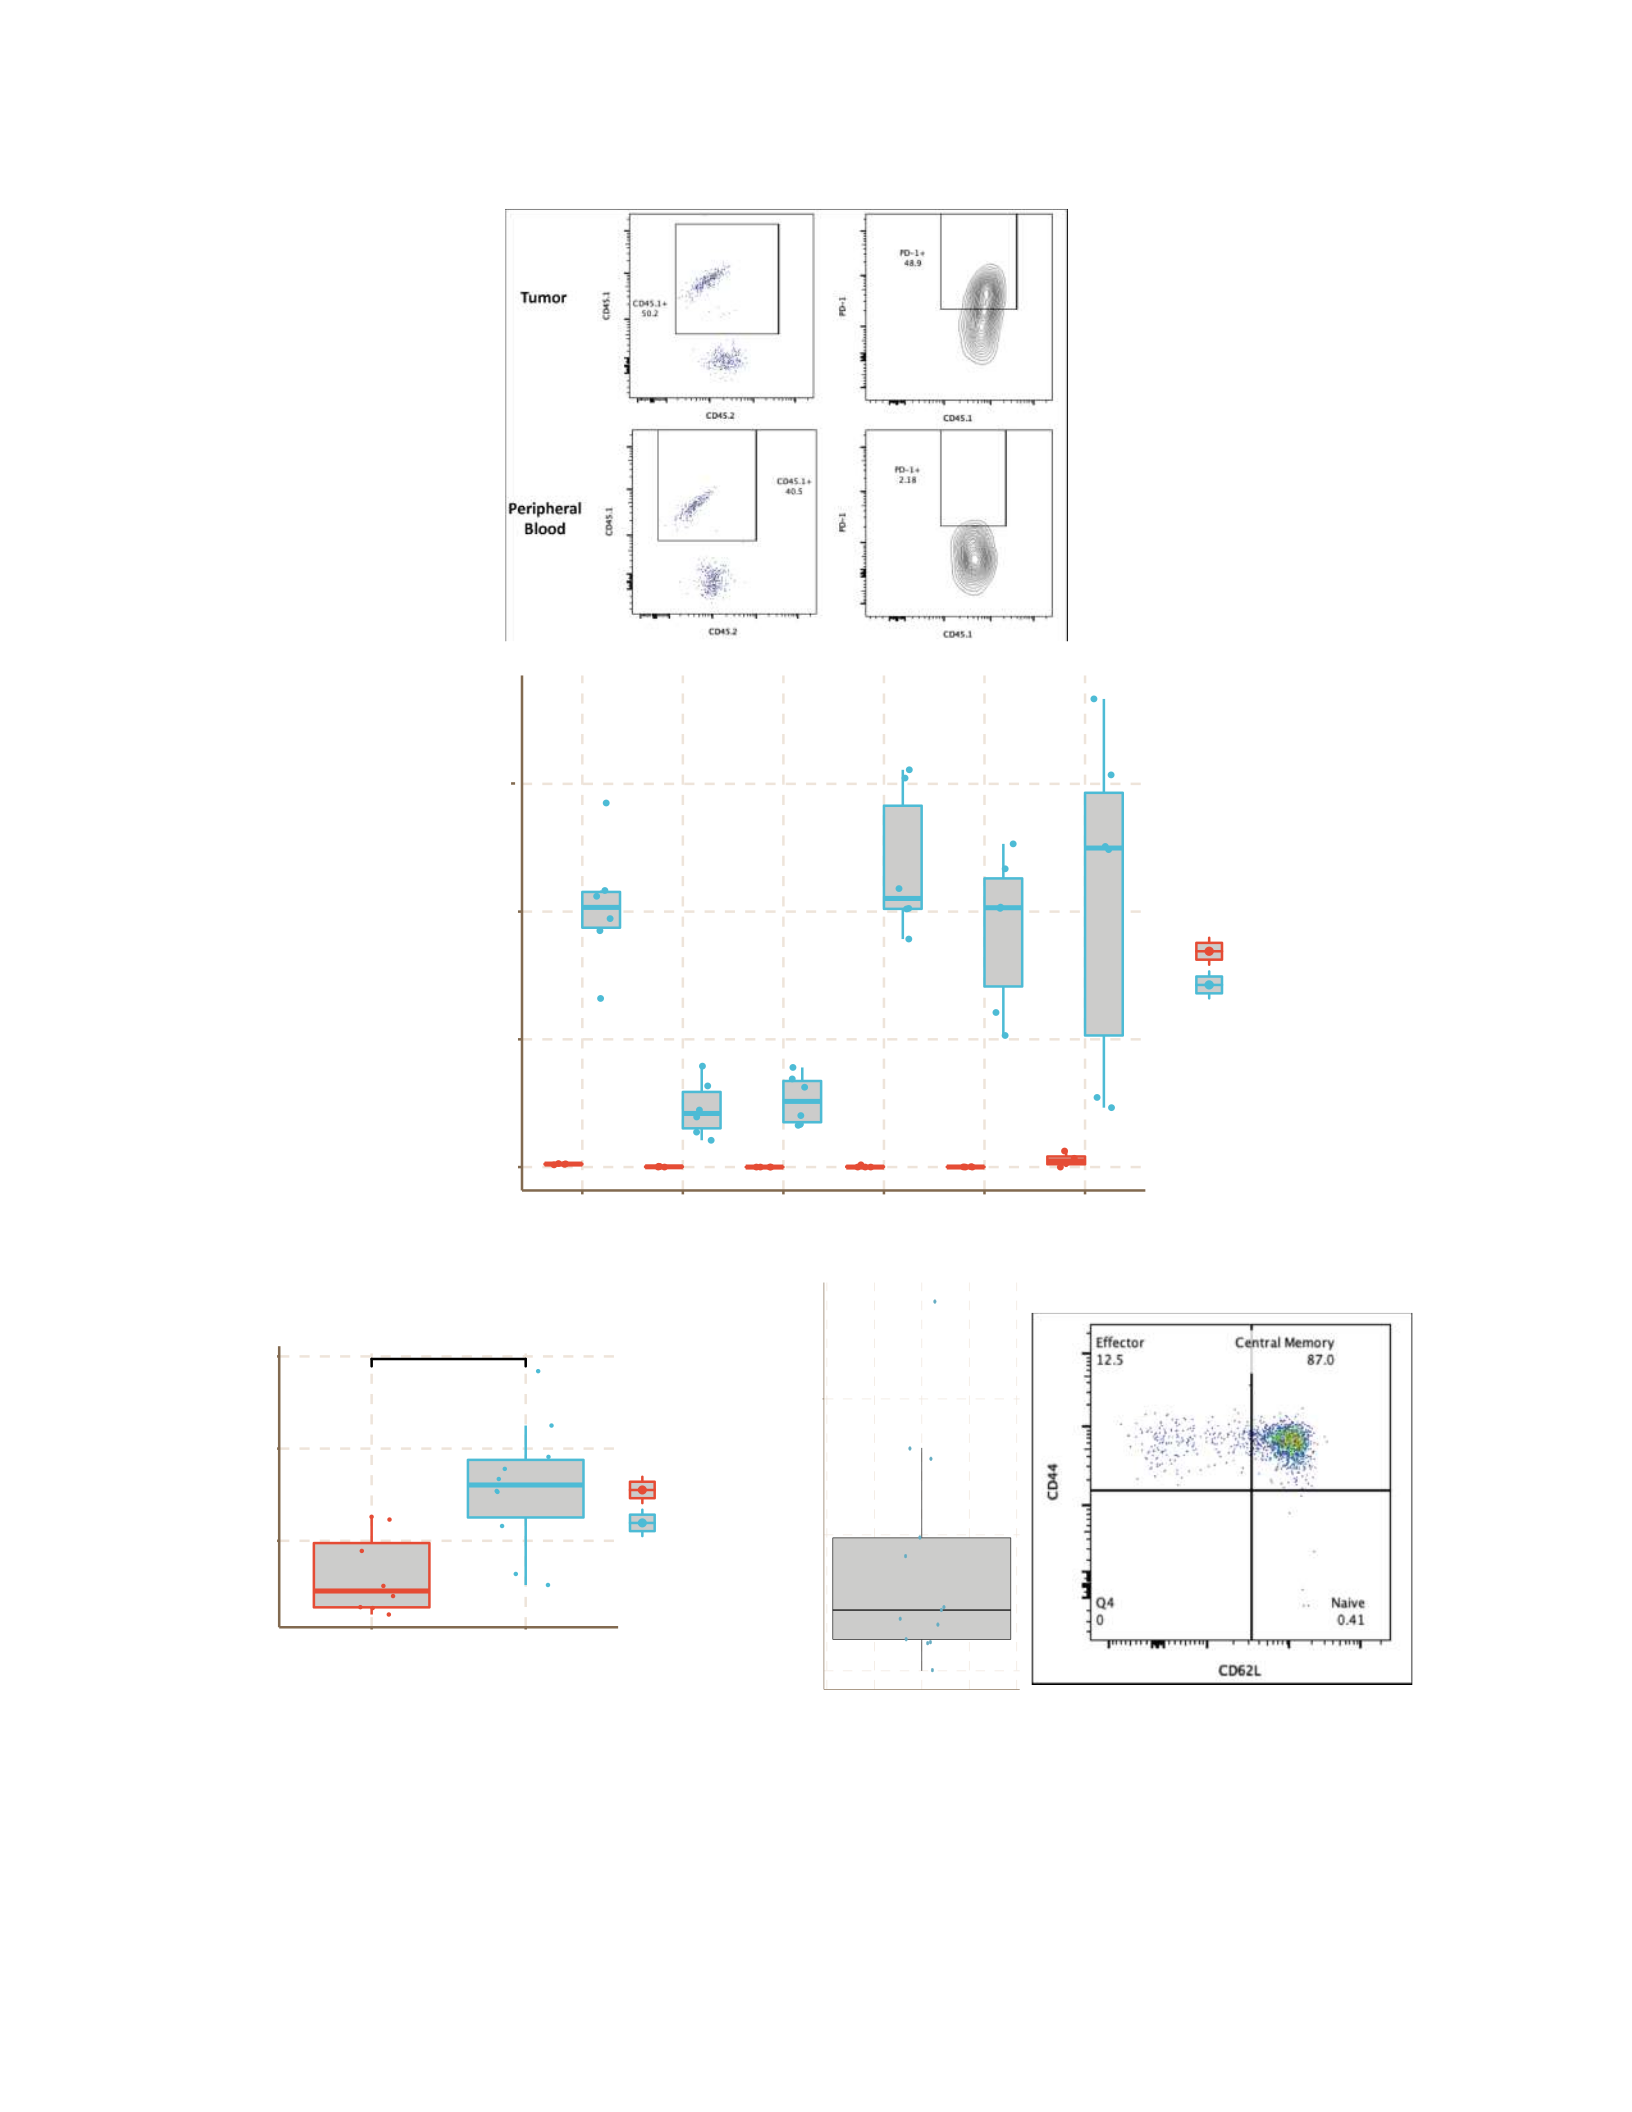
109
a
c d
Figure 6-4: Distribution and maintenance of MISTIC T cells. a, Representative flow cytometry plots of the
infiltration of MISTIC T cells into the tumor and their prevalence in peripheral blood in treated mice three days
post-transfer. The two plots on the left are gated on CD8 T cells, while the two plots on the right are gated on
MISTIC T cells. b, Distribution of MISTIC T cells across various tissues in treated mice three days post-transfer.
c, Impact of MISTIC T cell therapy on the CD8/CD4 ratio in treated mice. d, Frequency and phenotype of
MISTIC T cells in the peripheral blood of treated mice 50 days post-tumor implantation.
b
0
20
40
60
BM cLN iLN PBMC SPL TIL
%CD45.1+ of CD8 T cells
Condition
Control
Treated
**
1
2
3
Co ntrol Treated
CD8/CD4 Ratio
Condition
Control
Treated
b
0
10
20
%CD45.1+ of CD8 T cel ls
D50 Treated PBMC

110
All of these cells had appeared to adopt an exhausted phenotype characterized by significant
upregulation of PD-1 (Fig. 6-5a). We have also performed scRNA-sequencing on the immune
infiltrate from a cohort of treated escape tumors with analysis currently in progress.
We then wanted to profile these escape tumors by whole-exome and RNA-sequencing to
identify potential escape mechanisms at play in the face of this significant tumor-specific T cell
infiltration. In comparing the expression profile from treated escape tumors to untreated control
tumors, we identified significantly higher levels of Cd3d, Cd8a, and Trbv12-1, the specific Vb
within the 3x.1.1C TCR (Fig. 6-5b). Furthermore, we detected higher levels of the chemokine Xcl1
involved in the recruitment of cDC1s (Fig. 6-5b). However, we could not pinpoint any differences
in the expression of components of antigen presentation or the Imp3 gene, suggesting antigen or
class I downregulation did not occur. Altogether, the expression data is consistent with our
observations from flow cytometry but does not offer any novel insight into potential mechanisms
of immune evasion at play. We are actively awaiting the results of the whole-exome sequencing
to determine whether the escape tumors retained the mImp3 antigen.
With extensive work from our own and other labs characterizing the extensive intratumoral
heterogeneity of GBM, it is likely that many neoantigen targets would be subclonal. However, a
vast majority of preclinical systems do not incorporate antigen heterogeneity. To address this, the
Genome Engineering and iPSC Center generated a CRISPR clone of GL261, hereafter referred to
as GL261:E8, in which the Imp3D81N mutation was reverted to wild-type. GL261:E8 grew at a
similar rate to GL261 in vitro and resulted in the death of tumor-bearing mice with a nearly
identical time-course in vivo (Fig. 6-6a). Furthermore, the capacity of MISTIC T cells to induce
tumor cell lysis as measured by 7-AAD staining was substantially diminished against GL261:E8
tumor targets (Fig. 6-6b).
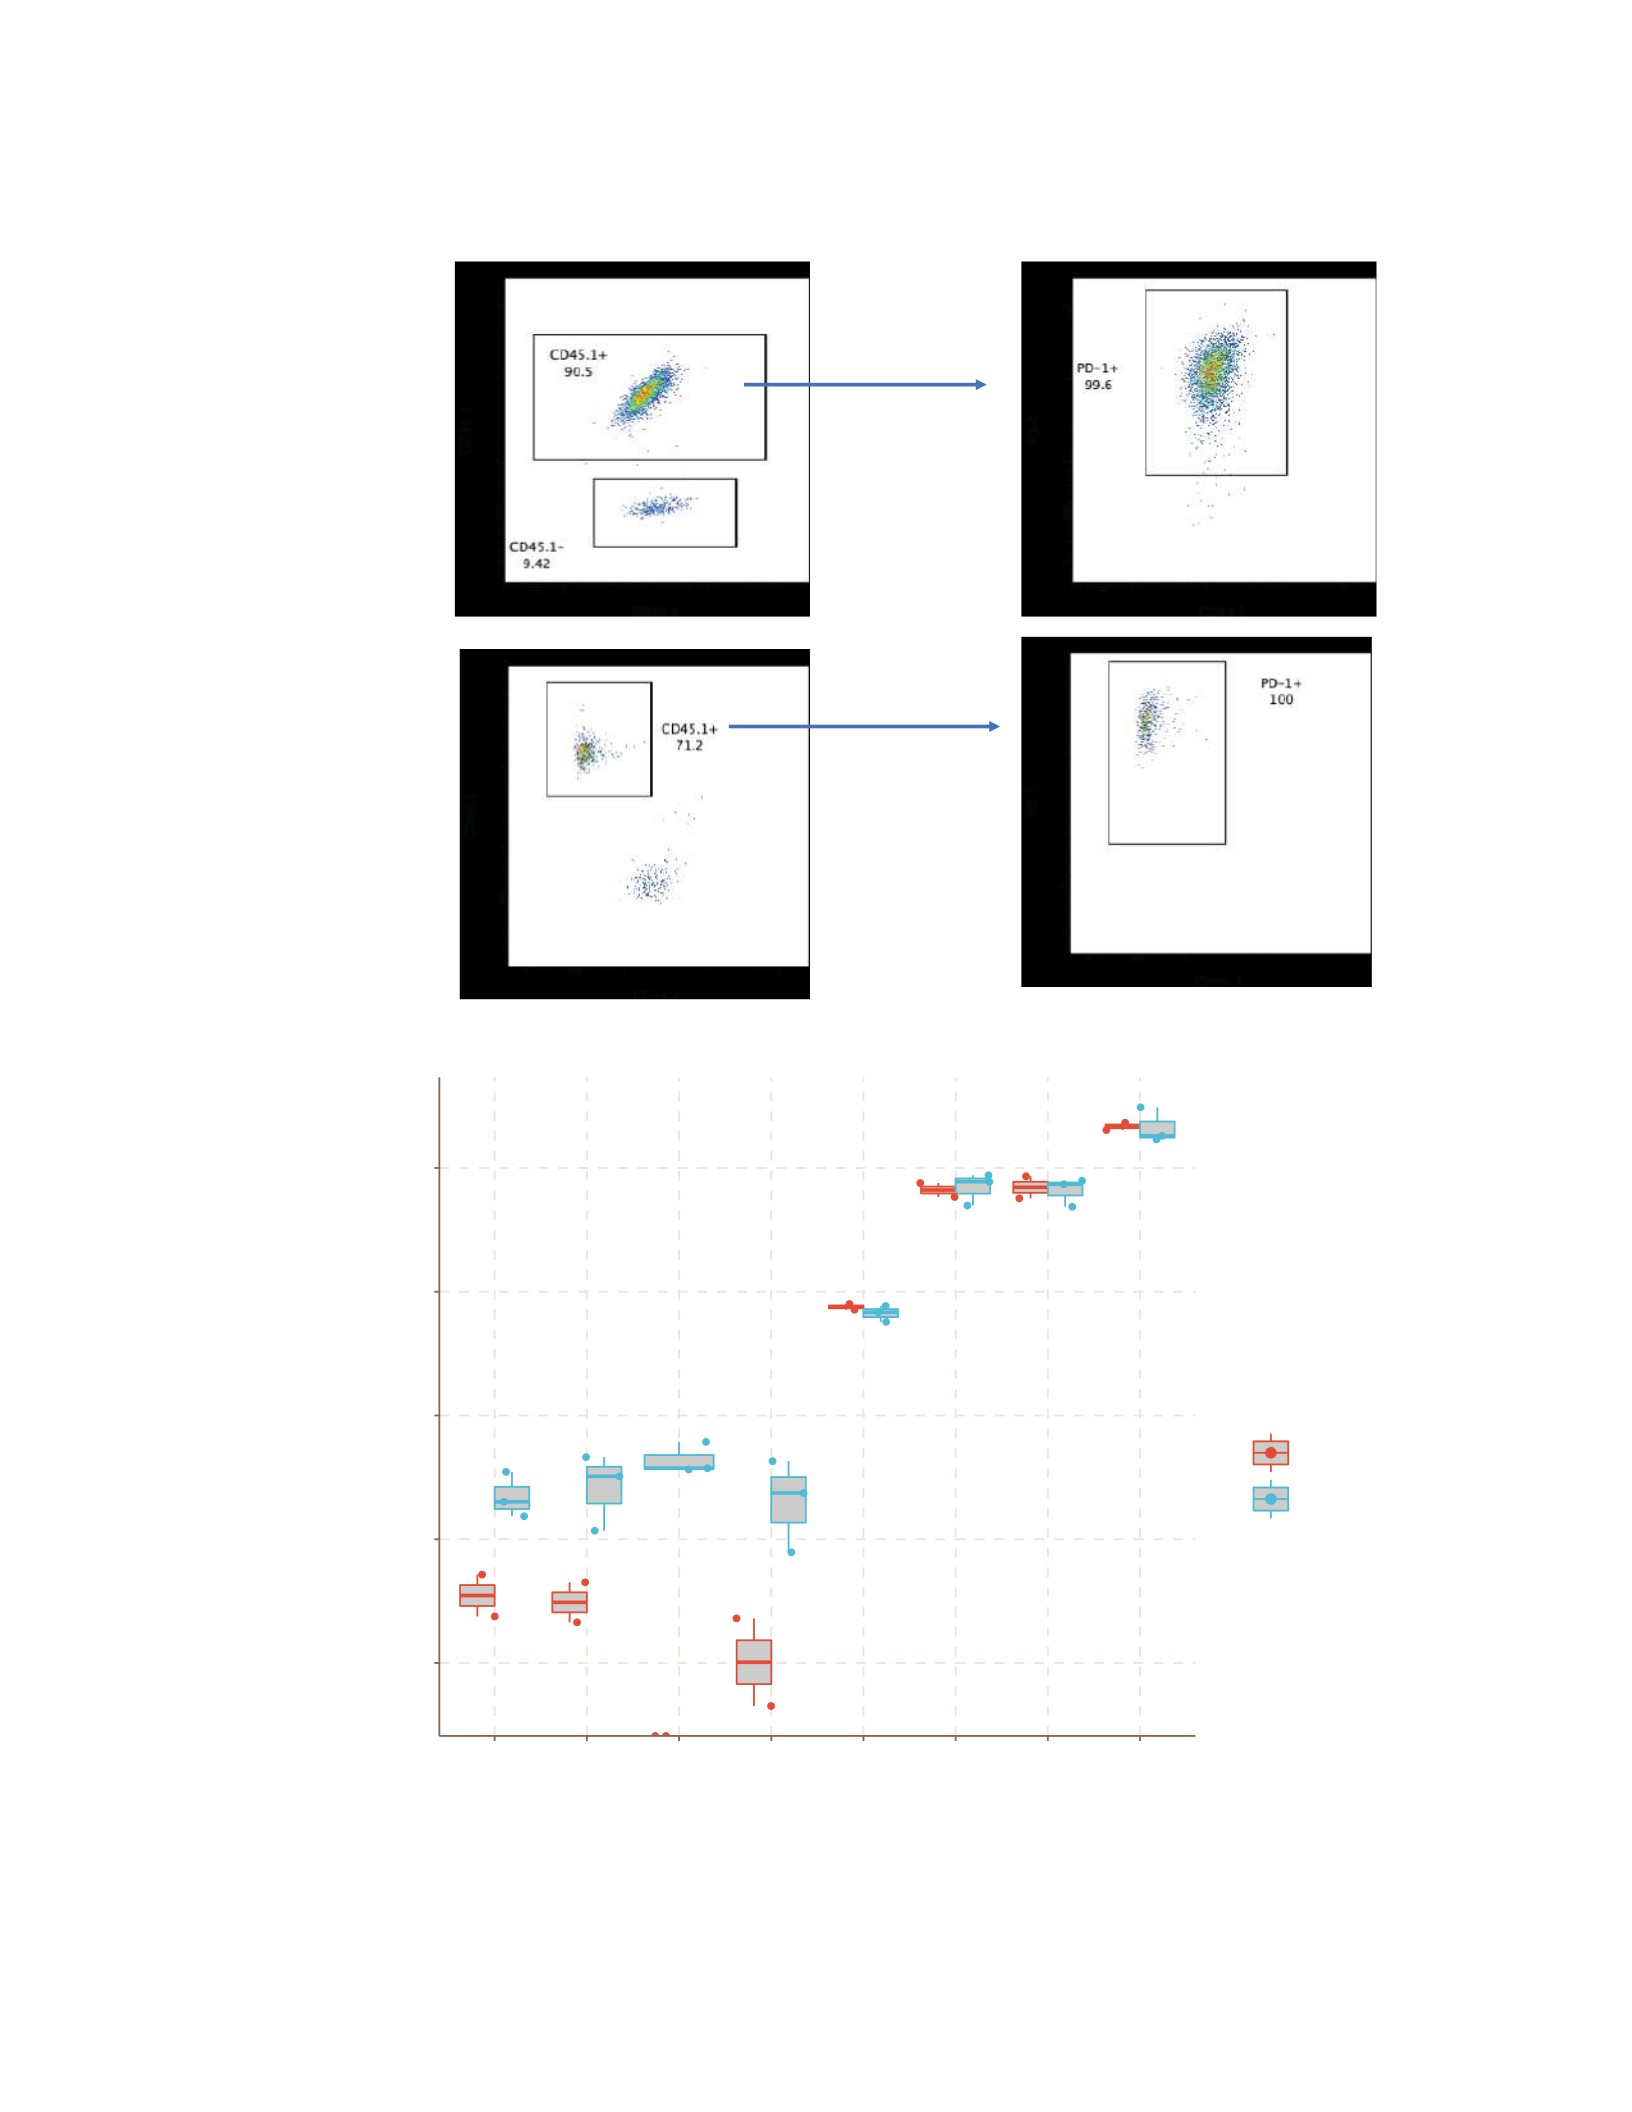
111
b
Figure 6-5: Escape tumor profiling. a, Flow cytometry characterization of the TIL in treated escape tumors.
The left-sided plots are gated on CD8 T cells. b, Expression values (in FPKM) for a subset of chosen genes
between control and treated escape tumors.
a
D54 Escape
Tumor
D69 Escape
Tumor
0. 1
1
10
10 0
10 00
Cd3d Cd8a Trbv12−1 Xcl1 Imp3 H2−D1 H2−K1 B2m
FPKM
Condition
Control
Treated
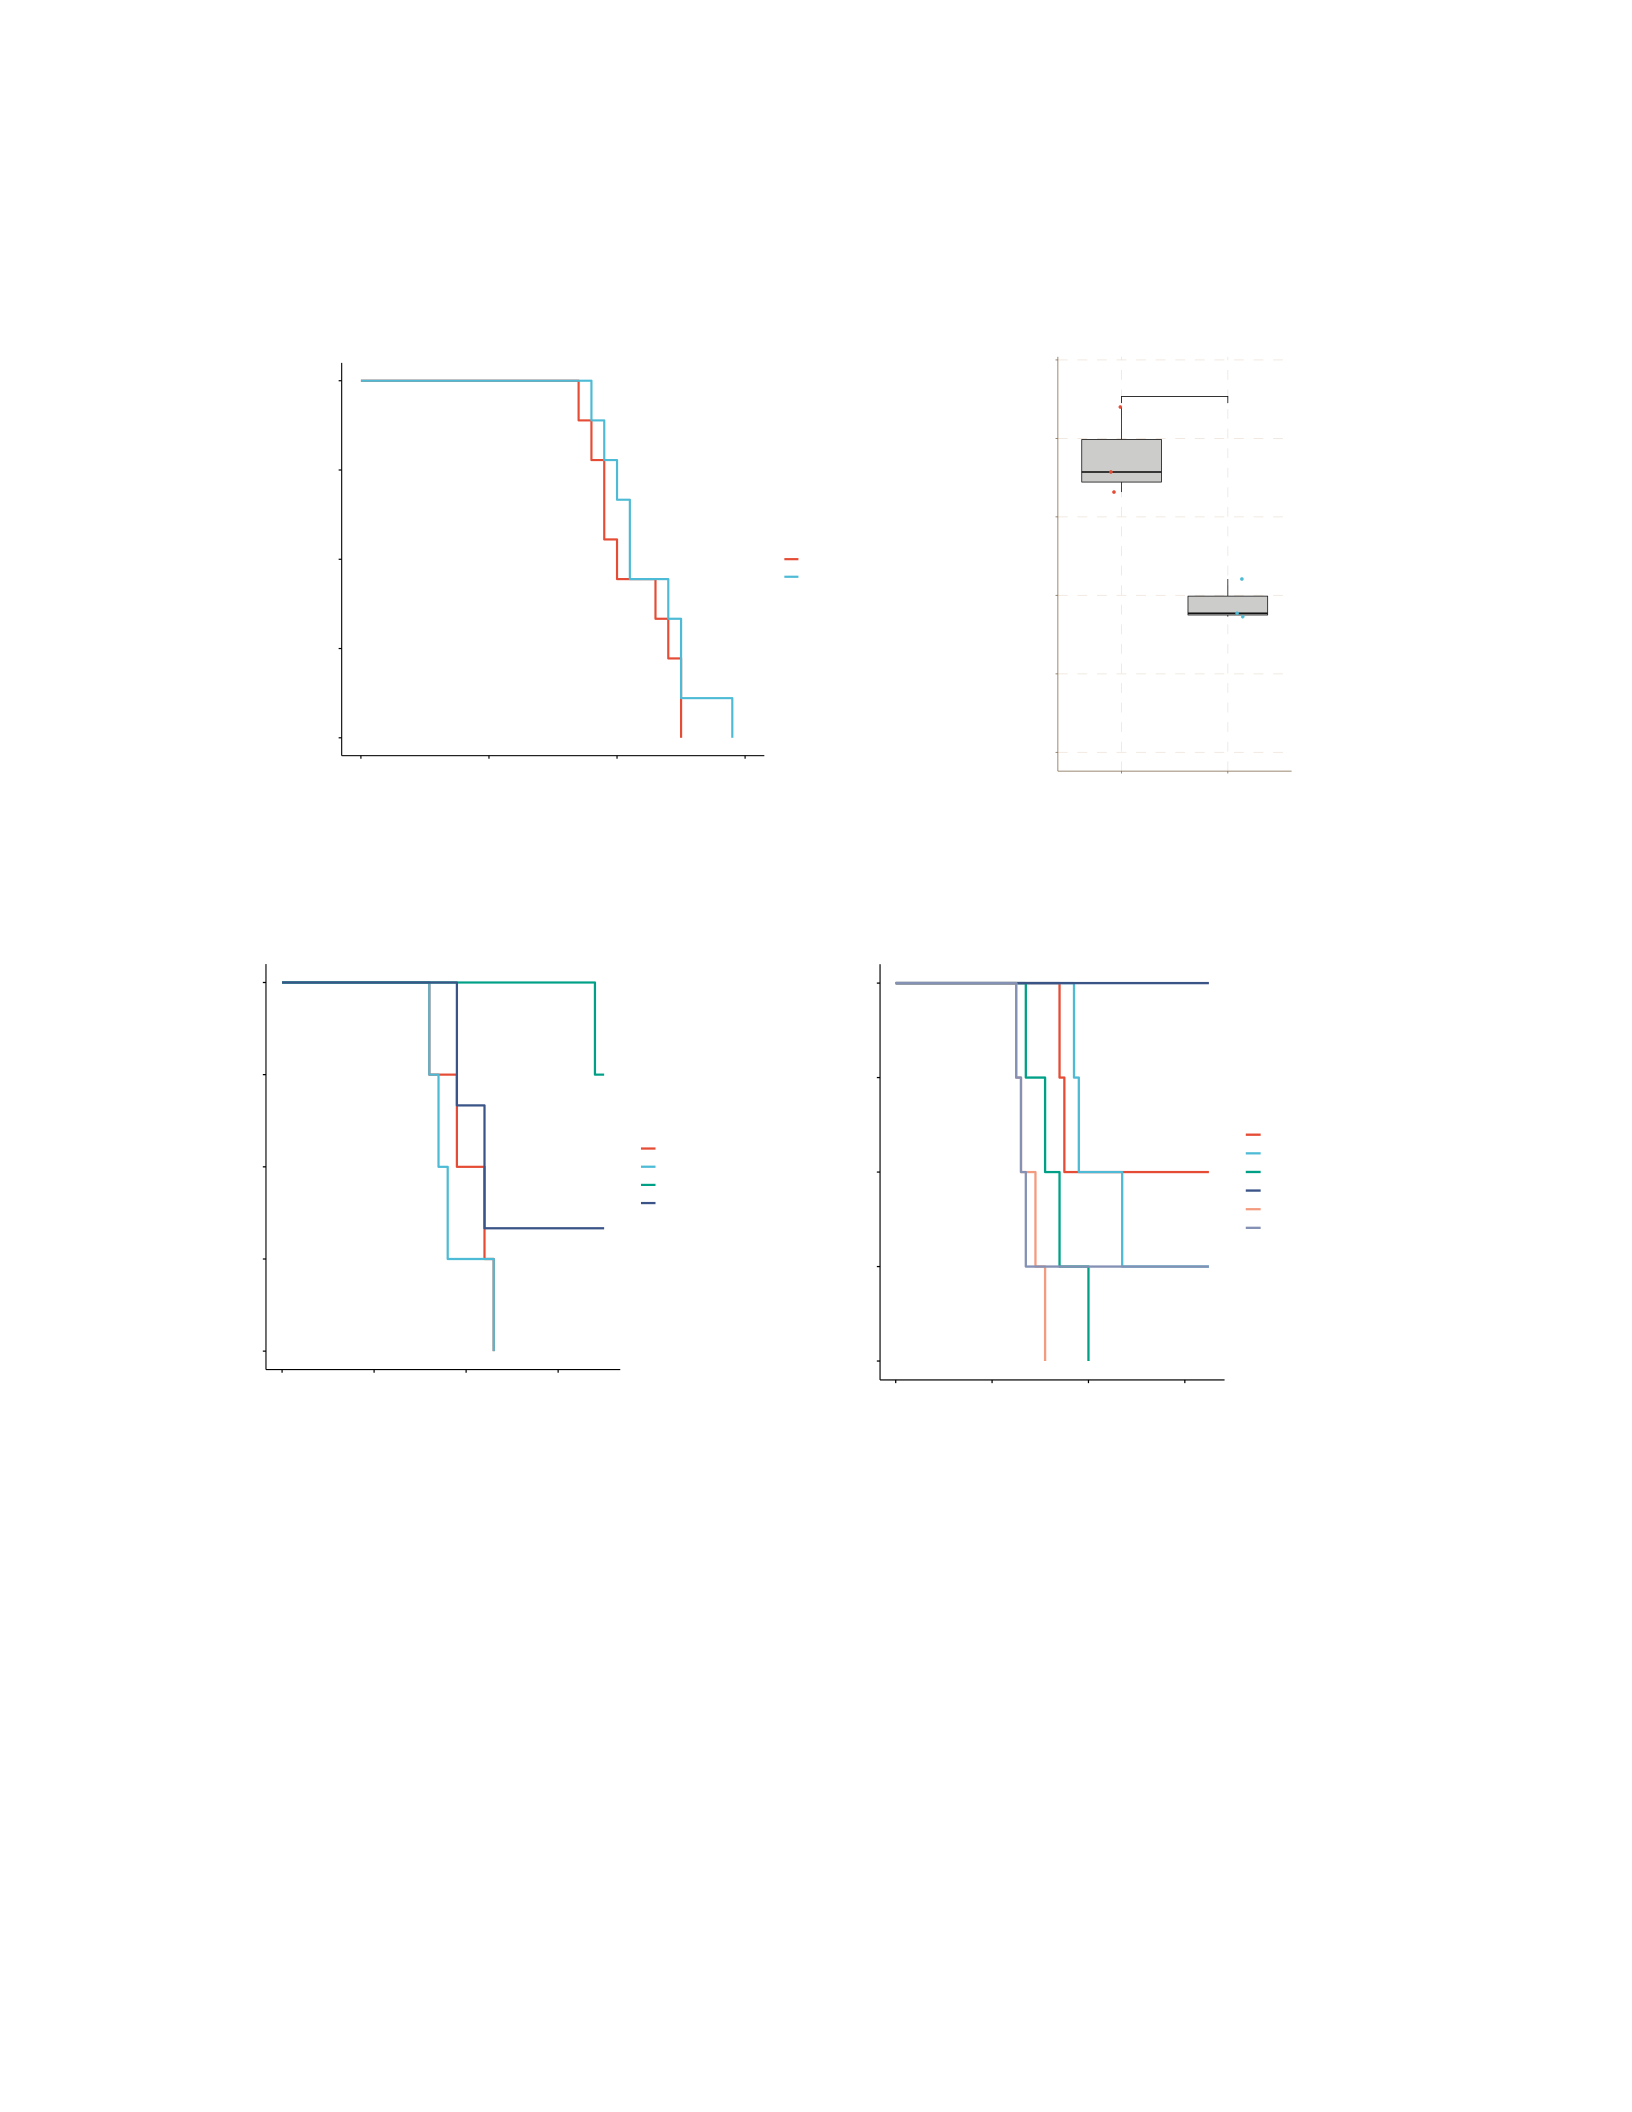
112
a b
c
d
Figure 6-6: MISTIC T cell treatment in heterogeneous system. a, Survival curves for naive mice implanted
with either GL261 or GL261:E8. b, MISTIC T cell cytotoxicity against tumor targets measured by 7-AAD+
following overnight co-culture. c, Survival curves for naive mice implanted with either GL261 or GL261:E8 and
mice previously cured of GL261 with MISTIC T cell therapy implanted with either GL261 or GL261:E8.
d, Survival curves for mice implanted with either GL261, GL261:E8, or a 50/50 mixture of the two cell types
treated on day 7 with MISTIC T cell therapy. The curves in panel (a) represent two separate biological replicates
while the curves in (c) and (d) have been once with additional replicates in progress.
p = 0 .3 7
0.00
0.25
0.50
0.75
1.00
010 20 30
Days
Survival Probability
Treatm ent
GL261
GL261:E8
+
+
+
+
0.00
0.25
0.50
0.75
1.00
020 40 60
Days
Survival Probability
Treatm ent
+
+
+
+
+
+
50/50−−Cont rol
50/50−−M ISTIC Treated
GL261−−Cont rol
GL261−−MISTIC Treated
GL261:E8−−Cont rol
GL261:E8−−MIS TIC Treated
*
0.0
2.5
5.0
7.5
10 .0
12 .5
GL261 GL261:E8
% 7−AAD+
+
+
0.00
0.25
0.50
0.75
1.00
010 20 30
Days
Survival Probability
Treatment
+
+
+
+
Naive−−GL261
Naive−−GL261:E8
Rechall en ge−−GL261
Rechall en ge−−GL261:E8
d

113
To assess the generation of long-lasting immunological memory and the protection against
antigen escape variants, mice previously cured of GL261 with MISTIC T cell therapy were
rechallenged in the contralateral hemisphere with either GL261 or GL261:E8. As expected, these
mice were predominantly protected against GL261 rechallenge. However, a majority of mice
previously cured of GL261 by MISTIC T cell therapy were unable to survive rechallenge with
GL261:E8 (Fig. 6-6c). Finally, we sought to determine whether the MISTIC T cell therapy could
prove effective in a primary challenge against a heterogeneous tumor. To model this, mice were
injected with either GL261, GL261:E8, or a 50/50 mixture of the two cell lines. Strikingly, the
mice implanted with either GL261:E8 or the 50/50 cell mixture received no survival benefit from
the MISTIC T cell therapy (Fig. 6-6d).
6.3 Discussion, Future Directions and Conclusions
Tumors such as GBM that lack significant baseline intratumoral T cell infiltration represent
potentially ideal targets for adoptive cellular therapy. The rapid development of genomic
technologies that facilitate neoantigen identification has led to a focus on the development of
neoantigen-directed cellular therapy, with the ultimate hope that this approach will mediate
significant anti-tumor effects without the toxicity of targeting shared antigens. In this chapter, we
presented a preclinical system for investigations of neoantigen-specific cellular therapy in brain
tumors using the MISTIC mouse we generated together with the murine glioma model GL261.
Adoptive cell therapy with MISTIC T cells exhibited both significant tumor control under certain
conditions but also highlighted the challenges of successful glioma immunotherapy. We believe
that this system presents an invaluable platform to investigate both mechanistic and translational
questions in brain tumor immunology.

114
The adoptive transfer of a huge number of activated tumor-specific CD8 T cells should
theoretically have the capacity to lyse and eliminate tumors without engaging the host immune
system, as the initial steps of the cancer immunity cycle have been completely bypassed. However,
our studies in the RAG2-/- and Delta32 systems suggest that the endogenous host immune system,
specifically the lymphocyte compartment, is necessary for optimal treatment effect. A potential
reason for the lack of treatment benefit in RAG2-/- mice is the complete absence of anti-tumor CD4
T cells, which have been shown to be necessary for the optimal function of anti-tumor CD8 T cells
in numerous studies251–254. The residual treatment benefit seen in the Delta32 mice may then be
mediated by the low but non-zero levels of non-cDC1-dependent CD4 T cell activation observed
in other work304. Regardless, a deeper analysis of the interactions between the adoptively
transferred MISTIC T cells and the endogenous immune system should identify areas for further
investigation and potential therapeutic targets.
While successful MISTIC T cell therapy displays the potential for the targeting of
neoantigens in brain tumors, several studies utilizing CAR T cells have demonstrated some of the
major challenges facing adoptive cell therapy in the treatment of GBM. Thus, we consider the
study of mechanisms of immune evasion and tumor escape with this system to be an equally
important aspect. To that end, the generation and subsequent experiments with the GL261:E8
subclone are crucial. One of the major hopes for successful immunotherapy is the development of
epitope spreading, whereby targeting of a specific antigen leads to the generation of immune
responses against previously unrecognized antigens. Generally, this is thought to be mediated by
significant tumor cell lysis leading to antigen release and subsequent initiation of the cancer
immunity cycle. Our results suggest that the MISTIC T cell therapy does not generate a significant
degree of epitope spreading, as evidenced by the lack of immunity to GL261:E8 in previously

115
cured mice and the lack of efficacy in treating tumors comprised of a 50/50 mixture of GL261 and
GL261:E8. This has major implications for the treatment of GBM and other heterogeneous solid
tumors, suggesting that a potent tumor-specific therapy will not necessarily mediate widespread
anti-tumor immunity against new targets. On one hand, this points to the need for the targeting of
clonal neoantigens within tumors. However, the number of clonal neoantigen targets is incredibly
low in heterogeneous tumors such as GBM. Therefore, the process through which an antigenically
diverse anti-tumor immune response can be generated must be a significant focus going forward.
Otherwise, most targeted T cell therapies within GBM and other solid tumors will inevitably fall
victim to the outgrowth of an antigen-negative subclone.

116
CHAPTER SEVEN
Discussion, Future Directions, and Conclusions
The concept that the immune system can be leveraged to eliminate and prevent cancer
circulated on the fringes of both cancer biology and immunology for more than a century.
However, largely driven by a deeper understanding of the fundamentals of T cell biology, cancer
immunology has experienced a rebirth over the last several decades. In many respects,
immunotherapy is now viewed as a fundamental pillar of cancer therapy on par with more
conventional approaches such as radiation and chemotherapy. While cancer immunotherapy has
been transformative in certain cancers, many tumors such as GBM have seen no benefit.
It is noteworthy that the conventional FDA-approved immunotherapies, CAR T cells and
ICB therapy, do not have any tumor-specific component to them. ICB therapy appears to enhance
endogenous anti-tumor immune responses but relies on the prior generation and expansion of these
responses by the host. CAR T cells, on the other hand, utilize the targeting of a cell surface
molecule (CD19) expressed by both B cell malignancies and host B cells and can only be tolerated
because the loss of endogenous B cells is a clinically manageable toxicity. At the same time, an
explosion of genomic technologies has paralleled the advances in cancer immunotherapy and has
resulted in the development of a field of cancer immunogenomics. Broadly, cancer
immunogenomics seeks to utilize both tumor genomic analyses and cancer immunology to identify
and target tumor-specific neoantigens. Owing to their restricted expression pattern and a lack of
central tolerance against them, neoantigens have long been considered ideal therapeutic targets.
However, challenges in neoantigen identification have long hindered attempts at targeting them
clinically. Widespread adoption of next generation sequencing technologies, computational

117
prediction algorithms, and the development of single-cell RNA sequencing have provided
substantial new insight into tumor-immune interactions in a variety of tumor types and present a
path forward for the targeting of tumor-specific neoantigens. This work seeks to further our
understanding of the immunogenomic state of human malignant brain tumors with an emphasis
on neoantigen identification and establish a preclinical system for targeting these brain tumor
neoantigens through adoptive cellular therapy.
Despite extensive genomic profiling, comparatively less is known about the
immunological microenvironment of GBM. Recent studies have focused primarily upon tumor
infiltrating myeloid cells, which make up a significant fraction of the bulk tumor mass but devoted
less attention to the lymphoid compartment. Furthermore, nothing is known about the antigens
recognized by endogenous tumor infiltrating T cells in malignant brain tumors. To that end, we
recruited a cohort of 30 patients with primary or secondary malignant brain tumors to
comprehensively profile their immunological microenvironment and identify tumor-specific
antigens recognized by infiltrating T cells. Our multi-sector analysis revealed substantial spatial
differences in the genomic characteristics of these tumors, supporting the need for multi-sector
analysis in the design of small molecule or neoantigen-directed trials against gliomas. In contrast,
single-site analysis provided a fairly accurate picture of the immunogenomic state of secondary
metastatic brain tumors.
While we uncovered considerable spatial differences between primary gliomas and
secondary brain metastases, we also observed significant clonotype loss in our expanded TIL
cultures from both tumor types. This forced us to reconfigure our approach to neoantigen
identification and generate a TCR-based screening system for antigen identification utilizing TCRs
isolated from our scRNA-seq data. While our system offers flexibility with regards to patients and

118
TCRs, it is limited by its dependence on peptides and is not particularly high-throughput.
Therefore, while it can be utilized for screens against candidate neoantigen peptides, the
development of a more unbiased and high-throughput system should be of utmost importance.
Whether such an approach utilizes tumor cell lines and cDNA screens or fully artificial systems
such as yeast display will require extensive further study. However, the presence of tumor-specific
neoantigens recognized by the endogenous host immune response remains a fundamental question
in anti-glioma immunity. The ultimate goal should be the comprehensive characterization of the
antigen specificity of tumor infiltrating lymphocytes within GBM including neoantigens, viral
antigens, or overexpressed self antigens.
Ultimately, the direct generation of neoantigen-specific responses in patients will arise
from either neoantigen vaccination or cellular therapy. While neoantigen vaccines are more easily
implementable, they have thus far generated relatively low numbers of cells and primarily
produced CD4 T cell responses despite targeting predicted CD8 epitopes142,143. Cellular therapy
has historically been based upon the expansion of endogenous TIL from patient tumors, but the
sparse T cell infiltrate in GBM combined with our own challenges in maintaining TIL clonal
architecture suggests this approach will be difficult in GBM. The implementation of CAR T cell
therapy has demonstrated the potential of autologous engineered T cells. Together with the rapid
identification of intratumoral TCRs from scRNA-seq data, the generation of personalized TCR-
engineered T cells has become feasible. However, a fundamental question with this approach is
the choice of TCR. Ideally, systems will exist whereby tumor-specific TCRs can be predicted from
single-cell profiling without necessitating the need for extensive antigen screens.
To that end, our generation of the MISTIC mouse and subsequent MISTIC T cell therapy
represents a preclinical model for this neoantigen-directed cellular therapy and a means to probe

119
these exact questions. While the 3x.1.1C TCR was isolated from an in vitro stimulated population
and was found to be the most functional TCR, it was not the most expanded T cell clone in this
population. This suggests that a myriad of yet unknown factors determines the ideal choice of
therapeutic TCR, even when restricted to the response against a specific neoantigen:MHC
complex. Future work can utilize the targeting of mImp3 in GL261 to focus on this specific
question, characterizing numerous neoantigen-specific TCRs both in vitro and in their ability to
induce anti-tumor immune responses in vivo.
While the MISTIC mouse facilitates numerous studies on adoptive cellular therapy, it also
opens the door for more mechanistic studies on the migration and activation of neoantigen-specific
T cells in brain tumors. Owing to the relative lack of preclinical systems with defined endogenous
neoantigens, most adoptive transfer studies utilize genetically modified tumor systems engineered
to express the targets of pre-existing TCR transgenic mice. By generating our own TCR transgenic,
we have the means to target an endogenous tumor-specific neoantigen. Extensive work from our
own and other labs has demonstrated the pivotal importance of the type I conventional dendritic
cell (cDC1) in mediating anti-tumor CD4 and CD8 T cell responses. However, the exact location
of T cell priming within brain tumors is not clear owing to the lack of conventional lymphatic
structures within the CNS. Through adoptive transfer and high-resolution imaging studies, we
hope to clarify these aspects of CNS immunity. Furthermore, we aim to characterize the role of
the meninges, specifically the dural layers, in modulating T cell responses to intracranial antigens.
Prior studies from our own and other labs have hinted at the localization of immune cells to the
meninges in the setting of CNS immune responses, but the functional impact of this is unknown307.
Additionally, the MISTIC T cell system provides a means to investigate the specific roles of CD4
T cell responses in anti-tumor immunity, specifically in the context of aiding and maintaining

120
functional CD8 T cell responses. Future studies should characterize potential indirect interactions
between transferred MISTIC T cells and the endogenous CD4 T cell compartment including sites
of interaction and impact on MISTIC T cell function. Moving forward, the potential identification
of endogenous class II-restricted neoantigens within our preclinical models would greatly facilitate
this work.
Antigen heterogeneity is undoubtedly one of the most significant challenges facing targeted
immunotherapies. This work comprehensively profiled the immunogenomic landscape of a cohort
of malignant brain tumors, outlining substantial spatial genomic and antigenic heterogeneity
among malignant gliomas. Strikingly, this same heterogeneity was observed in the distribution of
the T cell repertoire, with GBM harboring spatially restricted but expanded clonotypes. While it
is possible that the antigenic heterogeneity produces this intratumoral immune heterogeneity,
further work will be needed to clarify whether this phenomenon is antigen-driven. Regardless, this
well-defined antigenic heterogeneity is often ignored in the context of preclinical models. Even
when tumor antigenic heterogeneity is studied, it normally utilizes drastically overexpressed
highly immunogenic foreign antigens present in a proportion of the tumor cells, which may not
accurately recapitulate the responses to endogenous neoantigens.
To address this, we generated a CRISPR clone of GL261, GL261:E8, to facilitate
preclinical studies on tumor heterogeneity utilizing an endogenous tumor neoantigen. The concept
of epitope spreading, characterized by a broadened immune response to non-targeted antigens
following targeted immunotherapy, is often invoked as a means for the immune system to respond
to polyclonal heterogeneous tumors. We sought to directly address this utilizing our MISTIC T
cell therapy in GL261 and GL261:E8. Strikingly, the survival benefit appears to be lost upon
treatment of a heterogeneous tumor consisting of an equal mixture of GL261 and GL261:E8,

121
presumably due to the eventual outgrowth of antigen-negative GL261:E8. More surprisingly, mice
previously cured of GL261 with MISTIC T cell therapy do not appear to have generated significant
immunity against GL261:E8. This suggests that, despite the thousands of additional predicted
neoantigens present within GL261, tumor regression with MISTIC T cell therapy did not lead to
the generation of protective immunity against additional tumor targets. Given the highly
heterogeneous nature of GBM and other solid tumors, this indicates that strategies to invoke
epitope spreading and the generation of a more diverse immune response must be pursued.
Recently, several major studies have implicated tertiary lymphoid structures, ectopic lymphoid
aggregates that develop in non-lymphoid tissues at sites of chronic inflammation, in the successful
response to immunotherapy308,309. While the mechanisms underlying this are not clear, it is feasible
that these additional lymphoid aggregates facilitate the development of a more robust and diverse
anti-tumor immune response. The combination of MISTIC T cell therapy with GL261/GL261:E8
will allow for further studies on how to best facilitate epitope spreading.
A major byproduct of the success of CAR T cell therapy has been the widespread
acceptance of autologous T cell engineering in the treatment of cancer. One approach to enhance
MISTIC T cell function and potentially induce epitope spreading is further genetic modifications
of these cells prior to infusion. This could be done by the deletion of T cell inhibitory factors or
the incorporation of gene cassettes inducing additional cytokine or chemokine production from the
MISTIC T cells. The feasibility of this approach has already been demonstrated in patients with a
study utilizing autologous T cells with endogenous PD-1 deleted and an NY-ESO-1-specific TCR
introduced via CRISPR224. The possibilities for further T cell engineering utilizing the MISTIC T
cell system are broad.

122
This work has helped characterize the immunogenomic state of malignant brain tumors
utilizing comprehensive sequencing technologies, created systems for the antigen screening of
intratumoral TCRs, and developed a system for targeting tumor neoantigens with adoptive cellular
therapy in a preclinical model of GBM. Ultimately, it has shed insight on the potential for
immunotherapy in GBM but has also highlighted significant challenges both specific to GBM and
in the treatment of solid tumors in general. Our ultimate hope is that further investigation of the
anti-tumor immune response in both primary human samples and preclinical mouse models will
aid the development of novel immunotherapeutic approaches to improve disease outcomes in
patients with GBM.

123
CHAPTER EIGHT
Methods
Patient recruitment. All study participants were neurosurgical patients at Barnes-Jewish Hospital
with pathologically confirmed stage III/IV glioma or metastatic disease. Prior to surgery, we
obtained written informed consent from the patients for a Washington University School of
Medicine Institutional Review Board-approved protocol (#201111001) for the analysis of tumor
tissue and peripheral blood and sharing of genomic data. All procedures and experiments were
performed in accordance with the ethical standards of the 1964 Helsinki declaration.
Clinical sample processing & nucleic acid extraction. Tumor samples were processed
immediately following surgical resection under sterile conditions. Tissue was thoroughly washed
in phosphate-buffered saline to eliminate peripheral blood leukocyte contamination. For tumor
samples that were resected en bloc, spatially distinct sectors were dissected out from the mass via
scalpel. In other cases where multiple discrete regions demonstrated enhancement on MRI, tissue
was separated at the time of surgery and a representative sample from each sector was chosen for
analysis. In all cases, tissue was immediately flash frozen and initially stored at -80oC or in liquid
nitrogen until further use. Peripheral blood was separated through Ficoll-Paque PLUS density
gradient (GE), and the buffy coat was collected and frozen for matched normal genomic DNA.
Total RNA and genomic DNA was extracted from peripheral blood mononuclear cells or
frozen tissue using the Qiagen AllPrep DNA/RNA Kit (catalog #80204) according to the
manufacturer's instructions (Qiagen, Valencia, CA). As melanin is a known inhibitor of enzymatic
reactions and coprecipitates with RNA310, further purification was performed for the melanoma

124
sample as described311, modified with a RNeasy (Qiagen, Valencia, CA) column-based clean-up
to remove the additives used to bind the melanin. For GBM065.Re, regions 3-4 and the sample
from the primary tumor came from FFPE tissue cores. In these cases, total RNA and genomic
DNA was extracted using the Qiagen AllPrep DNA/RNA FFPE Kit (Catalog #80234).
Sequencing and somatic variant detection. All sequencing was performed on the Illumina
NovaSeq (S4) platform. From each patient a normal sample and 2-4 samples from a single tumor
were subjected to whole exome sequencing (WES). 80 of 93 tumor samples had sufficient tissue
to perform RNA sequencing. WES and RNAseq from 20 tumors were performed at the McDonnell
Genome Institute (MGI), and 10 tumors underwent WES and RNAseq at the Institute for Genomic
Medicine at Nationwide Children's Hospital. WES was performed on 2 additional recurrent
GBM065 regions and a GBM065 primary tumor by Novogene. Read alignment, somatic variant
calling, variant filtering, variant effect prediction, additional variant annotation, and RNA
expression estimation was performed using a tumor analysis pipeline defined in the Genome
Modeling System as previously described312. Briefly, all fastq files were aligned to the human
reference genome build GRCh38 with HISAT2(RRID:SCR_015530)313 for RNA and BWA-
MEM314 for DNA. Somatic variant calling was performed using Strelka315, VarScan316, Mutect317,
and Pindel318. To remove any false positive variants and discover TERT promoter mutations,
custom capture validation sequencing was performed to an average depth of 582x for all unique
variant sites using NimbleGen SeqCap EZ Prime Choice Probes (12,388 total probes created from
11,425 variants and 51 genes; 1.49 Mb of sequence targeted for capture). Tumor purity was
estimated using TPES319 for samples with sufficient variant count (> 20), and for those with
insufficient variants, the median variant allele frequency was used (2 x median VAF) . SciClone320

125
and ClonEvol321 were used to assess the clonality of mutations and subclonal evolution of primary
and recurrent GBM065 tumors.
CNV detection. Matched tumor/normal WES data was used to predict CNVs with CNVkit322.
Each tumor region sample was compared pairwise against the single matched normal data for the
patient. CNVkit was run (via “cnvkit batch”) using default parameters. Regions of alignment were
summarized to a resolution of 10kb and these data were subjected to segmentation using circular
binary segmentation. The resulting segmentation files were divided into three cohorts: 1) primary
and recurrent GBMs 2) breast cancer BrMETs 3) NSCLC BrMETs. GISTIC2323 was run on the
segments of each cohort with a q-value cutoff of 0.1. Relative amplitude thresholds were used to
create the heatmaps and clonality plots in Figure 2.
GBM Molecular Subtyping. Single-sample GSEA (ssGSEA) scores324 were calculated for each
sample in the cohort using the previously defined gene sets172 and the GSVA R package325. The
circlize (RRID:SCR_002141) R package was used for the visualization of these molecular
subtypes326.
Neoantigen prediction. Clinical class I and class II HLA typing was performed on each normal
sample by Histogenetics to two field resolution. For each tumor sample, a VCF file containing all
passing somatic variants was annotated with Ensembl VEP327 (RRID: SCR_002344) using the
parameters --everything, --flag_pick, and --plugin (Wildtype and Downstream). The VCF was
further annotated with DNA and RNA read counts using VAtools. Using this VCF as input, a
containerized version of pVACtools221 (DockerHub: griffithlab/pvactools:1.5.0) was used to

126
predict and annotate likely neoantigens in each sample as previously described328. Briefly, using
the sub-module “pvacseq run” we performed peptide:MHC binding affinity predictions with eight
class I and four class II algorithms (NNalign, NetMHC, NetMHCIIpan, NetMHCcons,
NetMHCpan PickPocket, SMM, SMMPMBEC, SMMalign, MHCflurry, MHCnuggetsI,
MHCnuggetsII). For this analysis, to be considered a neoantigen candidate it must have arisen
from a variant with tumor DNA VAF > 5% and median binding affinity (across all algorithms) <
500 nm. No sequences were excluded based on tumor RNA VAF, coverage, or gene expression
values to ensure that no high quality candidates were excluded based solely on RNA data.
Neoantigens that pass this filter are designated ‘candidate neoantigens’ in the manuscript.
Genomic alteration distribution. All genomic alterations (variants and associated neoantigens,
CNVs) were determined independently with each region as an individual sample. They were then
aggregated together for the plots in Figure 1 to provide an overall description of each tumor. We
then determined the distribution of each alteration between regions from the same tumor. If the
same change was observed in all regions of the tumor, it was defined as “clonal”. If it was
identified in more than one but not all regions it was defined as “subclonal shared”. Alterations
only observed in one region of each patient sample were defined as “subclonal private”.
Cancer/testis antigen analysis. A subset of cancer/testis antigens were chosen for analysis based
upon a combination of prior work targeting them in GBM201 (e.g. IL13Ra2) and/or previous
studies in other malignancies222,224 (e.g. NY-ESO-1, MAGE family proteins). Cancer/testis antigen
scores were generated by performing a log2 transform on the expression (TPM) of each gene
normalized to the median tissue expression for “Brain-Cortex” in the Genotype-Tissue Expression

127
(GTEx) Project database. Cancer/testis antigen scores were generated for the metastatic samples
through either normalizing to “Brain-Cortex” expression or the associated matched primary tissue
site (“Breast Mammary Tissue”, “Lung” or “Skin Sun Exposed”). The intratumoral spread of
cancer/testis antigen expression was assessed by calculating the variance of scores within the
regions of a tumor or by calculating the cosine similarity between regions, where each antigen’s
score in a given region represents one component of the vector.
RNA-Seq analysis and immune microenvironment profiling. Gene and transcript
quantification was performed using kallisto329. Differential expression analysis between tumor
types was then performed using sleuth330. To quantify immune cell populations in the tumors,
CIBERSORT226 was run using the LM22 signature gene file and disabled quantile normalization
for 100 permutations. Relative immune cell abundance was obtained using gene expression as
previously described in Danaher et al225. Principal components analysis dimensionality reduction
was implemented on Danaher scores for each tumor region in R version 3.6.2 using the ggbiplot
package.
Intratumoral similarity was performed by representing Danaher scores as vectors and
calculating the normalized dot product between pairs of regions from the same tumor. The immune
intratumoral heterogeneity (ITH) was defined for tumors with three distinct regions as the area in
PC1-PC2 space of the triangle whose vertices were represented by each region’s Danaher score.
The myeloid-specific analyses were performed through the generation of log-transformed scores
making use of gene sets defined in previous publications. A total of 11 and 10 genes were used to
define the M1 and M2 scores, respectively, based upon gene expression signatures of in vitro
polarized M1 or M2 macrophages227. A total of 6 distinct genes for each were used to define the

128
scores for both microglial and monocyte-derived macrophages228. These genes were selected
based upon differential expression in tumor-associated macrophages from distinct lineages in
single-cell RNA-sequencing data of human gliomas. To account for differential abundance of
macrophages between samples as a reason for findings, the difference between these scores
(corresponding to a ratio of gene expression) was taken to generate an “M2-M1 skew” or “MDM-
Microglial skew”.
TCR repertoire sequencing. Sequencing of the CDR3 regions of TCR b-chains was performed
through the ImmunoSEQ Assay (Adaptive Biotechnologies) and used the same DNA extracted
from tumor samples utilized for whole exome sequencing. Initial analysis was performed on the
immunoSEQ ANALYZER 3.0. Additional analysis was performed using the immunarch package
in R. Visualization of the V-J gene usage among T cell repertoires was performed using the circlize
(RRID:SCR_002141) package in R326. The intratumoral T cell fraction was calculated by dividing
the number of productive TCR templates by the number of nucleated cells estimated by the
amplification of reference genes. The Simpson’s clonality for each region was calculated by taking
the square root of the Simpson’s diversity index for all productive rearrangements with possible
values ranging from 0 (very polyclonal) to 1 (predominantly monoclonal or oligoclonal).
The similarity between TCR repertoires was assessed through either the normalized dot
product (cosine similarity) or Morisita overlap between the vectors of TCR clonotype abundances.
Both of these metrics are based upon pairwise comparisons between two repertoires. The T cell
repertoires for two regions are represented by vectors with indices covering the union of TCRs
observed in either of the corresponding regions. Each position of the vector then represents the

129
abundance (as a count) of a given clonotype within that region. The cosine similarity of the T cell
repertoires in regions A and B can then be given by:
𝐶𝑜𝑠𝑖𝑛𝑒'𝑆𝑖𝑚𝑖𝑙𝑎𝑟𝑖𝑡𝑦=' 𝐴
1
⋅'𝐵
4
1
5
𝐴
15
∗
5
𝐵
4
1
5
='
∑
𝐴!∗'𝐵!
"
!#$
8∑
𝐴!
%"
!#$
8∑
𝐵!
%"
!#$
where
𝐴!
and
𝐵!
represent the counts of clonotype
𝑖
within region A or B, respectively, and
𝑛
represents the number of unique clonotypes observed in either A or B. Similarly, the Morisita
overlap between the T cell repertoires in regions A and B is defined as:
𝑀𝑜𝑟𝑖𝑠𝑖𝑡𝑎'𝑂𝑣𝑒𝑟𝑙𝑎𝑝=' 2∗(𝐴
1
⋅'𝐵
4
1
)
@∑
𝐴!
%"
!#$
𝑁&
%+
∑
𝐵!
%"
!#$
𝑁'
%
C
∗'𝑁&∗𝑁'
'
where
𝐴!
,
𝐵!
, and
𝑛
represent the same values as before and
𝑁&
and
𝑁'
represent the total number
of productive rearrangements observed in region A or B, respectively. Both of these metrics
provide a value between 0 and 1 where 0 represents no similarity (orthogonal vectors or completely
disparate populations) and 1 represents complete similarity (parallel vectors or completely
identical populations). Comparisons between tumor types were performed by taking all
intratumoral comparisons between GBMs and BrMETs and grouping them.
Sample preparation for single-cell sequencing. For single-cell samples, the fresh surgical
sample was rinsed with PBS to remove visual blood contaminant and manually dissociated using

130
frosted microscope slides and gentle trituration. The resulting single-cell suspension was passed
through 100 mM and 70 mM filters before undergoing Percoll (GE Healthcare Life Sciences)
density gradient centrifugation to remove myelin contamination. Following this separation, the
resulting cell pellet underwent RBC lysis with ACK Lysis Buffer (Lonza Biosciences) and was
frozen in 90% FBS and 10% DMSO at -80oC and later stored in liquid nitrogen until further use.
The tumor sample was later thawed, and the single-cell suspension was stained with anti-
CD45, anti-CD11b, anti-CD3, and Zombie NIR Viability Dye (BioLegend). Live CD45+ single
cells were purified by fluorescence-activated cell sorting on a BD FACSAria II with an 85 mM 45
psi nozzle into a buffer of PBS with 0.04% BSA. A total of 13,000 were submitted for analysis.
Single-cell library preparation. cDNA was prepared after the Gel Beads in Emulsion (GEM)
generation and barcoding, followed by the GEM-RT reaction and bead cleanup steps. Purified
cDNA was amplified for 10-14 cycles before being cleaned up using SPRIselect beads. Samples
were then run on a Bioanalyzer to determine the cDNA concentration. TCR target enrichment was
done on the full length cDNA. GEX and Enriched TCR libraries were prepared as recommended
by the 10x Genomics Chromium Single Cell V(D)J Reagent Kits (v1 Chemistry) user guide with
appropriate modifications to the PCR cycles based on the calculated cDNA concentration. For
sample preparation on the 10x Genomics platform, the Chromium Single Cell 5’ Library and Gel
Bead Kit (PN-1000006), Chromium Single Cell A Chip Kit (PN-1000152), Chromium Single Cell
V(D)J Enrichment Kit, Human, T Cell (96rxns)(PN-1000005), and Chromium Single Index Kit T
(PN-1000213) were used. The concentration of each library was accurately determined through
qPCR utilizing the KAPA library Quantification Kit according to the manufacturer's protocol
(KAPA Biosystems/Roche) to produce cluster counts appropriate for the Illumina NovaSeq6000

131
instrument. Normalized libraries were sequenced on a NovaSeq6000 S4 Flow Cell using the XP
workflow and a 151x8x151 sequencing recipe according to the manufacturer's protocol. A median
sequencing depth of 50,000 reads/cell was targeted for each Gene Expression Library and 5000
reads/cell for each V(D)J (T cell) library.
Single-cell sequencing analysis. Raw sequencing data was processed with Cell Ranger, version
3.0.1331, from 10X genomics, mapped onto a human genome reference (GRCh38-2020-A).
Downstream analysis was performed using the Seurat (RRID: SCR_007322) R package version
3.2.0332. Low quality cells and potential doublets were accounted for by removing cells that
contained fewer than 500 expressed genes, a nCount value greater than the nCount value of the
93rd percentile of the total sample, or more than 10% mitochondrial transcripts. Genes that were
expressed in fewer than 100 cells were also removed. For each cell, expression of each gene was
normalized to the sequencing depth of the cell, scaled to a constant depth (10,000), and log
transformed. Variable genes were selected with default settings and principal component analysis
was performed on the variable genes. Dimensionality reduction and visualization were performed
with the UMAP algorithm (Seurat implementation) using the first 15 PCA dimensions.
Unsupervised graph-based clustering of cells was performed using the mentioned PCA dimensions
with a resolution of 0.8.
Enriched gene expression levels in each cell cluster were identified by a Wilcoxon Rank
Sum test-based function. These genes, along with common cell type markers, were used to
establish the cell identity of each cluster. Projection of average expression of marker genes into
UMAP or violin plots was used for cell type identification. Gene expression signatures used for
definition of clusters were as follows: CD3E, CD3D, CD3G (T cells), NKG7, PRF1, GZMH, CD3-

132
(Natural killer cells), MS4A1, CD79B, CD3- (B cells), and CD14, S100A8, S100A9, C1QC, CD68,
CTSD, HLA-DR+ (Monocytes/macrophages).
Second-level clustering of T cells was performed by subsetting only T cell clusters and
rerunning scaling, log transformation, and variable gene selection. In addition, PCA was
performed again on the new variable genes. Dimensionality reduction and visualization were
performed with the UMAP algorithm using the first 10 PCA dimensions. Unsupervised graph-
based clustering of cells was performed using the mentioned PCA dimensions with a resolution of
1.0. Gene expression signatures used for definition of clusters were as follows: CCR7, SELL,
TCF7, KLF2 (Naive/central memory T cells), Il7R, KLRB1, SELL- (Effector memory T cells),
TIGIT, CTLA4, CD4 (CD4+ regulatory-like T cells), and NKG7, PRF1, CCL5, GZMH, CD3,
CD8A, CD8B (Cytotoxic CD8+ T cells).
V(D)J libraries were processed with CellRanger V(D)J, version 2.0.0, from 10x Genomics
mapped onto a human VDJ reference (GRCh38-2.0.0). Clonotype analysis was performed with
the scRepertoire (version 0.99.17) R package333. Clonotypes were defined as the combination of
the genes of the TCR A and B chains and nucleotide sequences as previously discussed334.
Statistical Analysis on Chapters 2-3. Data analysis and visualization in R was performed using
the tidyverse package. Statistical significance for variant, neoantigen, CNV clonality estimates,
heterogeneity estimates, T cell fraction, and T cell clonality were performed using an unpaired t-
test. Significance for differential expression was determined by a multiple t-test with Benjamini-
Hochberg adjustment with an FDR = 0.05.

133
Human neoantigen screening system. TCR-deficient Jurkat-Nur77:GFP cells were obtained
from Paul Thomas’s lab at St. Jude Children’s Research Hospital, while K562 cells were obtained
from Todd Fehniger’s lab here at Washington University. For additional modification of the Jurkat
cells, gene blocks encoding human CD4 or CD8 were ordered and cloned into the pLX304
expression system prior to retrovirus production and Jurkat transduction. For additional
modification of the K562’s, a gene block encoding human CD80 was ordered and cloned into the
pLX304 expression system prior to retroviral transduction.
Full-length human TCRs were constructed by utilizing the 5’ VDJ single-cell sequencing
data in conjunction with the IMGT reference. Full-length TCR gene blocks were ordered
consisting of b chain -- P2A -- a chain and were cloned into the pMSCV-IRES-RFP expression
plasmid prior to retroviral transduction.
Patient-specific HLA’s were identified by performing clinical haplotyping on DNA
isolated from peripheral blood of patients through Histogenetics. Full-length human HLA’s were
then constructed by utilizing the European Bioinformatics Institute database. Gene blocks
encoding these HLA’s were ordered and cloned into the pBabe-puromycin backbone prior to
retroviral transduction of K562’s and puromycin selection.
Mouse neoantigen screening system. TCR-deficient 58 hybridoma cells were obtained from
David Kranz’s lab at the University of Illinois Urbana-Champaign. For additional modification of
these cells, gene blocks encoding mouse CD4 or CD8 were ordered and cloned into the pLX304
expression system prior to retroviral production and transduction. Full-length TCR gene blocks
were ordered consisting of b chain -- P2A -- a chain and were cloned into the pMSCV-IRES-RFP
expression plasmid prior to retroviral transduction.

134
Animals. All animal studies were approved by the Washington University Animal Studies
Committee and all mice were housed in accordance with the Institutional Animal Care and Use
Committee standards. Male or female mice between the ages of 6-16 weeks of age were used for
tumor injections. TCR transgenic mice were used until 1 year of age. C57BL/6 and C57BL/6:129
hybrid mice were purchased from Taconic Biosciences. CD45.1 congenic, and RAG2 KO mice
were purchased from Jackson Laboratory. C57BL/6 IRF8+32kb-/- (Delta32) mice were obtained
from Kenneth Murphy.
Cell Lines & Media. GL261 was obtained from the National Cancer Institute Tumor Repository,
and CT2A was obtained from Dr. Peter Fecci (Duke University). All mImp3 overexpression lines
were generated by cloning a 132 bp segment of the mutated IMP3 gene into the pBabe backbone.
Transduction of target cell lines was performed as described335. The GL261:E8 clone was
generated by the Genome Engineering & iPSC Center (GEiC) at Washington University in St.
Louis. Briefly, guide RNAs were designed to target near the mutation site. The parental GL261
cells were nucleofected with CRISPR constructs and single strand DNA donors (ssODNs) carrying
the correction. Single cell GL261 clones were screened for the presence of the N81D correction.
All tumor cell lines were maintained in D10 media consisting of DMEM (Gibco) supplemented
with 10% FBS, 1% L-Glutamine (Corning), 1% MEM Nonessential Amino Acids (Corning), 1%
Sodium Pyruvate (Lonza Bioscience), and 1% Pen/Strep (Gibco).
58 hybridoma cells were obtained from David Kranz (University of Illinois Urbana-
Champaign) and cultured in media consisting of RPMI (Gibco) supplemented with 10% FBS,
0.5% HEPES (Corning), 1% Sodium Bicarbonate (Corning), 1% L-Glutamine (Corning), 1%
Pen/Strep (Gibco), and 50 uM b-Mercaptoethanol (Sigma-Aldrich).

135
Primary splenocytes were cultured in R10-BME media consisting of RPMI (Gibco)
supplemented with 10% FBS, 1% L-Glutamine (Corning), 1% Sodium Pyruvate (Lonza
Bioscience), 1% Pen/Strep, 0.5% Sodium Bicarbonate (Corning), and 50 uM b-Mercaptoethanol
(Sigma-Aldrich). When indicated, this media was supplemented with specific concentrations of
peptide and/or cytokines.
Single-Cell PCR & TCR Isolation. To provide cells for TCR isolation, three separate populations
of mImp3-specific T cells were generated. Splenocytes were taken from mice that had rejected
GL261 once following aPD-L1 therapy (1X), once following aPD-L1 therapy and an additional
two times from memory rechallenge (3X), or had been vaccinated in a prime-boost manner with
50 µg mImp3 peptide and 100 µg Poly(I:C) adjuvant (Vax). Each of these populations were
stimulated with 1 nM mImp3 peptide and 50 IU/mL rhIL-2 with a weekly replacement with fresh
naïve splenocytes as antigen presenting cells. Single mImp3-specific CD8 T cells were tetramer
sorted into PCR plates in a buffer of PBS with 0.1% BSA Fraction V (Sigma-Aldrich) and 200
U/mL RNase inhibitor (New England BioLabs) following 6-8 weeks of stimulation to enrich for
tetramer-positive cells.
To isolate mImp3-specific TCRs, we adopted a previously published single-cell PCR
protocol290. In brief, a two-step nested PCR reaction was performed in which the first RT-PCR
reaction included a pool of 41 Va and 39 Vb primers specific to the leader sequences of all possible
TCR a or b chains. Triton X-100 detergent (Sigma-Aldrich) was added to a concentration of 0.1%
for this first step to facilitate cell lysis. PCR product from this first reaction was diluted 1:100 prior
to separate second-step reactions for a or b chains. The specific reagents used and PCR reaction
conditions can be found in previously published work290.

136
The second-step PCR products were ran on a gel and isolated via QIAquick Gel Extraction
Kit (Qiagen) before undergoing sanger sequencing. Full-length TCR chains were generated by
combining sequencing results with IMGT reference sequences for a or b chain constant regions.
Gene blocks for each TCR were ordered (IDT) consisting of b chain – P2A - a chain and cloned
into the pMSCV-IRES-GFP (pMIG) (AddGene) backbone through Gibson Assembly (New
England BioLabs).
58 Hybridoma Functional Assays. Full-length TCRs for each candidate were constructed
utilizing the sanger sequencing results together with the IMGT reference for the constant regions
of the a and b chain. Gene blocks were ordered consisting of b chain -- P2A -- a chain and were
cloned into the pMSCV-IRES-GFP (pMIG) expression plasmid prior to retroviral transduction.
For the assessment of TCR functionality, TCR-expressing 250K 58 hybridoma cells were co-
cultured with 200K splenocytes loaded with peptide at varying concentration in 500 uL. After
overnight co-culture, 200 uL of supernatant were taken and analyzed for IL-2 production by the
Milliplex Mouse High Sensitivity IL-2 Multiplex Assay.
Generation of MISTIC Transgenic Mouse. Full-length TCR a or b chains for the 3x.1.1C TCR
were cloned into the transgene plasmids pCD2 and p428, respectively. Transgene fragments were
digested and isolated via gel extraction prior to resuspension in a filtered microinjection buffer.
Pronucleus injections were then performed by the Transgenic, Knockout, and Micro-Injection
Core at Washington University in St. Louis.

137
Transgenic T Cell Stimulation. Naïve splenocytes from transgenic mice were isolated by
mechanical dissociation and filtration through a 100-micron cell strainer. Mononuclear cells were
isolated through Ficoll-Paque PLUS density gradient (Cytiva) centrifugation and stimulated in
R10-BME media with 1 µM mImp3 peptide and 30 IU/mL rhIL-2. Cells were split 1:1 after 3 days
of stimulation. After 5 days of stimulation, CD8 T cells were isolated through negative selection
via EasySep Mouse CD8+ T Cell Isolation Kit (StemCell Technologies). The resulting cells were
then used for select in vitro functional assays or in vivo adoptive transfer studies.
Intracranial Injections. For intracranial tumor injections, cells were harvested following at least
one passage and having reached 60-90% confluency. 50,000 tumor cells in 5 uL PBS were injected
into the right hemisphere 2 mm posterior to bregma at a depth of 3.5 mm using a Stoelting
stereotactic headframe. Following tumor injection, mice were tracked daily and euthanized when
moribund.
Adoptive Cell Therapy. One day prior to receiving cell therapy, tumor-bearing mice received 5
Gy of total-body irradiation. Stimulation of naïve splenocytes from transgenic mice was performed
as described. After 5 days of stimulation and cell isolation, CD8 T cells were resuspended in PBS
at 2.5 x 10⁷ cells/mL and 200 µL was given intravenously via the tail vein with a 27-gauge needle.
In addition, mice received daily injections of 180,000 IU of rhIL-2 intraperitoneally on the day of
cell transfer and for two days thereafter.
MRI Imaging. Following treatment on day 7, mice were serially imaged on a weekly basis
beginning on day 14 until day 35. After that point, imaging was performed on a biweekly basis.

138
All imaging was performed by the Small-Animal Magnetic Resonance Facility core at Washington
University in St. Louis.

