MAT 275 MATLAB LAB 4 Alejandro Carranza
Monday 9:40 AM
Javier Baez
%Exercise 1
%a
function LAB04ex1
t0 = 0; tf = 40; y0 = [1;0];
[t,Y] = ode45(@f,[t0,tf],y0,[]);
[t,Y]
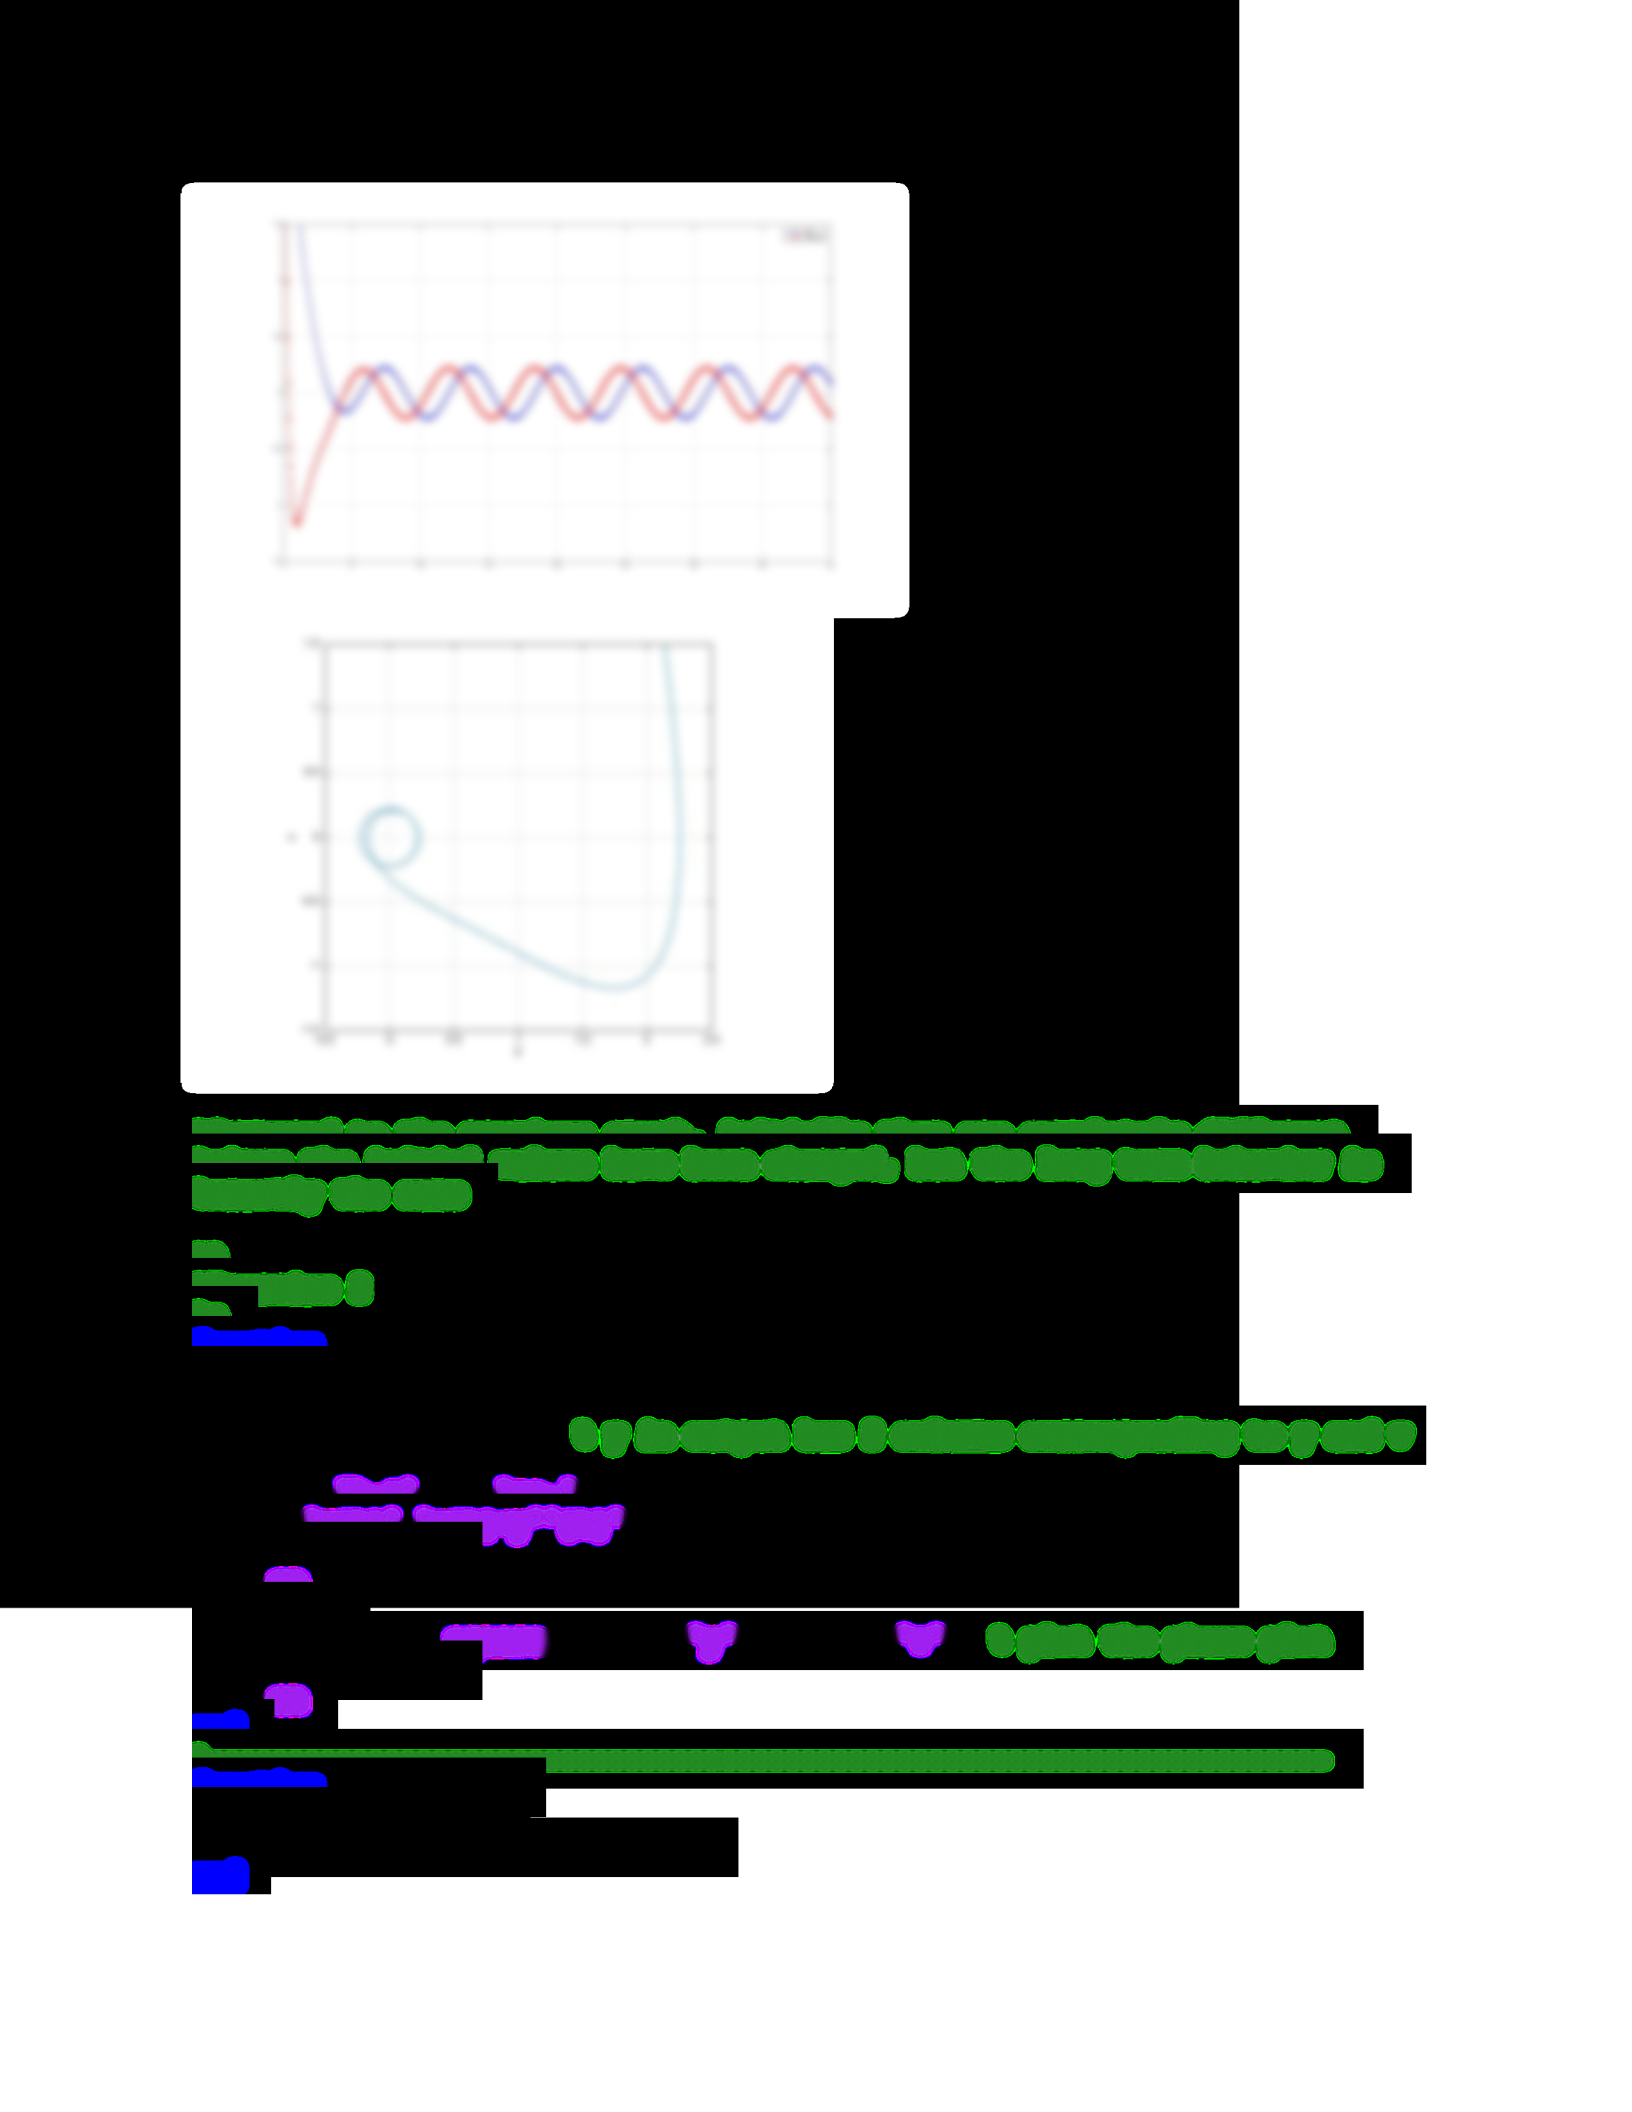
y = Y(:,1); v = Y(:,2); % y in output has 2 columns corresponding to y and v
figure(1);
plot(t,y, ,t,v,'b +'- 'ro-')
legend('y(t)','v(t)=y''(t)')
ylim([ 1.5,1.5])-
grid on
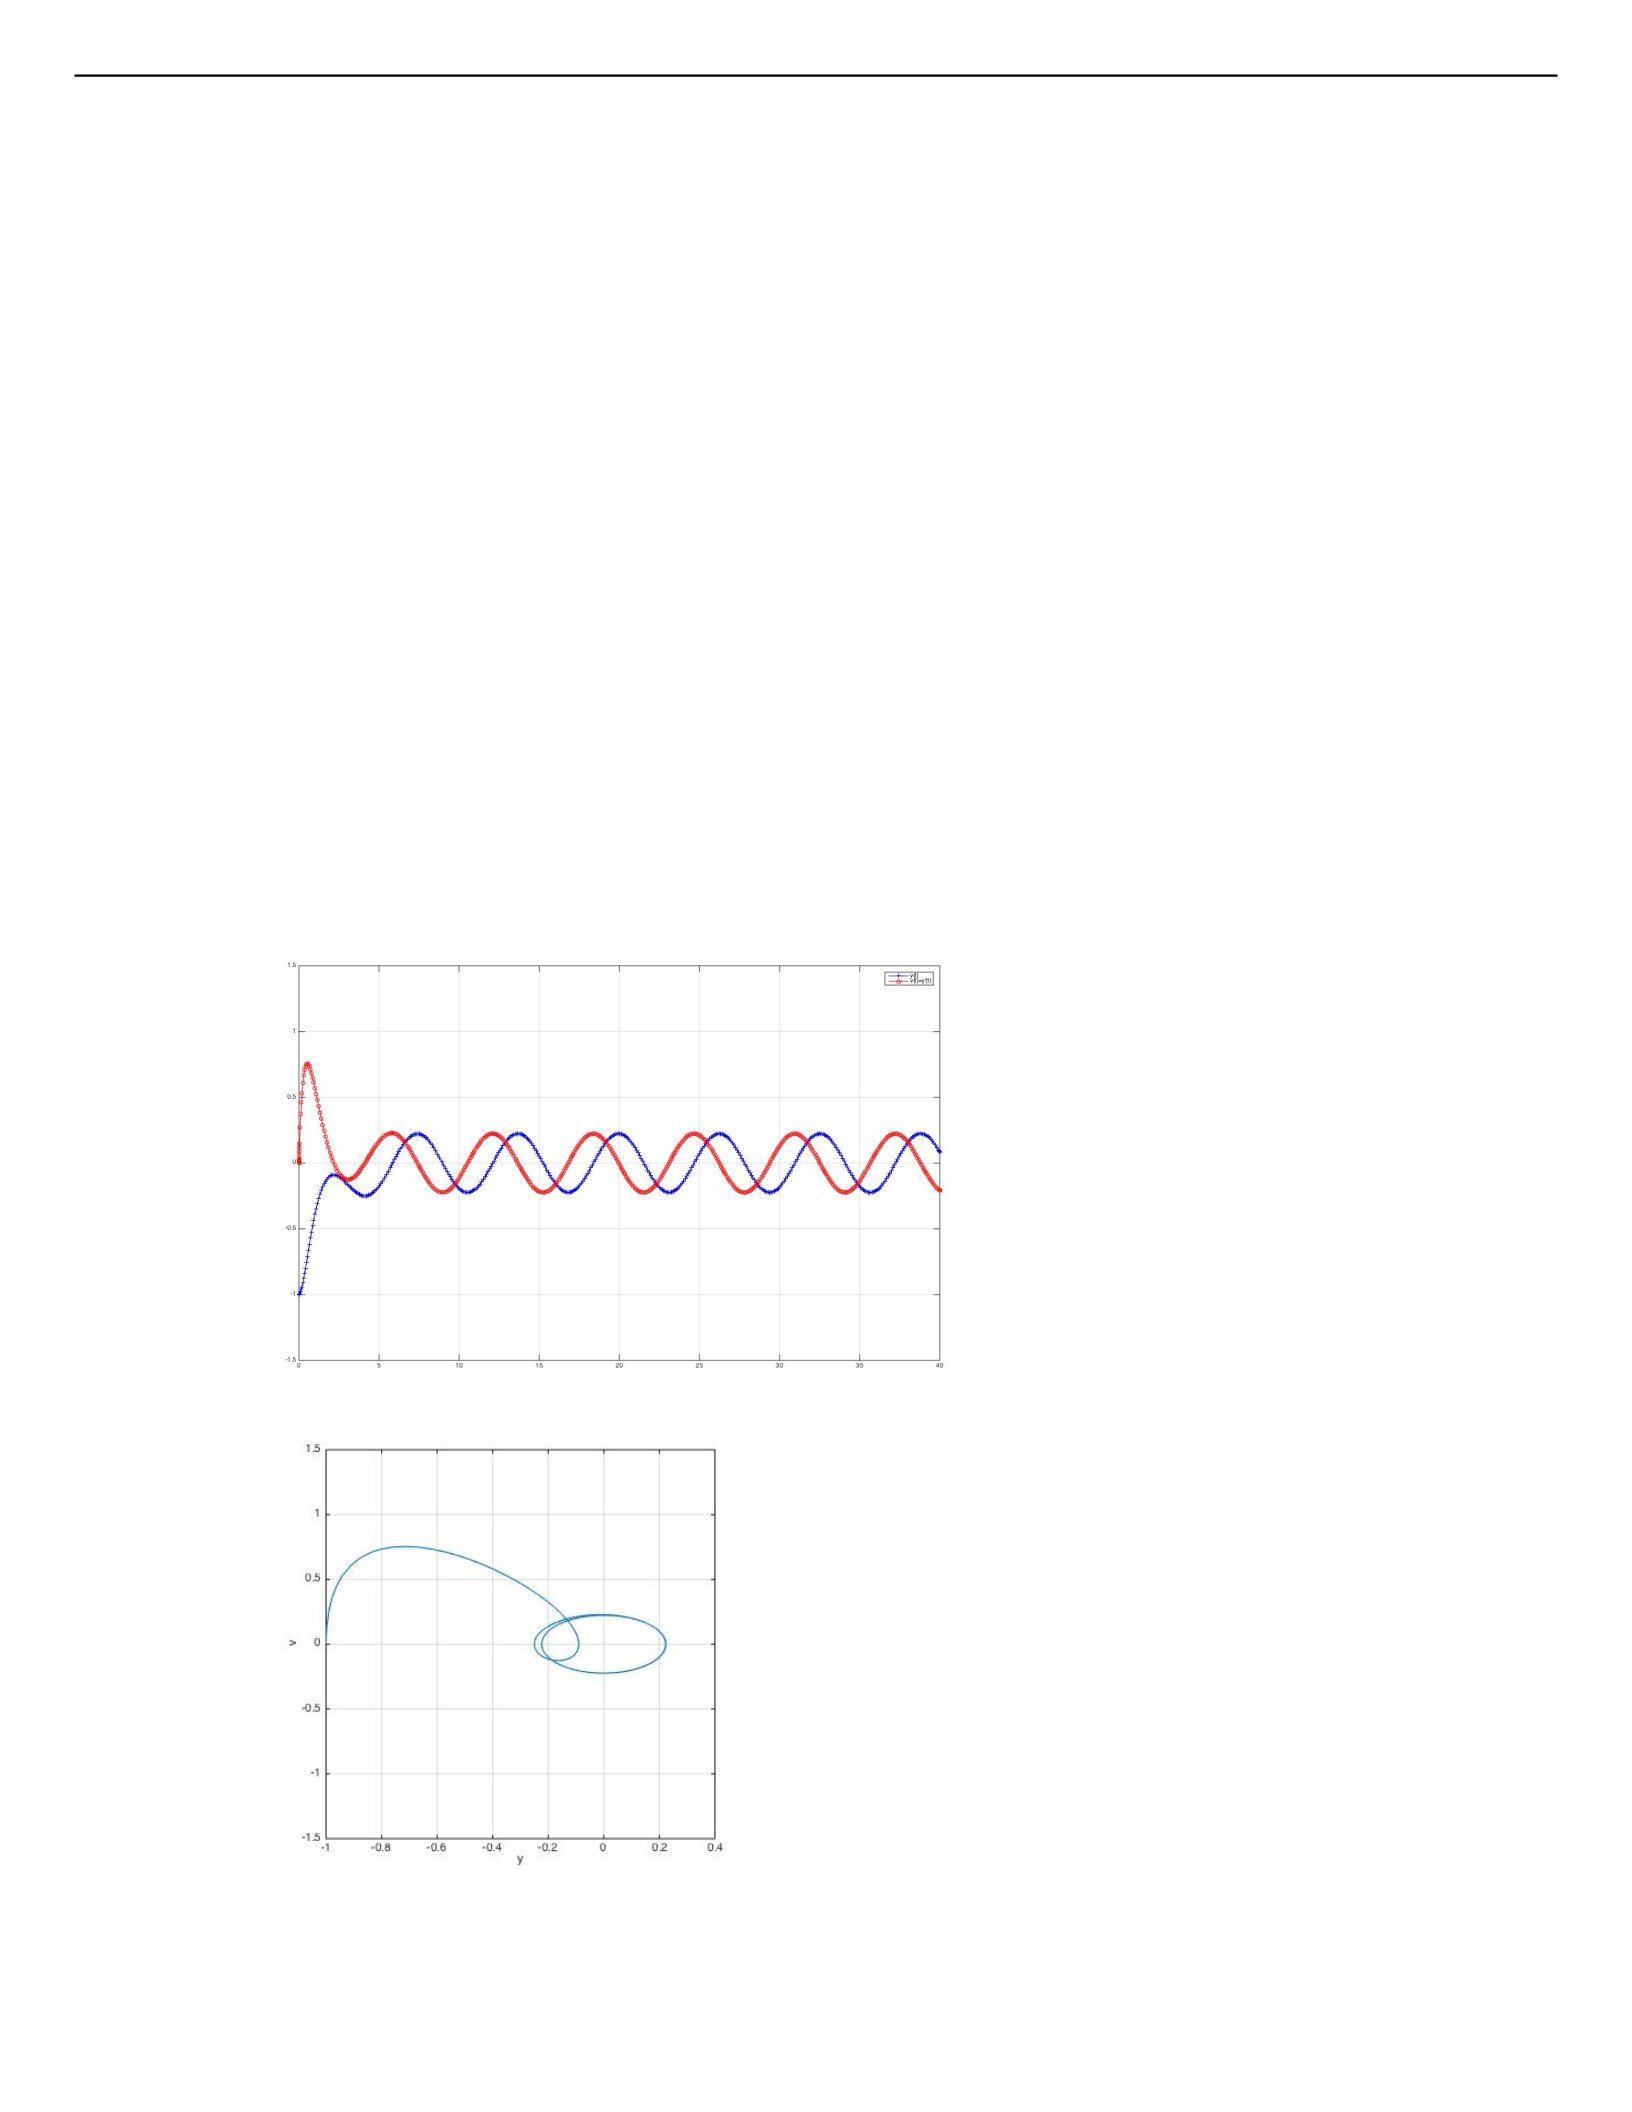
figure(2)
plot(y,v); axis ; xlabel( ); ylabel( ); square 'y' 'v' % plot the phase plot
ylim([ 1.5,1.5])-
grid on
end
%----------------------------------------------------------------------
function dYdt=f(t,Y)
y = Y(1); v = Y(2);
dYdt = [v; cos(t) *y ];-4*v-3
end

%b
2.1340 0.0903 0.0125-
2.2316 0.0905 0.0162- -
7.3562 0.2224 0.0087
7.4353 0.2224 0.0091-
13.6632 0.2236 0.0023
13.7398 0.2231 0.0148-
19.9324 0.2235 0.0054
20.0093 0.2233 0.0118-
26.2151 0.2235 0.0056
26.2920 0.2233 0.0117-
32.4983 0.2235 0.0056