MAT$275$MATLAB$LAB$5$ $ $ $ $ $ $ Alejandro$ $Carranza
$
Exercise$1$$
A)$
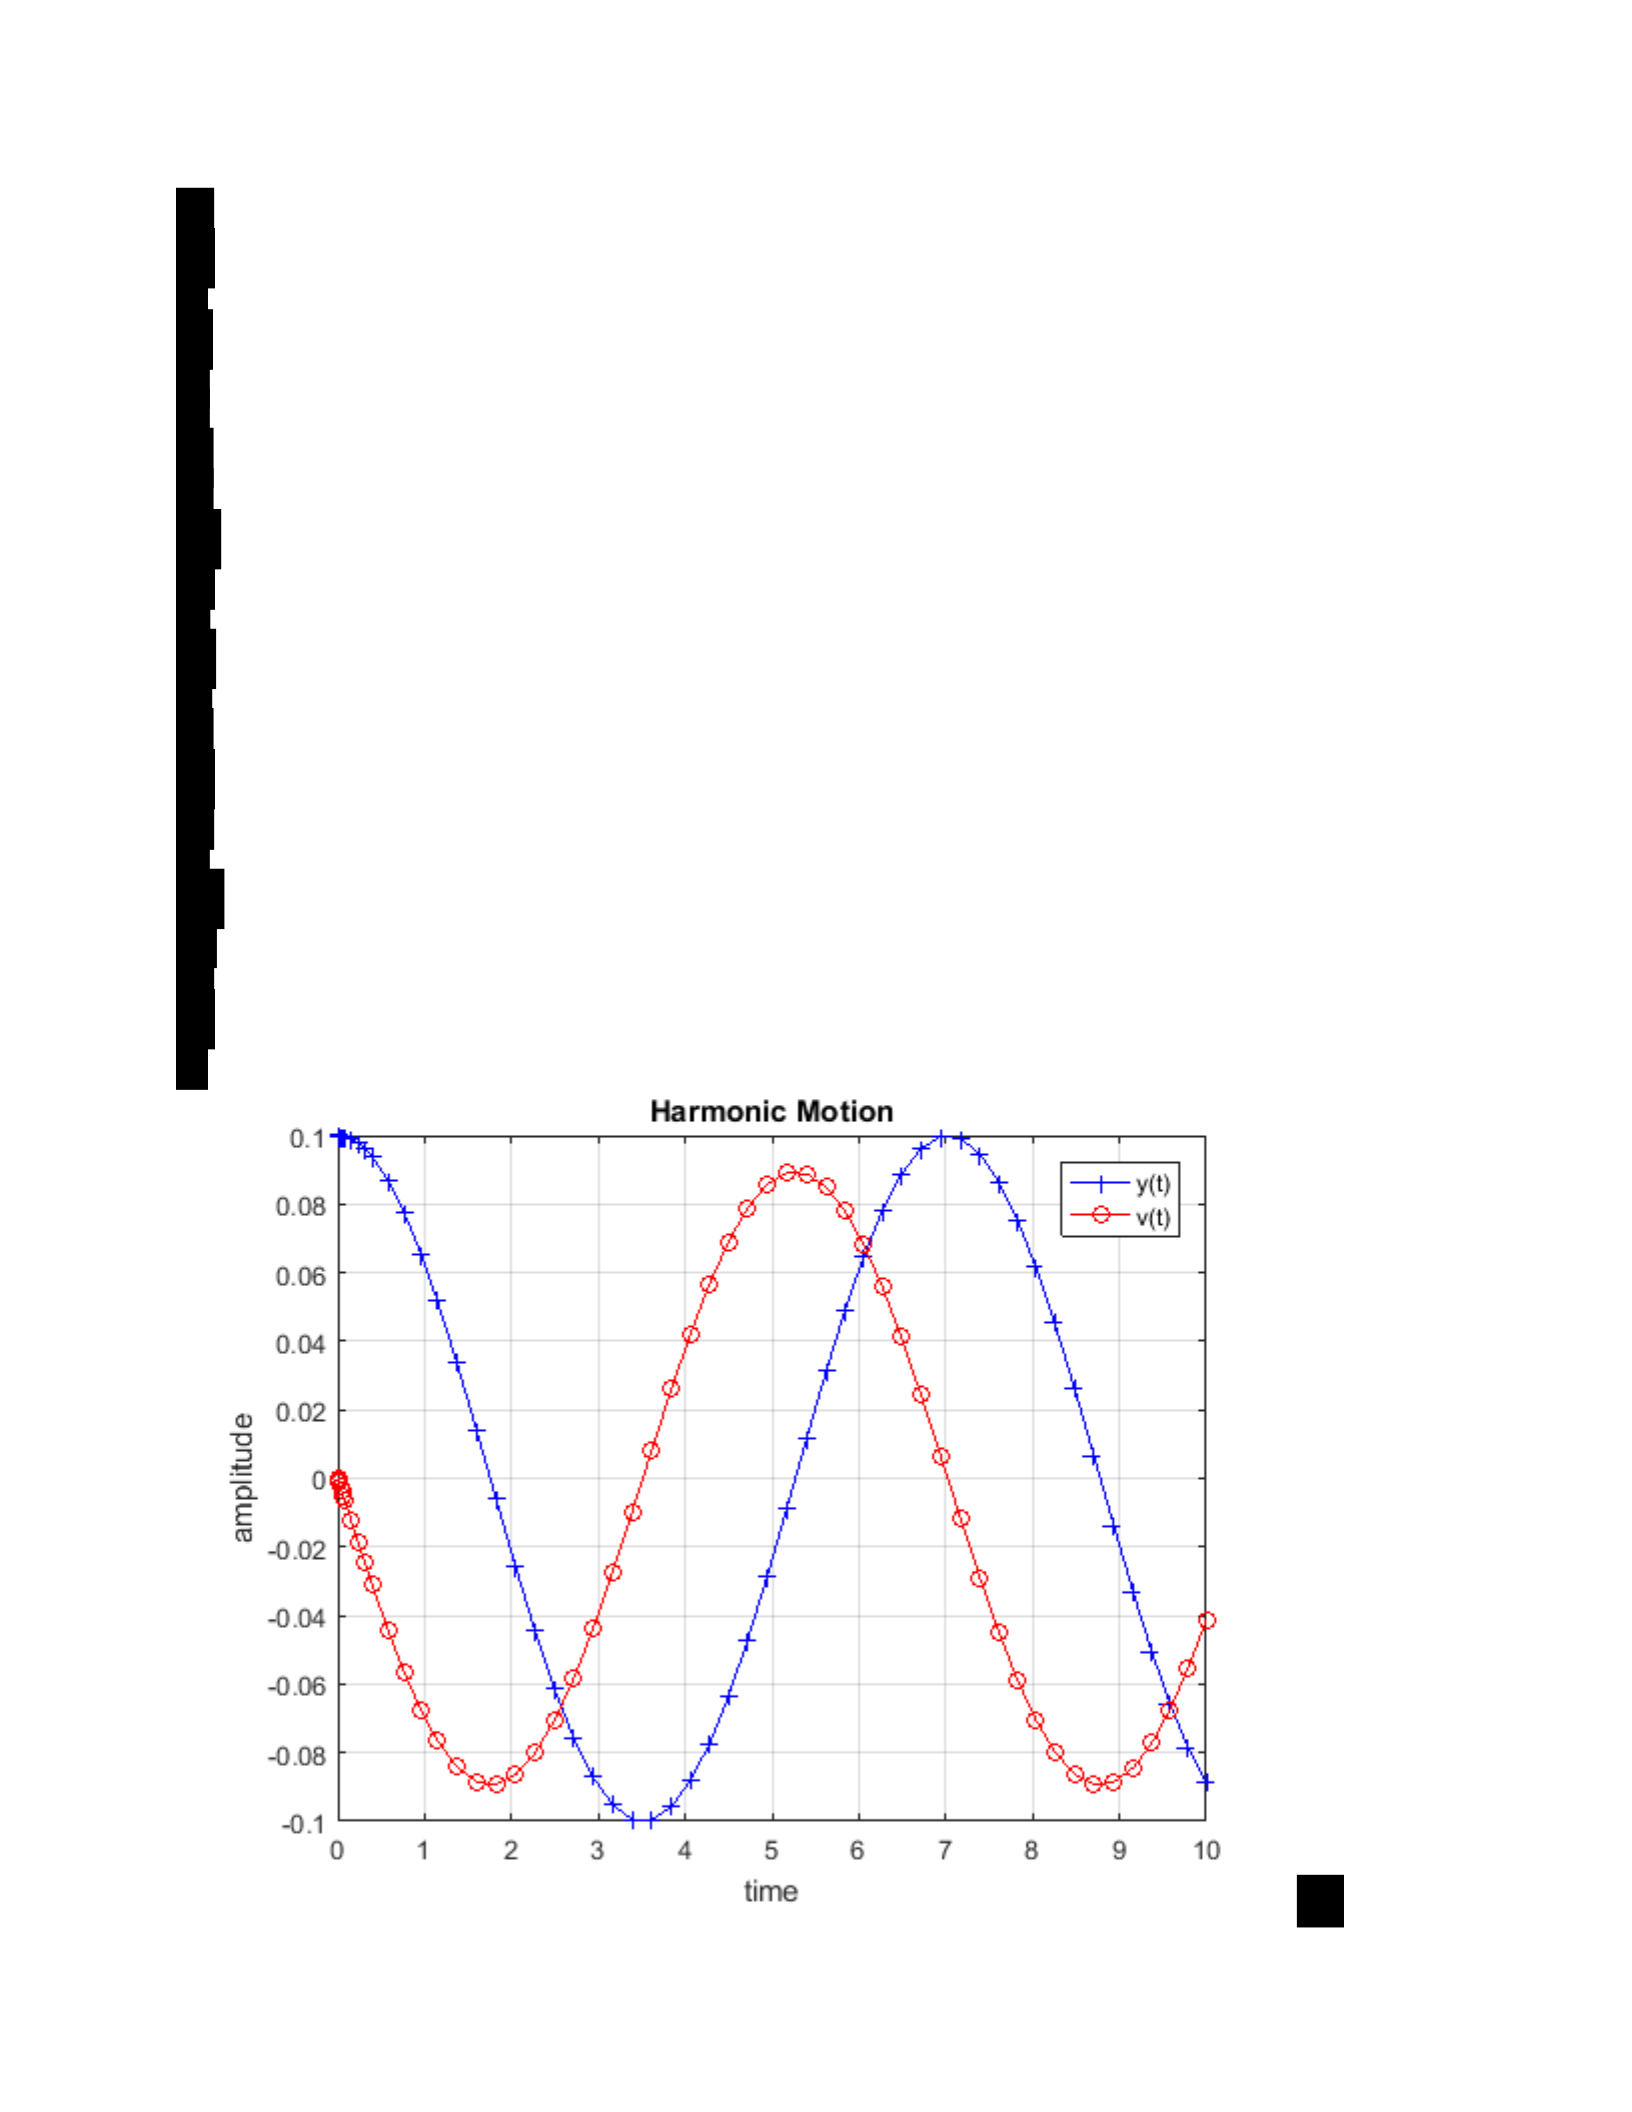
%The blue represent the y = y(t) graph due to the facts
%that the in tial condition of the blue curve is at y(0)=0.1.i
B)$
%The period is around 3.1, and
%using w0 would be 2pi/w0, which would come out to pi.
C)$
%The mass will not come to rest due to the fact that there is no
%damping in the system, so the amplitudes will remain constant.
D)$
%The amplitude for the y(t) curve is 0.1.
E)$
%The max velocity is reached when v(t) = 0.2, which occurs at t -values
%pi/4,3pi/4,5pi/4,… .
F)$
%As the mass increases, the period will increase, and as
%the k stiffness value increases, the period will decrease.
$
%m = 5;k = 4;
type('LAB05ex11.m')
run('LAB05ex11.m')
%m = 1; k = 16;
type('LAB05ex12.m')
run('LAB05ex12.m')
function LAB05ex11
m = 5;
k = 4;
omega0 = sqrt(k/m);
y0 = 0.1; v0 = 0;
[t,Y] = ode45(@f,[0,10],[y0,v0],[],omega0);
y = Y(:,1); v = Y(:,2);
figure(1)
plot(t,y,'b+',t,v,'ro');--
xlabel('time')
ylabel('amplitude')