


MAT 275 MATLAB 1 - Krish Soni
Complete Appendix A.1 #: 1,2,3,4,6,7,12,13,18 AND Chapter 1 #: 3,4,19,22,26.
A.1 Question 1: Enter the commands given in MATLAB Example 1 and run
the output.
pi+exp(1)+log(4)
ans =
7.246168843168729
format long
pi+exp(3)+log(1/2)
ans =
22.533982396217517
x=-2:.1:pi/2;
eq1=x.^2-1+sin(x);
plot(x,eq1)
plot(x,eq1,'b--','LineWidth',3)
xlabel('x','Fontsize',12), ylabel('y','Fontsize',12)
legend('x2-1+sin(x)')
title('A basic plot')
axis([-2 pi/2 -1.5 1.5])
1
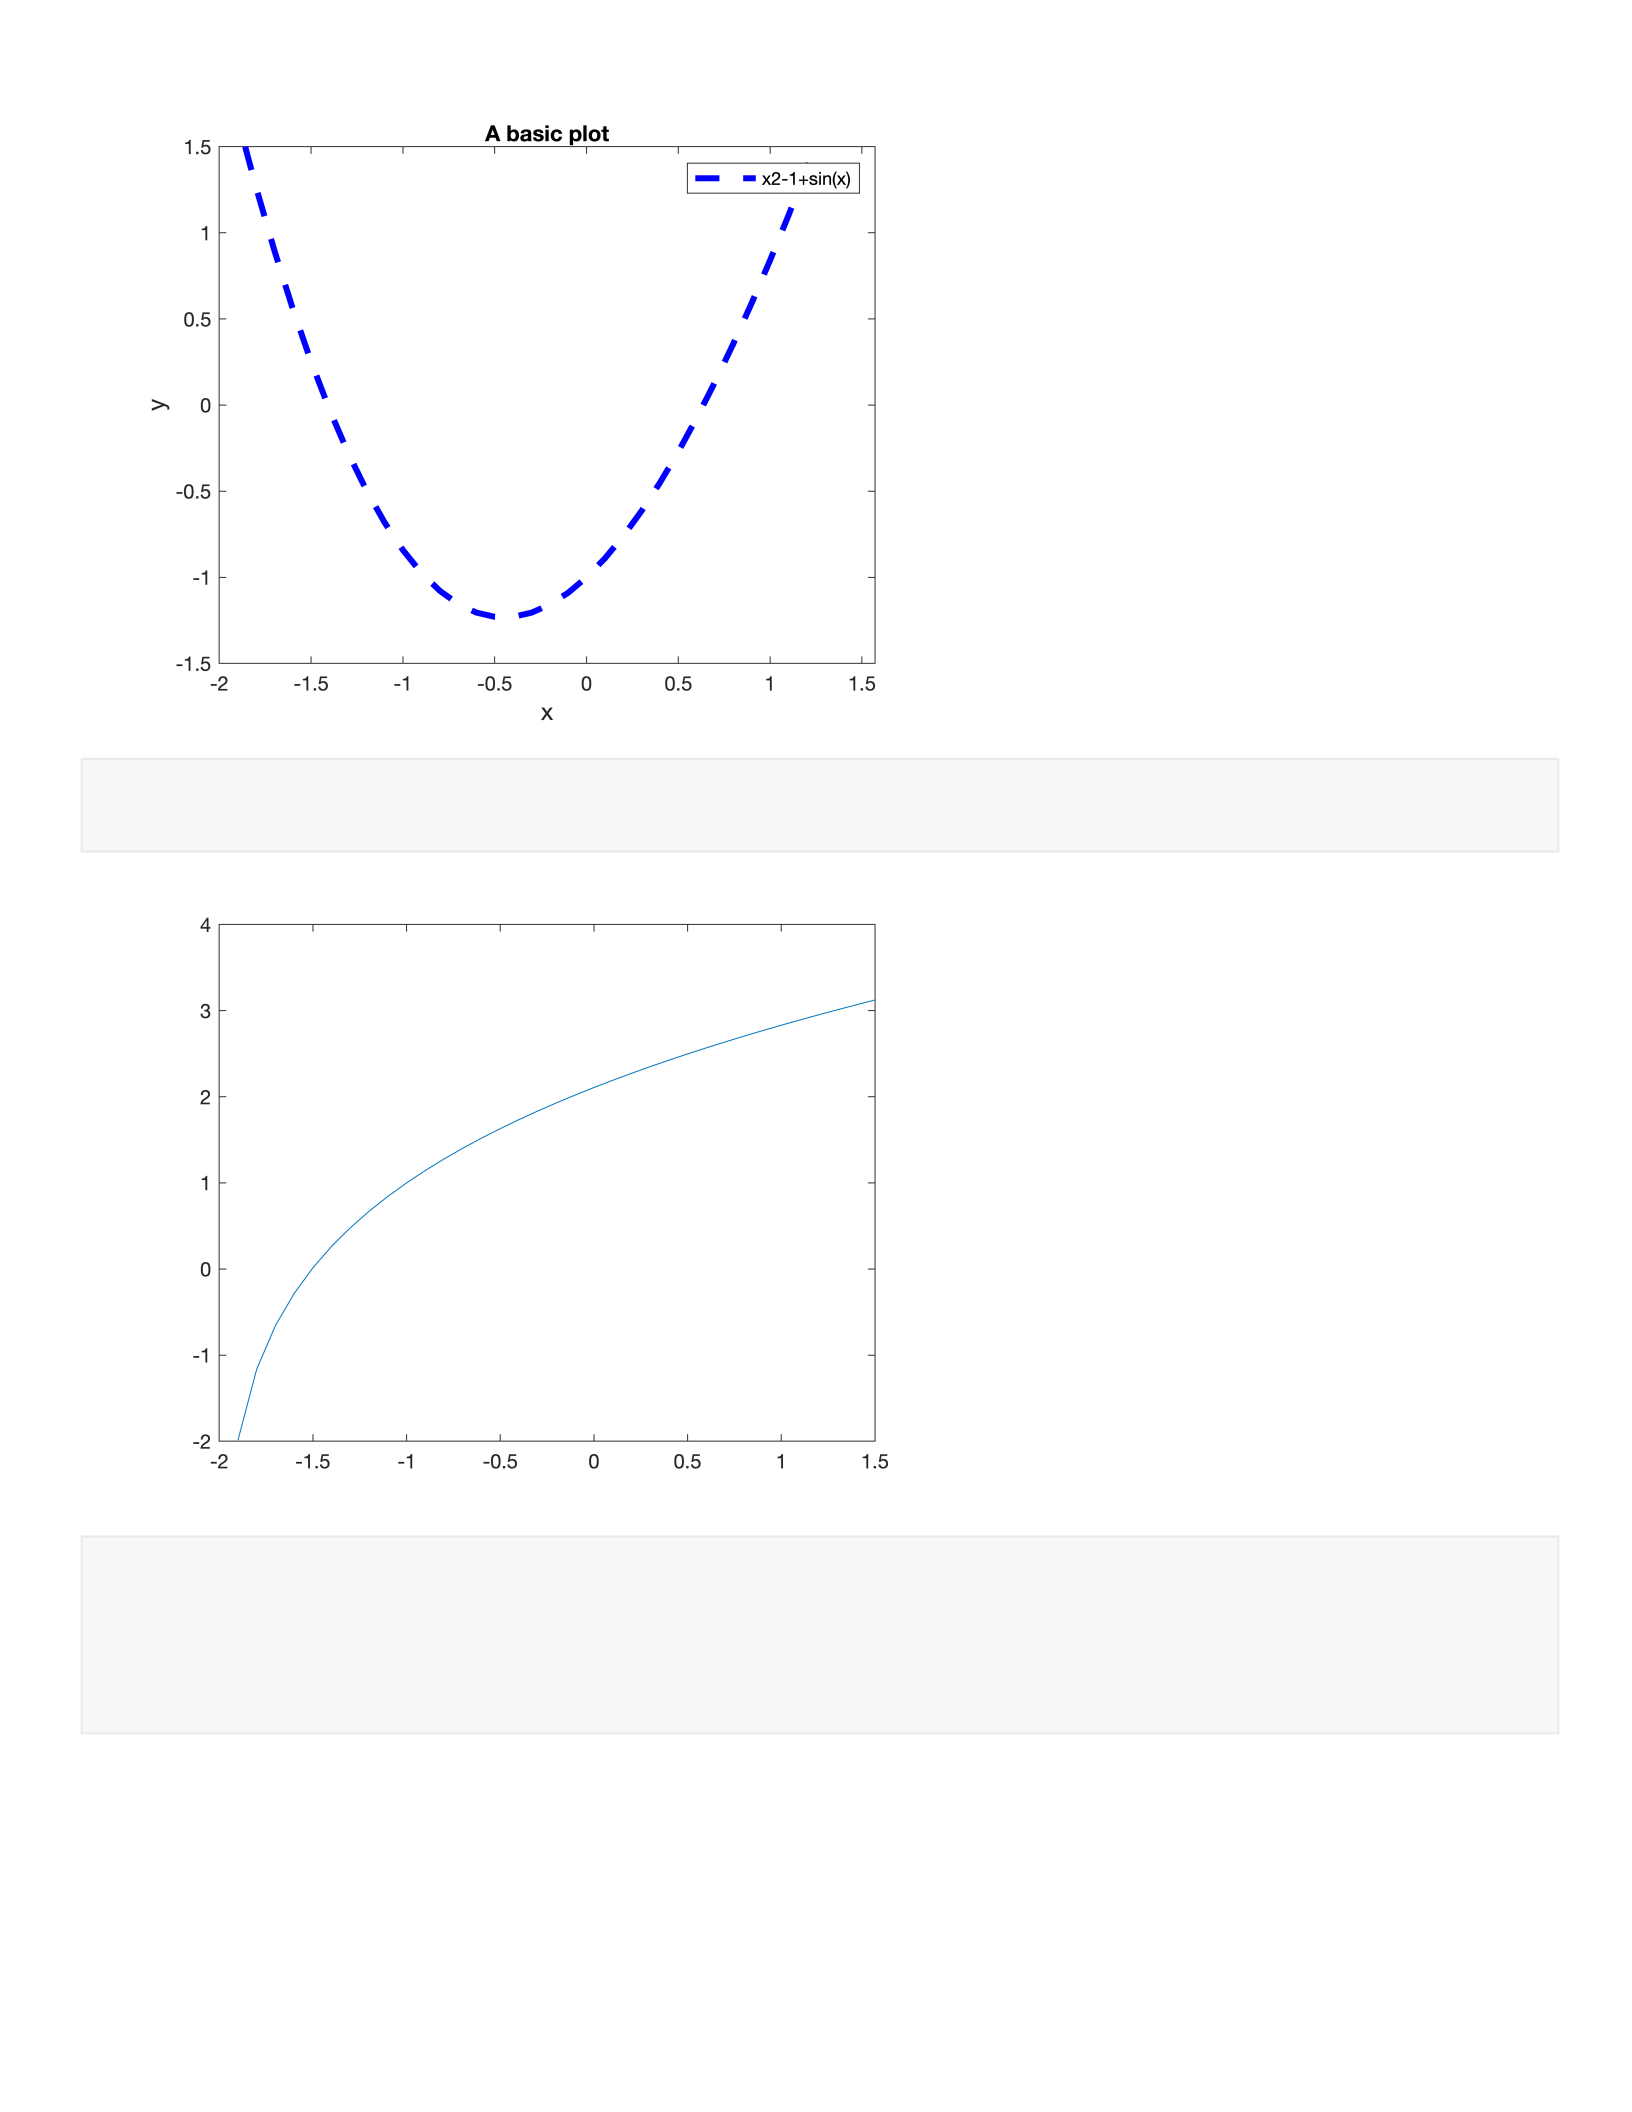
f=sqrt(x+2)+log(x+2); %note that log(x) is ln(x) in MATLAB
plot(x,f)
plot(x,eq1,'b-',x,f,'m.')
xlabel('x','Fontsize',12), ylabel('y','Fontsize',12)
title('Superimposed plots')
legend('x∧2-1+sin(x)','sqrt(x+2)+log(x+2)')
axis([-2 1 -1.5 2])
2

x=0:.1:3;
eq2=log(x);
eq3=exp(-x.^2);
plot(x,eq2,'b')
hold on
plot(x,eq3,'k--')
xlabel('x','Fontsize',12), ylabel('y','Fontsize',12)
axis([0 3 -2 2]), title('ln(x) vs exp(-x∧2)')
hold off %anything that follows will not be superimposed
orient tall %makes picture take up full page when you print
3

A.1 Question 2: Enter the commands given in MATLAB Example 2 and run
the output.
clear all
syms x
f(x)=x^4+2*x^3-8*x^2
f(x) =
f(3)
ans =
subs(f(x),x,3)
ans =
eq1=solve(f(x),x)
eq1 =
eq1(4)
ans =
factor(f(x))
ans =
g(x)=1-x^2
g(x) =
f(x)*g(x)
ans =
factor(f(x)*g(x))
ans =
f(x)/x
ans =
simplify(f(x)/x)
4

ans =
h(x)=x^2+2*x+4
h(x) =
solve(h(x),x)
ans =
eq2=solve(h(x),x)
eq2 =
eq2(1)
ans =
real(eq2(1))
ans =
imag(eq2(1))
ans =
2*i+eq2(1)
ans =
eval(2*i+eq2(1))
ans =
-1.000000000000000 + 0.267949192431123i
eq1=x^4+3*x^2-7*x+6
eq1 =
solve(eq1)
ans =
%Next 2 lines find roots numerically w/o Symbolic Math Toolbox
5

p=[1 0 3 -7 6] % Coefficients of polynomial
p = 1×5
1 0 3 -7 6
roots(p)
ans = 4×1 complex
-0.901504513373339 + 2.062500852106431i
-0.901504513373339 - 2.062500852106431i
0.901504513373338 + 0.609517030381635i
0.901504513373338 - 0.609517030381635i
A.1 Question 3: Enter the commands given in MATLAB Example 3 and run
the output.
IMPORTANT: Delete the % from the % type SineTaylorSeries.m command line after function is created.
Important: SineTaylorSeries.m must be saved in the same directory as this template.
type SineTaylorSeries.m
function f=SineTaylorSeries(N,x1);
x=-x1:0.1:x1;
SinePlot=zeros(size(x));
for k=0:N
SinePlot = SinePlot + (-1)^k*x.^(2*k+1)/factorial(2*k+1);
end
plot(x,SinePlot,'b')
hold on
plot(x,sin(x),'r+')
hold off
end
SineTaylorSeries(2,3)
SineTaylorSeries(3,6)
6
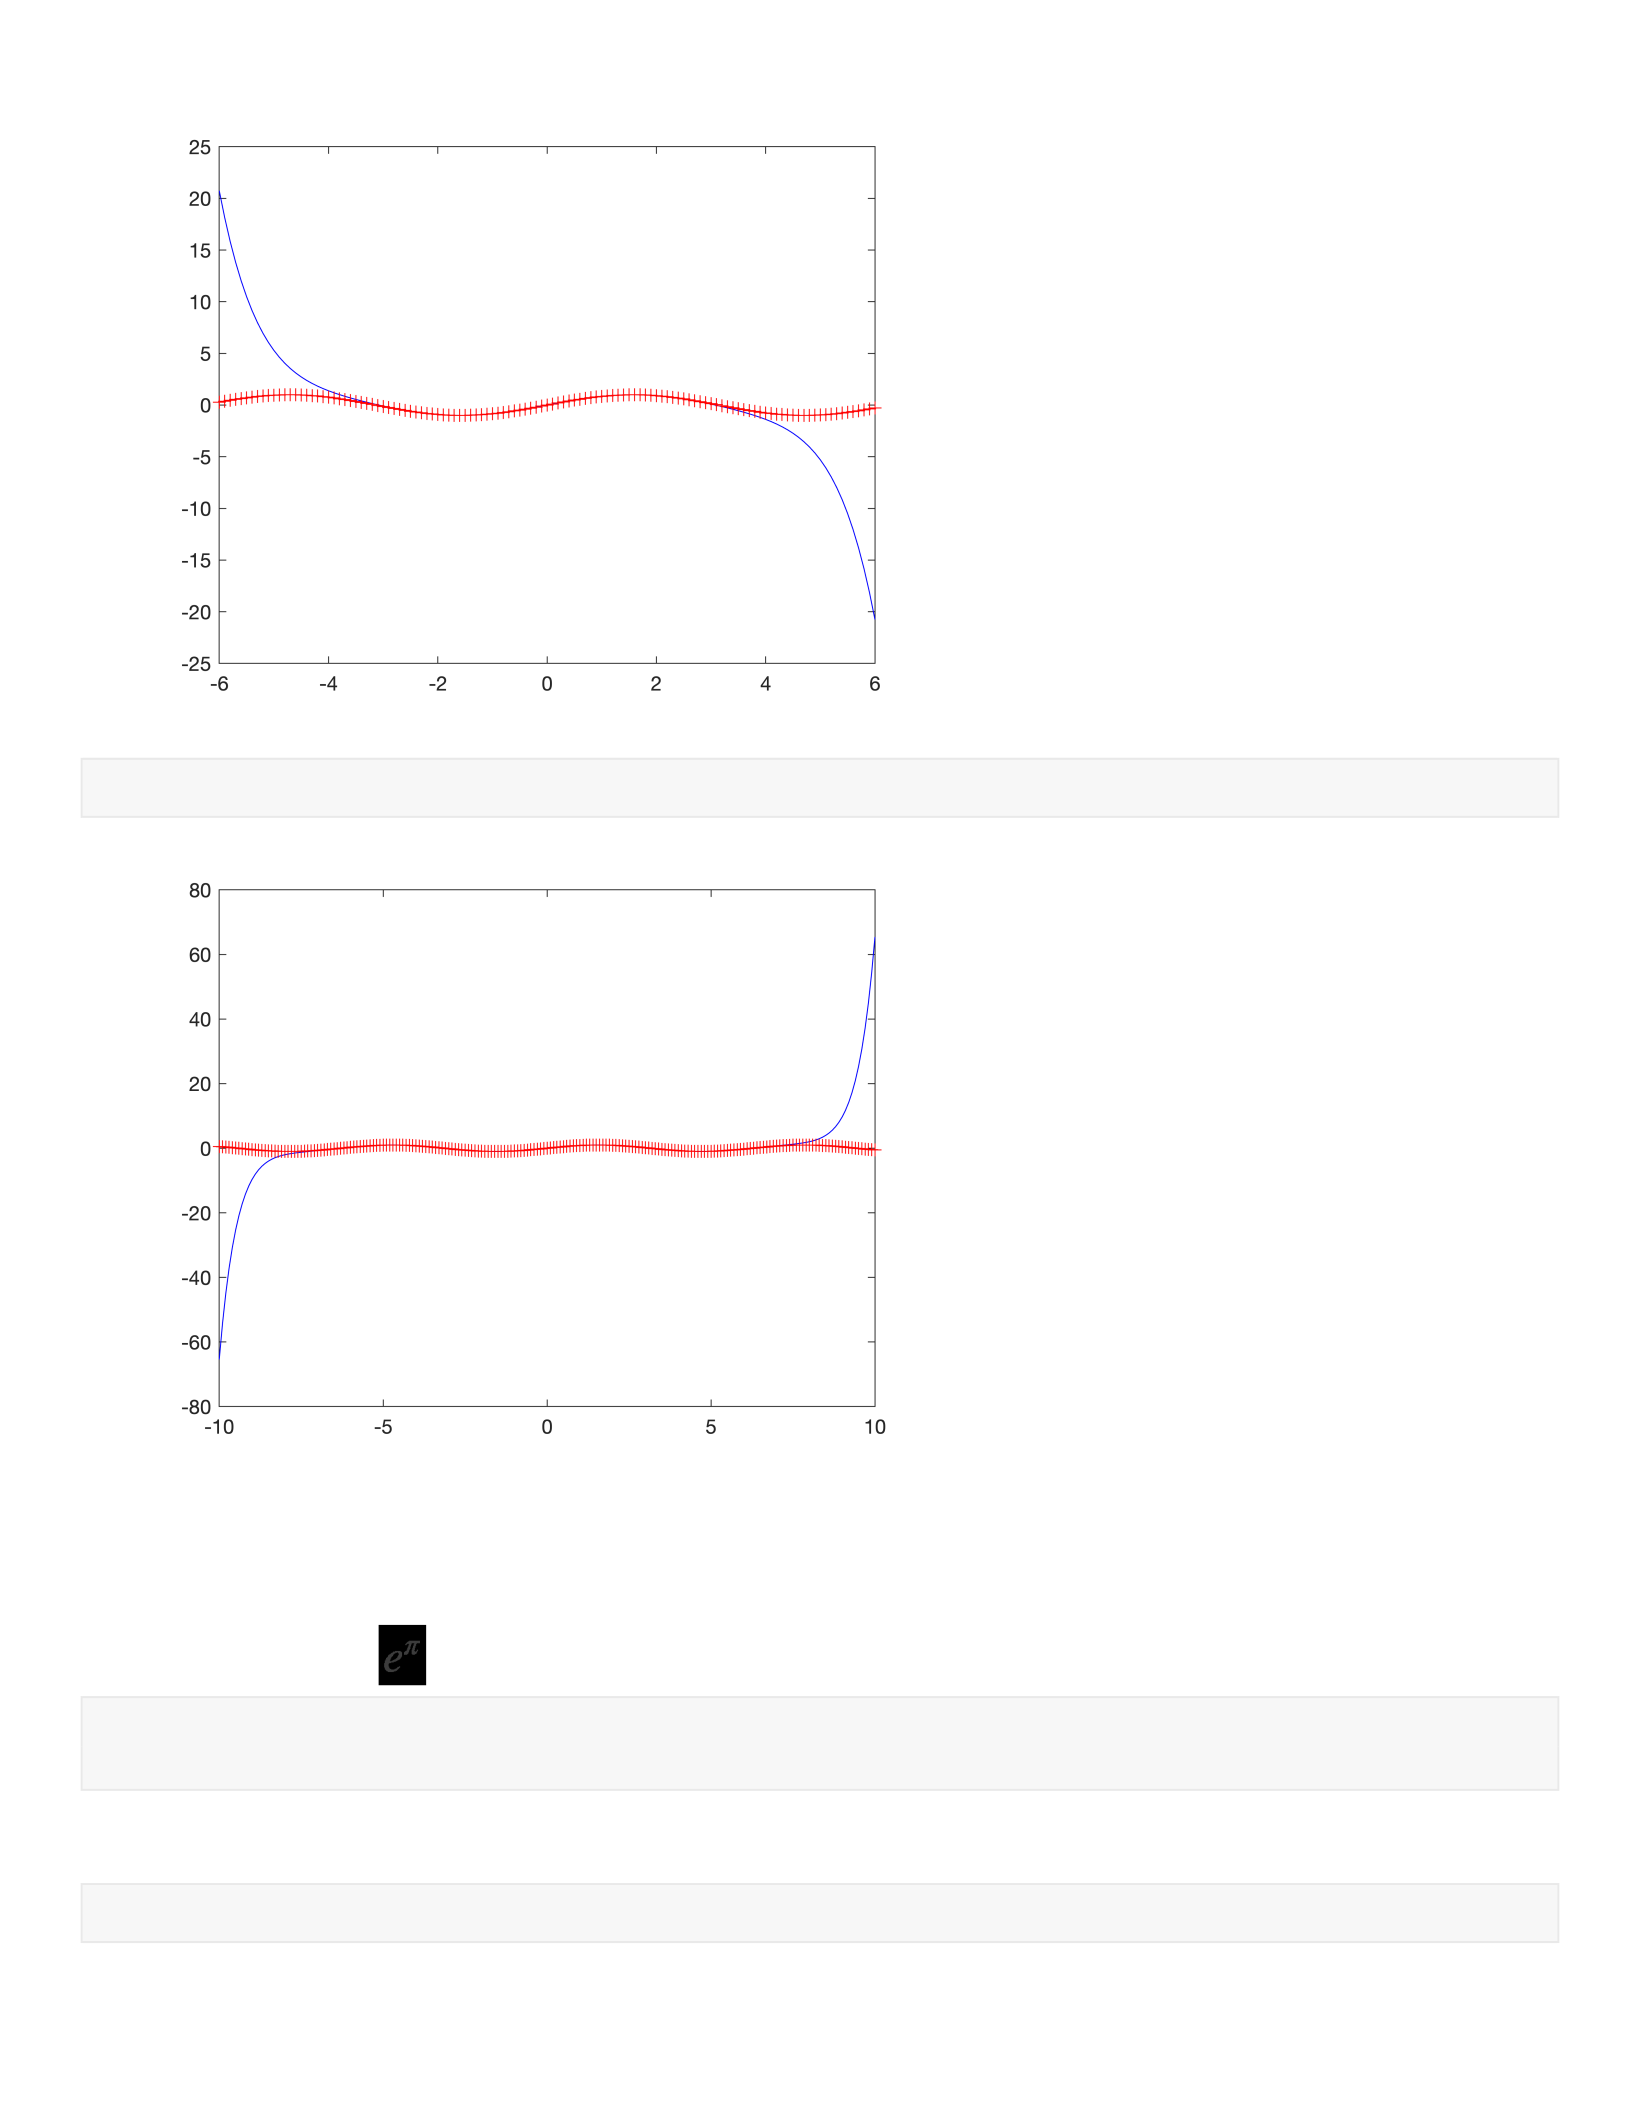
SineTaylorSeries(8,10)
A.1 Question 4:. Determine which is the larger value. (See question 4 in
book for functions). Use format long to write your answers correct to 12
decimal places.
format long
pi^exp(1)
ans =
22.459157718361052
exp(pi)
7
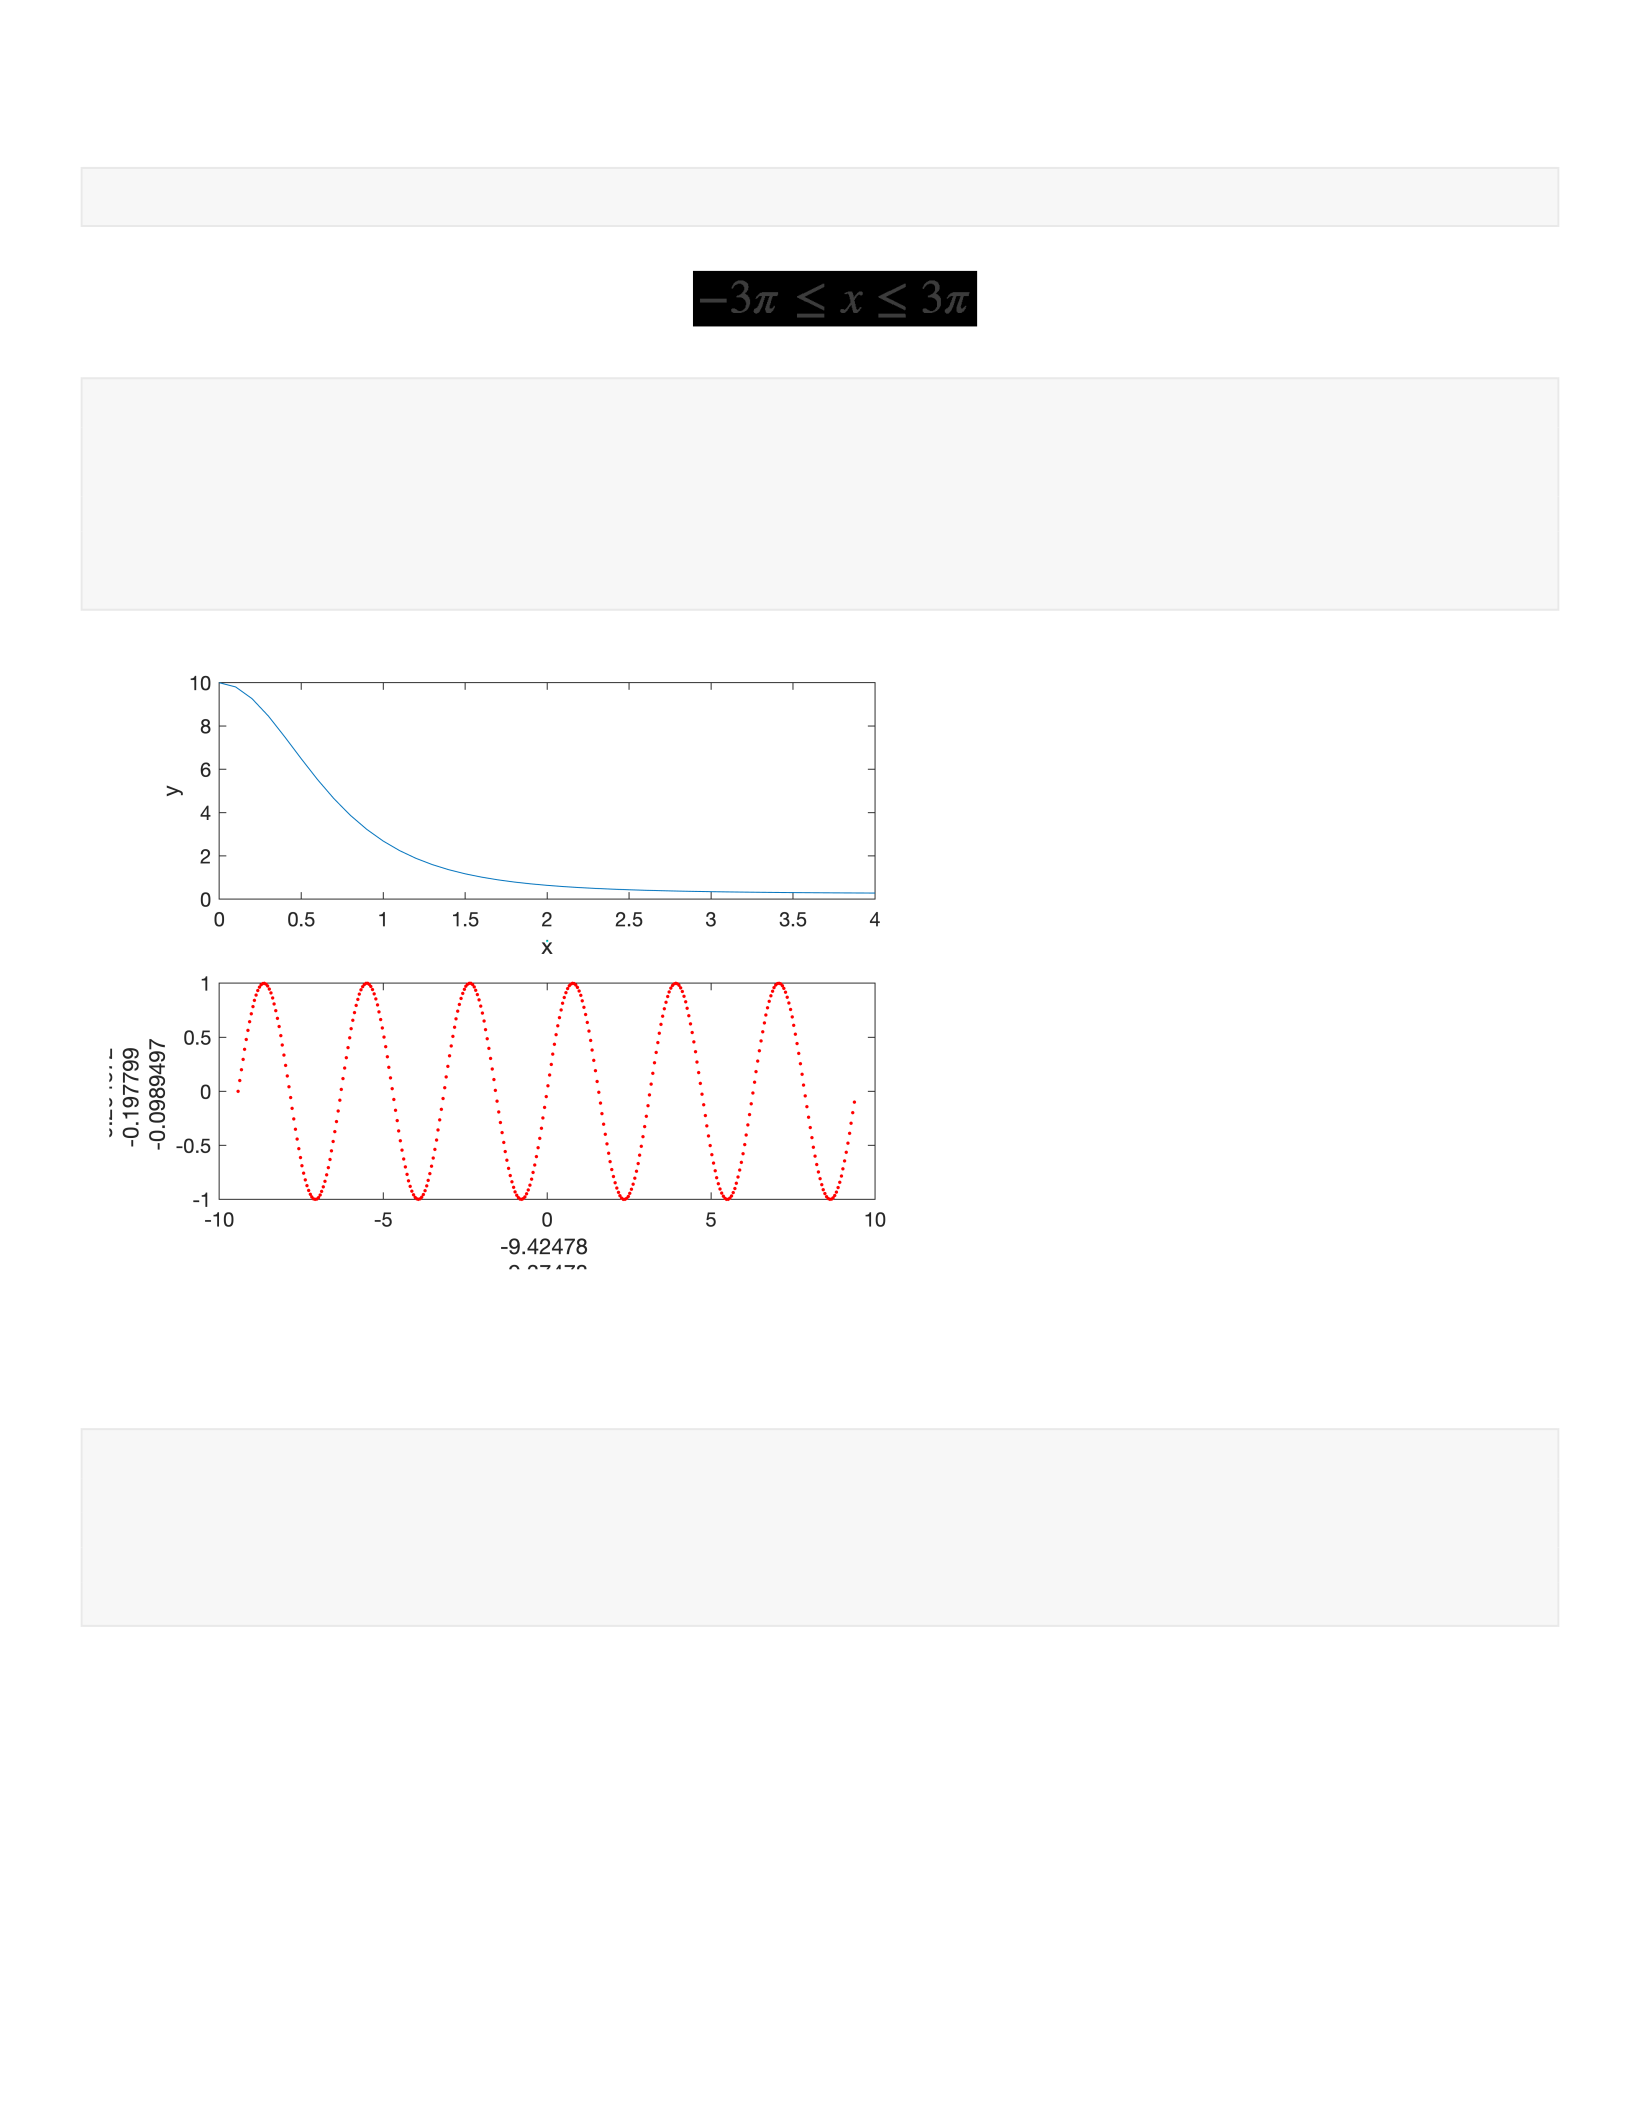
ans =
23.140692632779267
% exp(pi) has a larger value than pi^exp(1)
A.1 Question 6: Plot y = sin(2x), dotted and red. Label the
axes.
clear all;
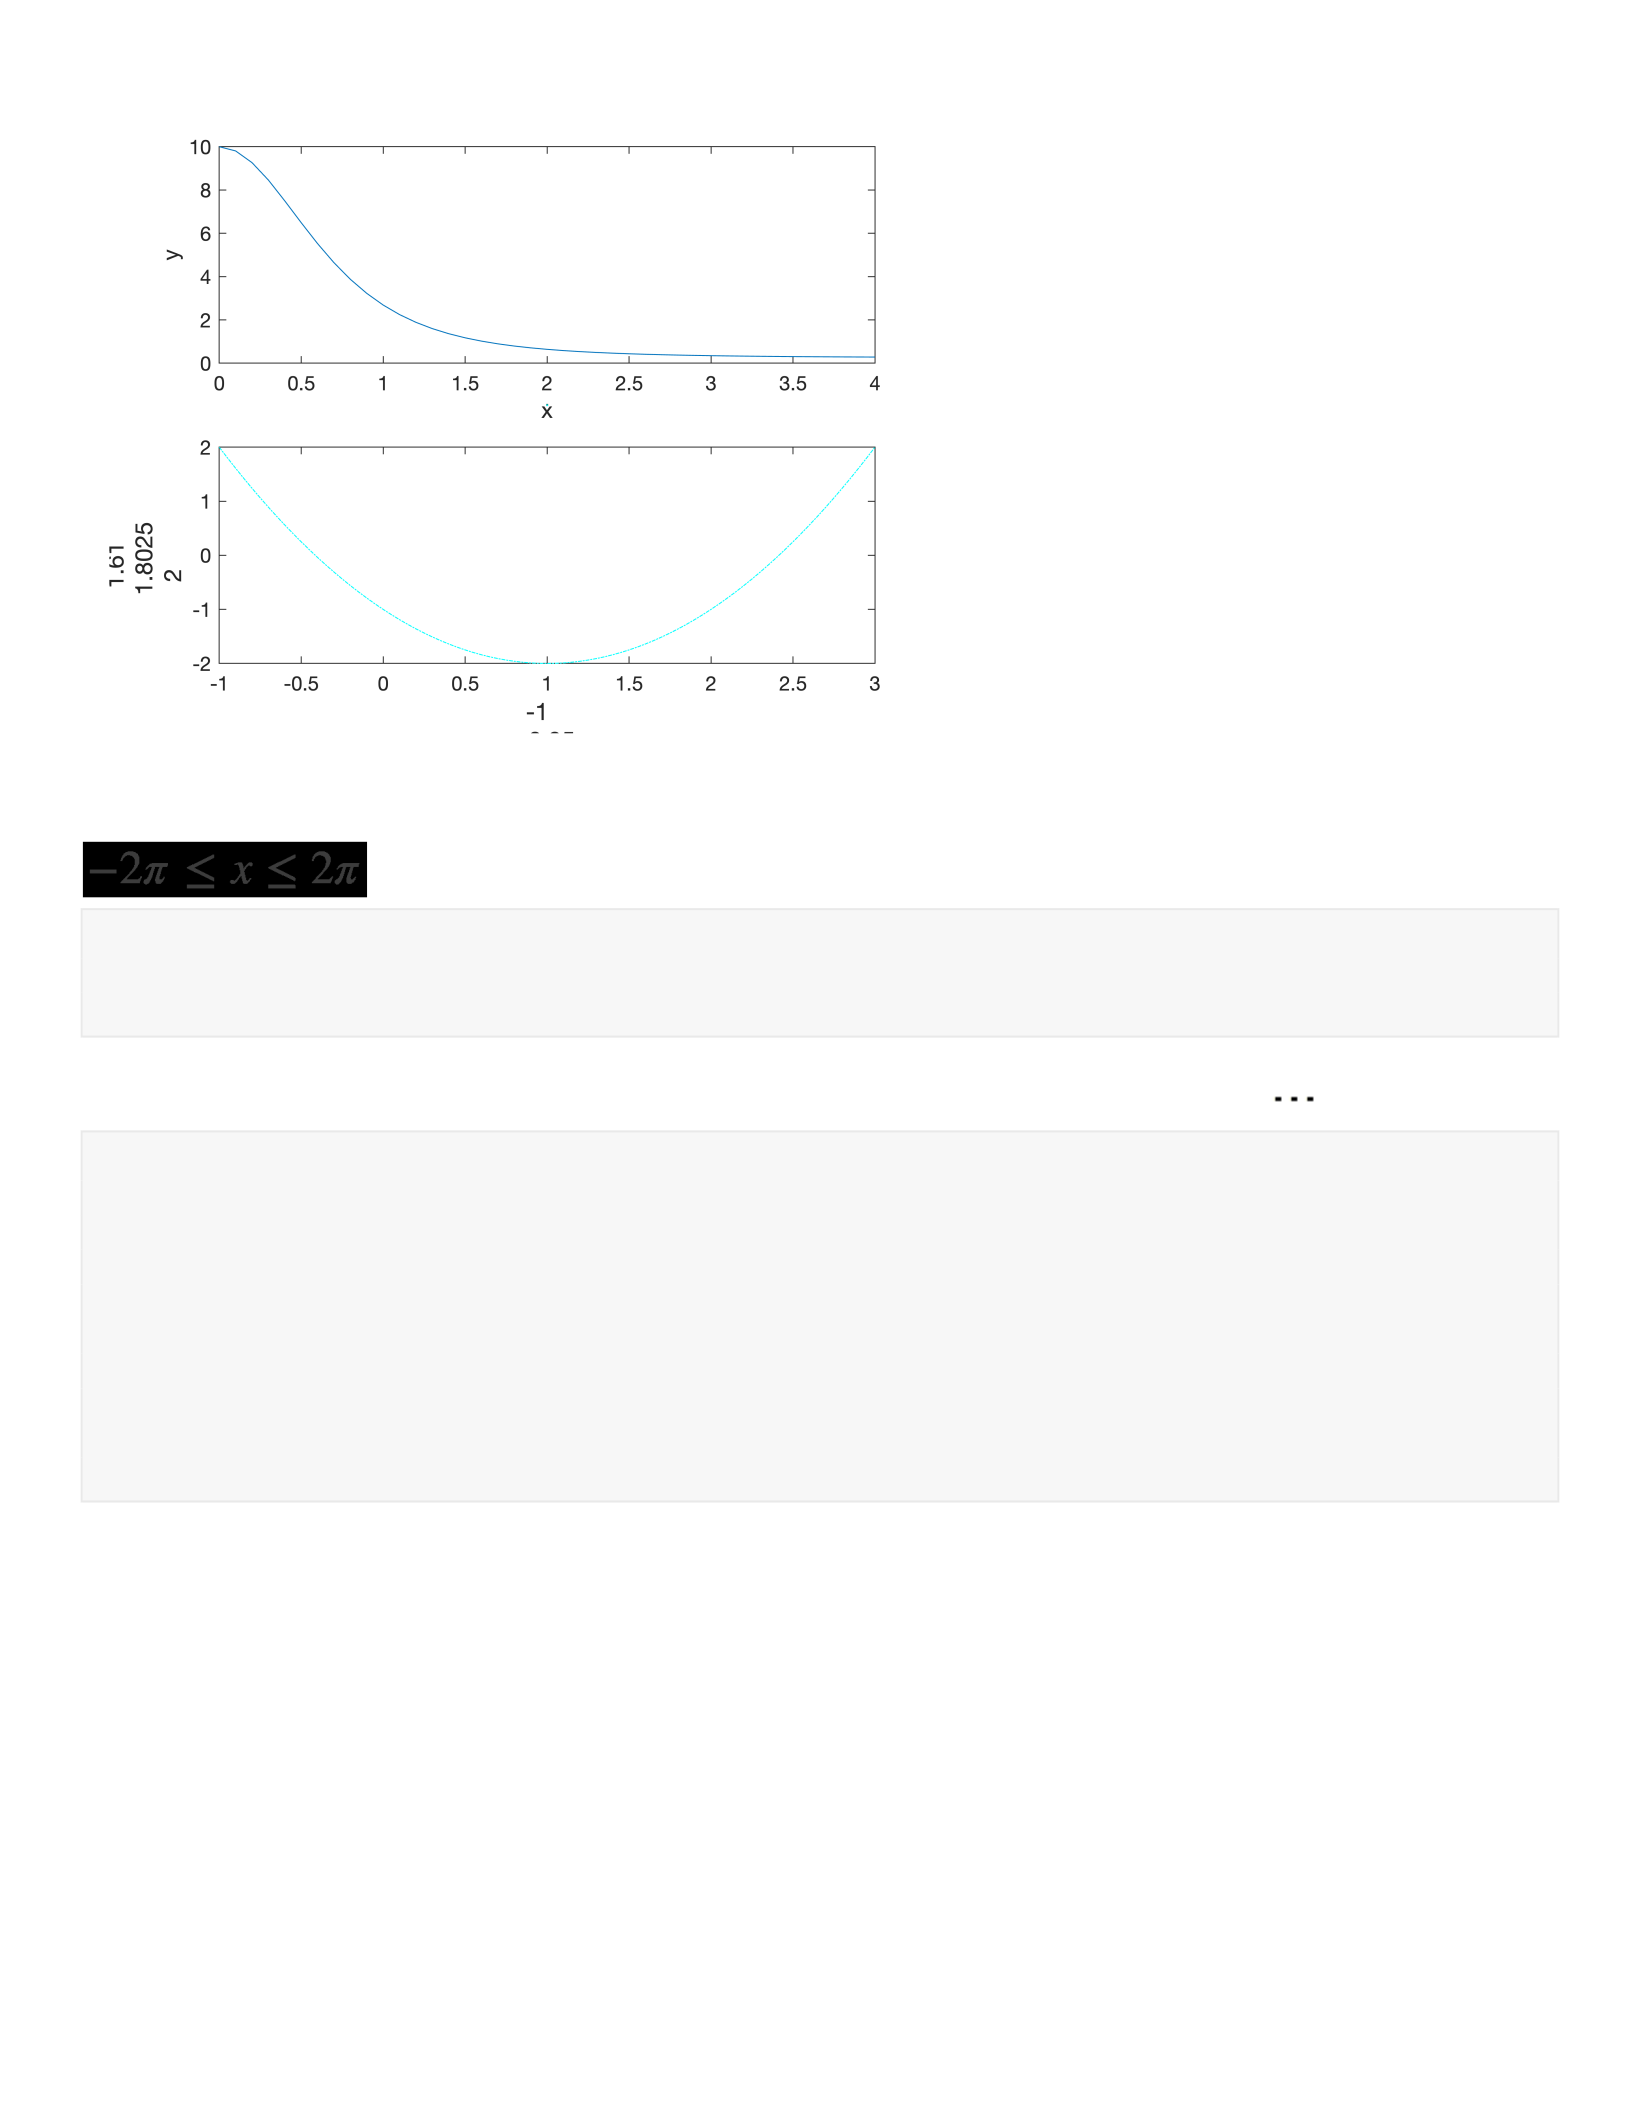
x= -3*pi:0.05:3*pi;
y= sin(2*x);
plot(x, y,'.r');
xlabel(x);
ylabel(y);
A.1 Question 7: Plot the function from Question 7 in book, dash-dot and
cyan. Label the axes.
x= -1:0.05:3;
y=(1-x).^2-2;
plot(x,y,'c-.');
xlabel(x,'FontSize',12);
ylabel(y,'FontSize',12);
8
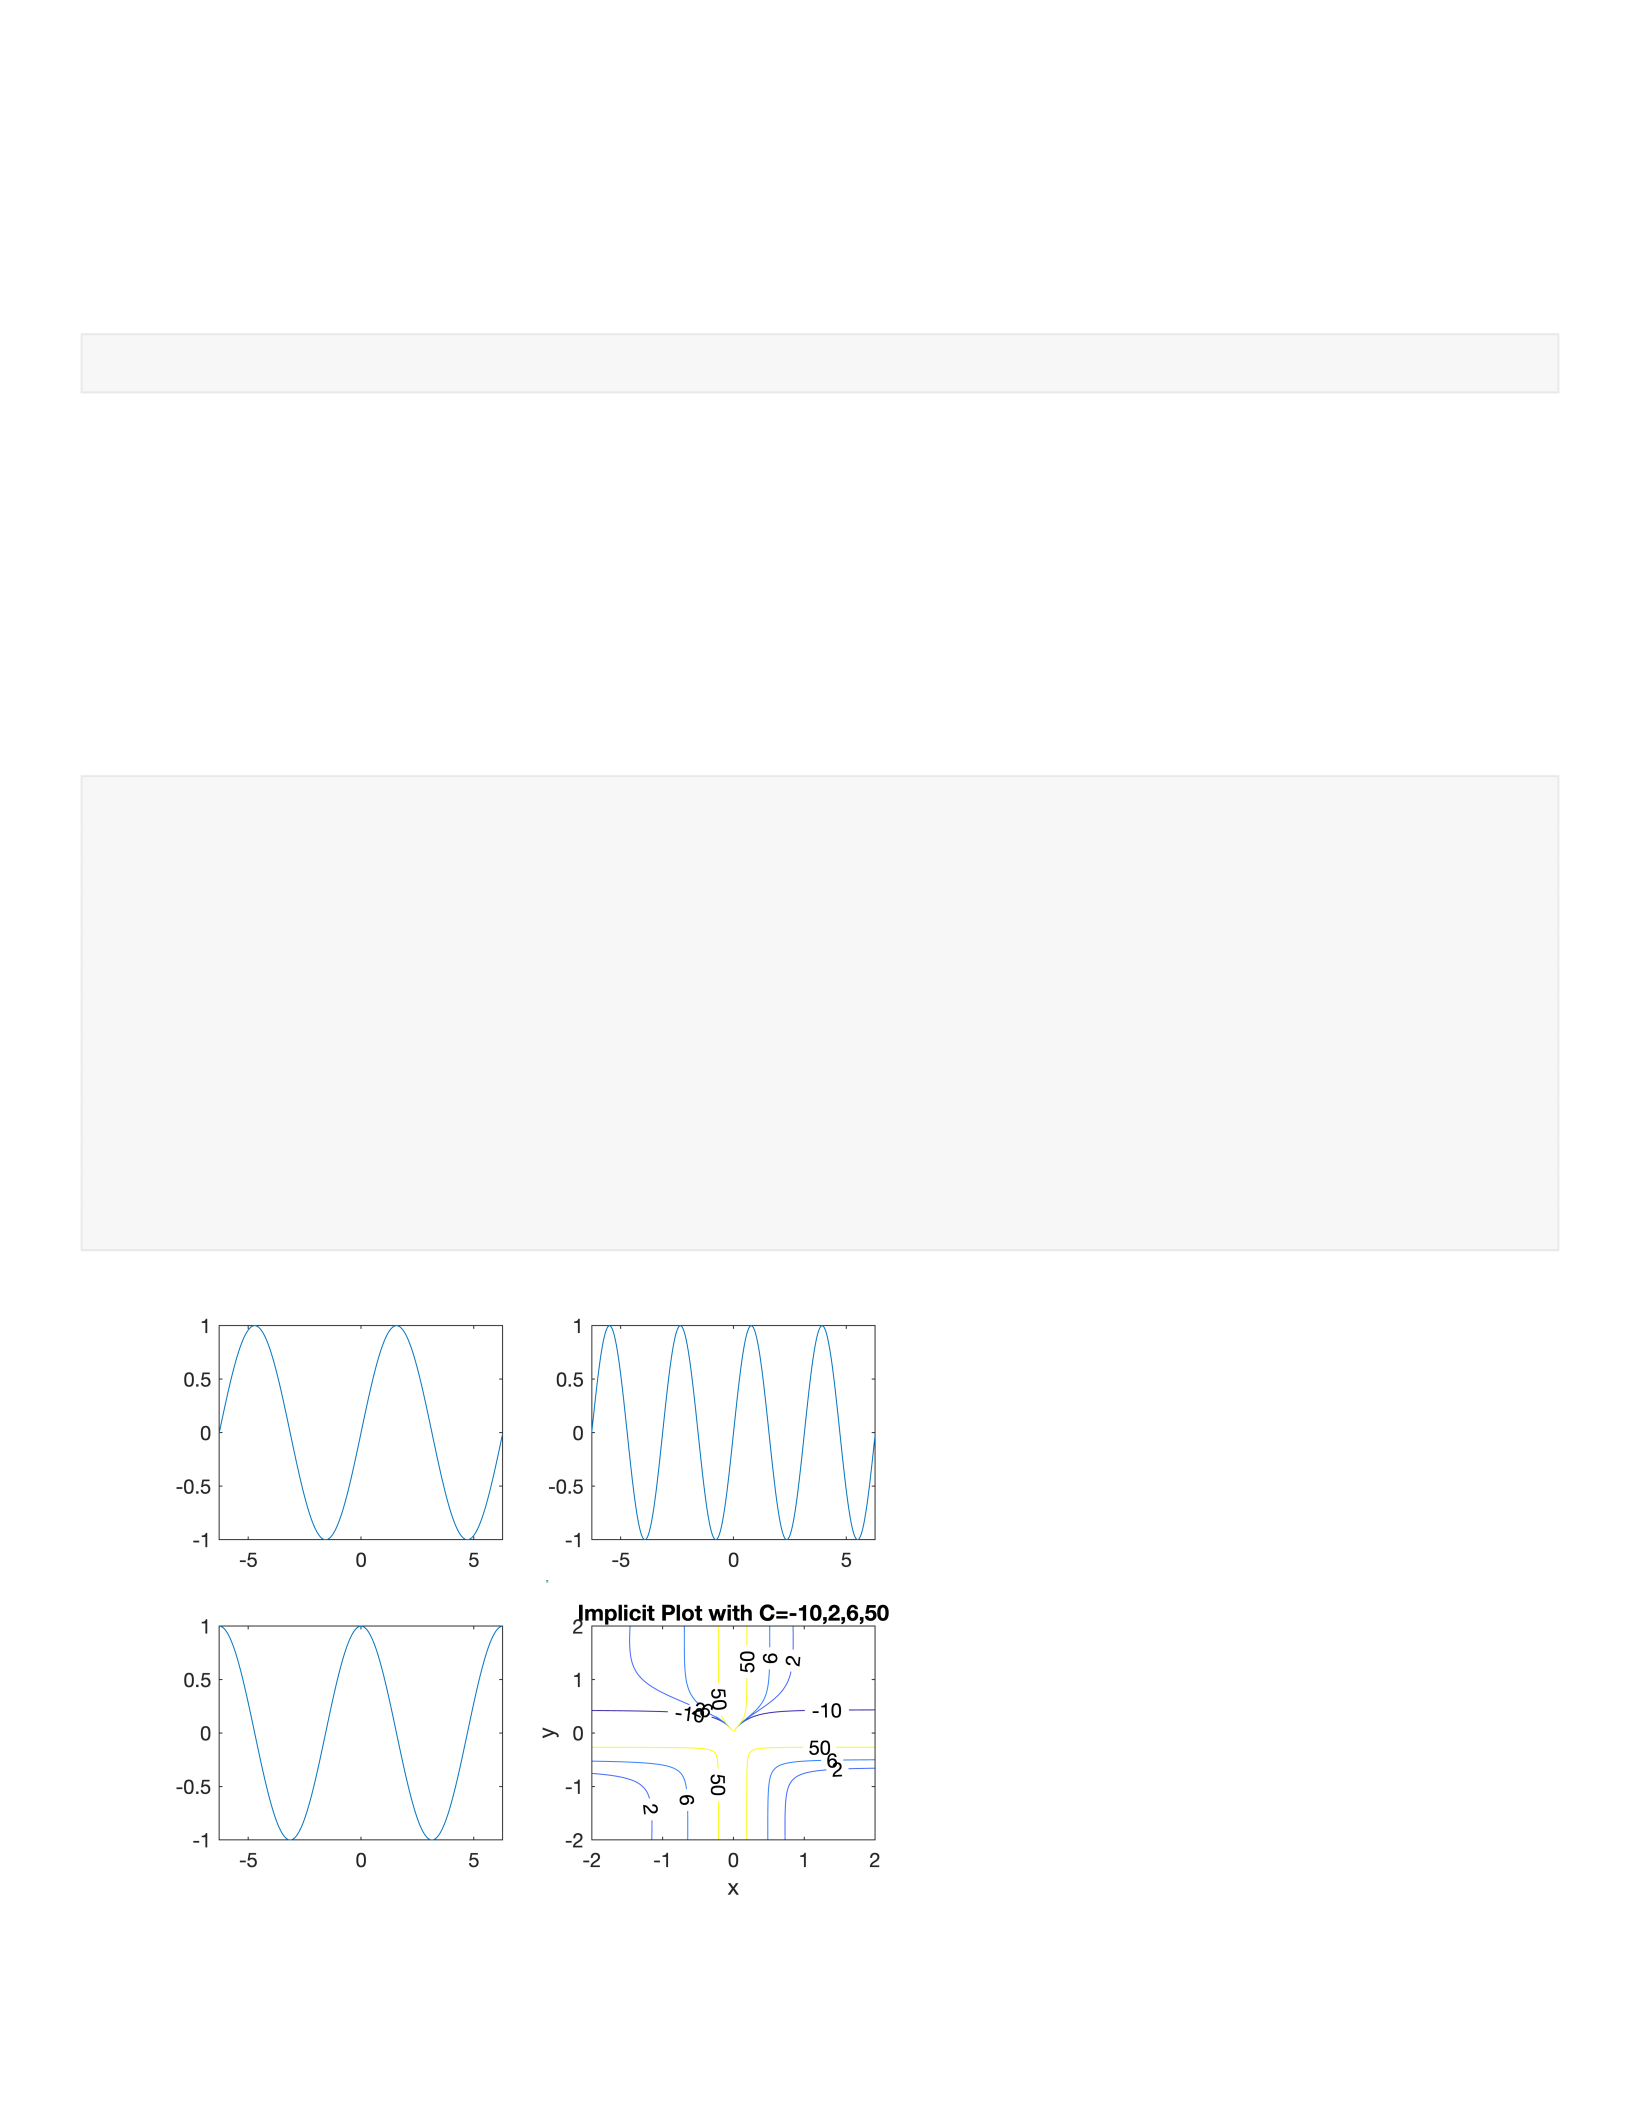
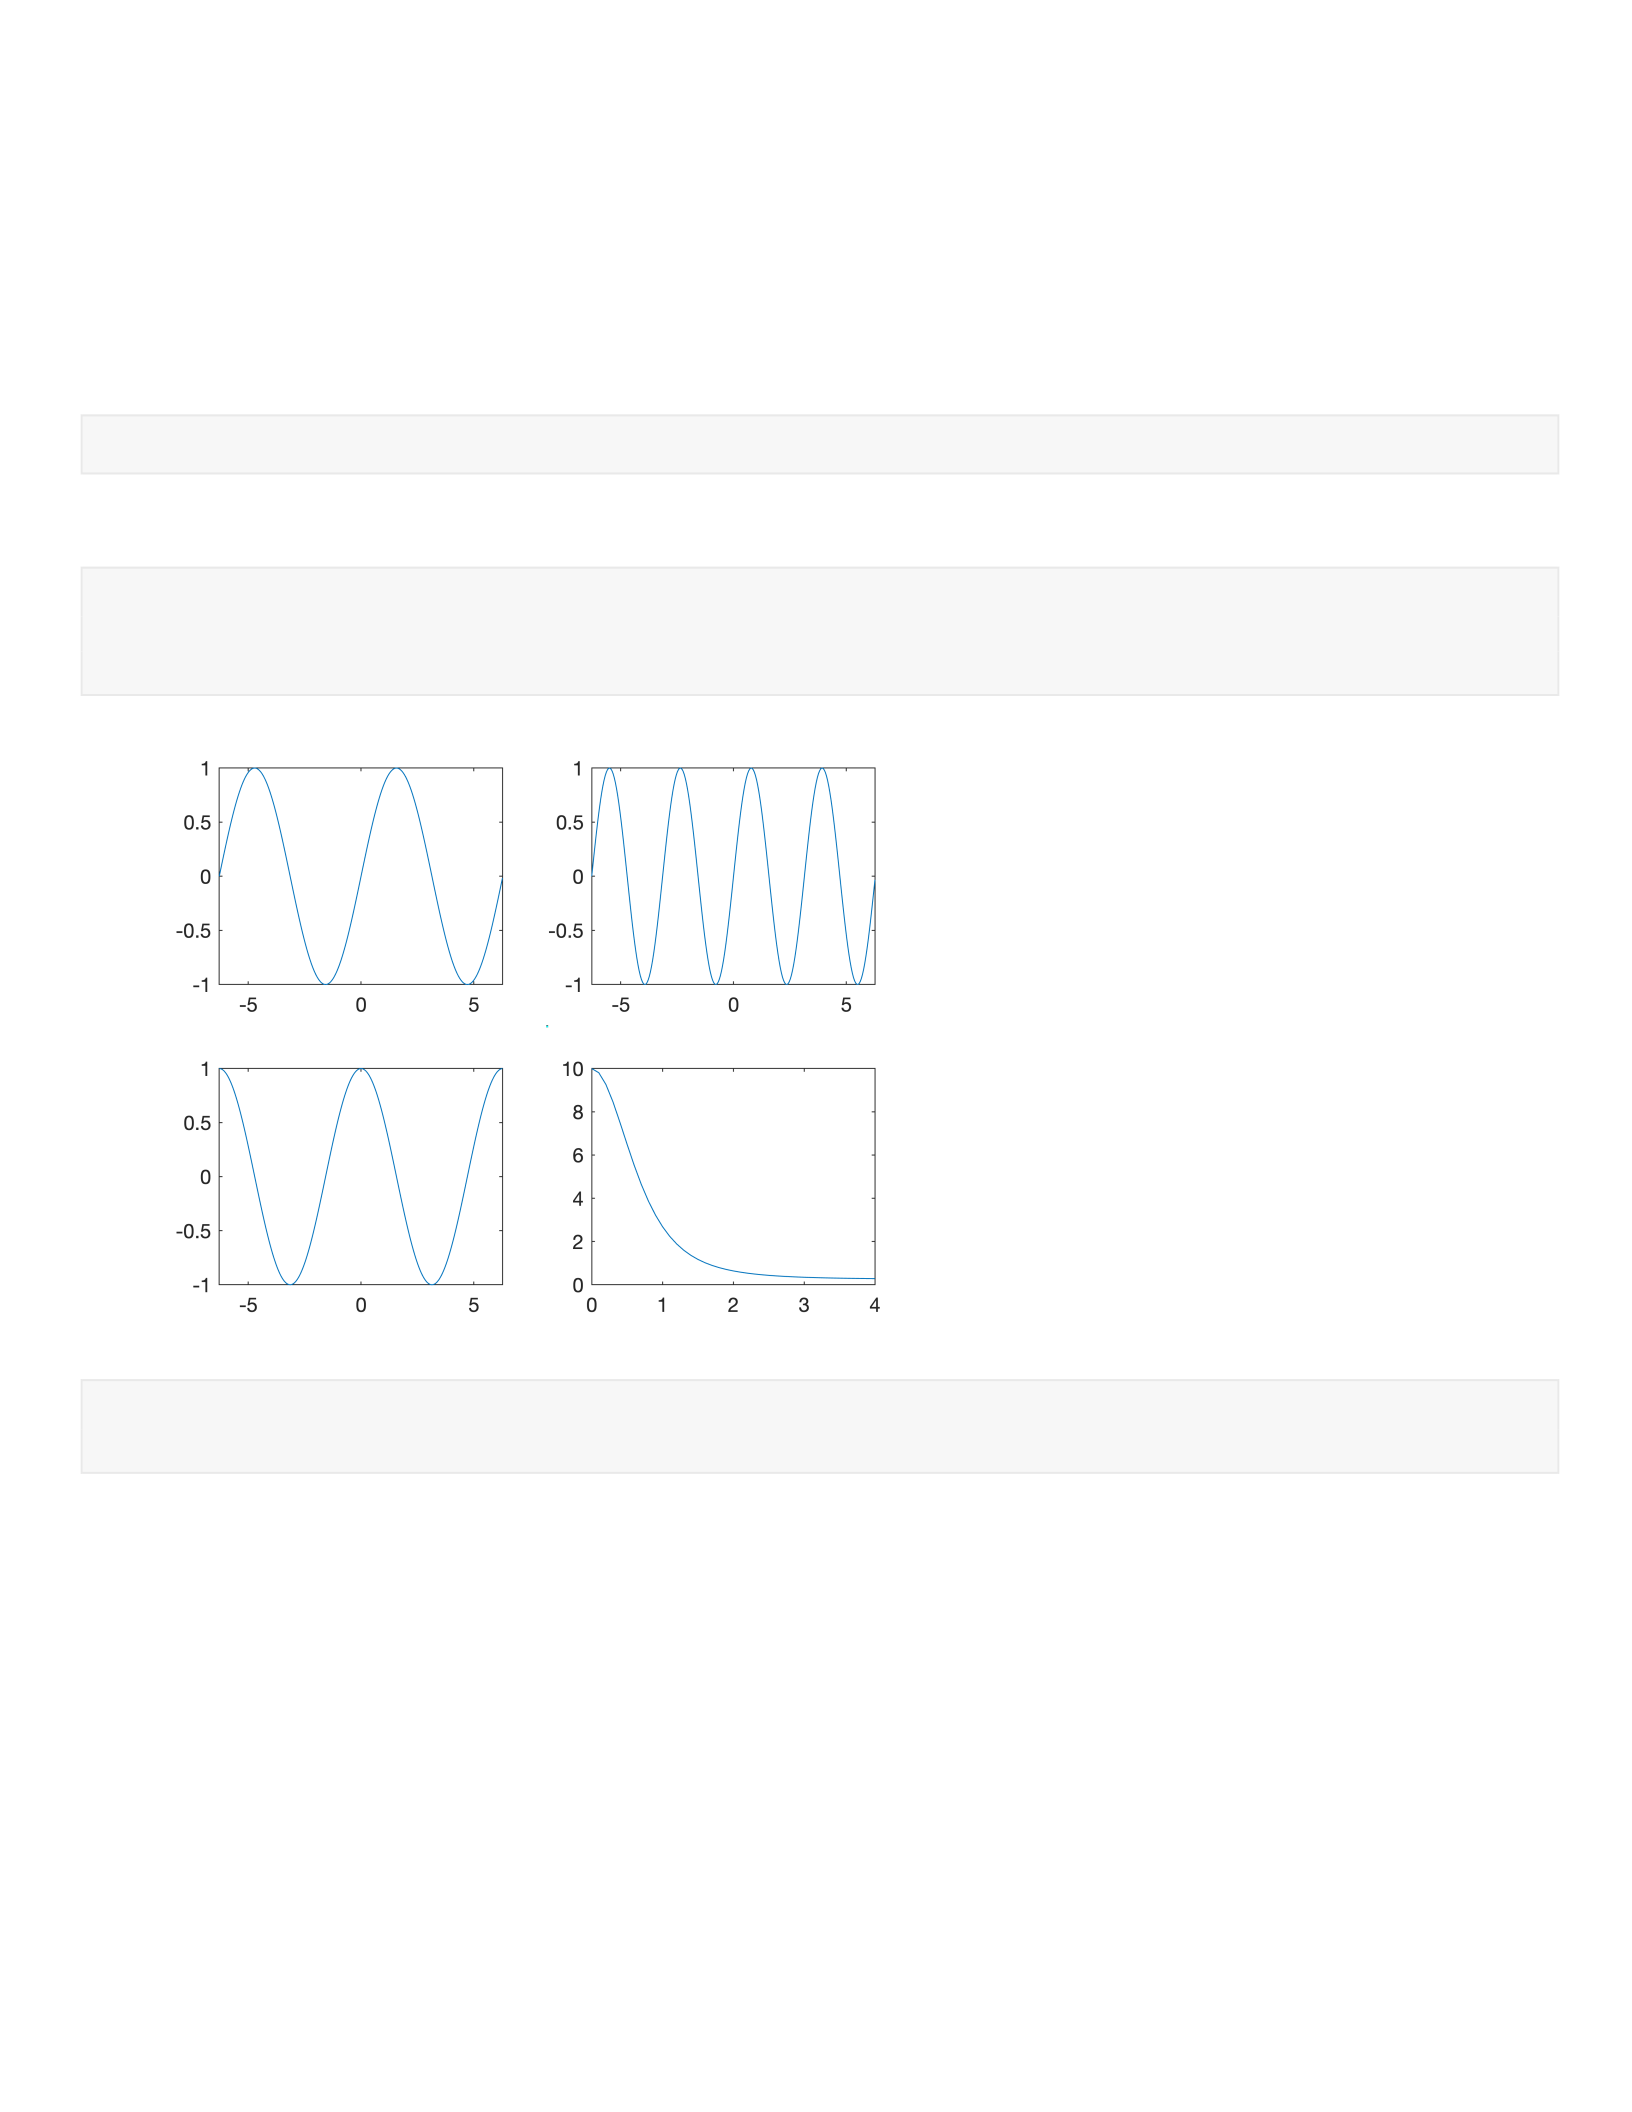
A.1 Question 12: Use subplot to plot y=sinx,sin(2x),cosx,cos(2x),
in 4 different subfigures (in the same window).
x = -2*pi:0.05:2*pi;
subplot(2,2,1);
y1 = sin(x)
y1 = 1×252
0.000000000000000 0.049979169270678 0.099833416646828 0.149438132473600
plot(x,y1);
subplot(2,2,2);
y2 = sin(2*x);
plot(x,y2);
subplot(2,2,3);
y3 = cos(x);
plot(x,y3);
subplot(2,2,4);
y4 = cos(2*x);
plot(x,y4);
9

A.1 Question 13: Superimpose the plots of functions in Question 13 of book
in the same figure.
clear all;
x = 0.1:0.05:10;
y1=atan(x);
y2= sin(1./x);
plot(x,y1);
hold on;
plot(x,y2);
hold off;
10
A.1 Question 18: Write a MATLAB Function that will calculate the first N
terms of the series for Question 18 in book. Save it as harmonic_series.m.
Run the code for N = 100, 1000, 10000.
IMPORTANT: Delete the % from the % type harmonic_series.m command line after function is created.
NOTE: harmonic_series.m must be saved in the same directory as this script.
type harmonic_series.m
N=input("number of terms you want to add: ");
s=0;
for n=1:N
s = s+1/n;
end
s
Chapter 1 Computer MatLab Question 3: Enter the commands given in
MATLAB Example 3 and run output. This code demonstrates how to plot
an implicit function.
clear all;
[X,Y]=meshgrid(-2:.01:2,-2:.01:2);
Z=-1./X+2./X.^2+1./Y-1./Y.^3;
contour(X,Y,Z,[-5 -5])
[C,h]=contour(X,Y,Z,[-5 -5]);
clabel(C,h)
axis([-2 2 0 0.6])
xlabel('x'), ylabel('y')
title('Implicit Plot with C=-5')
[C,h]=contour(X,Y,Z,[-10,2,6,50]);
clabel(C,h)
xlabel('x'), ylabel('y')
title('Implicit Plot with C=-10,2,6,50')
11
Chapter 1 Computer MatLab Question 4: Enter the commands given
in MATLAB Example 4 and run output. This code uses ode45 to plot
approximate numerical solutions.
You must create a separate file call Example4.m as shown. Note that this must be saved in the same directory
as this script.
IMPORTANT: Delete the % from the % type Example4.m command line after function is created.
type Example4.m
function dydx=Example4(xn,yn)
dydx=(xn-4*xn*yn)/(xn^2+1);
clear all;
[x,y]=ode45(@Example4,[0,4],10);
plot(x,y)
subplot(2,1,1),plot(x,y)
xlabel('x'), ylabel('y')
12
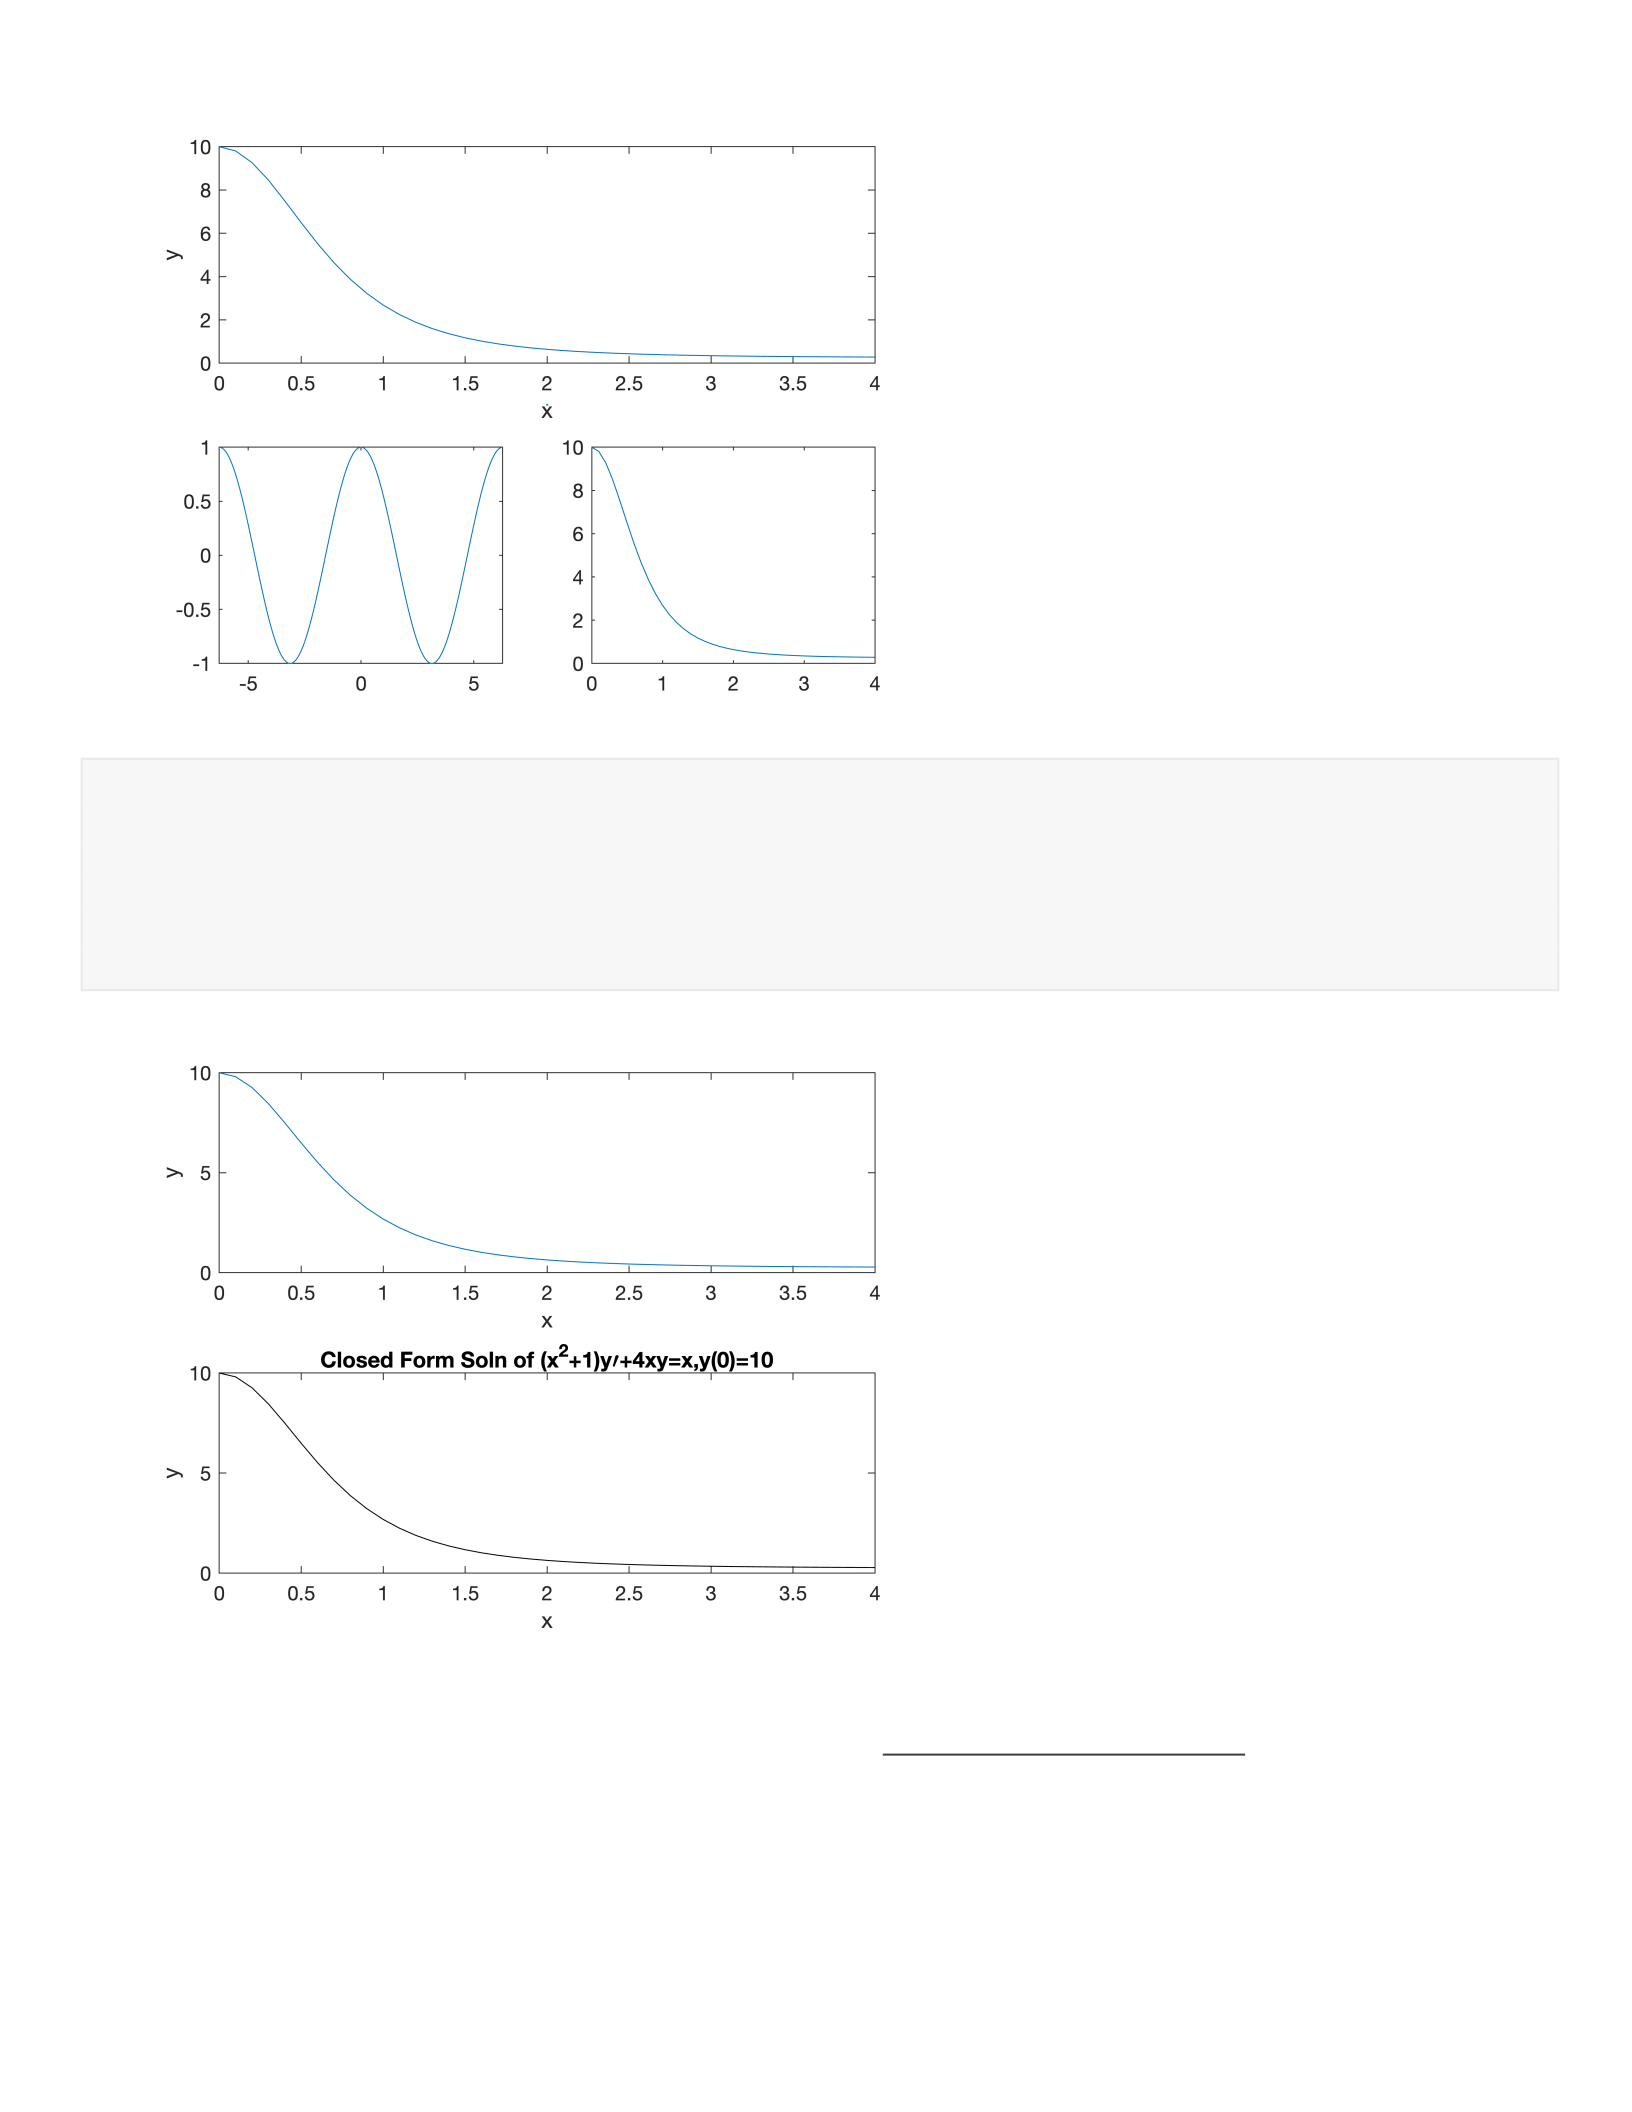
x1=0:.1:4;
y1=((1/4)*x1.^4+(1/2)*x1.^2+10)./(x1.^2+1).^2;
subplot(2,1,2)
plot(x1,y1,'k')
title('Closed Form Soln of (x^2+1)y{\prime}+4xy=x,y(0)=10')
xlabel('x'), ylabel('y')
Chapter 1 Computer MatLab Question 19: Symbolically verify (see Question
19 in book for ODE and solution to verify).
HINT: See Example 2 which demonstrates how to verify that a given function is a solution (possibly implicit) to
the differential equation.
13

clear all;
syms x
p=sin(x)+2*cos(x);
diff(p,2)+p
ans =
Chapter 1 Computer MatLab Question 22: Numerically solve (see Question
22 in book).
IMPORTANT: Delete the % from the % type Chapter1_22.m command line after function is created.
NOTE: Chapter1_22_series.m must be saved in the same directory as this script.
type Chapter1_22.m
syms y(x)
g = @(x)sin(x.^2);
x = [0 4];
plot(x,g(x));
Chapter 1 Computer MatLab Question 26: Solve for implicit solution and
plot. (see Question 26 in book).
syms y(x)
s=dsolve(y+x*diff(y)==y/(2*y-1))
s =
14

