


Lab 1 - Zachary Fiveash - MAT 275
Exercise 1
% NOTE: Please suppress output--i.e., use a semicolon ';' at the end of any
% commands for which the output is not necessary to answer the question.
% Delete these notes before turning in.
% Define input variable theta as discretized row vector (i.e., array).
theta = [0,pi/8,pi/6,pi/5,(6*pi)/5,(7*pi)/6,(8*pi)/7];
% Define radius.
r = 4;
% Define x and y in terms of theta and r.
x = r*cos(theta);
y = r*sin(theta);
% Check that x and y satisfy the equation of a circle.
r1 = sqrt(x.^2+y.^2)
Explain results here. Do x and y satisfy the equation of a circle? Why or why not? How does the
vector output at the end confirm your answer?
Yes, the results confirm that x and y satisfy the equation of the circle. Both r and r1 equal 4 which
confirms this answer.
Exercise 2
% Define t-vector.
t = 4:0.2:20;
% Define y-vector.
y = exp(t/15).*cos(2.*t)/(0.2.*t.^2+14)
Part (a)
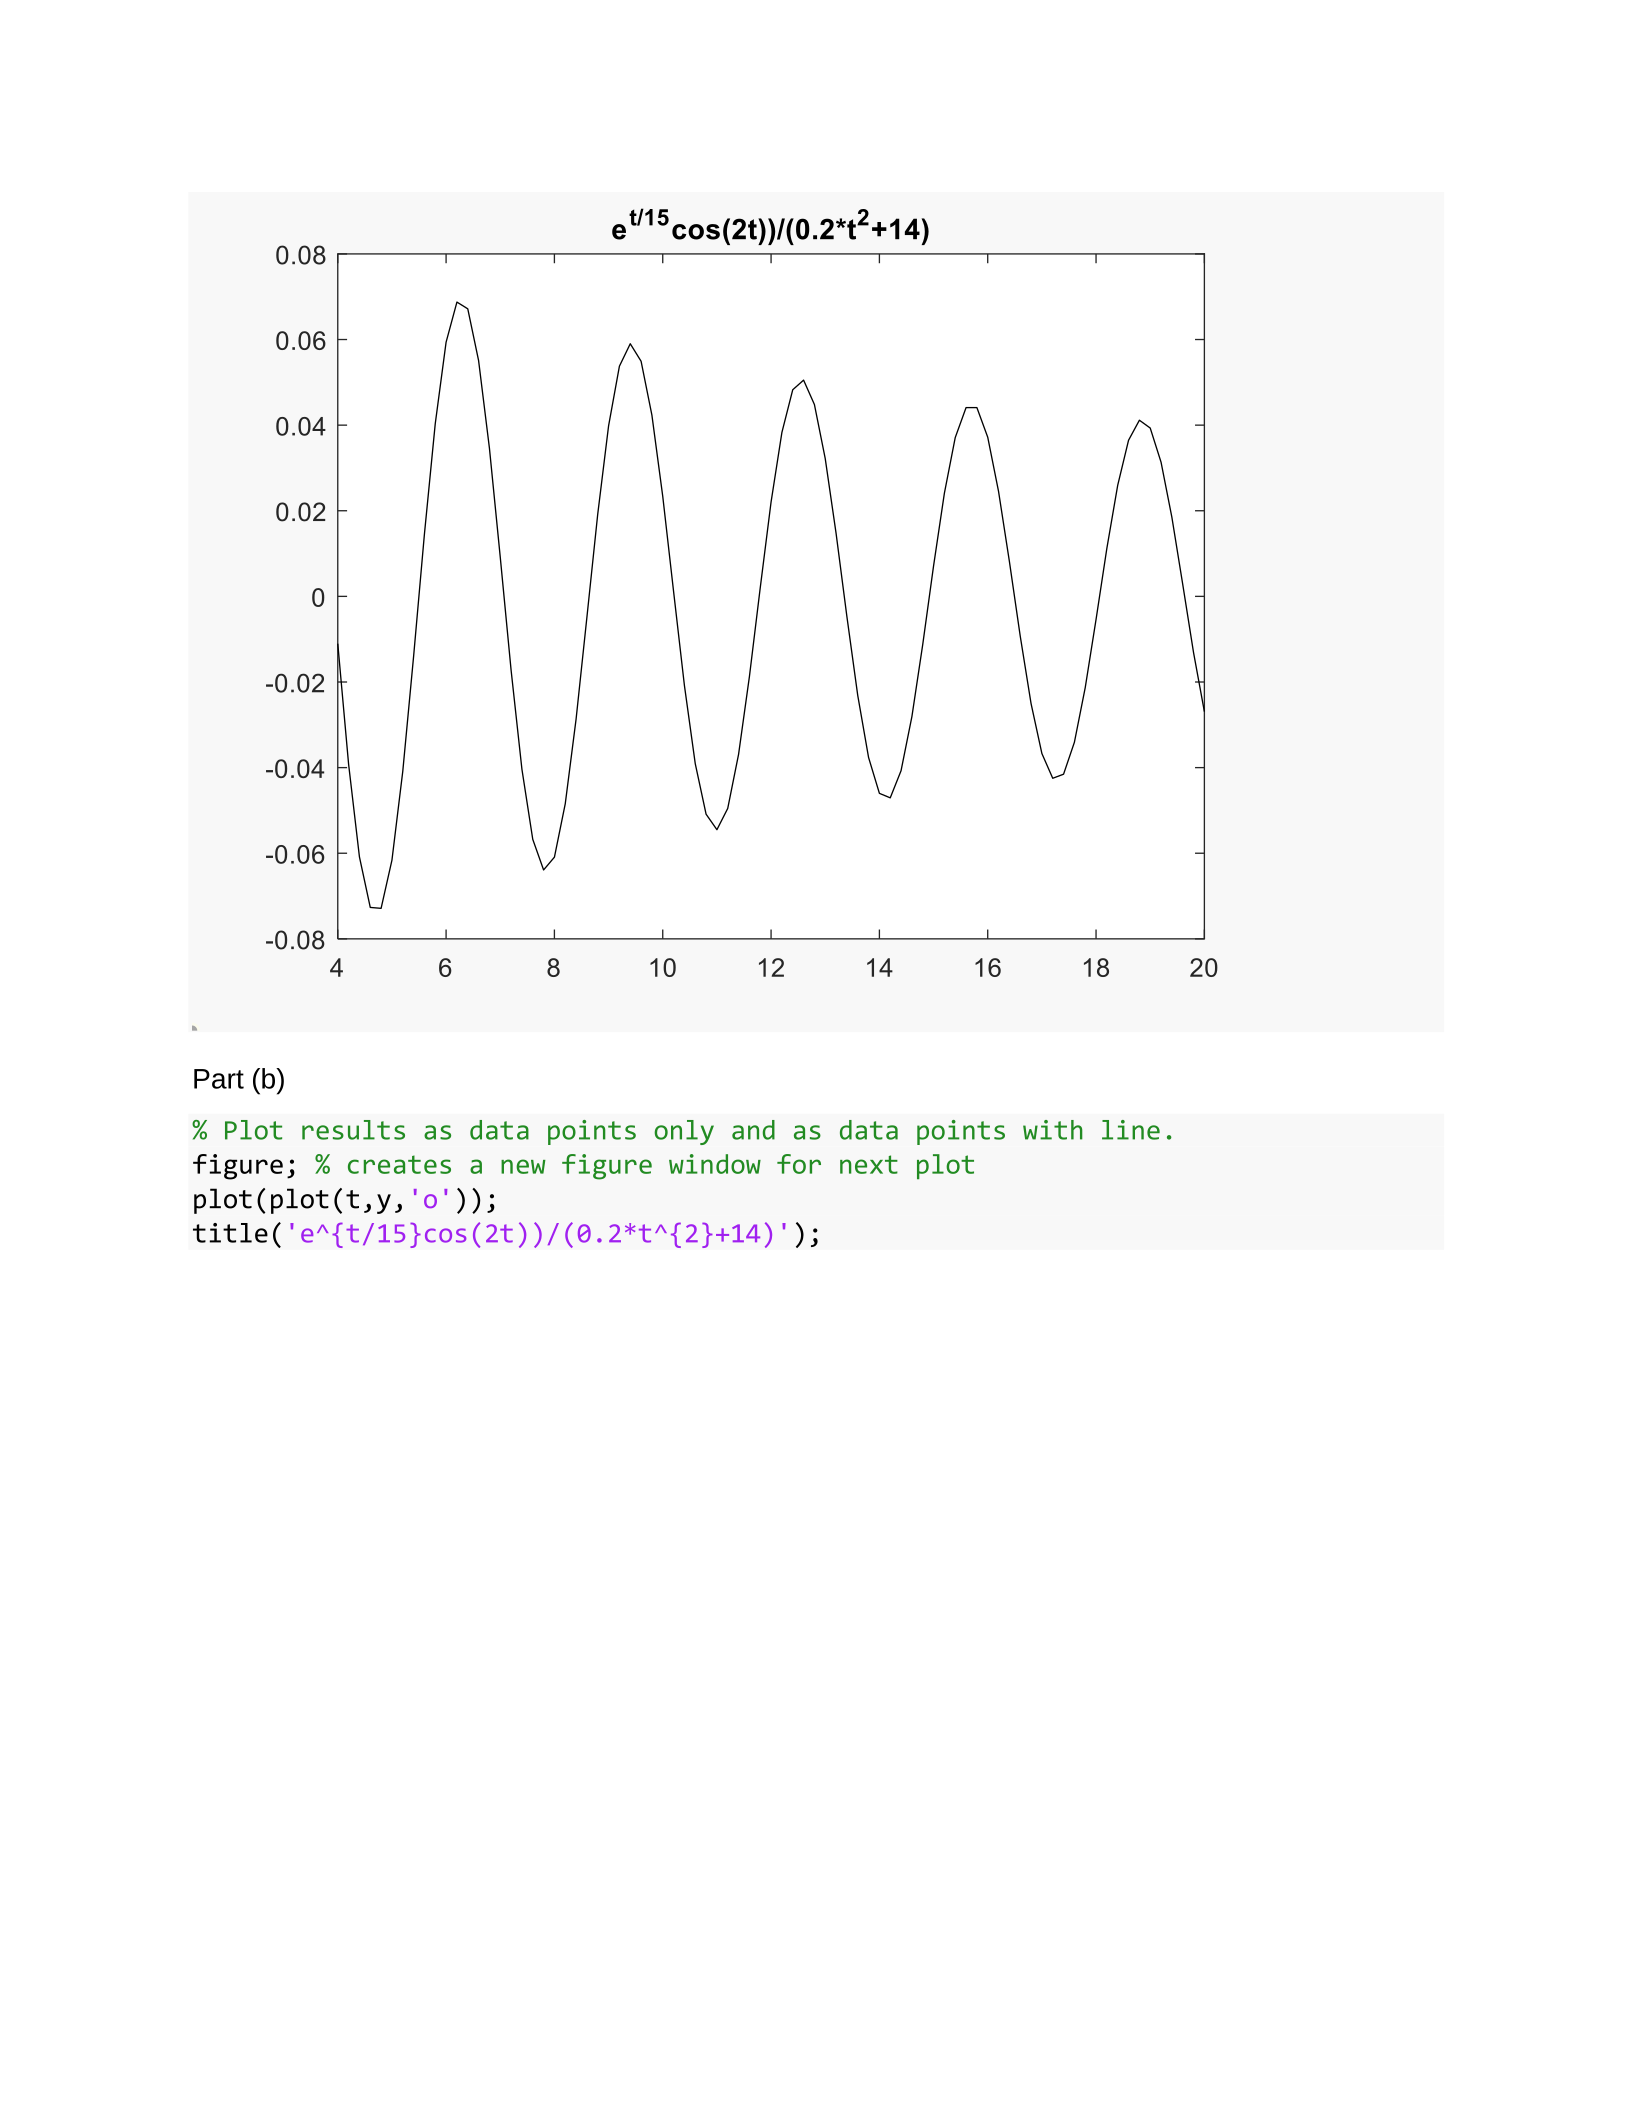
% Plot results (should have 3 plots total).
figure;
plot(t,y,'k');
title('e^{t/15}cos(2t))/(0.2*t^{2}+14)');
Part (b)
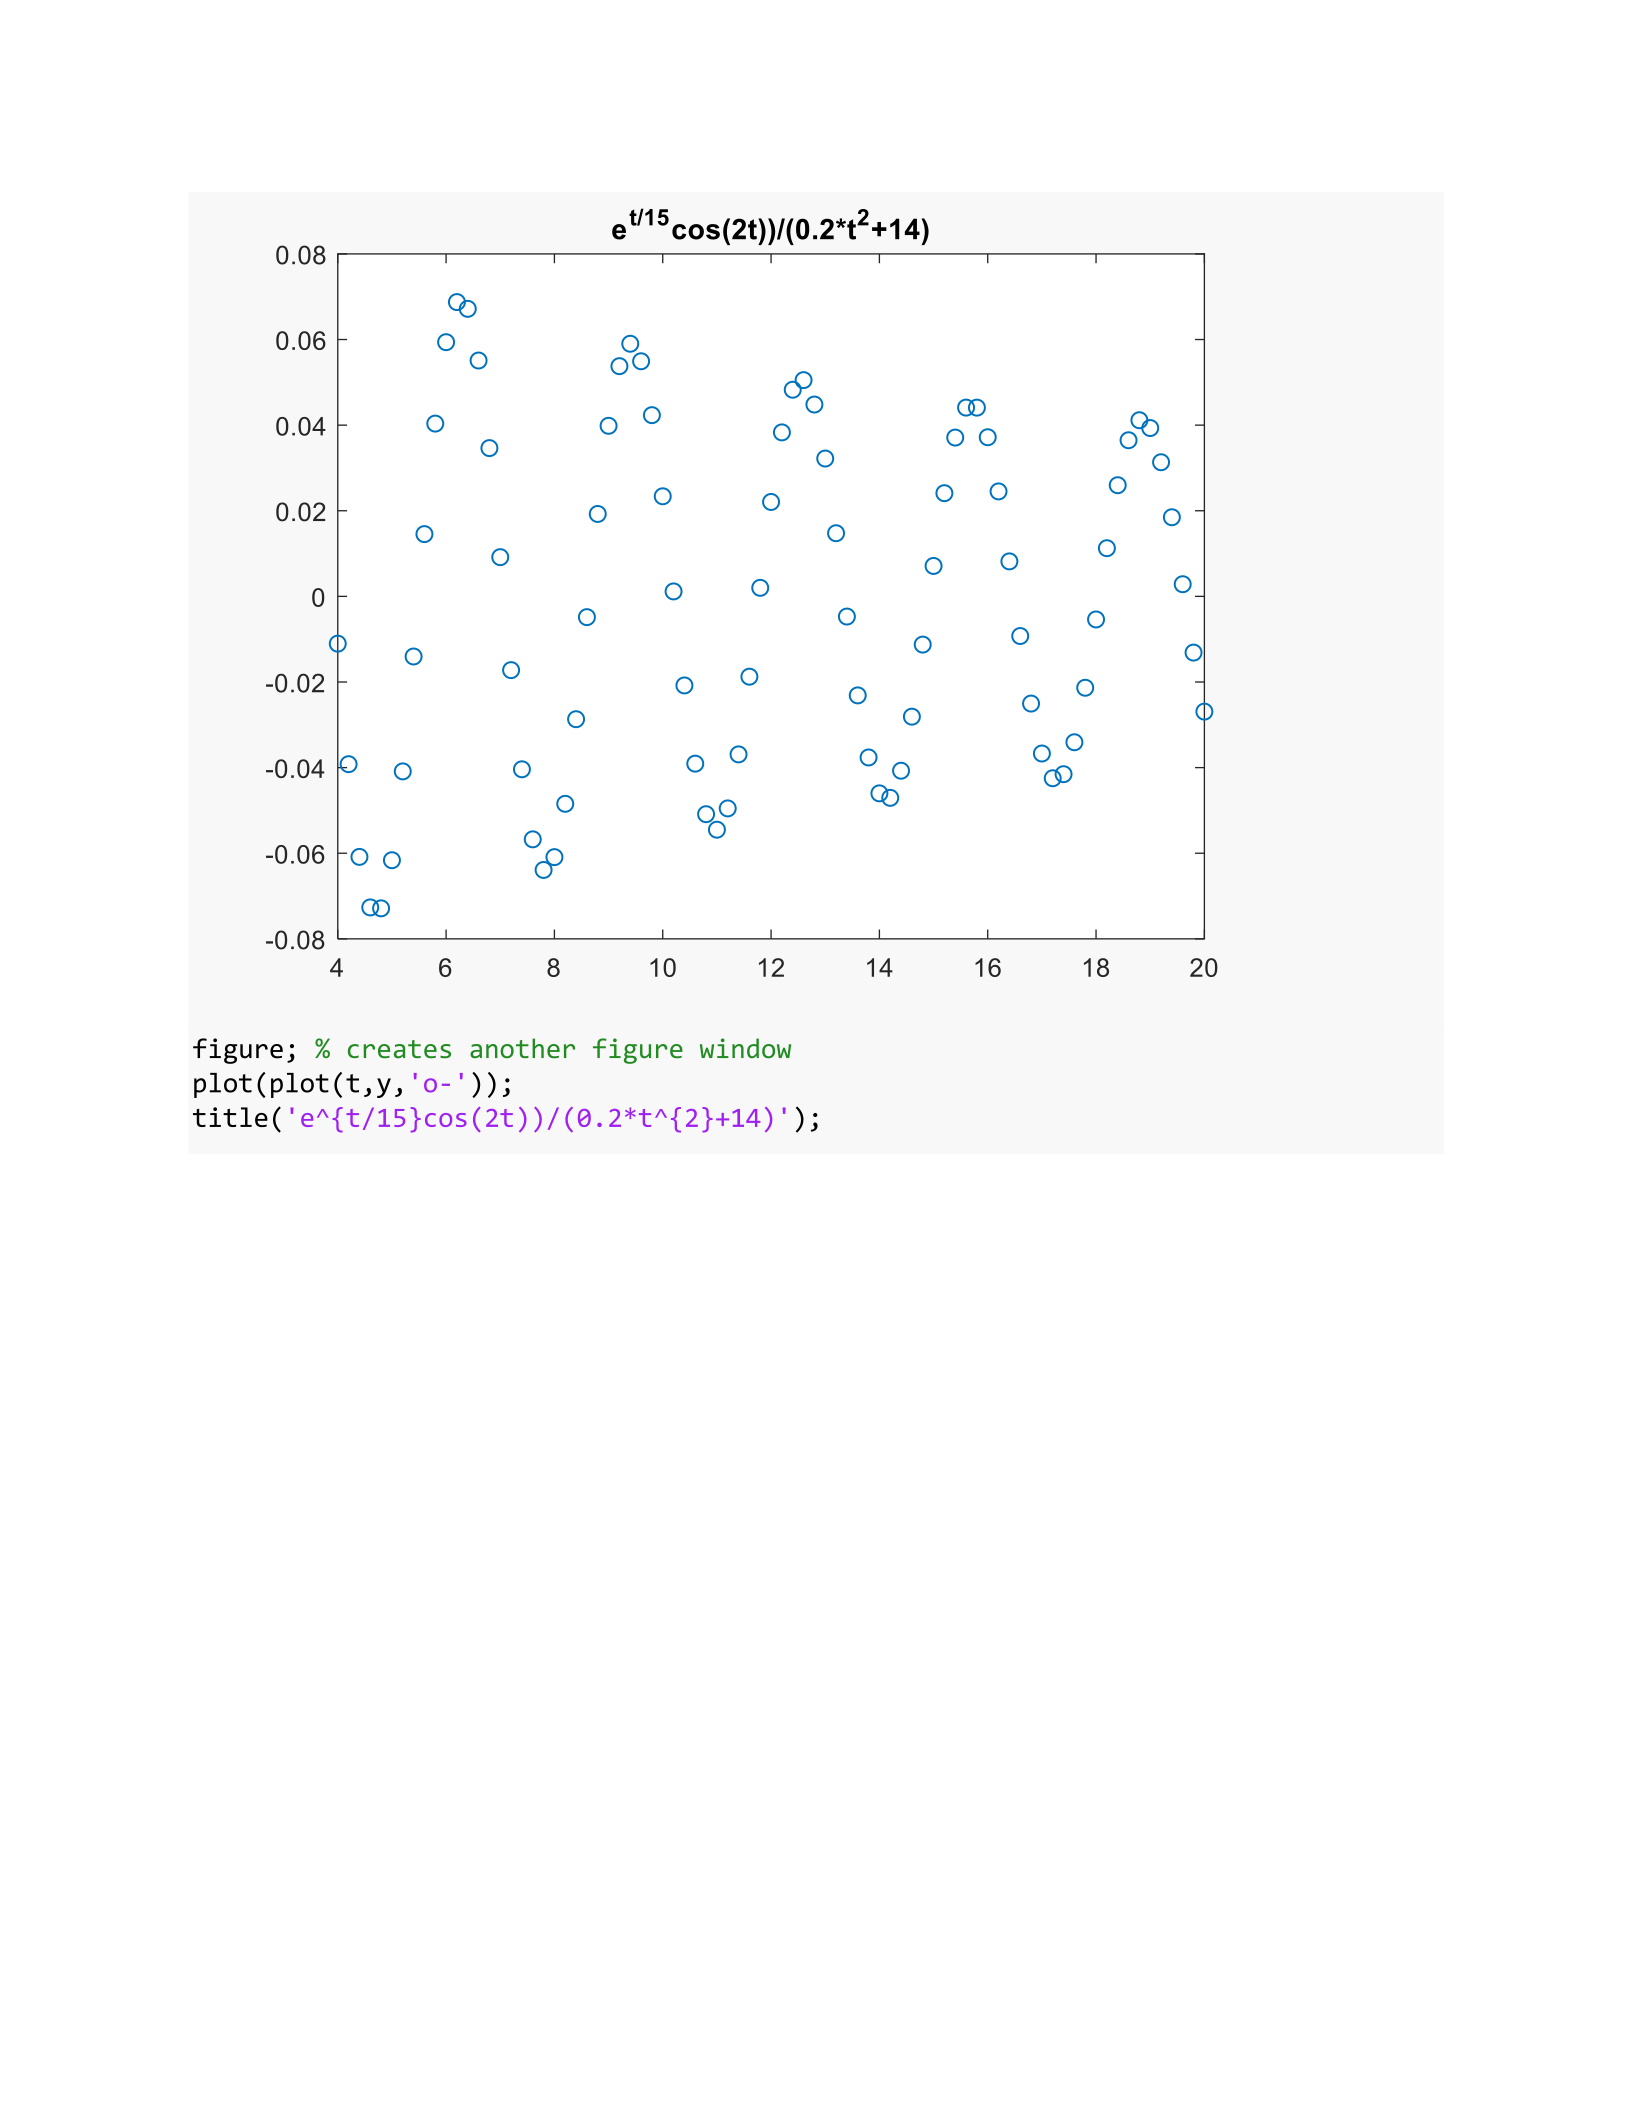
% Plot results as data points only and as data points with line.
figure; % creates a new figure window for next plot
plot(plot(t,y,'o'));
title('e^{t/15}cos(2t))/(0.2*t^{2}+14)');
figure; % creates another figure window
plot(plot(t,y,'o-'));
title('e^{t/15}cos(2t))/(0.2*t^{2}+14)');

Exercise 3
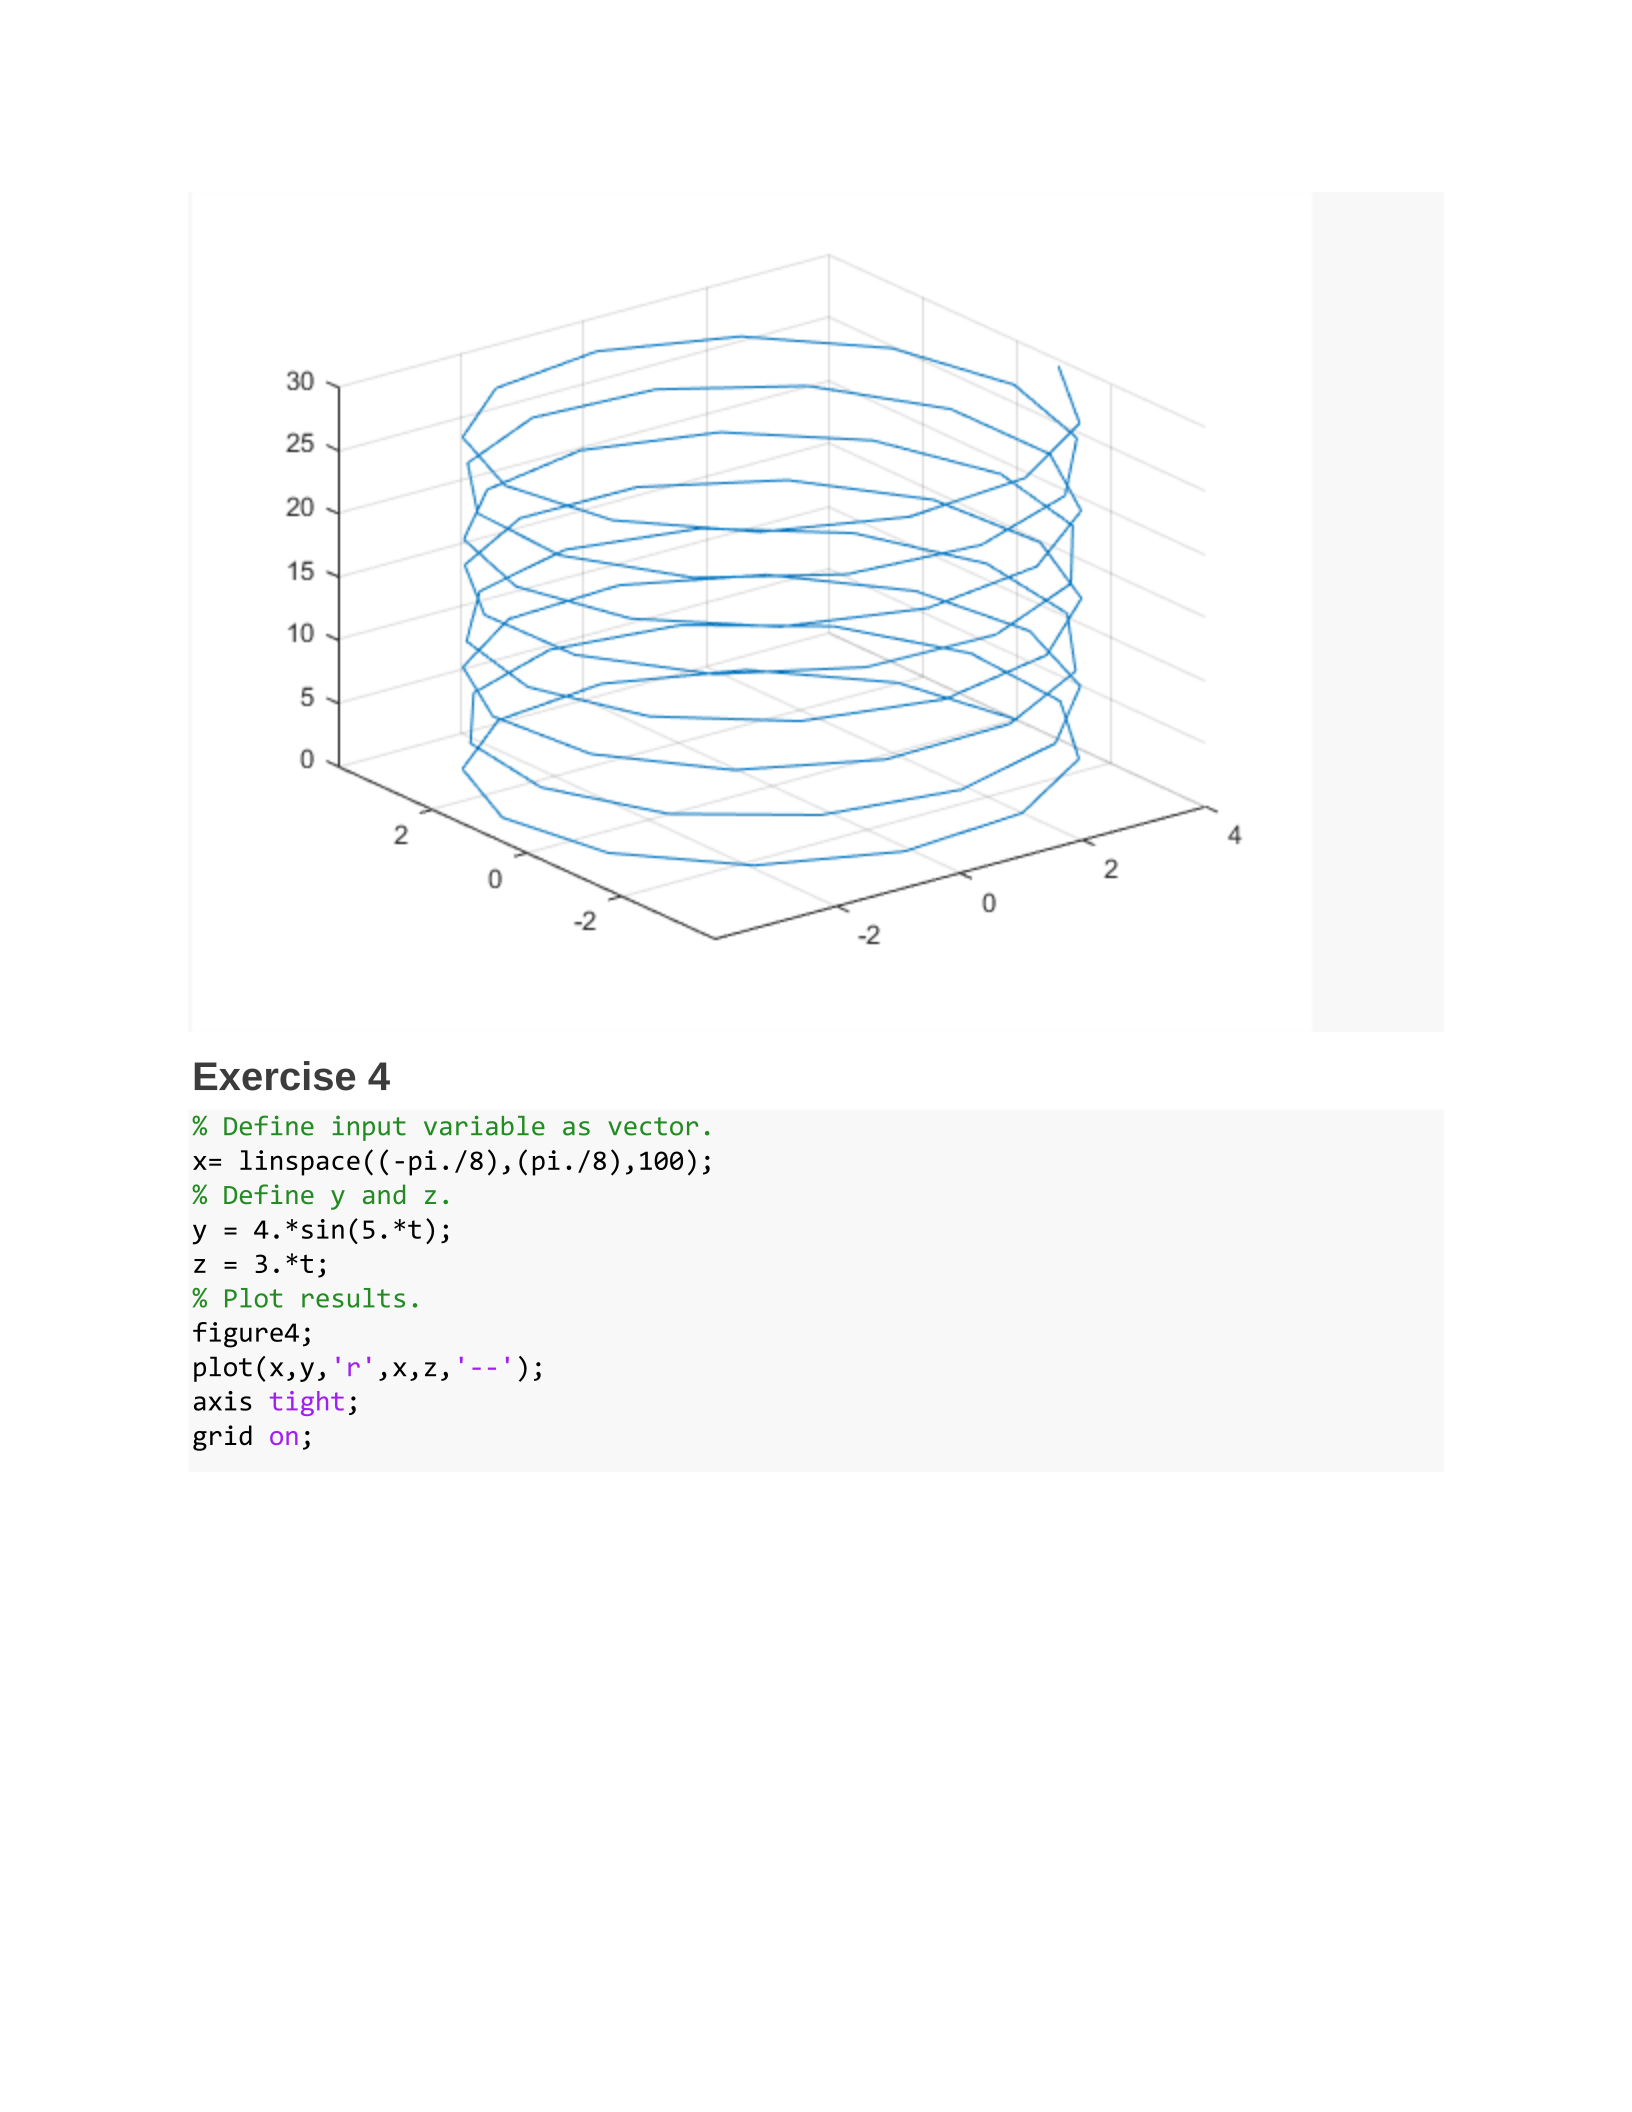
% Create t-vector (choose enough elements so that plot is smooth!)
t = 0:0.1:10;
% Define x,y,z components in terms of t.
x = 4.*cos(5.*t); y = 4.*sin(5.*t); z = 3.*t;
% Plot resuls.
figure;
plot3(x,y,z)
% NOTE: if graph does not look smooth, use more elements in your
% t-vector--i.e., use smaller stepsize between elements. Delete these notes
% before submission.
Exercise 4
% Define input variable as vector.
x= linspace((-pi./8),(pi./8),100);
% Define y and z.
y = 4.*sin(5.*t);
z = 3.*t;
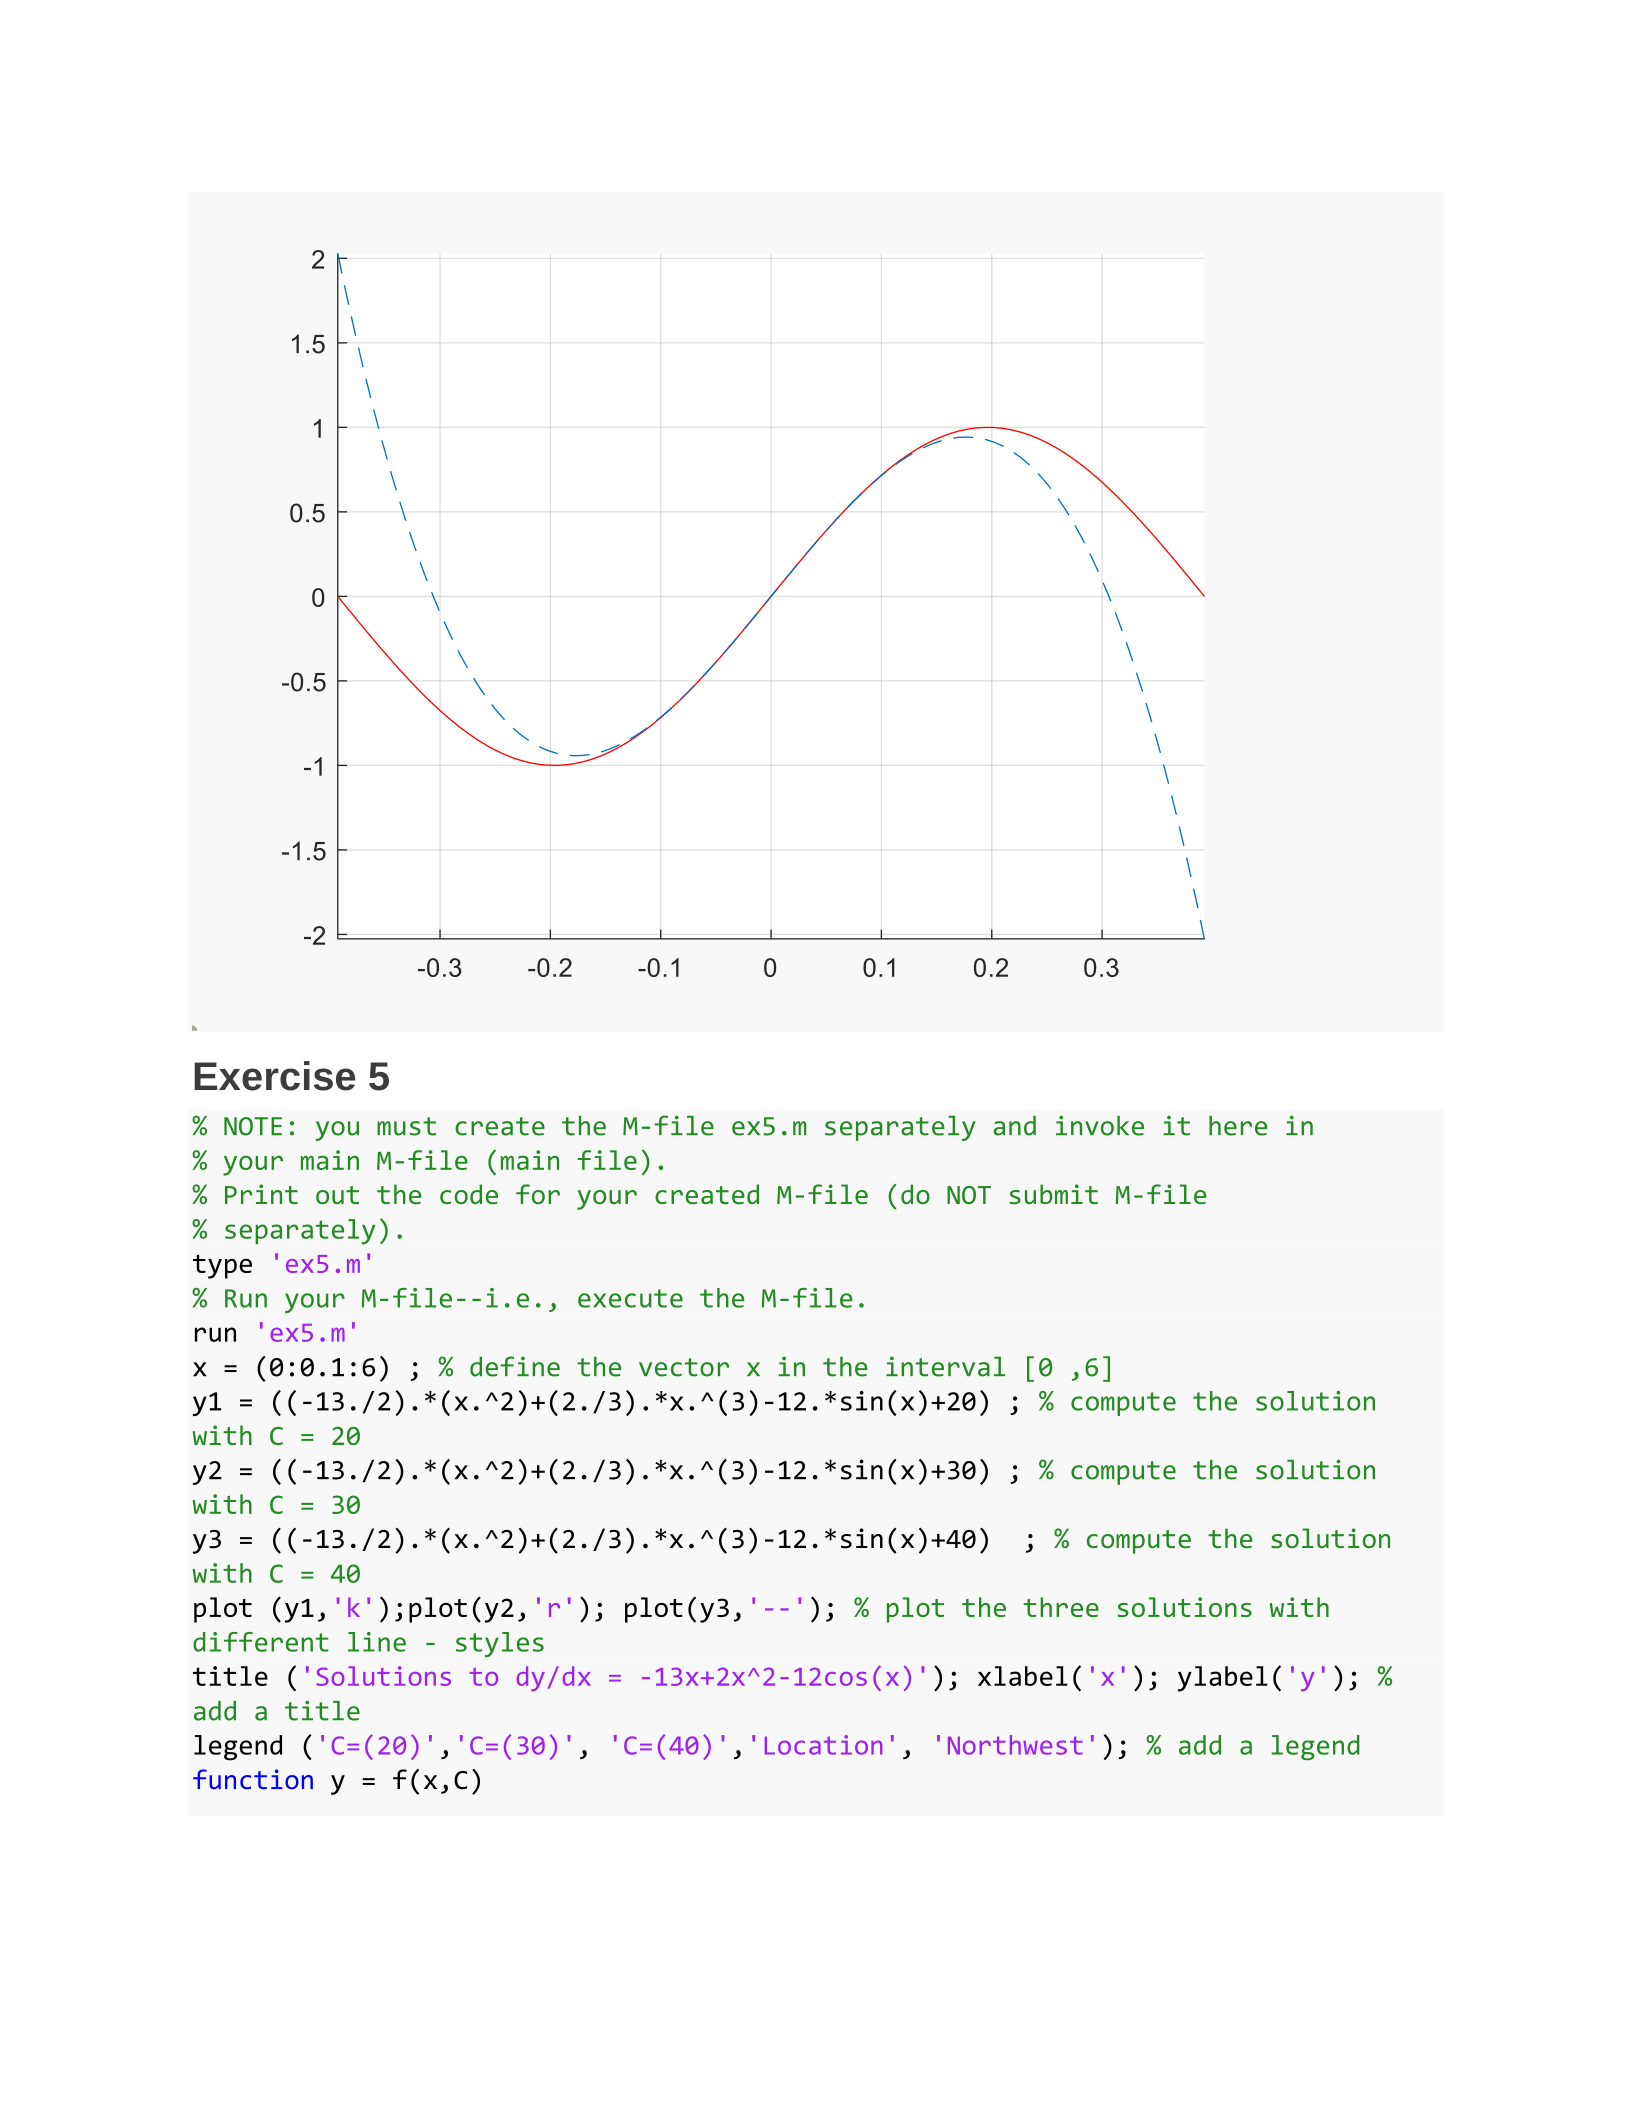
% Plot results.
figure4;
plot(x,y,'r',x,z,'--');
axis tight;
grid on;
Exercise 5
% NOTE: you must create the M-file ex5.m separately and invoke it here in
% your main M-file (main file).
% Print out the code for your created M-file (do NOT submit M-file
% separately).
type 'ex5.m'
% Run your M-file--i.e., execute the M-file.
run 'ex5.m'
x = (0:0.1:6) ; % define the vector x in the interval [0 ,6]
y1 = ((-13./2).*(x.^2)+(2./3).*x.^(3)-12.*sin(x)+20) ; % compute the solution
with C = 20
y2 = ((-13./2).*(x.^2)+(2./3).*x.^(3)-12.*sin(x)+30) ; % compute the solution
with C = 30
y3 = ((-13./2).*(x.^2)+(2./3).*x.^(3)-12.*sin(x)+40) ; % compute the solution
with C = 40
plot (y1,'k');plot(y2,'r'); plot(y3,'--'); % plot the three solutions with
different line - styles
title ('Solutions to dy/dx = -13x+2x^2-12cos(x)'); xlabel('x'); ylabel('y'); %
add a title
legend ('C=(20)','C=(30)', 'C=(40)','Location', 'Northwest'); % add a legend
function y = f(x,C)

Exercise 6
% For part (b), you need to create a separate M-file (f.m) and invoke it in
% the main file, here. Erase these notes upon submission.
Part (a)
% Define g as anonymous function.
g = @(x,y)((x.^2/y.^5)+((cos(2.*x.*exp(5.*y))))./(x.^6+9));
g(5,-6):
% Evaluate g at the given values of x and y
g =
-0.0032
Part (b)
% Clear the function g out of the workspace.
clear g.m
% Print out g.m contents.
type 'g.m'
% Evaluate g at the given values of x and y
g =
-0.0032
Powered by TCPDF (www.tcpdf.org)

