



1
1. INTRODUCTION TO THE NEED OF LEAN PCMS
Introduction
The engineering procurement construction (EPC) industry often does not do well in
controlling their large projects. Many capital projects especially mega projects fail
3
as
described below. Productivity has been stagnant or declined for the past 25-30 years. Also,
the productivity gap between construction and other industries has been increasing. It
indicates that EPC industry is not effectively controlling their project or the control used
in EPC is not adequate. As stated by the Construction Industry Institute (CII) project size,
complexity, and the demand for faster project execution speed has increased exponentially
(William et al. 2012). This increase suggests a need for continuous improvement in the
project control and management system (PCMS). CII claims PCMS is vital to the success
of the project, the need of enhancement in PCMS capability increases tremendously
(William et al. 2012). Further, there is going to be considerable investment in the
construction industry in the near future. As described below, the majority of the
infrastructure investment will be contracted through mega projects which are the worst
affected and often the most complex projects; they must have enhanced PCMS for their
success. Overall, there exists an imminent need of rapid continuous improvement in PCMS
of EPC to make large capital projects, especially mega projects, successful.
Background and Need
Data given below shows the story of construction capital projects, especially mega projects.
Following are the reasons which make advancements in PCMS indispensable in EPC
industry and motivate the author to do research in the PCMS advancements.
1. There is going to be enormous growth and investment in construction in the near
future.
3
The failure of project is per IPA definition of project failure Merrow, Edward W.; Industrial Megaprojects:
Concepts, Strategies, and Practices for Success, John Wiley & Sons, Hoboken, NJ, 2011, pg 38. It is described
below in section 1.2, table 1.1.

2
2. Many EPC projects, especially mega projects, do not do well and are failing.
3. The major investment is going to be in mega projects requiring strong PCMS to
succeed.
4. The construction productivity is lower than other industries, has been declining,
and the productivity gap of construction and other industry like manufacturing has
been increasing.
5. The failure of projects and productivity is related to control; a project fails when it
does not perform well on control aspects (cost, schedule, scope, safety, quality,
moral, and environment). Projects fail due to cost overrun, time overrun, poor
quality, adverse environment impact, etc.
6. Control is established in the project or organization through PCMS, so inadequate
control in the construction industry indicates inadequacy of PCMS.
7. Traditional project control in the industry is more of a reactive approach and comes
into action when a project gets off the track – this focus must change to planning
and excellent performance of every task.
8. Project size, complexity, and the demand for faster execution has been increasing
tremendously.
9. There is a need for PCMS to become a proactive approach that prevents the project
from getting off track in first place or provide real time control to the projects.
10. There is a need of rapid continuous improvement in the PCMS that enhances the
whole system of PCMS and provides a desired state of excellence to the PCMS.
PCMS is not adequate to provide project control needed for the capital project. Failure or
poor performance of projects indicates inadequacy in control; failure of projects means
project could not achieve the desired state of control in terms of safety, quality, budget,
schedule, scope, morale, environment, etc. Project failure or poor performance is defined
as any of the following criteria: not completed within schedule, within budget, with the
quality needed, within the defined scope. Project failure indicates lack of control which
implies inadequacy in PCMS during one or more phases of project delivery. According to
the data presented below, total investment per annum in construction is going to double in
the next fifteen years which means it has become crucial for the EPC industry to start

3
improvement initiatives in PCMS as soon as possible. The large number of construction
projects using traditional inadequate PCMS could exacerbate this poor performance of
construction industry, and perhaps cause damage to the world economy. “The fact that one
failed project can potentially wipe out an entire year’s or even decades of client or
construction companies profit helps put the value of Project Controls into perspective”
(Ballard 2000). Data below also suggests that mega projects are worst affected due to poor
PCMS and are experiencing failure. Seventy-seven percent of total capital investment is
projected to be in mega projects. There is a crucial need of advancements in PCMS to a
level which can provide control to megaprojects.
CII says, PCMS is vital for the success of any project. Not all performance is bad. There
are best practices that when properly used can consistently result in performance far better
than the norm. The usual story of construction projects suggests the inadequacy of PCMS.
Project failure is the indication of inadequate control in the project. A project fails on one
or more of the control aspect (cost, time, quality, safety, scope, productivity, morale,
environment). Thresholds of cost and schedule failure are described below in the table 1.1
from IPA.
Threshold of failure: The IPA says, “Cost overruns are measured as the ratio of the actual
final costs of the project to the estimate made at the full-funds authorization (sanction)
measured in escalation-adjusted terms. Cost competitiveness measures how much the
project spent (in constant dollars adjusted to a common location) relative to other projects
with similar scopes. Execution schedule is measured from the start of production
(sometimes called detailed engineering) until mechanical completion of facilities. Slip is
defined as the actual schedule divided by the schedule forecast at full-funds authorization.
Schedule competitiveness is the length of the execution relative to similar projects”
(Merrow 2011).

4
Table 1.1 Project Failure Threshold as defined by IPA: (Merrow 2011)
Type of Outcome
Threshold for Failure (see explanation below)
Cost overruns
> 25 percent
Cost competitiveness
> 25 percent
Slip in execution schedules
> 25 percent
Schedule competitiveness
> 50 percent
1.2.1 EPC Growth in Mega Projects
Engineering, procurement and construction combine to be one of the most important parts
of an economy, often accounting for 5 percent or more of the aggregate output (Gross
Domestic Product) and employment. The United States total value of construction put in
place was about 1,182.1 billion dollars January- November 2016 (Huesman et al. 2017). In
the U.S., There are 6.7 million people employed by construction industry (U.S Department
of Labor, 2016).
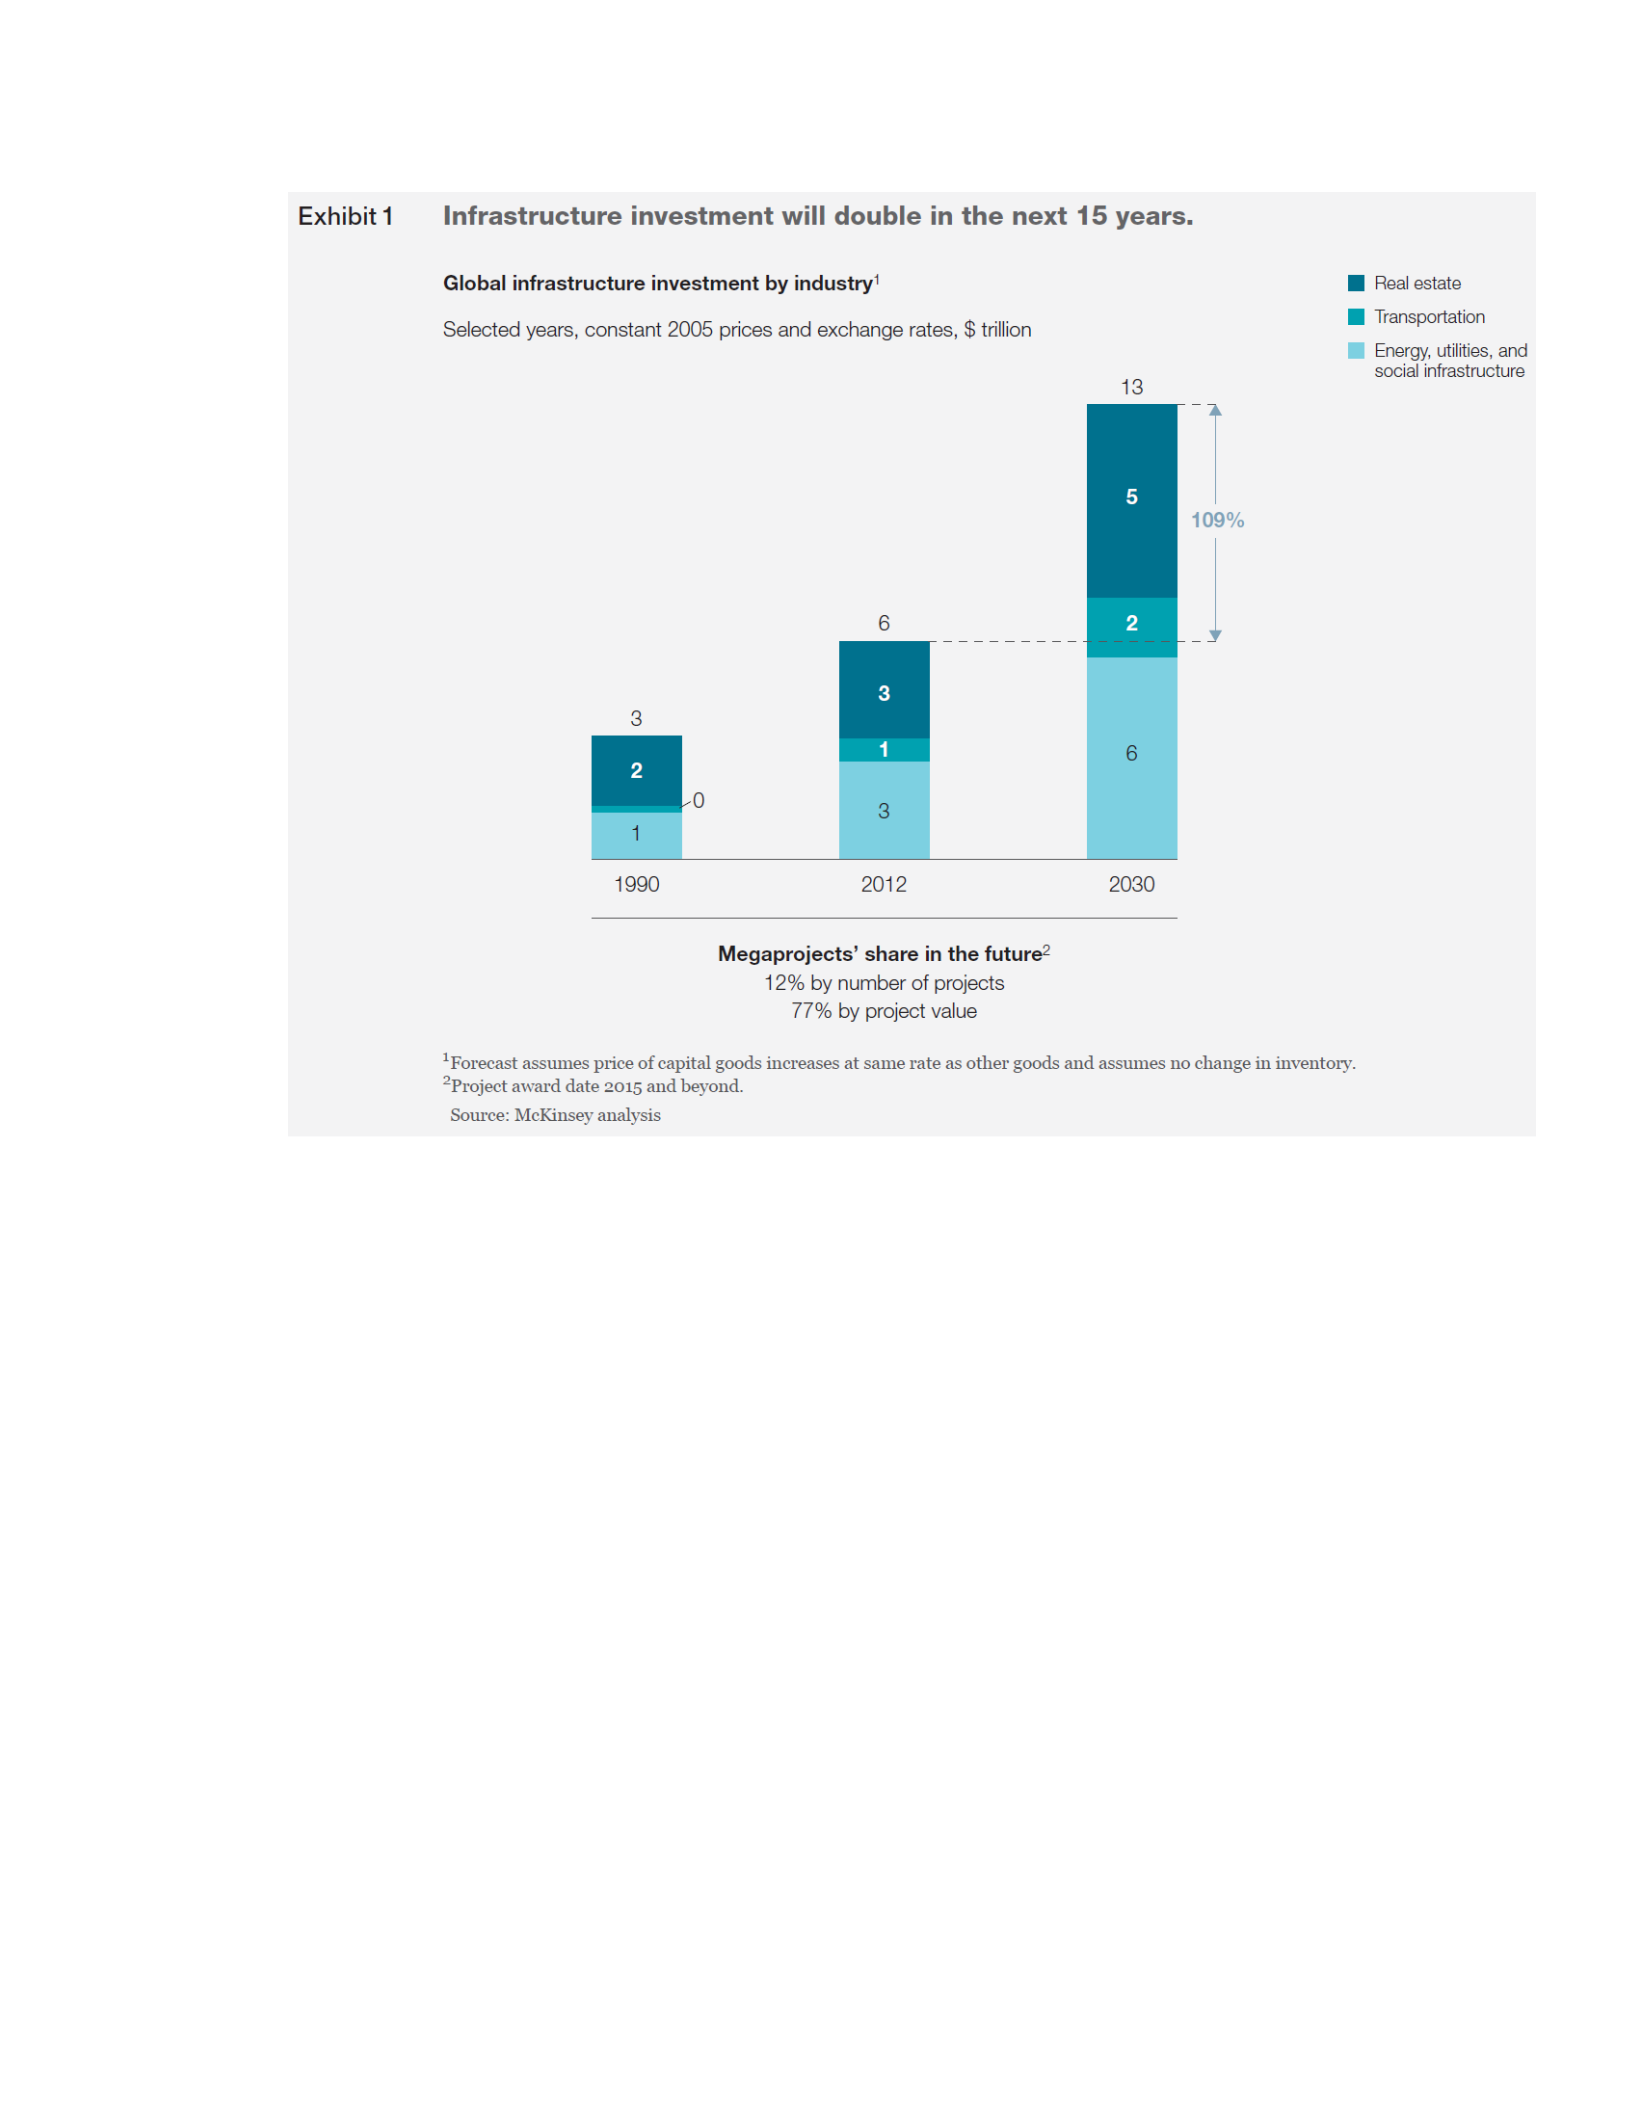
According to McKinsey research report, investment in megaprojects (i.e., projects over
US$1Billion) is growing very fast. In 2013, global megaprojects for investment in energy,
infrastructure, mining, and real-estate-related projects was about $6 trillion. McKinsey
estimated that, by 2030, megaproject use could grow to $13 trillion. According to the same
report by McKinsey megaprojects will account for a greater share, totaling about seventy
seven percent of these developments (Changali et al. 2015).
Below in the figure 1.1, the chart from McKinsey, which shows the growth trend in
construction industry. It shows that they have estimated that infrastructure investment per
annum will double in the next fifteen years.
5
Figure 1.1 McKinsey Report (Changali et al. 2015)
Global construction perspectives, construction market is set to grow by US$8 trillion by
2030, reaching a total size of $US17.5 trillion, up by 85% and growing by an average
annual rate of 3.9% to 2030. The total volume of construction output will grow by 85
percent to $15.5 trillion worldwide by 2030, with three countries — China, the U.S., and
India — leading the way and accounting for 57 percent of all global growth (Perspectives
2015).
Further, data from Nelson says that “By 2030, about half of the buildings in U.S will be
less than 30 years old. It means that about half of the buildings in which Americans live,
work, and shop will have been built after 2000. In the West (American West) that figure
would be about 87 percent, almost doubling the built space. By 2030, 87 percent of the
Midwest’s industrial space will be less than 30 years old.” (Nelson 2004).
6
1.2.2 Construction Capital Projects Especially Mega Projects Fail
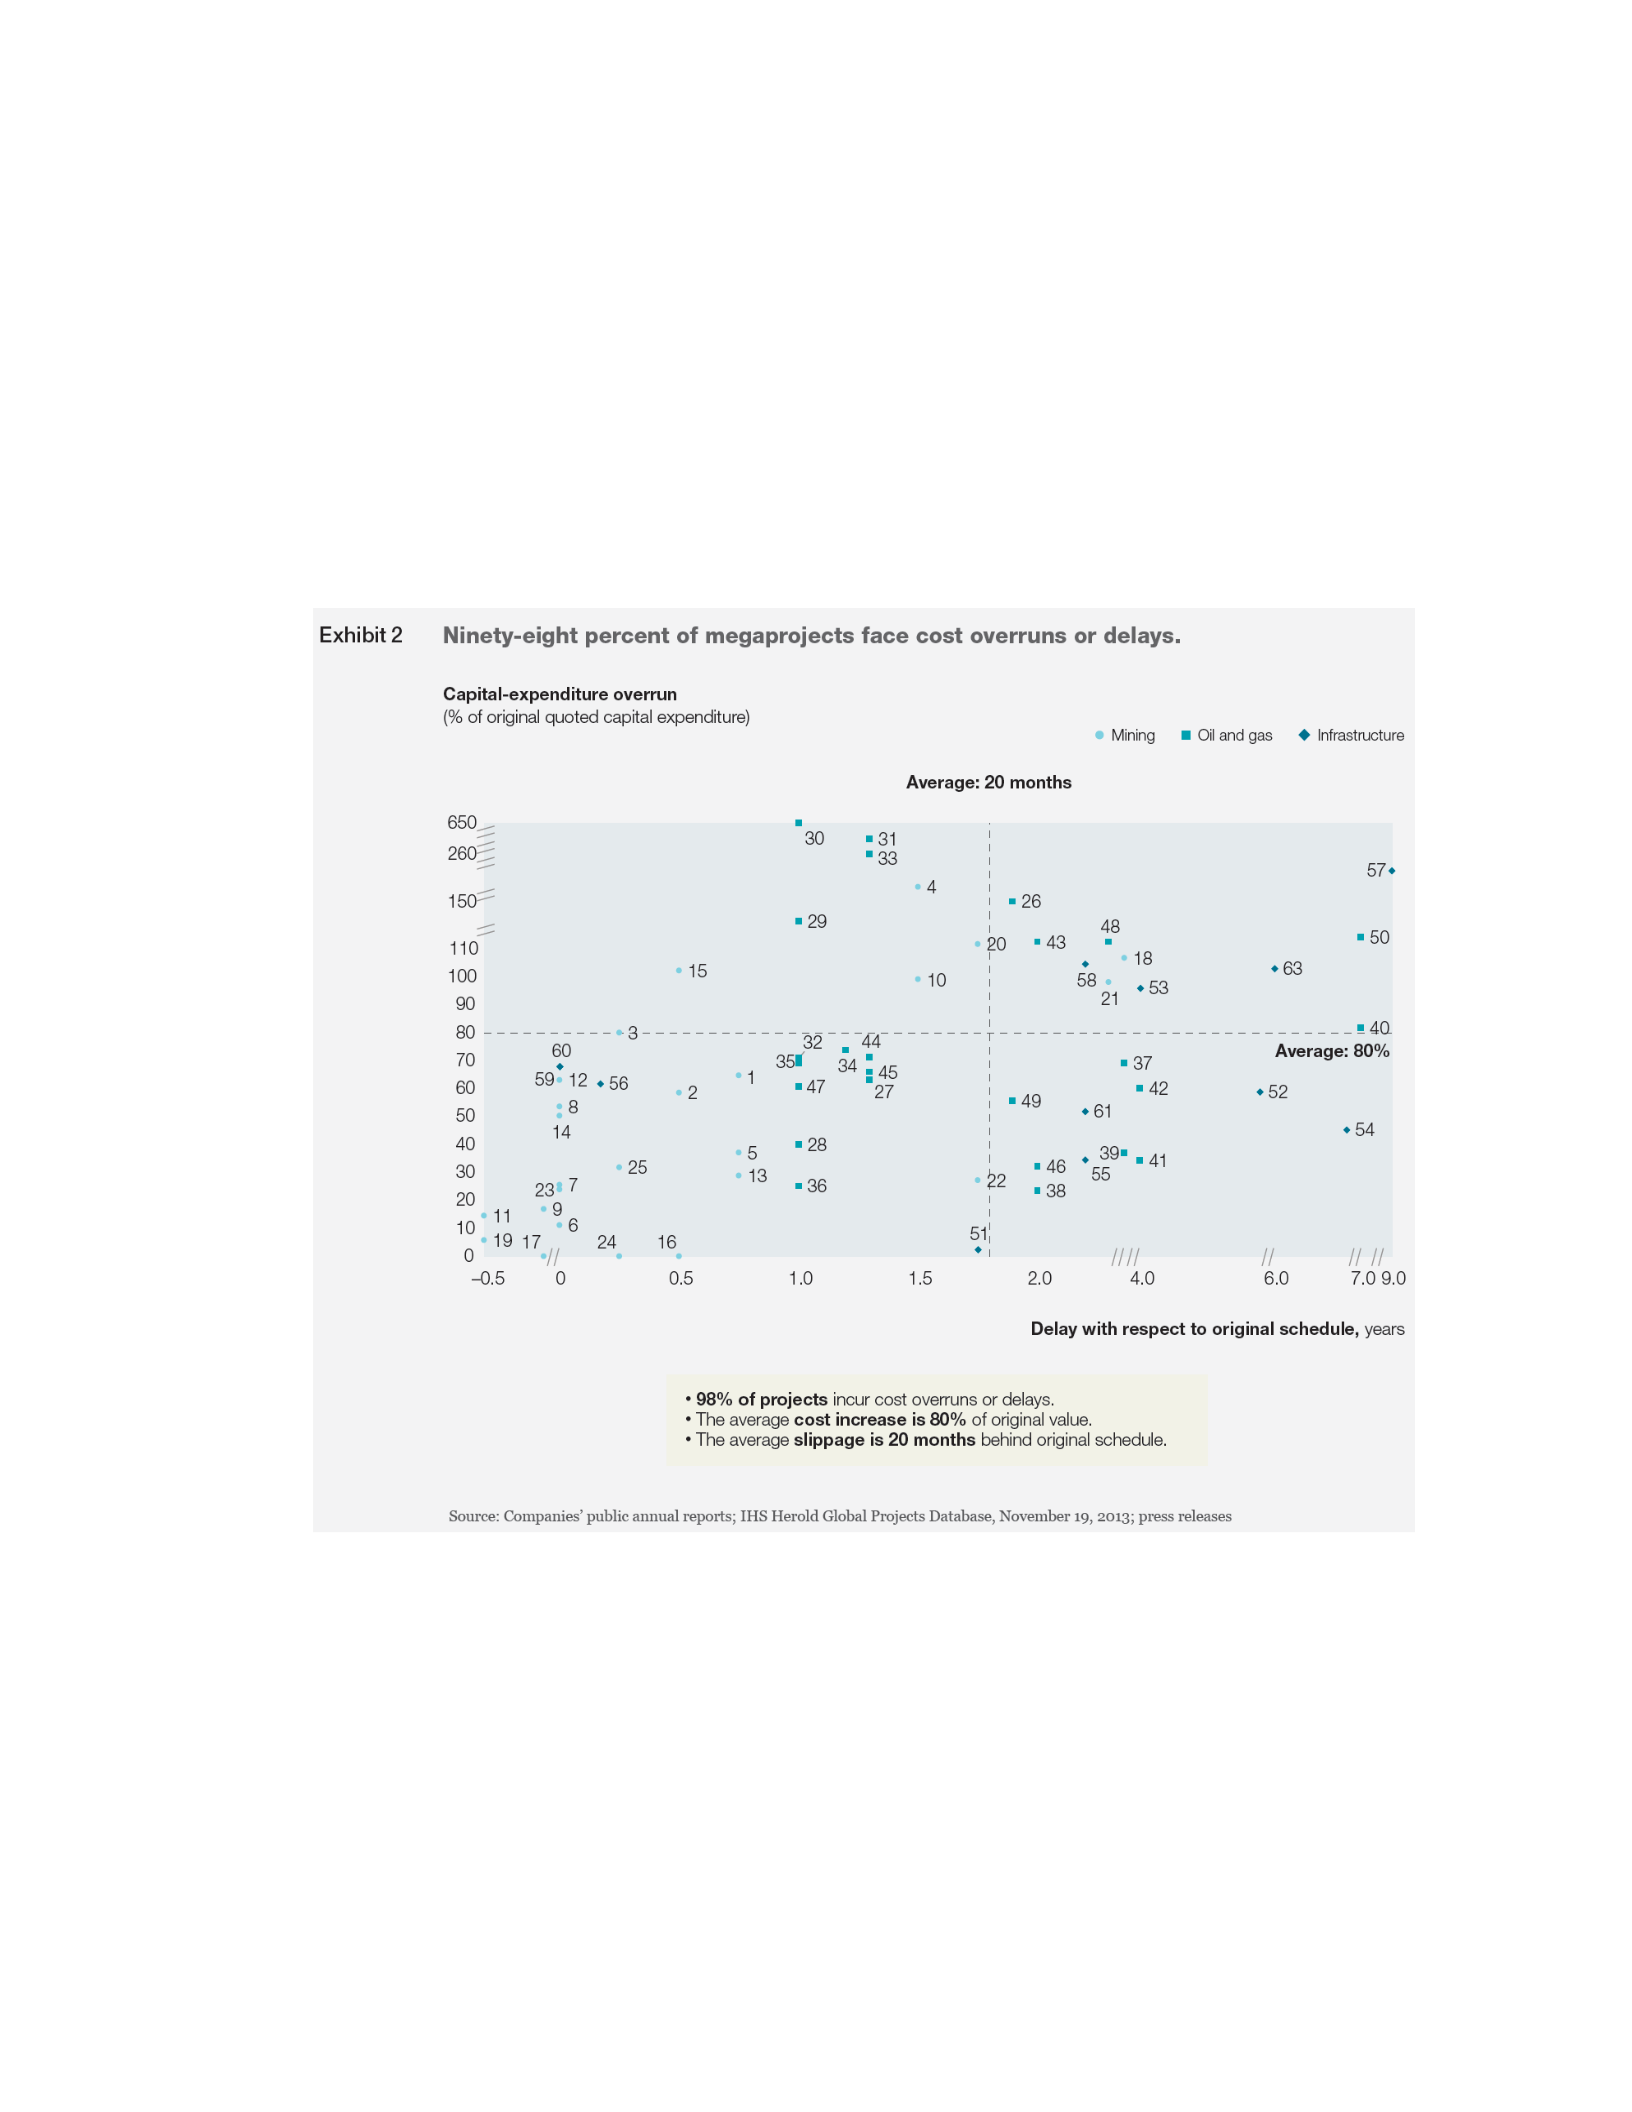
According to McKinsey, mega projects do not do well. “The industry does poorly
completing megaprojects on time, on budget, and to specifications. Our research estimates
that 98 percent of megaprojects suffer cost overruns of more than 30 percent; 77 percent
are at least 40 percent late.” (Changali et al. 2015). Below in the figure 1.2, the chart from
McKinsey which shows the cost and time overrun data of capital projects.
Figure 1.2 Cost And Time Overrun Data Of Capital Projects from McKinsey (Changali et
al. 2015)
From various other data sources, it is often found that construction projects do not do well.
“The larger and more complex projects become, the larger the impact of the poor planning
and control. IPA reported that 57% of mega (more than $1 billion) projects fail due to cost
or schedule exceeding 25% over budgets4. Eight of the last 10 largest mega projects in the

7
industry have been described by an industry leader as “train wrecks” with time and/or cost
running more than 20% over budget. The average was 40% over budget and that did not
include contractor loses which were “magnificent”.” (Patty and Denton 2010b).
A few of the notorious construction projects examples, taken from Lepatner are given
below (Lepatner 2007).
1. Big Dig, an ambitious underground highway system in downtown Boston was $12
billion over budget, many years late, and experienced safety and quality failure.
Failure of concrete ceiling panel killed a motorist in 2006. The original budget of
the project was $6 billion which increases to $14.6 billion. It was scheduled to be
completed in 1998 while it got completed in 2007.
2. Two Broadway in Manhattan renovation which was initially estimated to cost $135
million, suffered a cost overrun of around $300 million.
3. In Las Vegas, missed deadlines cost a million dollars a day in lost casino revenue.
The $1.5 billion Venetian Resort Hotel Casino project saw one of the costliest
construction litigations in recent history. Bovis Lend Lease the construction
manager file $140 million suit to the Venetian Resort Hotel Casino.
4. The cost overrun case of the Portland Aerial Tram which was originally budgeted
$15M and escalated to $57M resulting in a passenger fare of $4, twice initial
estimates.
5. The price of the new football stadium for the New York Giants and New York Jets
has risen $600 million [or 43%] to $1.4 billion. Initial costs were estimated at $800
million.
6. The No. 7 subway extension project has cost overrun of $1 billion over its initial $2
billion budget even though construction has yet to begin. And the list may go on.
Ed Merrow’s thresholds for failure, (Merrow 2011), many capital projects fail, 78 percent
of megaprojects in oil and gas sector are classified as failures. Of the failed oil and gas
projects, cost overruns averaged 33 percent and cost competitiveness was almost 40 percent
more than the industry average. Nearly two-thirds of the petroleum development failures
suffered severe operability problems. Minerals megaprojects failed about 77 percent of the
time and had failure patterns similar to those seen in petroleum development: poor

8
operability and very high cost growth. Unlike oil and gas projects, however, minerals
project failures occur mainly due to schedule overrun. It is also seen that that the failure
rate is higher among more recent LNG projects (Merrow 2011).
The data above show the failure of megaprojects. Per Barshop, the average project delivers
22 percent less NPV than what was forecast when the project was funded (Barshop 2016).
Merrow states most of the failed projects were unprofitable. Many of the failed projects
depend on the compensation by national resource holders to the operator to become
profitable (Merrow 2011).
Jemima Principle: Merrow described the Jemima principle as “large capital projects or
mega projects are by their nature either quite good or quite bad”; instead of tending to go
slightly wrong, they tend to fall apart. This strange nature of big or megaprojects is due to
fragility. The Jemima principle suggests that large or mega projects do not just degrade
toward poor outcomes instead they collapse; if one of the many parts fails, the whole effort
fail. Mega projects which fails, fail severely (Merrow 2011).
1.2.3 Construction Productivity
Construction productivity data is also a related measure of the project control performance.
Construction industry productivity data also indicates the need of improvement in PCMS.
Below, construction productivity data is analyzed, and compared with other industries
productivity. Construction industry productivity data states that construction productivity
has been declining or almost flat and the productivity gap between construction and other
industries have been increasing since 1985. Per McKinsey, construction productivity has
been flat for decades while manufacturing productivity has been doubled in the same period
of time (Changali et al. 2015); it is shown below in the figure 1.3, the chart published by
McKinsey.

9
Figure 1.3 Overview of Productivity Improvement in Manufacturing & Construction
(Changali et al. 2015)
Figure 1.4 Labor Productivity per Unit Labor Input
0.00
0.50
1.00
1.50
2.00
2.50
1980 1985 1990 1995 2000 2005 2010 2015
Productuvuty Index
Year
Labor Productivity Per Unit Labor Input, Index Base Year 1985
construction total manufacturing

10
The figure 1.4 shows the G7 countries (Japan, U.S., U.K., France, Germany, Italy, Canada)
labor productivity of construction, manufacturing and all other industries combined (total).
It is apparent that the construction industry is much behind in terms of labor productivity
compared to manufacturing and total industry. Also, the gap has been continuously
growing (OECD 2017).
Both charts above show that the construction productivity has been stagnant or declined in
the period studied. The productivity gap between construction industry and manufacturing
or all other industry combined has been increasing for the period.
According to the CII, in the past three decades the U.S. manufacturing industry has made
significant progress in productivity improvement and product quality while lowering
product lead times. Conversely, the U.S. construction industry has seen a decline in its
share of gross domestic product (GDP), and changes in its annual productivity growth rate
remain debated (CII 2005). According to U.S. Bureau of Labor Statistics, since 1964, the
average of all non-farm U.S. industries has increased their productivity by a compounded
rate of 1.7 percent, while the construction industry has declined 0.5 % per year. Meanwhile,
some advanced manufacturers, (such as Dell, Bobcat, Toyota, HON, Taylor Shipyards,
etc.), have improved their productivity by as much as 300% of their industry norms,
enabling these Lean leaders to dominate their industries.” (Center for Construction Industry
Studies 1999). There have been improvements in construction or EPC industry, however
the rate of improvements have not have kept pace with the need of size and complexity of
construction projects (Patty and Denton 2010b).
Problem Statement
From the above data, it is apparent that construction industry is facing challenges in
controlling their projects, especially megaprojects. Many of the projects have failied.
Productivty is not good. There is going to be enormous investment and growth in
construction in the near term. Most of infrastructure investment is going to be in mega
projects which are by nature complex and fragile. Also the size, complexity, and demand
of the speed of project execution has been growing tremendously.

11
This engenders an imminent need in the improvement of control. Control in the project is
achieved through PCMS (skills, work process, procedure, policies, tools, culture, concepts,
principles etc.). Therfore, there is a need of rapid continuous improvement in PCMS which
provides the control needed to make contruction capital and megaprojects successful. This
improvement must be rapid to keep up with the massive investment, especially in the
megaproejcts, in the near future. Improvement must be continuous to deal well with
increasing size, complexity, and the simultaneous demand for faster, safer and higher
quality construction projects delivery. It should be observed that such market demands are
not unique to construction, what is unique to construction is the relatively poor industry
response to its market demands. This thesis is to get past some excuses.
Research Thesis and Objective
The thesis of this research is that the current PCMS is inadequate to provide the control
needed in the construction industry especially for the delivery of capital projects, and there
is a need to look into the current concepts and practices of PCMS to define “What Is”; then
find out the concepts and practices of PCMS that give the desired state of excellence in
PCMS, i.e., “What Should Be”; and then the to present the theories, methodologies, and
models to close the gap between “What Is” and “What Should Be”, i.e. “How to Close the
Gap”. This all suggests a need of rapid continuous improvement in the PCMS.
The goal of this research is to find methods to make control more of a proactive approach
and have rapid continuous improvement in PCMS, or to make it a “Lean PCMS”.
Following are the specific objectives to achieve the goal of the thesis:
• Understand the heavy industrial project delivery life cycle;
• Understand the current concepts of control in the construction industry;
• Find what are the current practices and concepts for PCMS in the construction;
• Find what should be the PCMS concepts and practices which successfully deliver
capital projects;
• Find out how to close the gap;

12
• Find concepts, practices, and principles from other industries that can be fruitfully
used as lessons learned for construction PCMS advancements;
• Understand various flow system which is used in other industries and in
construction;
• Develop a flow system model based on pull planning and visual control which
enhances flow control;
• Develop models which makes PCMS proactive;
• Develop models which provides rapid continuous improvement to the PCMS.
Research Scope
The research intends to search for methodologies that provide real time proactive control,
and provide continuous rapid improvement to the PCMS. It is an applied research with an
objective to improve control for the delivery of capital projects including mega projects.
Research Methodology
Task 1. Literature Review: The literature review in this research can be categorized into
two sections. The first section of the literature review is done to find the health of the
construction industry. In this, data are collected for construction productivity, construction
projects success/failure, future growth, demand, and investment, growth in size and
complexity, in the construction industry with the focus on capital projects. The second part
of literature review is done to find out what is the current state of project control and
management system (concepts, theory and practices), what should be the PCMS, and how
to close the gap.
Literature review is done to find the current practices and concepts in project control. Then
to find what should be the state of project control in construction, literature review is done
to find concepts from other industries which have worked well. Also, literature review is
conducted to find the methodology to fill in the gap or how to close the gap.

13
Task 2. Models Development for the proposed advancements in the PCMS: In order to fill
in the gaps in construction PCMS; concepts, principles, and practices of control, flow
system, Lean, Kaizen, project management, etc. are extracted, investigated and customized
in the form of models to achieve the objectives.
Task 3. Informational Interview and Validation of Models from the Industry Experts: To
understand the current practices and role of PCMS in the capital project delivery life cycle,
several informational interviews were conducted with the industry experts. With the help
of the information gathered from the interviews, models for the advancements of PCMS
are refined. Further, the models were presented to the industry experts, their comments and
suggestions were subsequently incorporated in the model, and approval or consents were
taken from the industry experts about the effectiveness of models to achieve the desired
state of control for the delivery of capital projects. In this way, knowledge from EPC
industry has been extracted and used in this thesis.
Task 4. Case Study on the Implementation of Kaizen Model in a Real Project Setting: To
have a comprehensive understanding of the implementation of Kaizen in the EPC industry,
a case study on the implementation of Kaizen appraisal stage for the advancement of PCMS
in an EPC company is explained in detail.
Organizational Structure of Thesis
Chapter wise organizational breakdown of thesis is described below.
1.7.1 Chapter 1: Introduction
The background, need, objective, scope, and research methodology of the thesis is
discussed in this chapter. Need of Lean PCMS is established. Literature review is
conducted to collect data which shows that the construction industry is not doing well. Data
shows the ineffective story of the performance of mega projects in the construction industry.
Overall, the foundation of the applied research for the proposed advancement of PCMS is
made in this chapter.

14
1.7.2 Chapter 2: Literature review
In this chapter “What Is” the current concepts and practices of PCMS is studied. Then,
“What Should Be” the practices and concepts of PCMS is established by exploring options
from other industries, and Lean. After that theories, concepts, practices such as control,
PCMS, project delivery life cycle, flow system, critical chain project management, Lean,
etc, are explored, for “How to Close the Gap” between “What Is” and “What Should Be”.
1.7.3 Chapter 3: Proposed Advancements in PCMS
New concepts for PCMS are explained. Models to fill in the gaps between “What Is” and
“What Should Be” are derived from the concepts discussed in chapter 2. Models are also
approved from the industry experts.
1.7.4 Chapter 4: A Case Study on the Lean PCMS Appraisal Stage
Chapter 4 discusses a case study on the implementation of Kaizen appraisal stage with
templates, step wise process, pre-reads, etc. in a large EPC company. Author (was involved
and present on site) with industry experts.
1.7.5 Chapter 5: Summary and Recommendation
It provides a summary, benefits and contributions, and limitations of the research and
findings. Also, it provides the guidance for further studies.

15
2. LITERATURE REVIEW
Introduction
Failure of any system, project, program, event, even life, can often be attributed to the
failure of the control in it. Different systems or projects have different elements that need
to be in control. For instance, construction project control elements are time, cost, scope,
quality etc. In this chapter, what constitutes the current concepts and practices of PCMS
are explored. What should be the concepts and practices of PCMS are then discussed.
Further, concepts and practices are explored to find how to close the gap. In summary, we
will see “What Is”, What Should Be”, and “How to Close the Gap”, for project control and
management system.
Capital and Mega Project
According to Dartmouth College has the definition “Capital projects refer to all
construction, renovation, improvement, fabrication, and customization projects where
capital costs are greater than or equal to $50,000, and non-operating repairs and
maintenance funded by long-term maintenance reserves.” (“Dartmouth” 2017).
A megaproject has total capital cost of more than $ 1 billion (U.S dollars) as measured on
January 1, 2003 (Merrow 2011)
Life Cycle of a Capitol Project
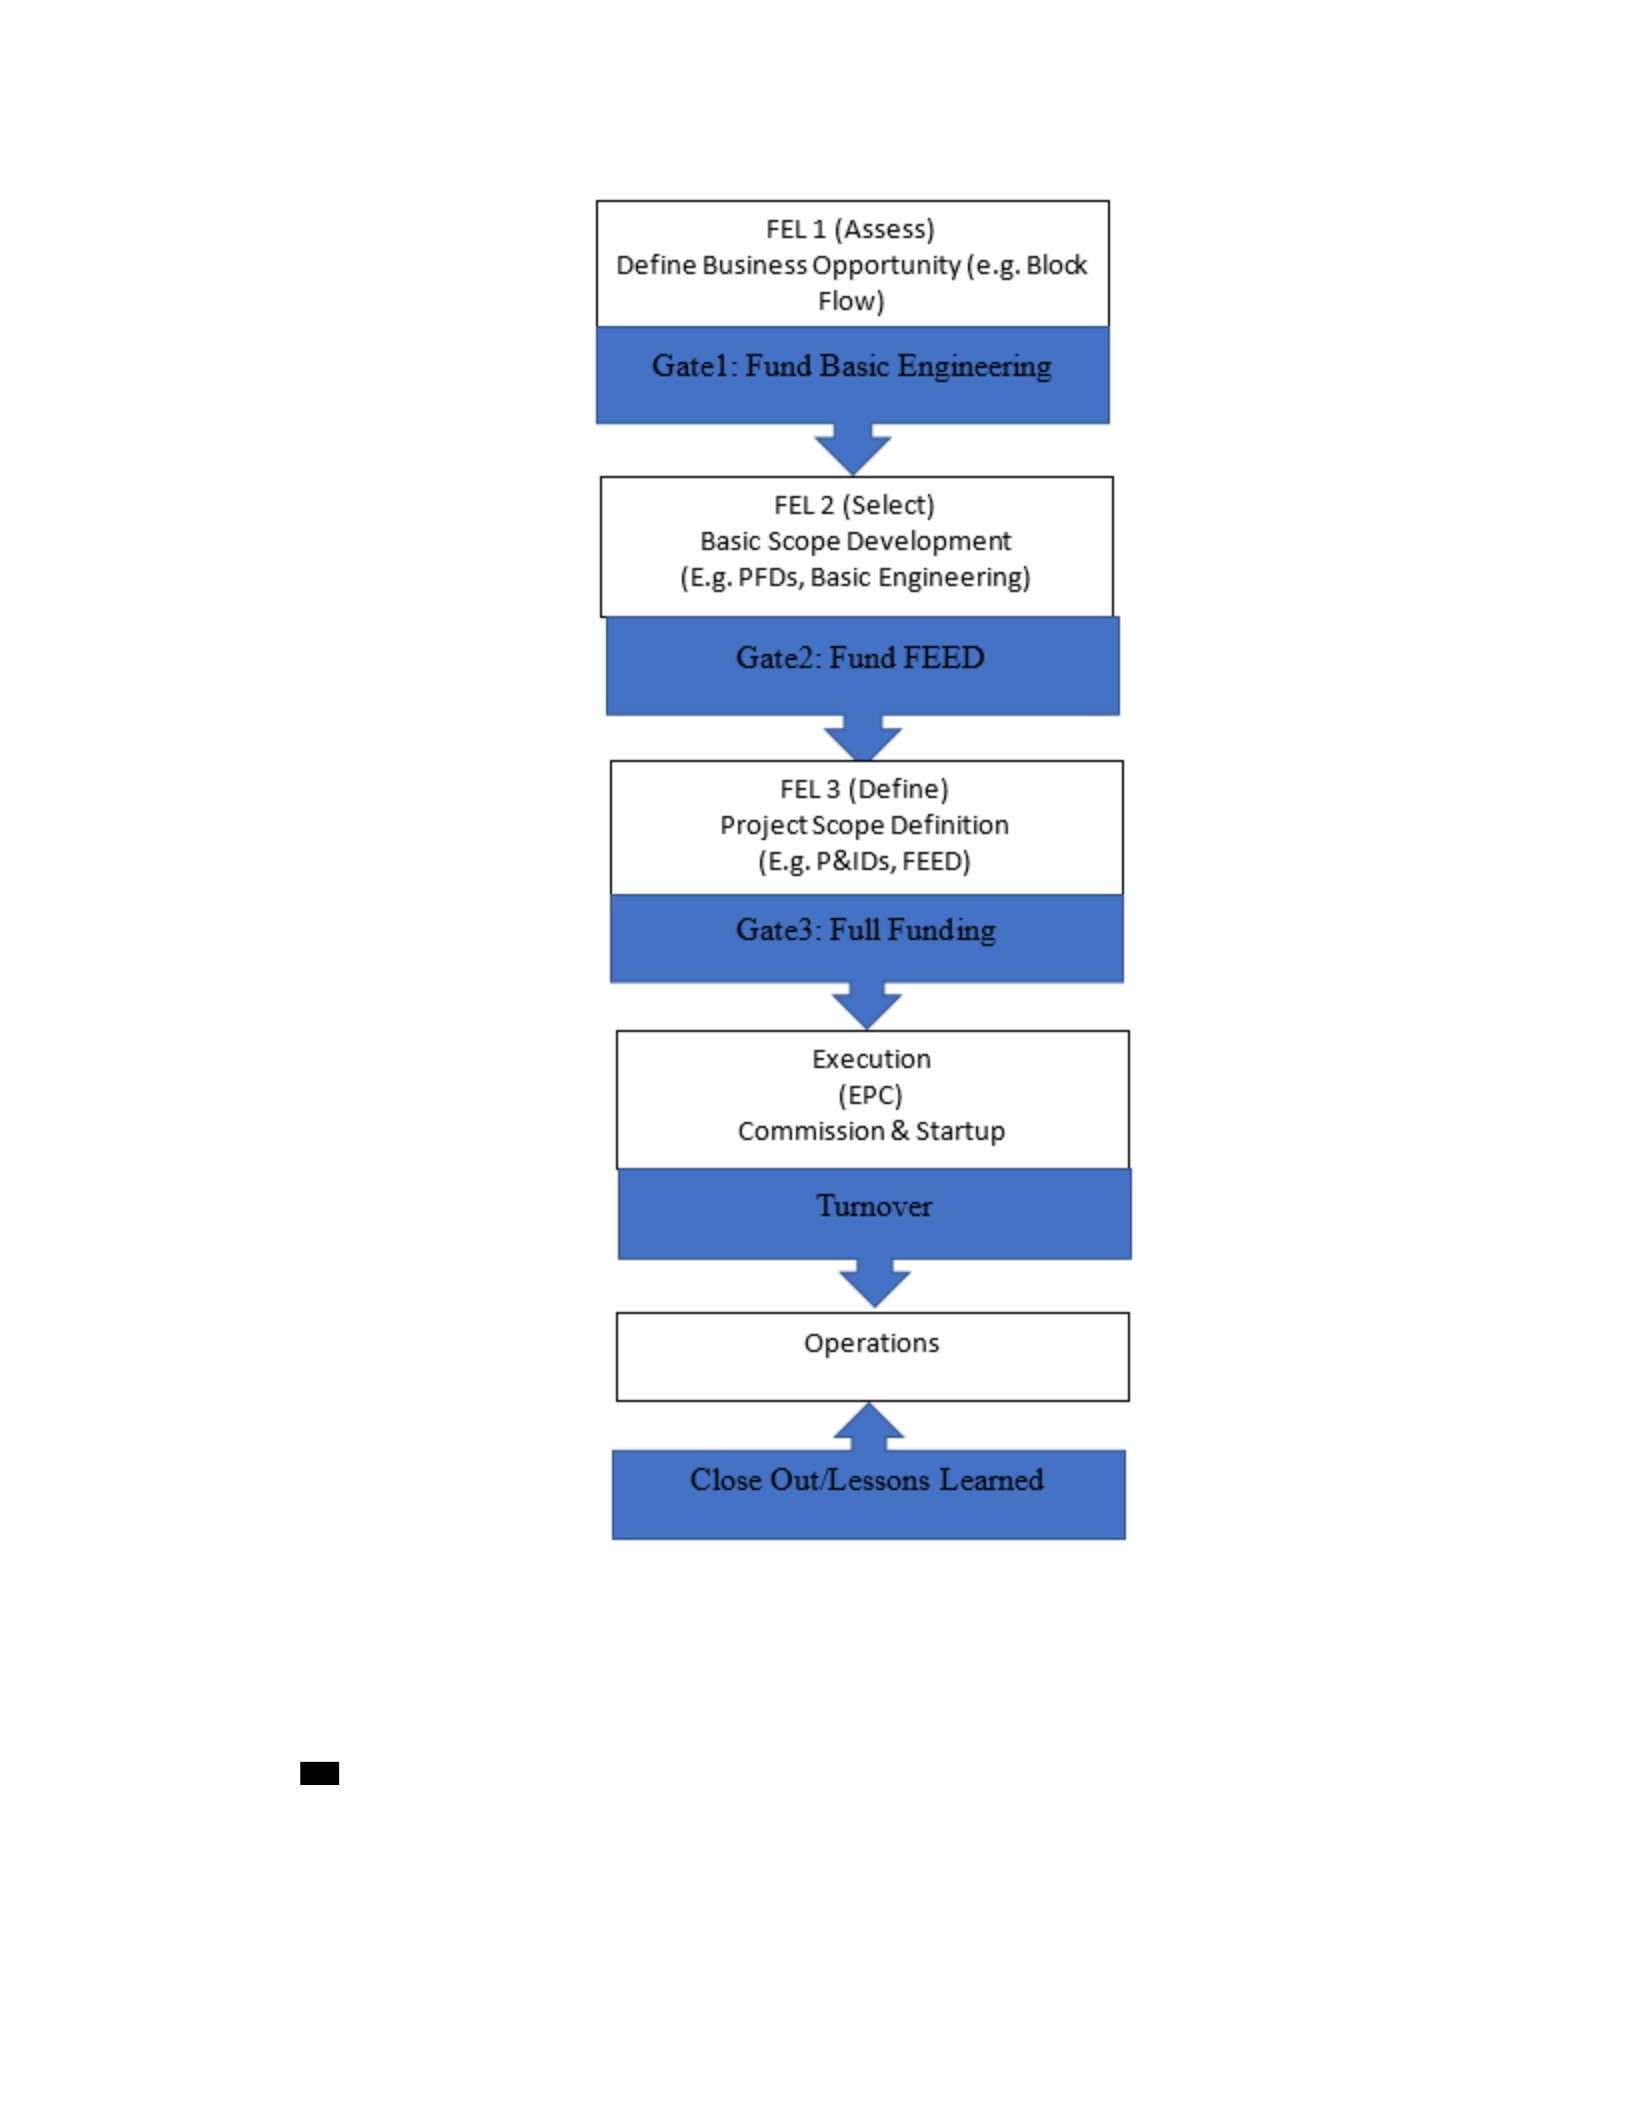
Hollmann et.al. define major capital projects are developed in stages with gates between
one stage to another. “Front-End Loading – FEL is where the scope of a project is set so
that the EPC (Detailed Engineering, Procurement and Construction) phase can proceed
with efficiency work.” (Patty and Denton 2010b). Various stages and stage gates are
shown below in the figure 2.1. The close out/lesson learned the arrow is reversed
representing that the data collected during lesson learned will be used in the above stages.
16
Figure 2.1 Life Cycle of a Capital Project (Hollmann 2016)
Break-Down Structure
Break-down structure is the representation of the rational decomposition of the project.
Breakdown structure is the hierarchical representation of a complete project or program

17
(CII; and COAA; 2013). The objective of the breakdown structure is to divide the work to
be done in the project into parts to effectively set ownership, scope, and budget,
management, schedule, and control (Ballard et al. 2008). It enables responsibility, planning,
control, assessment, and reporting of a portion of the project. It is hierarchical and a top
down approach (Levine 2002). According to Marco et.al., there are mainly three types of
break down structure in the construction industry:
Work break-down structure – “What”
Generally, major projects are also very complex. Therefore, the scope of the work is broken
down into small pieces. WBS divides and subdivides the project into smaller packages that
can be smoothly executed and controlled.
Organization breakdown structure – “Who”
It defines and creates boundary of ownership for the portion of the work at each level of
the project. The responsibility includes reporting, control, management, assessment, and
smooth flow of the work.
Cost break-down structure – “How much”
It determines the cost of the packages or for a portion of the work at different level of the
project. It enables better estimating and cost control of the entire project by assessing each
level of work (Marco 2011).
Project Control and Management System (PCMS)
PCMS is a system put in place to have control over the project. It involves skill, work
process, procedure, policy, tool, software, equipment, principle, and supporting culture
which collectively serve together for control in the organization. According to the
Construction Industry Institute (CII) uses “PCMS includes the people, processes, and tools
for the planning and execution of all phases of capital projects including, but not limited
to, estimating, planning, scheduling, change management, cost control, progressing, and
forecasting.” According to CII, PCMS comprises seven functions (estimating, planning,

18
scheduling, cost control, change management, progressing, and forecasting) across five
project phases (design, procurement, construction, commissioning and start-up).
“Planning: The process devoted to clearly identifying, defining, and determining the
execution means and methods necessary to achieve project goals and objectives before
execution of means and methods. Planning may involve work packaging.
Change Management: The process of effectively identifying, evaluating, and asking
decisions on new or revised scopes of work and monitoring implementation, all in an
expeditious and systematic fashion.
Estimating: The art and science of predicting the cost, time, and resources to deliver a scope.
Scheduling: The art and science that results in a time-phased plan of activities that indicates
what is to be done, when, by whom, and with what resources.
Cost Control: The process to catalog and analyze budgeted and actual expenditures of
activities for purposes of timely identification of cost trends, problems and opportunities
during the course of the project. Cost control is not just cost accounting.
Progressing: Determining the status of project completion using a consistent method,
which should include earned value.
Forecasting: The process of continuously predicting the outcome of cost, time, and
resources required to complete a scope.” (O’Brien et al. 2012).
The system must provide the information needed for the project team and project
participants to identify and correct problem areas and, ultimately, to keep project control
elements like costs and schedule under control. PCMS pursuit is a means by which we
attain a desired state of operations in which we reliably achieve our objectives and goals.
Without corrective actions a project control system becomes merely a cost/schedule
reporting system (Diekmann and Thrush 1986).

19
Critique of Traditional Project Control in Construction
As per the construction encyclopedia says, “Project control is defined as the ability to
determine the project status as it relates to time and schedule selected. Since a project plan
can never be maintained as originally developed, it is necessary to have a control system
that will enable manager to take corrective actions.” (Popescu 1995). The encyclopedia
definition, project control is a correction system rather than a controlling system which
already believes that project will not follow the original plan and once it deviates out of the
plan then corrective mechanism is applied. This shows the reactive and after the effect
theory of control given by construction encyclopedia.
Mubarak says, “Project control is a continuous process that involves the following
functions:
• Monitoring work progress
• Comparing it with baseline schedule and budget (what they were supposed to be)
• Finding any variances, determining where they are and the extent of the variances,
and analyzing them to discover the causes
• Taking corrective action whenever and wherever necessary in order to bring the
project back on schedule and within budget” (Mubarak 2015).
Again, similar to construction encyclopedia, Mubarak et. al., also describes project control
as after the fact corrective mechanism and not a system that is real proactive and prevents
project to go out of control, real time.
The Project Management Institute (PMI) defines “A project management function that
involves comparing actual performance with planned performance and taking appropriate
corrective action (or directing others to take this action) that will yield the desired outcome
in the project when significant differences exist.” (PMI 2013). PMI also states project
control as a corrective mechanism which does the measurement function and comes into
action when project gets off the track.

20
Generally, in construction, project control serves as an accounting or measurement
reporting function, because corrective action is functionally performed too late for
prevention. Emphasis is not on having a control system which prevents things from going
wrong in the first place, but to wait till things go out control and then control it.
Patty and Denton describe it as attempting to control a live process with an accounting
system (Patty and Denton 2010b). In 1980’s advanced manufacturers were abandoning
critical path method (CPM) except for long range planning. This was about the same time
the engineering and (EPC) industry began adopting critical path method (CPM) scheduling
and often considering it sufficient to control construction (Patty and Denton 2010b).
Overall, project controls is way too little, way too late.
Project controls have traditionally been focused on after-the-fact detection of variances
(Ballard 2000). Traditional project controls is more of a reactive approach rather than
proactive approach. There is lack of real time control concept in the current or traditional
project controls.
Kopisda et.al. say, traditional control methods are slow and inaccurate which could be the
reason of their infrequent actual control. Since current data collection methods are time
consuming and expensive especially for real-time, it hampers extensive data collection
within optimal time line (Navon 2005). According to Kopsida et. al., to have a more
accurate project controls over a project it is necessary to have real time monitoring and
control (Kopsida et al. 2015).
The earned value analysis (EVA) used widely in the industry to monitor the project is
flawed. The apparent weakness in EVA is that despite EVA display project budget
productivity and earnings plan, it could not provide information regarding if right work is
happening, the right way, at the right time in the project (Ballard 2000). “Although things
appear to be on track, the train is destined to eventually run off the rails” (Ballard 2000).
Work does not conform with quality, sequence, duration, or work progresses in a haphazard
manner just to show progress, etc. Only one concern remains at site that is how to show

21
progress on the project S-curve. It eventually leads to deviation from critical path,
entanglement, multitasking, and unrest. Finally, when too much delay is occurred, blame
game and a scapegoat is sought.
Control is the information, methods, measurement, culture and governance operating
together to assure right things happen consistently and reliably (Patty and Denton 2010b).
This definition suggests need of PCMS which prevents things from going out of control in
the first place and make sure right things are happening reliably and consistently.
Concepts of Production Control
“Consequently, project control consists of monitoring progress toward project objectives
and taking corrective action when the ship appears to be off course.” (Ballard and Howell
1998). The concept of project controls in construction is different from production control.
In project controls, controlling part comes to action when things get off the track, like
schedule control comes into action when the project already gets behind schedule, etc.
However, in production control, emphasis is to have a system so that production does not
get off track at the first place. In other words, production control emphasizes having a
system of proactive controls which prevent things from getting out of control in the first
place. The objective of production control is to detect negative variances from target, so
corrective action can be taken (Ballard 2000).
It is impossible to control project effectively just by relying on productivity and progress
data, and without understanding work flow or production. “Production control conceives
production as a flow of materials and information among cooperating specialists, dedicated
to the generation of value for customer and stakeholders.” (Ballard 2000)
2.7.1 Production Flow System
Production is the process of converting input to output or a process of adding value to the
customer (Ballard 2000). In manufacturing, flow is the progressive achievement of value
adding tasks, so that as a product proceeds from definition, to design, to launch and from
order to delivery; resources will proceed clear to the hands of the customer as finished

22
goods or services without stopping, back flowing or being scrapped (Boeing Production
System, Wichita Division, Terms and Definitions, The Boeing Company, 2004.).
Flow is the movement of products, packages, resources from upstream to downstream in a
value chain or production line where value is added to it which eventually turns into final
products/project. Flow control causes desired sequence and rate of the flow of resources
(information, materials, equipment, etc.) to move through a network or process or value
chain (Koskela 1999). In a process or value chain or flow line, flow control system
maintains the consistent and reliable flow.
2.7.1.1 Types of Flow System.
There are two types of flow system described below.
1. Push Flow: In manufacturing, push flow planning/control or push approach means
“make to stock” in which the production or flow rate is not based on actual demand,
however, the rate of flow is governed by the pre-determined date. Further, push is
based on forecast rather than actual demand. It is an inventory based system where
inventory is stocked. Push systems can lead to a project carrying excessive
inventory (Spearman and Hopp 2000).
2. Pull Flow: In manufacturing, pull flow planning/control or pull approach means
make to order. The rate of flow is governed by the rate of the individual process or
by the demand of customer in the value chain. Flow is based on the state of the
system (the amount of work in process, the quality of available assignments, etc.).
Pull approach puts caps on work in process and reduce inventory (Spearman and
Hopp 2000).
Advantages of pull over push
The advantage of pull over push is given below. This section is highly dependent on
Spearman et. al.

23
• Reduce work in process
• Reduce inventory
• Reduce resource waste
• Enhances work flow
• Increases flexibility
• Endure changes
• Duration of the total project could be reduced by the reduction of individual task
durations
2.7.2 Construction Perspective of Flow, Push, and Pull
“During facility design and construction, flow is the consistent availability of what is
needed, (materials, information, equipment, workface, and labor) to add value. It is
achieved by the organization of work process systems so that what needs to be done (e.g.,
designed, supplied or assembled), becomes obvious and available to those responsible to
do it, when and where they need to perform.”(Patty and Denton 2010b).
Construction project delivery could be considered a production flow system where
resources flows to make various small products called as work task package (WTP) which
sums up to a project (Patty and Denton 2010; Ballard 2000). To have production flow,
there is a need of production flow control system to maintain the desired flow rate and
sequence. In Push the work task package is pushed to the workforce to install value at the
workface, while in pull, work is pulled by the workforce according to their need, status,
and pace to add value at the workface.
Task leads are assigned to the WTP and verifies task plan completeness, and management
verifies resource readiness. Task durations are determined by task leads, aligned with their
manager (e.g., by foremen, aligned with their managing general foreman) based on
available resources. The workface is made visible by each responsible task lead taking
ownership of the need to keep their manager and thereby leads dependent on them and
informed of their progress. Upon the final notice of availability of the workface, the next

24
work task package proceeds. This is done with sufficient lead time such that no loss of time
between tasks occur. Any available workface, pulls the next value creating work task
package into execution in the most logical order that the team can determine (Patty and
Denton 2010b).
2.7.2.1 Push-Pull Interface in Construction
“Pull systems cannot be used to trigger beyond the current window of production,
necessitating a push system for long-term resource allocation and long-term resource
balancing. This necessitates a push-pull interface or control handoff, where the transition
from push to pull occurs on the project.”(Patty and Denton 2010b).
In the beginning of the capital project execution that is from detailed engineering, push
flow is maintained until the pipeline is filled with task packages (complete with information,
materials, equipment and labor resources to complete the scope of work for each package).
Nonetheless, as soon as the pipeline is filled the flow is turned to pull approach. This is
how the push-pull approach should work in the EPC capital project delivery. Pull is started
with respect to the rate of construction after the pipeline is filled by the push flow of the
earlier process. For instance, after construction begins to pull, procurement and task
packaging must keep up. Likewise, detail engineering, including review must keep pace
with procurement for construction to continue to be pulled according to the need of
construction. Similarly, for procurement, the materials or equipment’s are procured enough
to fill the pipeline so that once construction is started, and when the pipeline is filled then
the flow is governed per pull flow according to construction need. Also, to avoid risk and
uncertainty, items which are easy to store is already procured according to pull flow. Long
lead items are procured based on current schedule progress using lead times.
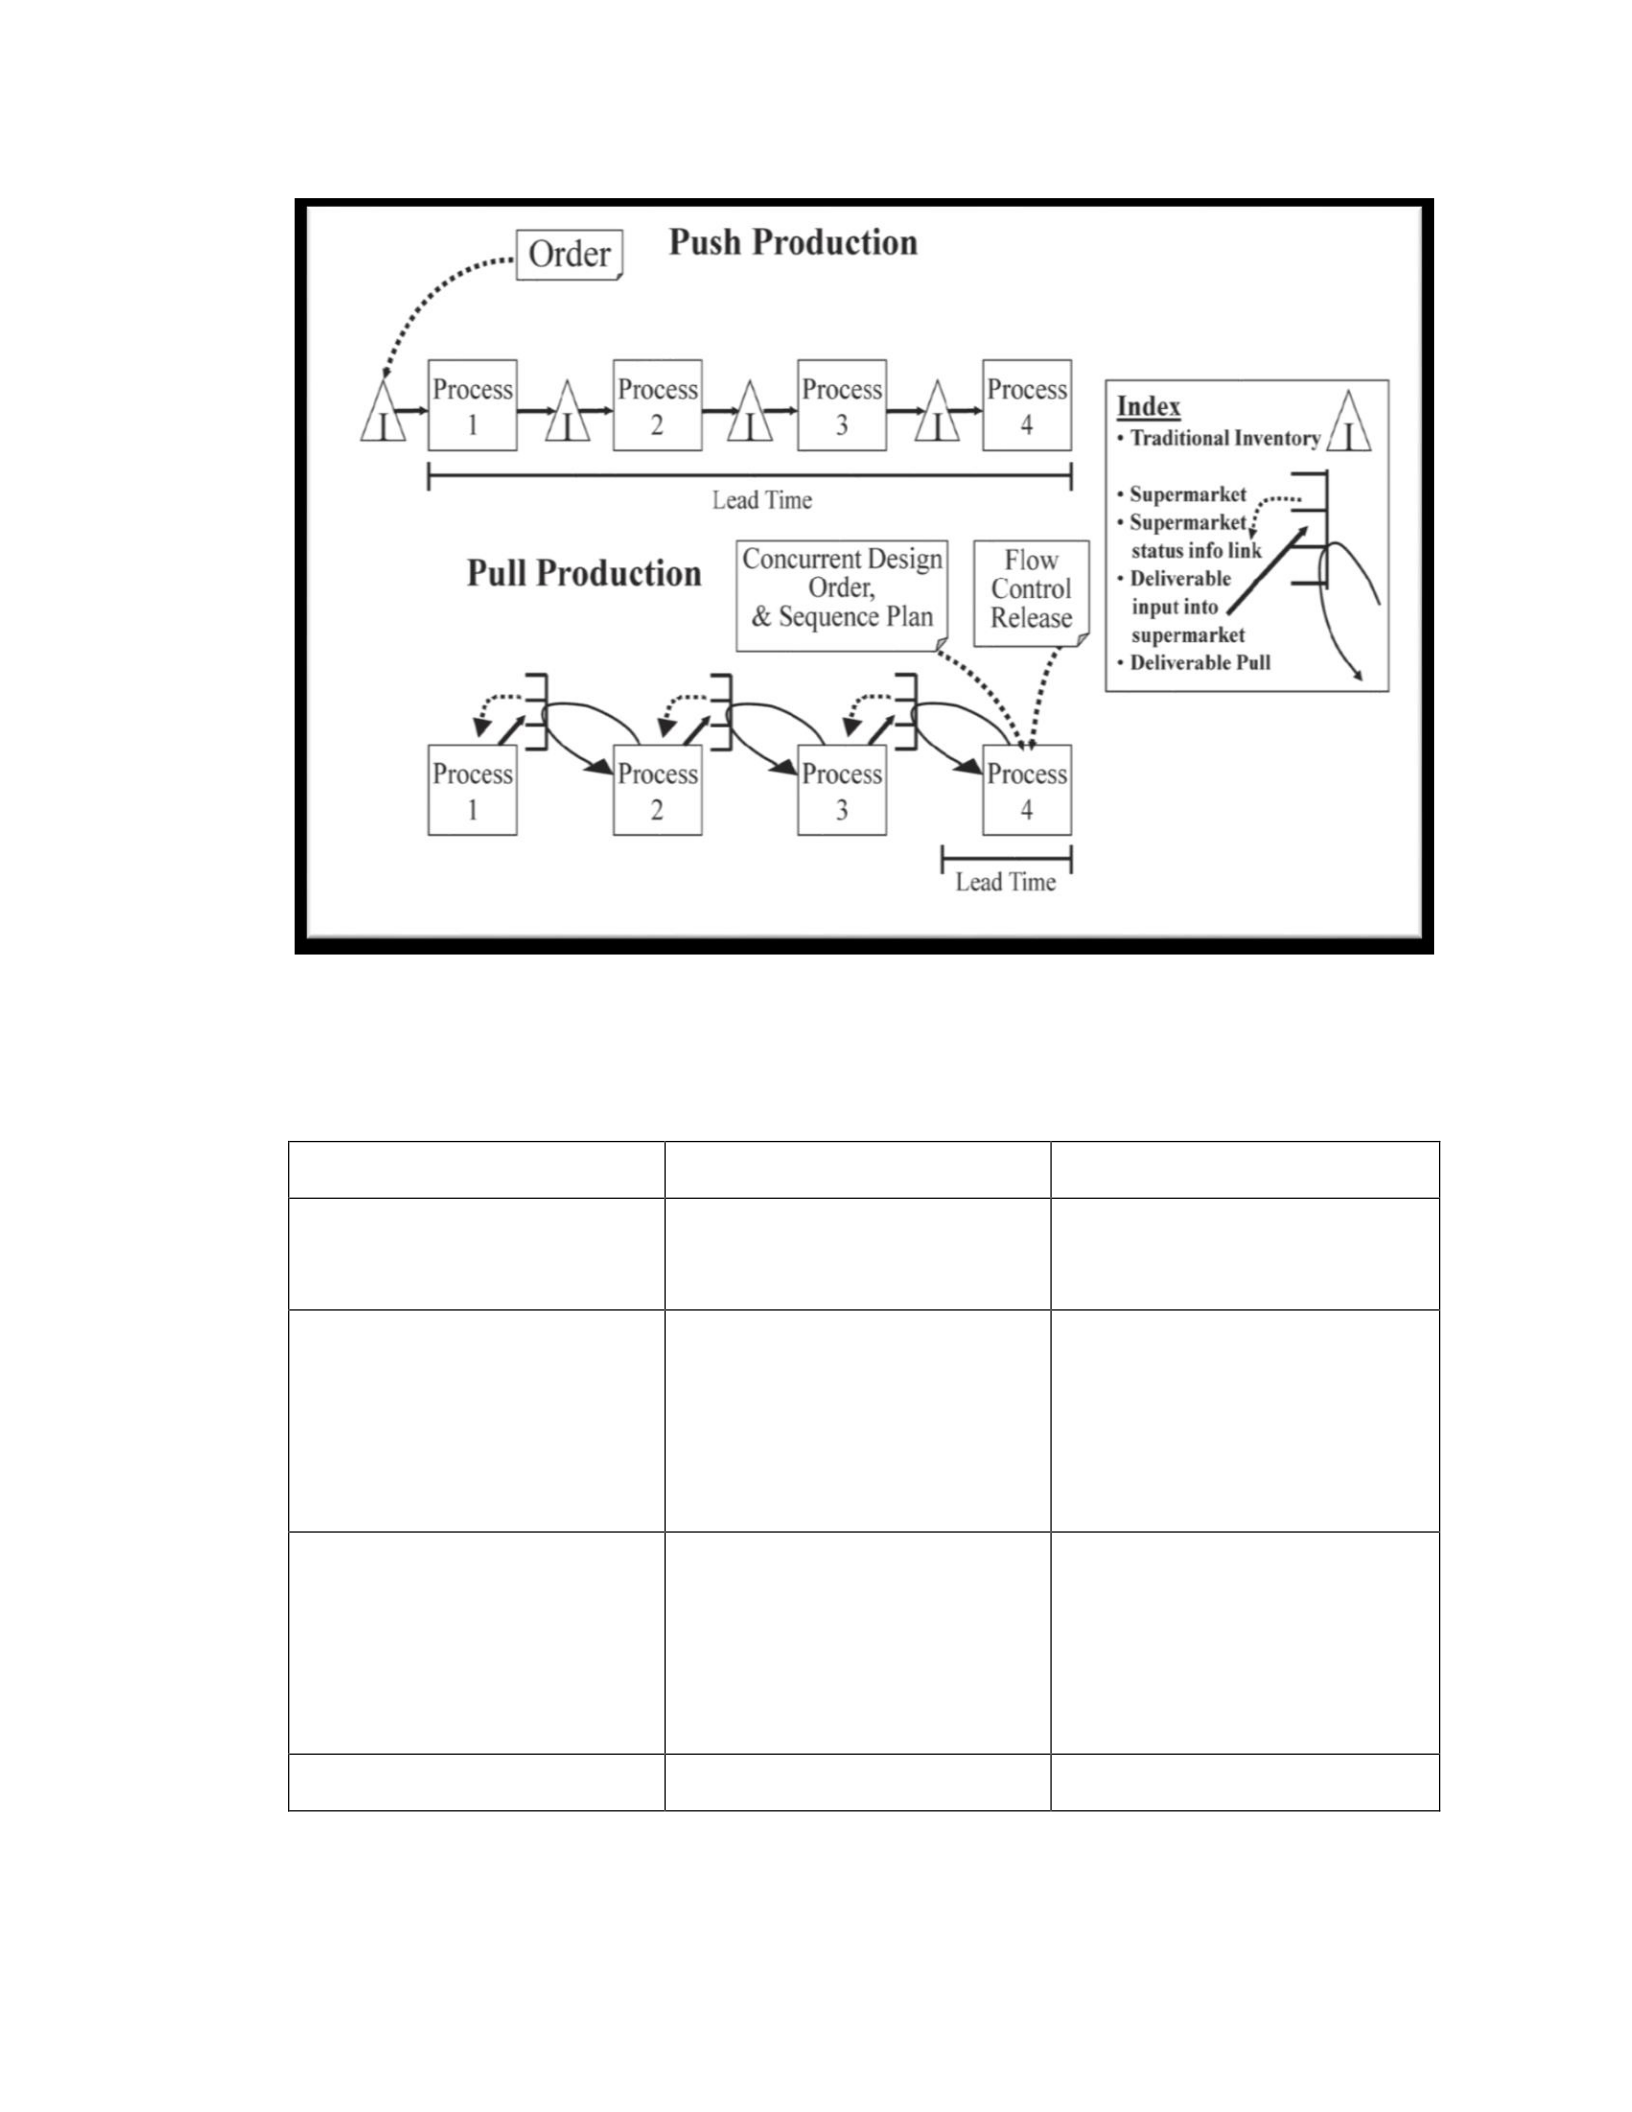
In figure 2.2, there are four processes in the flow system or value chain. Let’s assume it an
EPC value chain or flow system and assume the processes as mentioned below in the table
2.1.
25
Figure 2.2 Push and Pull Flow System (Patty and Denton 2010b)
Table 2.1 Process in the EPC flow system
Process
Name
Product
Process 1
Engineering
Detail design or issue for
construction (IFC) drawing
Process 2
Procurement
Procure materials and
services like subcontractors
outside the company per
design
Process 3
Material Management
Manage materials procured
by the procurement,
Package or Kit it, and send
it to the construction.
Process 4
Construction
Install materials on the site

26
As shown in figure 2.2, the traditional inventory “I” function is to store the products that
comes out of each process. Supermarket is the buffer of planned and available work task
packages; it is a temporary, limited quantity of work task packages available to the
subsequent workface. Supermarket symbolized as a buffer where in-process packages may
be stored as buffer for some time. (Patty and Denton 2010b).
In push flow, the flow rate is governed by the pre-determined date. The next
process/customer takes the product from the inventory at its own rate or the availability of
the product. Initial planning is done to feed construction need but due to the vulnerable
nature of construction that is process 4, flow cannot be attained based on push flow (Patty
and Denton 2010b).
In the pull flow system, the rate of the flow is determined by the demand rate or the status
of the slowest or the last process. For a construction value chain, we want to design the
system so that construction is the slowest or bottleneck process. It will be followed by
commissioning and startup phases. Therefore, the flow rate of value chain is to be governed
by the rate of the construction which is process 4 in the figure 2.2. In other words, flow
rate is construction driven. Therefore, in pull flow all other process will keep its pace and
be sequenced to feed construction.
To start process 4 there is the need to fill the pipeline (i.e., put in-process packages in the
supermarkets of process 1 to process 4. When the pipeline is filled through the process 1,
2, and, 3 and they are prepared to sustain process 4, that is construction, then construction
starts pulling and pull flow begins. This is push-pull interface.
In some cases, like the installation of long lead items (transformers, boilers, etc.)
construction i.e. process 4 may not be the slowest process or the bottleneck. Procurement
is bottleneck, the procurement i.e. fabrication and shipment of the long lead items takes the
maximum time not the installation or construction process. Therefore, in such cases the
slowest process or bottleneck process needs to be the flow decider. Traditionally for long
lead items, a fixed date is given by the suppliers, and therefore those items are considered

27
as milestones and is governed by push flow or pre-determined date. This is not optimal.
Suppliers, long lead or otherwise should commit to durations, triggers, and transparency of
schedule progress established with the suppliers and the delivery date is allowed to float
according to the progress of the project until the trigger occurs, fixing the delivery date, at
the latest responsible moment and those delivery dates become interim milestones. Pull
flow is confined between such interim milestones which works for the duration of the lead
time, on a push flow concept. In other words, pull flow occurs during construction between
interim milestones that were allowed to float according to the rate of construction as long
as possible. By providing lead times to enable delivery with a sufficient time buffer ahead
of the sequence needed, a balance is achieved, providing reasonable flow control,
preventing buildup of site inventory that may be difficult or expensive to store, and assuring
suppliers with sufficient lead time to materials and equipment will be available when
needed.
Both push and pull flow (planning and control) is necessary to manage EPC (Patty and
Denton 2010b). The construction or EPC value chain must be an optimal blend of push,
pull, and push-pull interface to meet the ultimate goal of setting the flow line which is to
meet the demand of the customer consistently and reliably.
Critical Chain Project Management (CCPM)
The concept of critical chain project management or scheduling is an extension of the
“theory of constraint (TOC)”, developed by Goldratt. The TOC states that, ‘‘Any system
must have a constraint that limits its output.’’ The system’s constraint is like the weakest
link of a chain. No matter what you do to improve other links in the chain, the chain does
not become stronger until you improve the strength of the weakest link (Goldratt and Cox
2004).
2.8.1 Lead Time and Trigger
In pulling mechanism, triggers and lead time plays a great role. Creation of value in
construction needs to be in flow. “Lead time is the time in advance of delivery one must

28
place an order” (Ballard 2000). Trigger is the mechanism to notify the responsible party
with respect to the committed lead time (Patty and Denton 2010b).
2.8.2 CPM (Critical Path Method) Enhancement through Critical Chain Method
(CCM) of Planning and Scheduling
The enhancement of CPM through CCM is described below.
1. Develop a resource loaded CPM schedule.
2. CPM time estimates in construction are typically based on pessimistic experience,
as opposed to aggressive completion time i.e. we fight for contingency time. The
larger number of management levels involved the more contingency is added
resulting in compounded contingency factors.
3. In CPM scheduling, traditionally, schedulers keep contingencies in the schedule to
protect their schedule from “global cuts” ordered by executives later in the project
to meet client expectations. Since schedulers are now used to “global cuts”
phenomena, they expect the cuts and therefore increase their initial durations. When
added up contingency is a very significant percent of total project duration.
4. CPM date based scheduling does not facilitate starting early even if a task was
known to be completed early. Also, date based schedules are so cumbersome to
update and renegotiate that there is little chance to achieve lasting project schedule
improvements from better than expected individual task performance.
5. Parkinson Law comes to the picture. It states that work expands to fit the time
allotted to it. It means if larger duration or float is allotted to the task, the task is
going to take all the duration allotted. When is the last time someone reported, task
finished early? (Patty and Denton 2010b).
6. Further, Student Syndrome which states activity is started when the remaining
duration is squeezed to be just enough to meet the due date and therefore, does not
facilitate starting early. Now during time crunch and haste if the activity encounters
any problem, Murphy Law which states anything can go wrong will go wrong,
suggests high possibility of failure. Student syndrome has high possibility which
leads project to suffer quality or delay or cost overrun for the activity.

29
7. There are many unnecessary relationships in the CPM schedules mainly based on
early estimates of available resources. It makes the schedule rigid (doesn’t change
when resources change) and restrains options analysis which compromises
recovery of time lost. In CCM schedule, only activities having physical constraints
(work face constraints, sequence constraints) have relationships. Resource
constraints must not be used for justifying the creation of relationships between
activities in the schedule (Patty and Denton 2010b).
8. From date-based CPM schedule to a logic and communication based CCM. It must
start with excellent task definition, add resource dependencies e.g. information flow,
available workface, physical dependency on safety, quality, productivity as the only
permissible relationships between tasks (Patty and Denton 2010b).
9. Add work process decision points and required triggers for lead time information
flow. “Work process decision points as triggers” are added in the schedule.
10. Fixed dates on the schedule must be removed except for critical (contractual) dates
and milestones that are important to the owner (Patty and Denton 2010b).
11. In CCM, Goldratt suggests that when making a plan and schedule, it is assumed
that each activity has 50% contingencies and therefore, the duration of the activity
is to be cut into half. The removed contingencies are summed up to utilize as buffers
to immunize the weaker section of the chain. Place the cut duration as the dynamic
feeding buffer or project buffer (Yeo and Ning 2002).
12. According to Robert Patty, however, in construction industry, this assumption is
not so useful. The 50% reduction does not work. Work task packaging must be
experienced before any contingency can be removed at all. Then what can be useful
is to ask the general foremen and foremen, “if we create a task plan for the work,
how long will it take”. What we deduct is the difference between historical duration
and the response to the above. We sum and retain that as buffers to begin with.
Then, with experience through an entire project, we begin to have a basis to reduce
the buffers and throw away what is not needed (Robert Patty, personal
Communication, May 22, 2017).
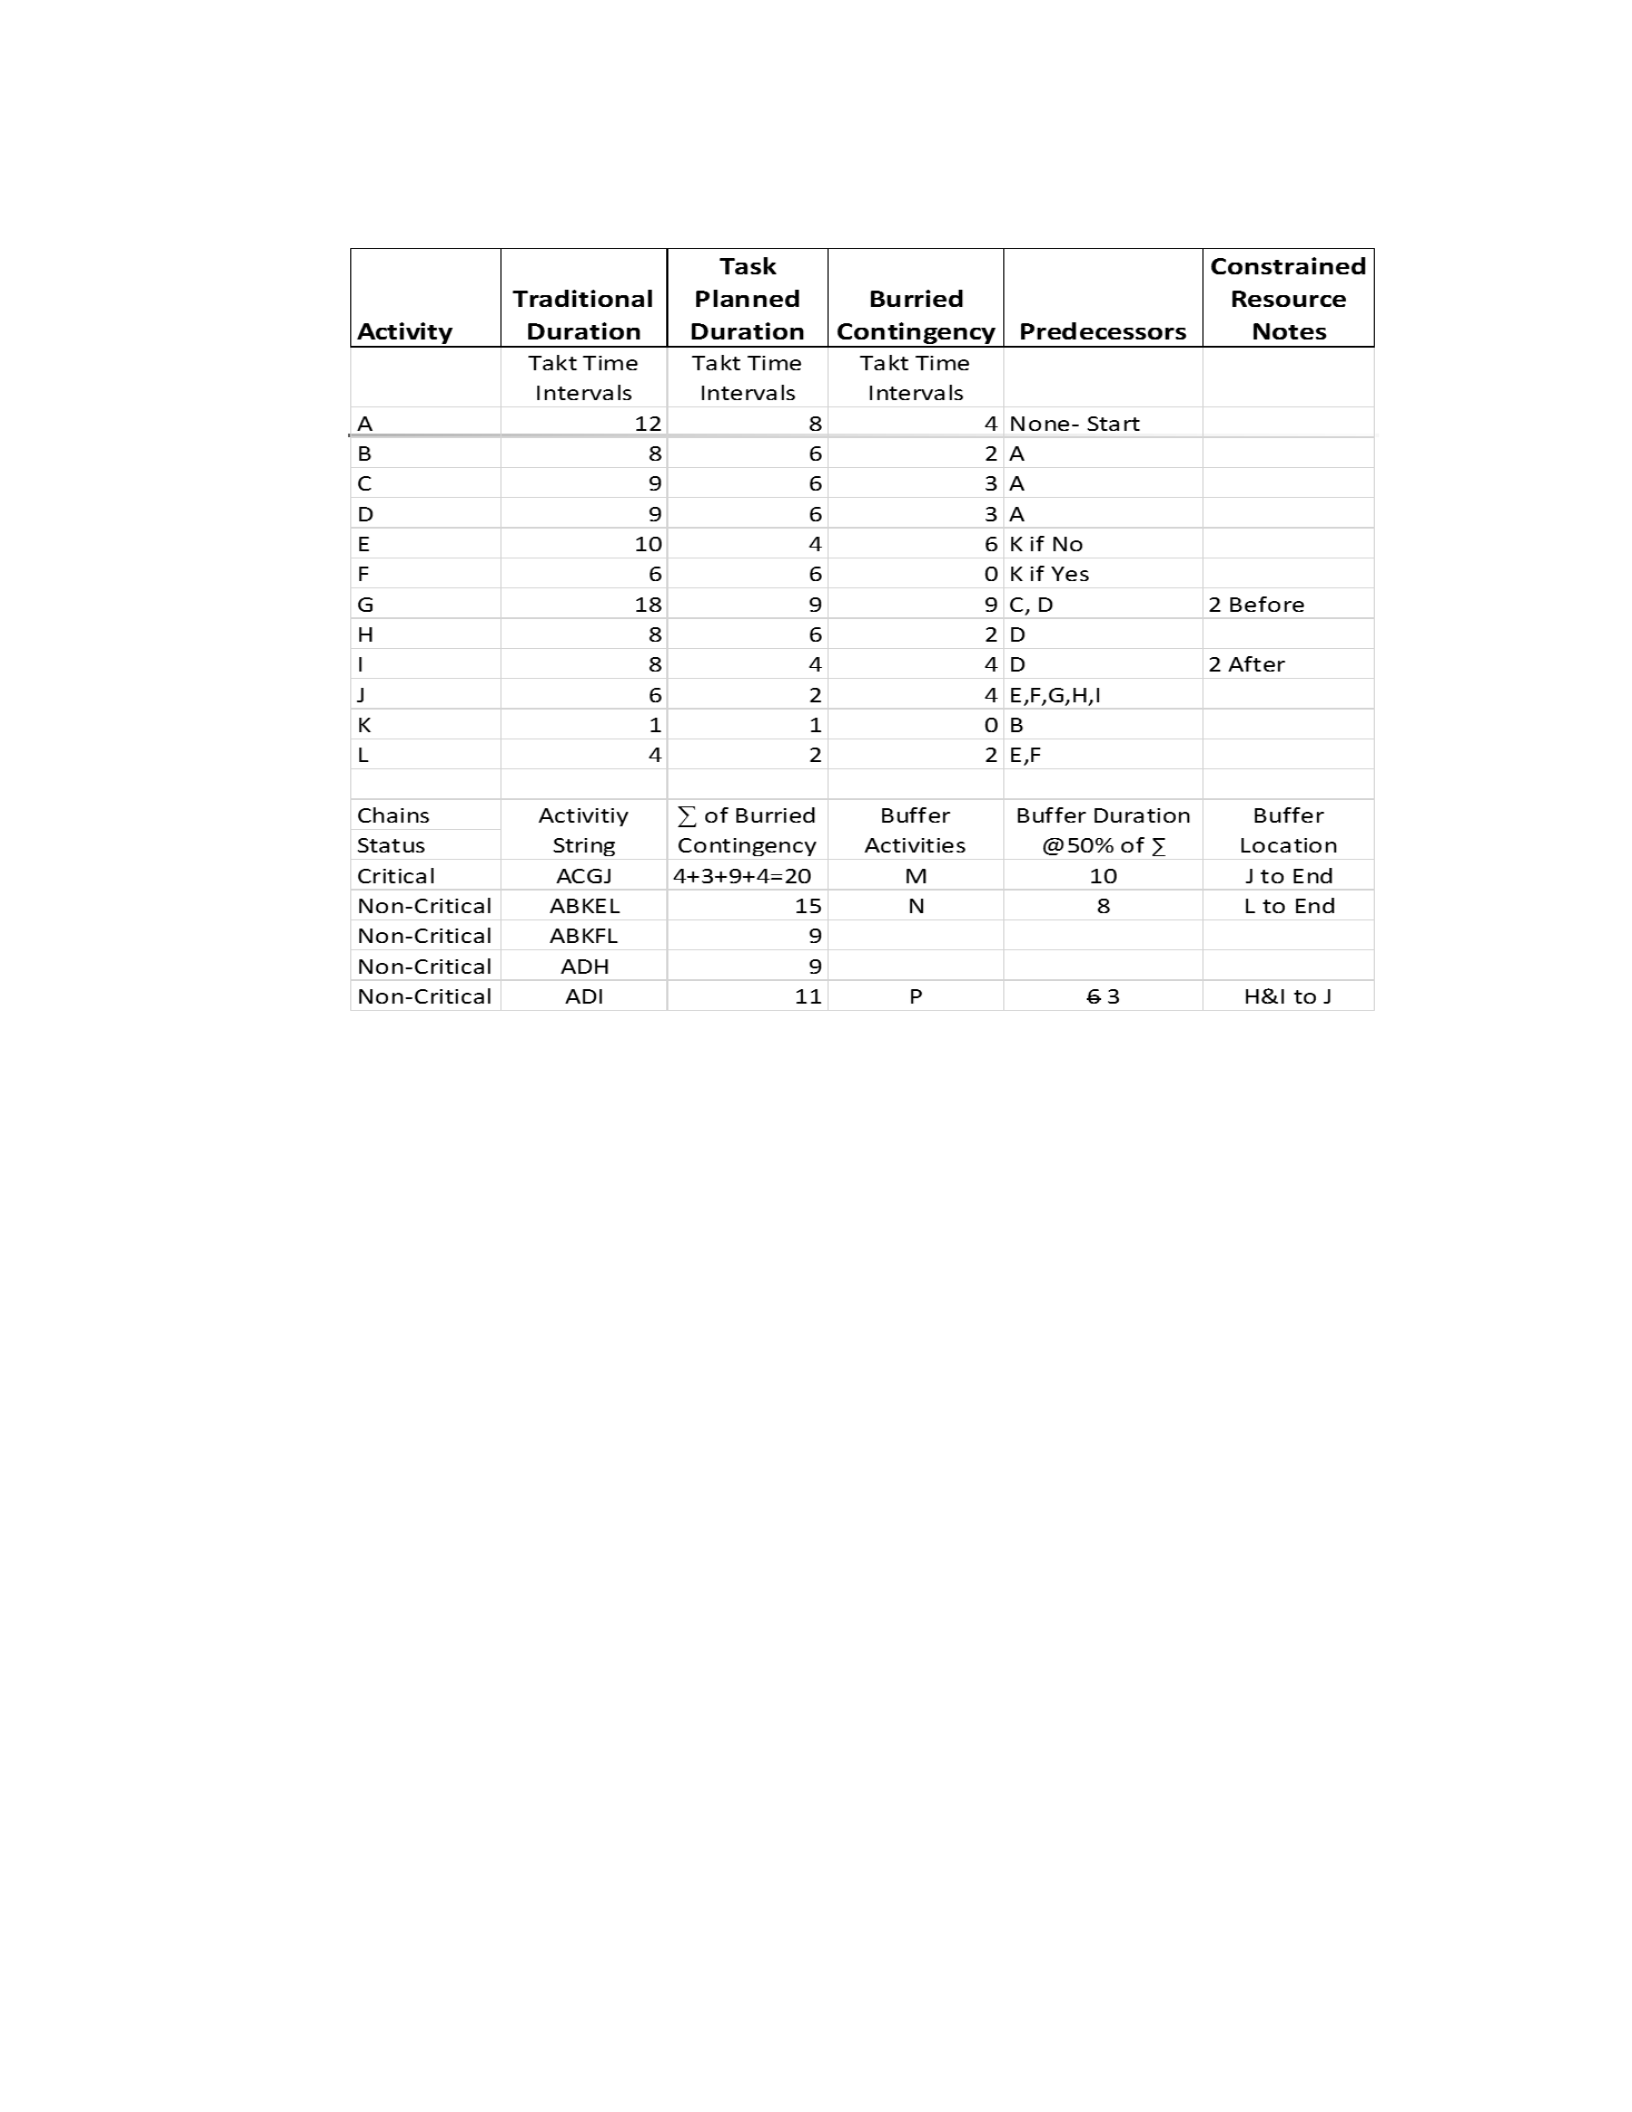
13. In CCM, as shown in the figure 2.3 and table 2.2, the critical path identified on that
basis. Dependent tasks are chained together by the requirement for workface flow
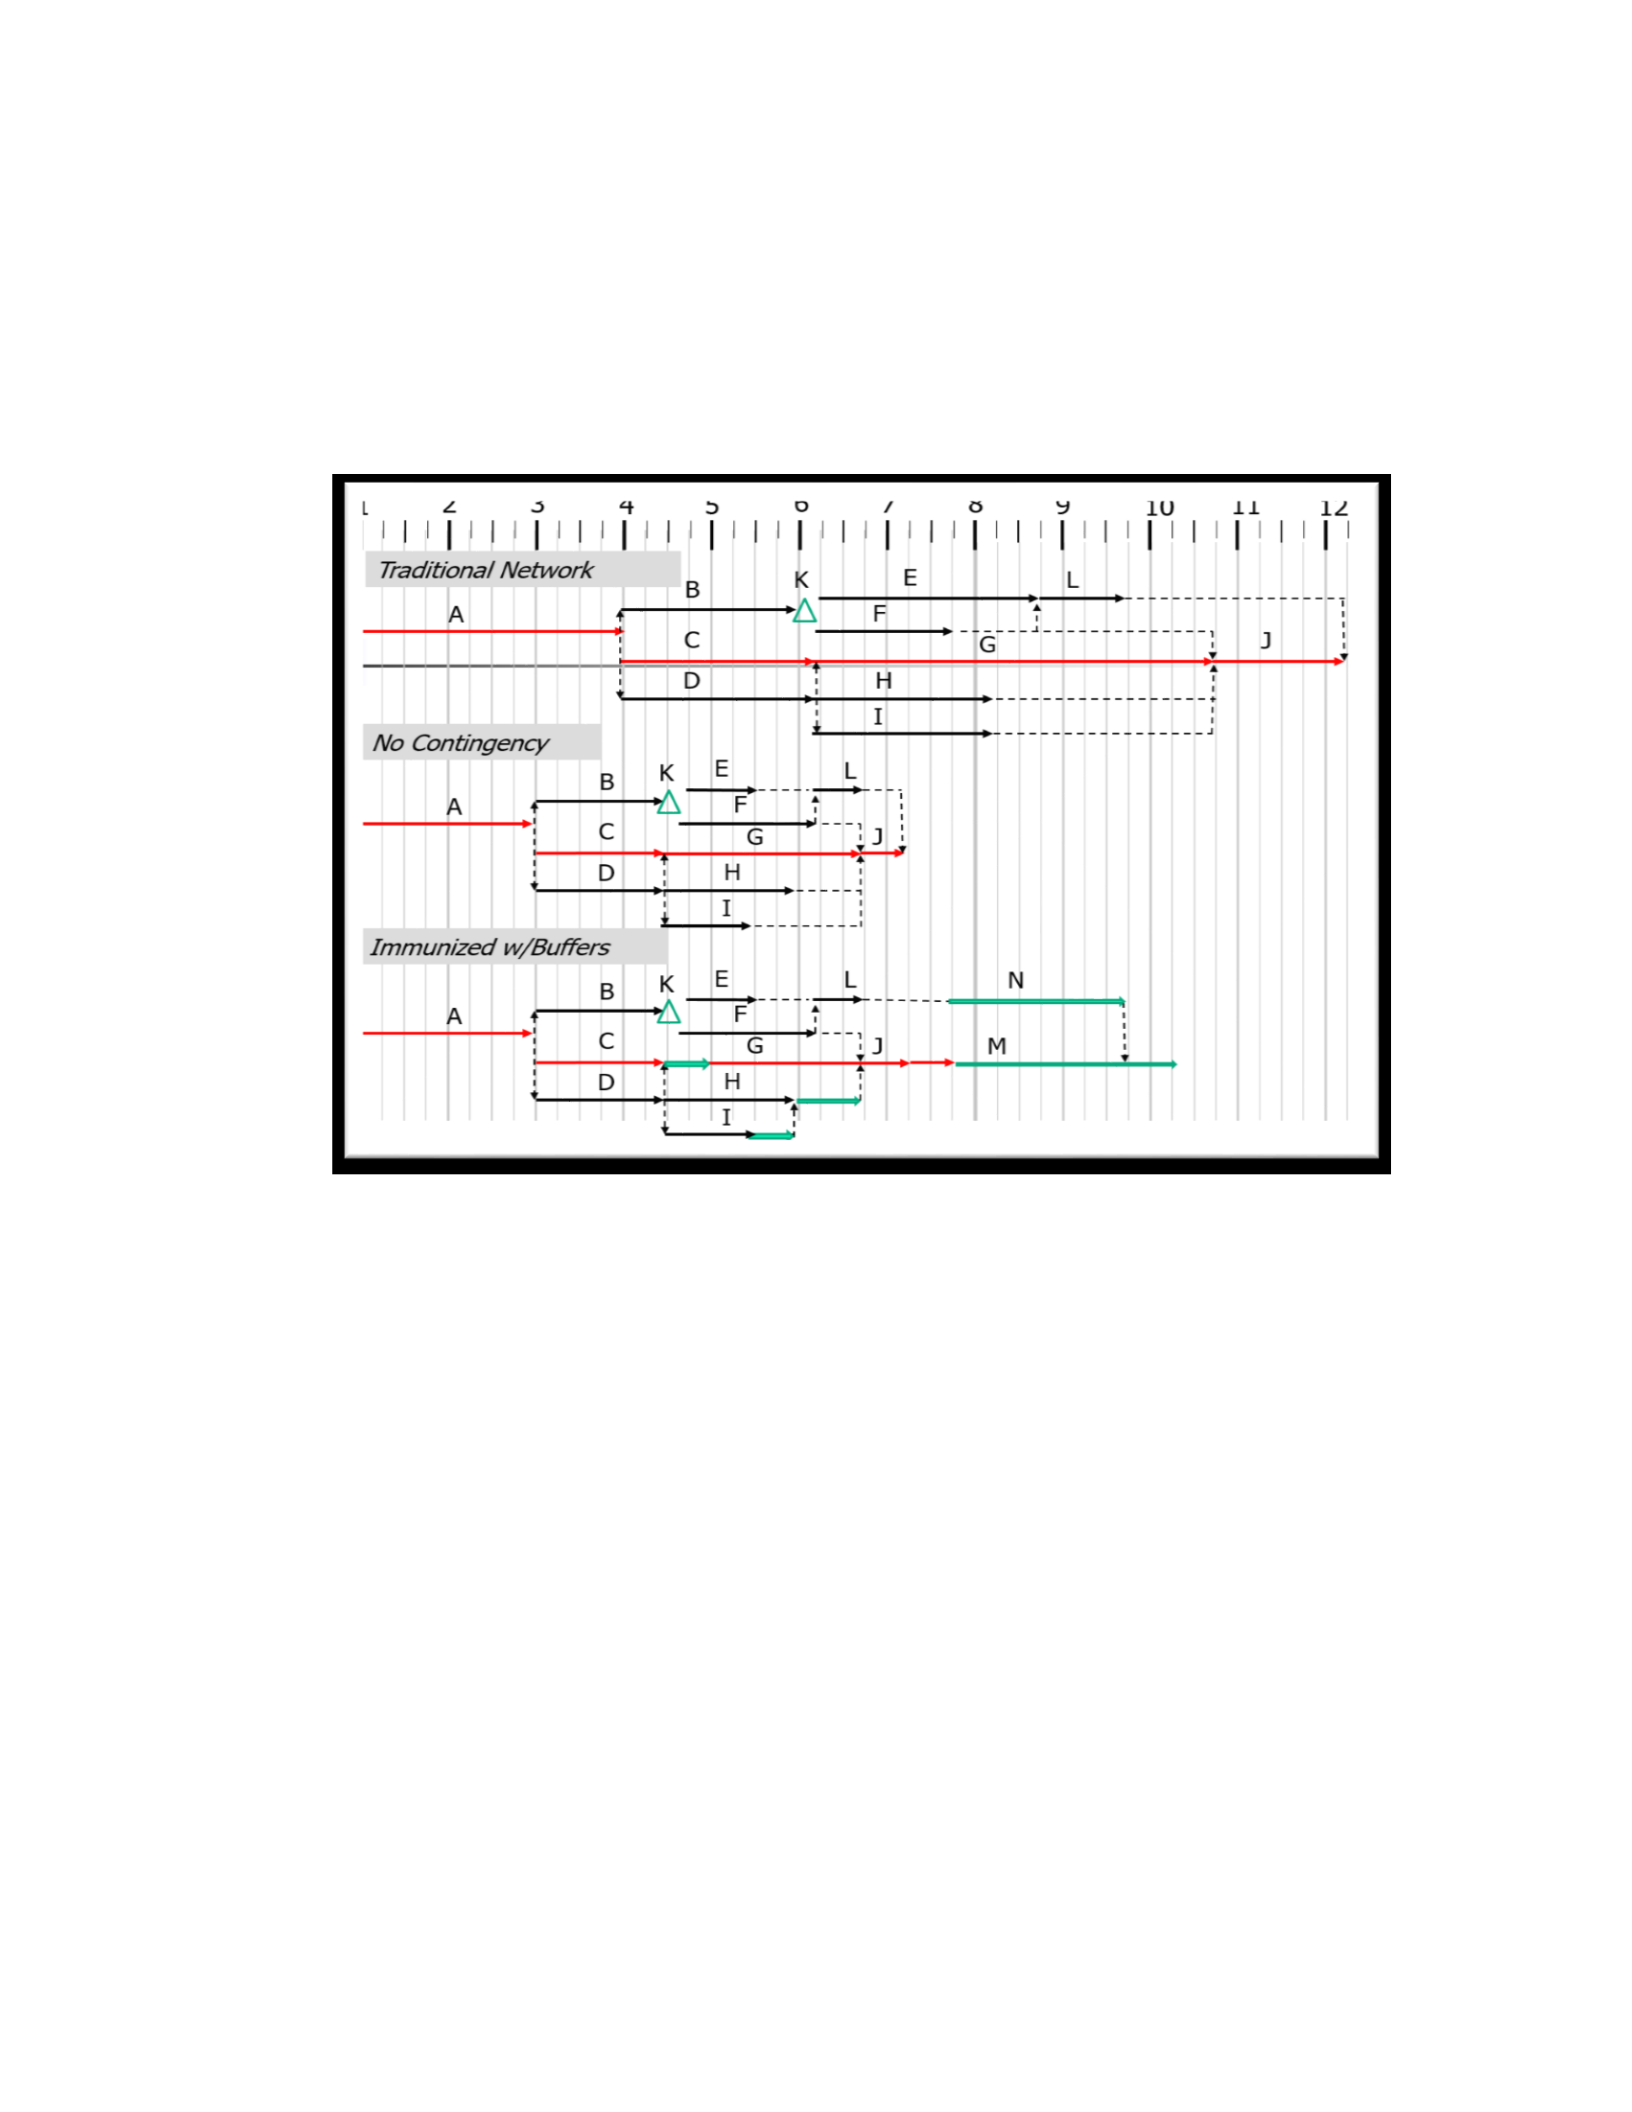
30
by dependency links for transferring information. Equipment and labor are then
balanced to assure information will continue to flow and to avoid any slowdowns
or wasted time contingency is removed from tasks summed and strategically placed
for more effective management.
Figure 2.3 Conversion of Traditional CPM Network to a CCM Network
In CCM, removed contingencies are summed separately for each sub-network of
tasks flowing into the critical path and for all tasks in the critical path. Eventually
about half of the removed contingency will be considered waste and will no longer
be needed. The contingencies are kept until experience shows it is no longer needed.
Place each summed sub-network contingency strategically as buffers where it can
immunize the project.
31
Table 2.2 Conversion of Traditional CPM Network to a CCM Network
14. Buffer: A buffer is a separate task with nothing to be performed, but having a
duration that is strategically created so that contingency time can be more
effectively managed. Buffer durations are manually altered time to time, as a time
management function. The visibility of the remaining buffer time adds value (Patty
and Denton 2010b).
15. As shown below in figure 2.4, about 1/2 the sum of each non-critical path sub-
network contingency is placed where they flow into the critical chain as a Feeding
Buffer. About 1/2 the sum of the critical path task contingencies should be placed
at the end of the project as a Project Buffer. A buffer task should be placed in front
of constrained resources not under control of the project as a Constrained Resource
Buffer, and in front of fixed dates not floating as a Fixed Decision Buffer.
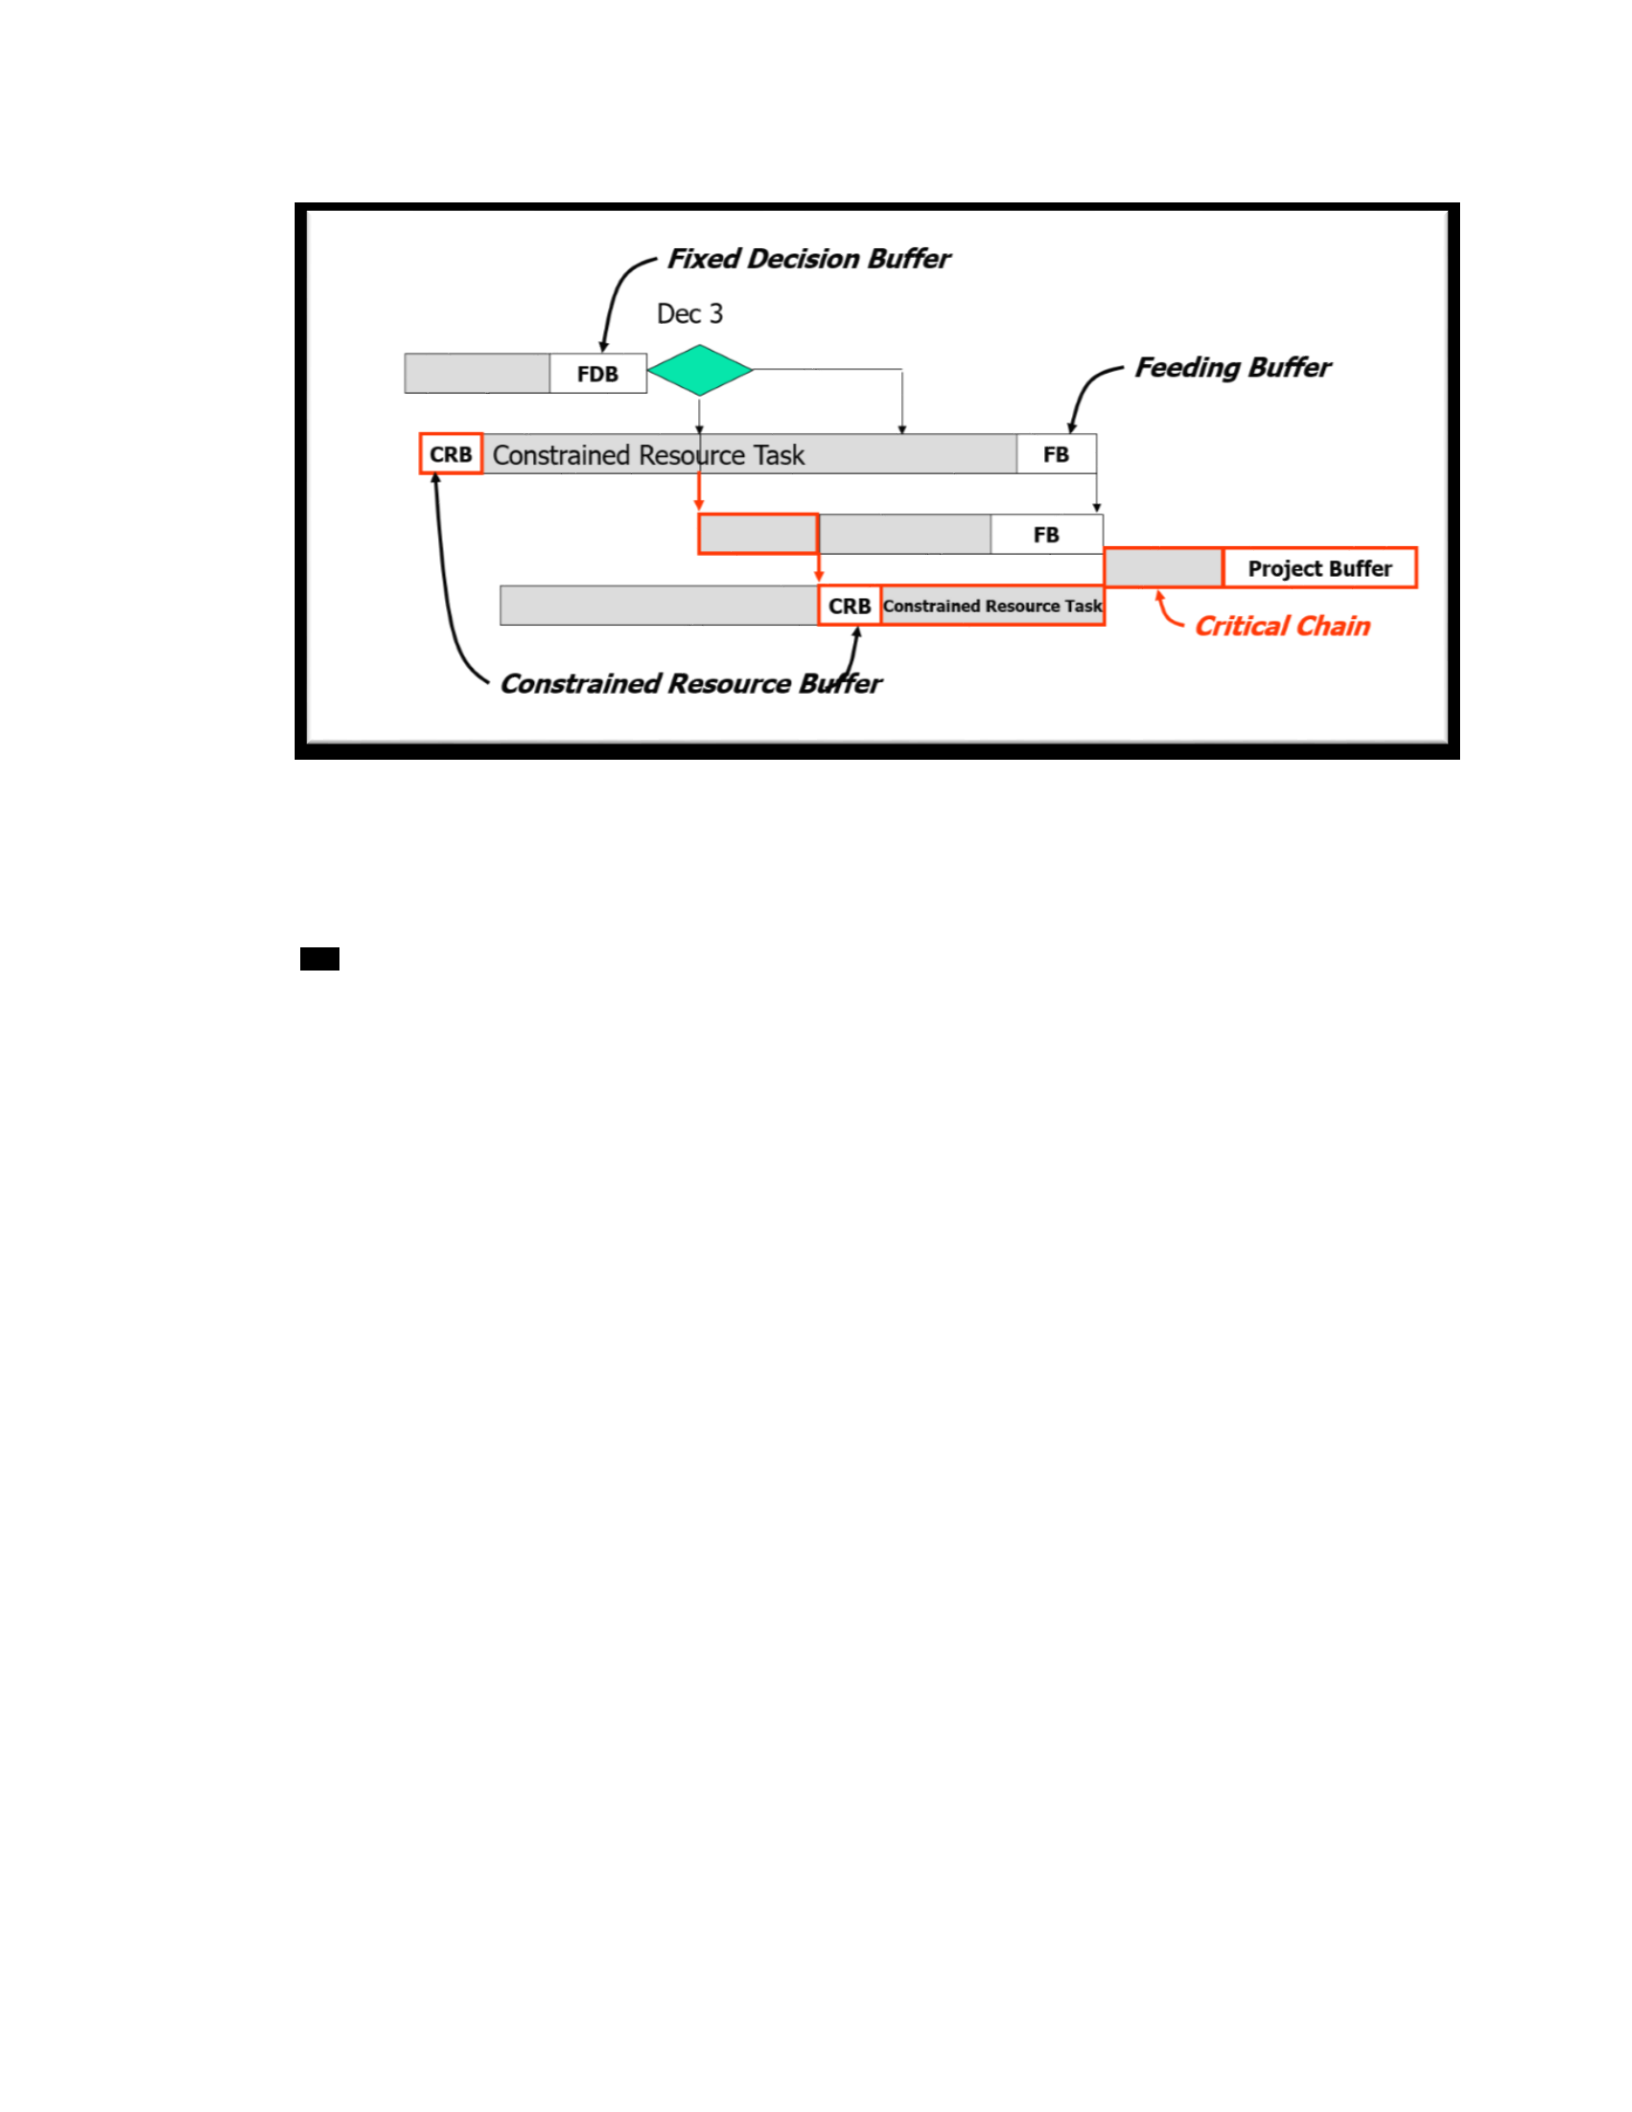
32
Figure 2.4 Buffer in a CCM Network
Work Task Packaging
There is a famous quote by Creighton Abrams, “when eating an elephant take one bite at a
time.” It seems a common sense, to break down a large intricate problem into parts small
enough to be solved easily. According to Howell, to have a better control and management,
construction project ought to be broken down into manageable-sized work packages
(Ballard and Howell 1998). Project breakdown is necessary to provide granularity to the
project for improved flow control (Patty and Denton 2010b).
Different people or institutions use different terminology for work packages. For instance,
CII classifies work packages into engineering work package (EWP), construction work
package (CWP), installation work package (IWP). This thesis is primarily concerned with
breakdown of level 3 activities to level 4 work task package (WTP) which is similar to
IWP. The term work task package has been taken from the Patty and Denton 2010.
2.9.1 Characteristics of a Work Task Package
Characteristics of a work task package is described below.

33
1. Work task packages are defined based on scope of work, skill needed to complete
them, duration, and cost.
2. The duration of a field work task package is generally a week or less or less than
400-600 man hours. It usually involves only a single team having a particular trade
to finish the work task package (Patty and Denton 2010b).
3. Each work task package consists of work processes, the target cost is determined
by cost control unit (CCU) information. Cost control units relate to processes in the
task package that can be distinctly classified according to their unit cost. For
example, in a drilled pile foundation work task package, cost control unit could be
linear feet of the actual size of drilled pile, perhaps with cost per cubic yard to
remove spoils. Earth work to prepare the field for the driven piles would be a
separate task package with cost control units for the quantity and type of grubbing
or excavation and backfill to be performed. The task following pile drilling might
be form work for any pile extension beyond ground level with CCUs in contact
square feed. This would be followed by rebar cage assembly and installation,
concreting, etc. each with CCU having distinct unit prices. The work task package
total unit completion is used for earned cost completed, and rolled up in the work
breakdown structure for recognizing earned completion at level 3, 2, 1
4
respectively
and thereby the whole project is progressed, task completion by task package
completion.
4. Work task packages are developed by an experienced manager of task leads
responsible to execute the work task package. In engineering, the engineering
packager should be the engineering discipline lead with the collaboration of the
engineering task lead. For field work task packages, the general foremen should
prepare the work task package with the consensus and collaboration of
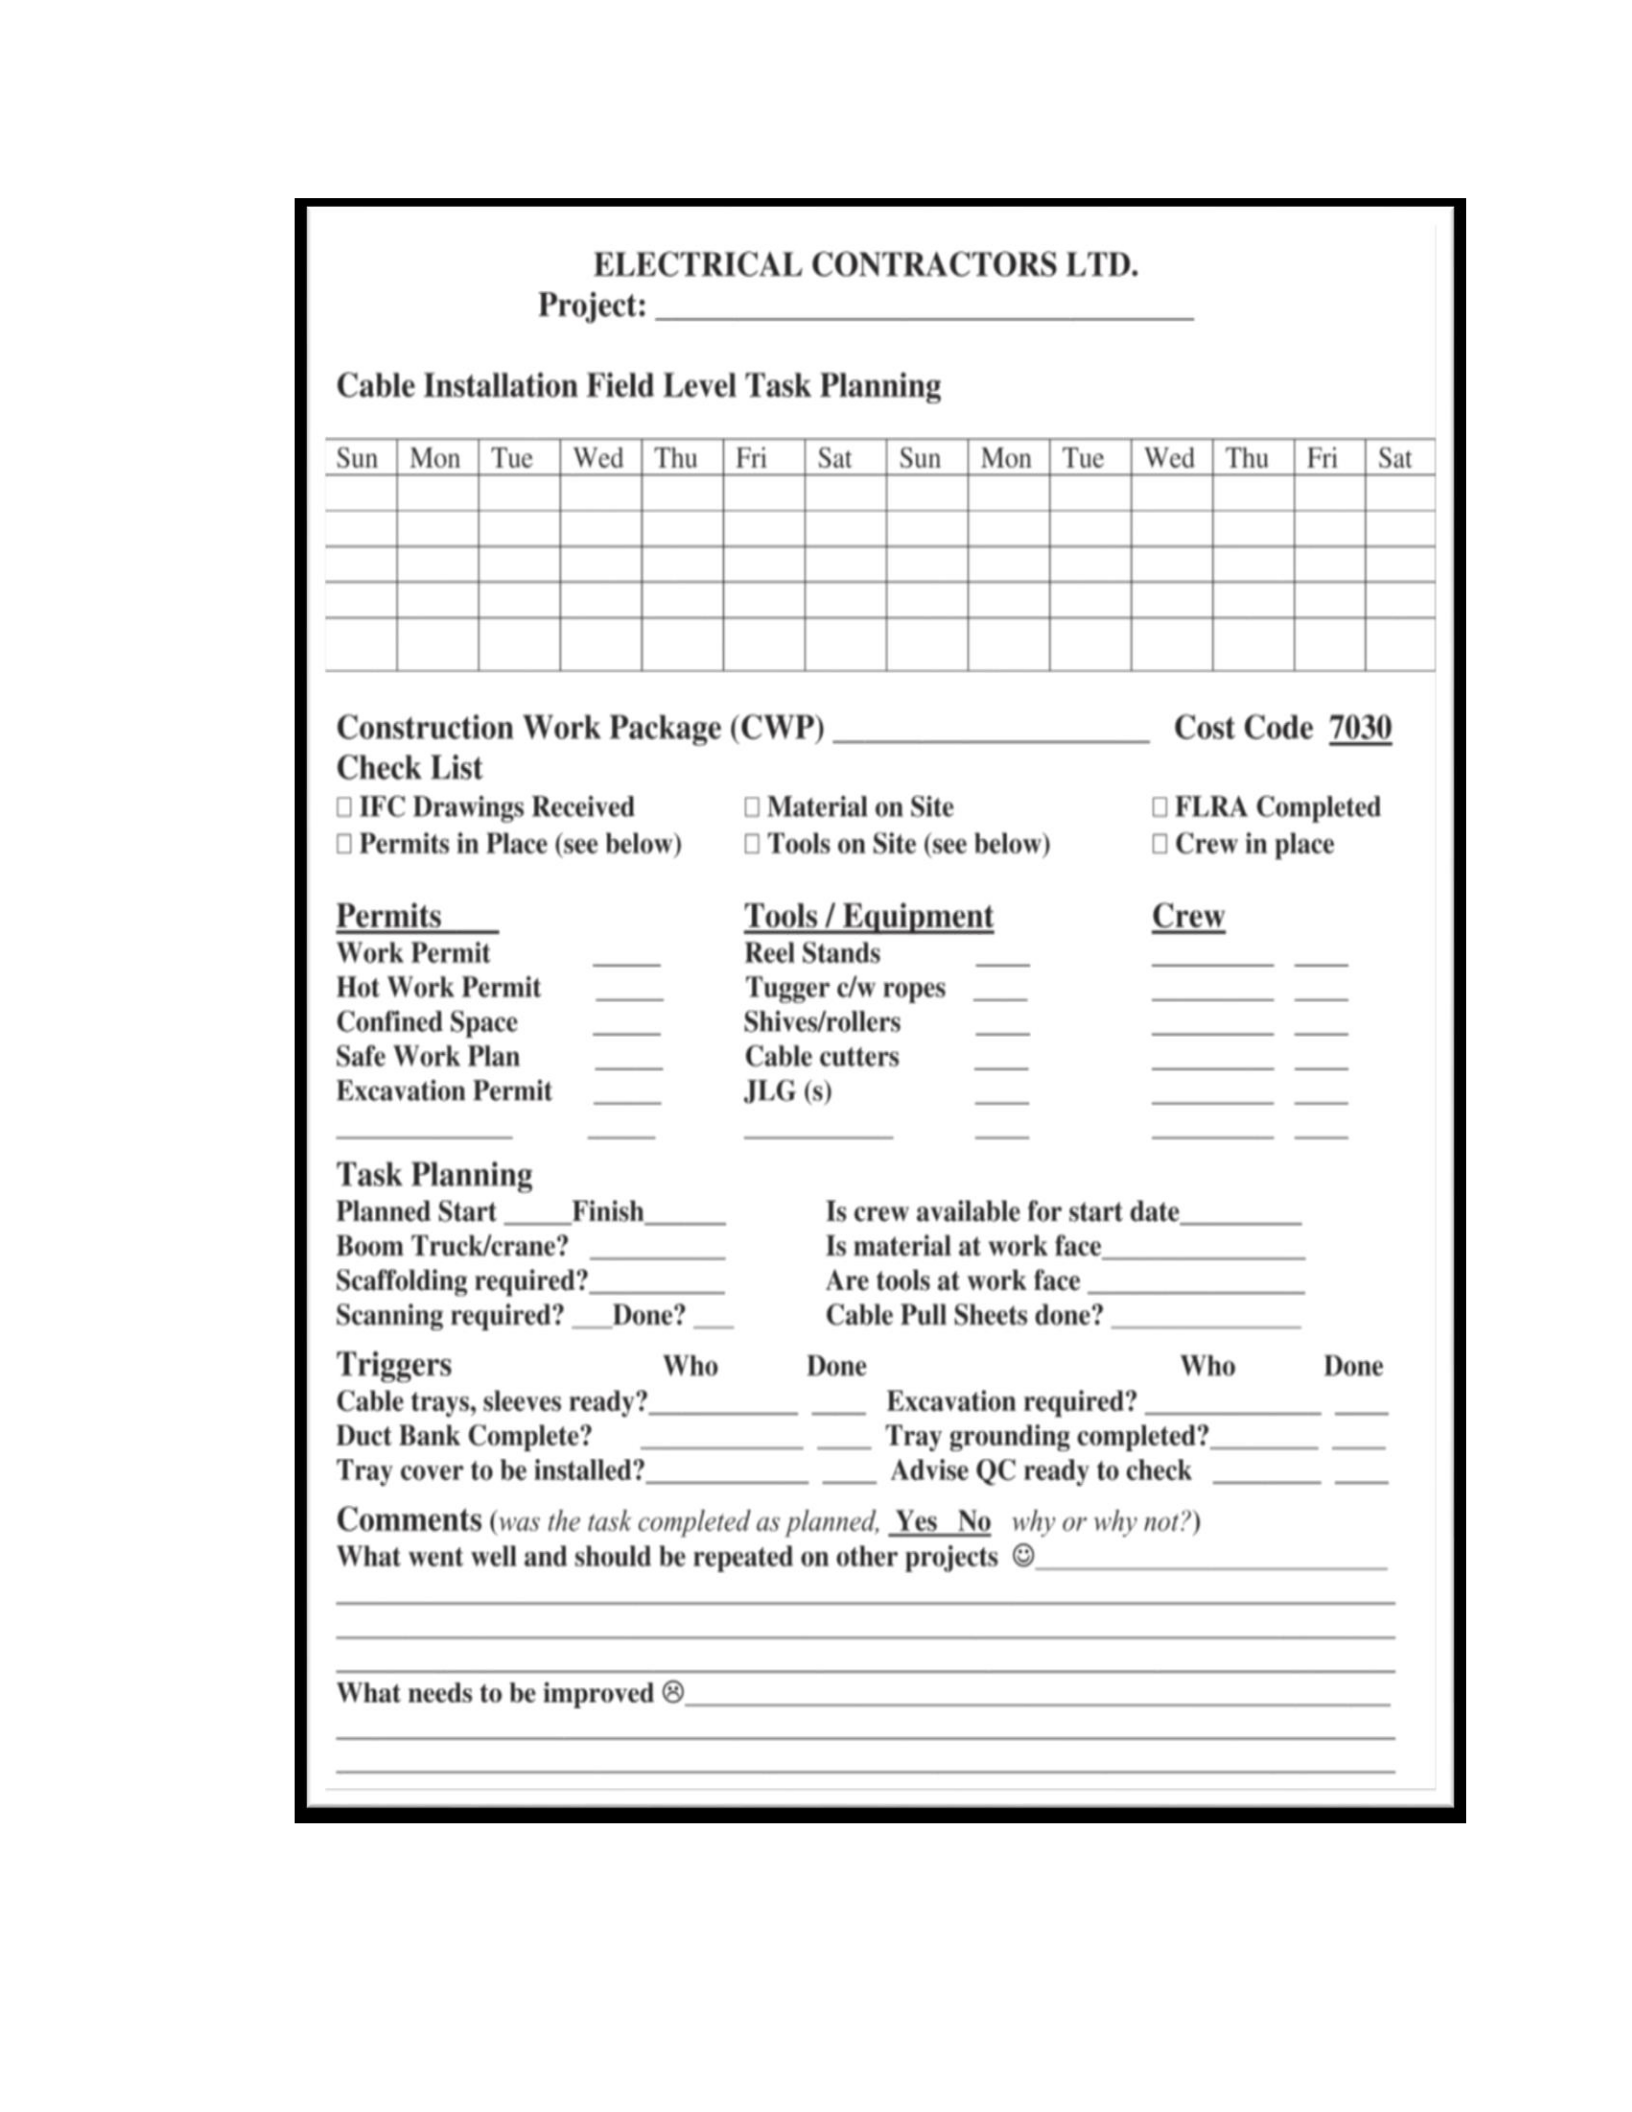
foremen/task lead. A sample template of WTP is shown in the figure 2.5.
5. Task packages are to be based on best practice standards. If standards describing
best practices for a particular work task package has not yet been developed, then
the standard to develop such packages should be derived along with the package
4
Level 1, 2, and, 3 are the levels of breakdown of the project, level is the milestone level, level 2 is the
construction work package level, level 3 is the activity level, and so on.

34
itself. This expectation enables standards to be established if they don’t already
exist (Lean Construction Enterprise 2015).
6. The manager/supervisor who develops the package, reviews it with the task lead
who will execute it for feasibility and completeness, such that once started, it can
be completed without stopping. Once the work task plan is aligned between the
supervisor/manager and the task lead, the task lead commits to finish the package
within associated time duration (and to achieve all the other criteria such as safety,
quality, productivity, employee morale and environmental protection) (Patty and
Denton 2010b).
7. Further, the task lead must commit to keeping their supervisor appraised, on takt
time intervals, how they are doing relative to their aligned commitment mentioned
above.
8. Work task packages describe the scope of the work, work constraints, information,
list of materials, quality records, equipment’s, duration, people, standard procedure,
and budget for the work (Brien and Hamdi 2016).
9. Construction work task packages are completed by the involvement of various
teams like material management, procurement, engineering, construction, etc.
There are certain requirements of work task packages which noted in the form of
constraints that must be removed by all the collaboration effort of all the
departments (Brien and Hamdi 2016).
10. All the constraints together with most root causes of variability must be eliminated
before the commencement of the work task package, such that it can be completed
without stopping within the allotted duration. Any package is not started until all
the resources (information, materials, equipment, skills etc.) which is needed to
start and finish the work package without stopping, are present at the work face.
Only those field work-task packages or engineering task packages, which are made
ready to be completed productively should be released for execution (CII; and
COAA; 2013).
11. During installation of the work task package, the task lead informs their supervisor
of status of execution performance at frequent intervals, such as every takt time
(two or 4 hours). If the task lead perceives there is trouble or a variance during the

35
execution, he/she will call their manager/supervisor who will then realign resources,
solve problems such that commitments are consistently and reliably met. Further,
as begins to happen frequently, the task is likely to be done early, the manager will
assure that the next task and crew is ready to take advantage of early completions
and move the schedule ahead (Patty and Denton 2010b).
2.9.2 Lookahead Planning
The functions of lookahead planning are accomplished through various specific processes
as described below.
• Shape work flow sequence and rate
• Match work flow and capacity
• Decompose master schedule activities into work packages and operations
• Develop detailed methods for executing work
• Maintain a backlog of ready work
• Update and revise higher level schedules as needed
ELECTRICAL
CONTRACTORS
LTD.
Project:
Cable
Installation
Field
Level
Task
Planning
Sun
Mon
Tue
Wed
Thu
Fri
Sat
Sun
Mon
Tue
Wed
Thu
Fri_|
Sat
Construction
Work
Package
(CWP)
Cost
Code
7030
Check
List
O
IFC
Drawings
Received
0
Material
on
Site
O
FLRA
Completed
0
Permits
in
Place
(see
below)
0
Tools
on
Site
(see
below)
0
Crew
in
place
Permits
Tools
/
Equipment
Crew
Work
Permit
ee
Reel
Stands
_ _
Hot
Work
Permit
ee
Tugger
c/w
ropes
____
a
Confined
Space
a
Shives/rollers
_ _
Safe
Work
Plan
ee
Cable
cutters
ee ee
Excavation
Permit
_——
JLG
(s)
— —
Task
Planning
Planned
Start
Finish
Is
crew
available for
start
date
Boom
Truck/crane?
Is
material
at
work
face
Scaffolding
required?
Are
tools
at
work
face
Scanning
required?
Done?
___
Cable
Pull
Sheets
done?
Triggers
Who
Done
Who
Done
Cable
trays,
sleeves
ready?
___
Excavation
required?
_
Duct
Bank
Complete?
____.
Tray
grounding
completed?
—
Tray
cover
to
be
installed?
___.
Advise
QC
ready
to
check
_
Comments
(was
the
task
completed
as
planned,
Yes_No
why
or
why
not?)
What
went
well
and
should
be
repeated
on
other
projects
©
What
needs
to
be
improved
®
36
Figure 2.5 Sample of Work Task Package Template (Patty and Denton 2010b)

37
Flow Control System
As discussed in the earlier sections, to maintain flow in the value chain, there must be an
established flow control system in the PCMS. Control should be to maintain the flow (i.e.,
the consistent and reliable delivery of information, material, equipment, labor, and
workface to those who need it as they need it). Literature review reveals several significant
contributors to the theory and practice of production control or flow control system in
construction. Some of the primary contributors are Patty et.al., Construction Industry
Institute (CII), Construction Owner’s Association of America (COAA), Lean Construction
Institute (LCI), etc. A few widely-recognized models developed for the implementation of
work flow systems in the industry are discussed below. An increased emphasis on flow and
systems to provide it during engineering, procurement, and, construction stages is provided.
2.10.1 Last Planner System
Last Planner System was developed by the LCI. This section is highly dependent on the
work done by Glenn Ballard. Last planner system is a pull flow system which is based on
the philosophy of Should-Can-Will-Did. “Assignment”, drives direct work through “last
planner” or the workforce responsible to execute the assignment. Typically, assignments
are the work to be done in the near future (tomorrow or within a week). In the Last Planner
System, the assignment is planned by the last planner (Ballard 2000). Unfortunately, it does
not explicitly explain how the assignment will be planned, developed, and reached to the
workface when it is needed.
2.10.1.1 Should-Can-Will-Did
“Last Planner can be understood as a mechanism for transforming what SHOULD be done
into what CAN be done, thus forming an inventory of ready work, from which Weekly
Work Plans can be formed. Weekly Work Plans is a commitment by the Last Planners
(foremen, squad bosses) to what they actually WILL do.”(Ballard 2000). Last Planner
system matches load with the capacity in the flow system which is like matching “can” to
“will” (Ballard 2000).
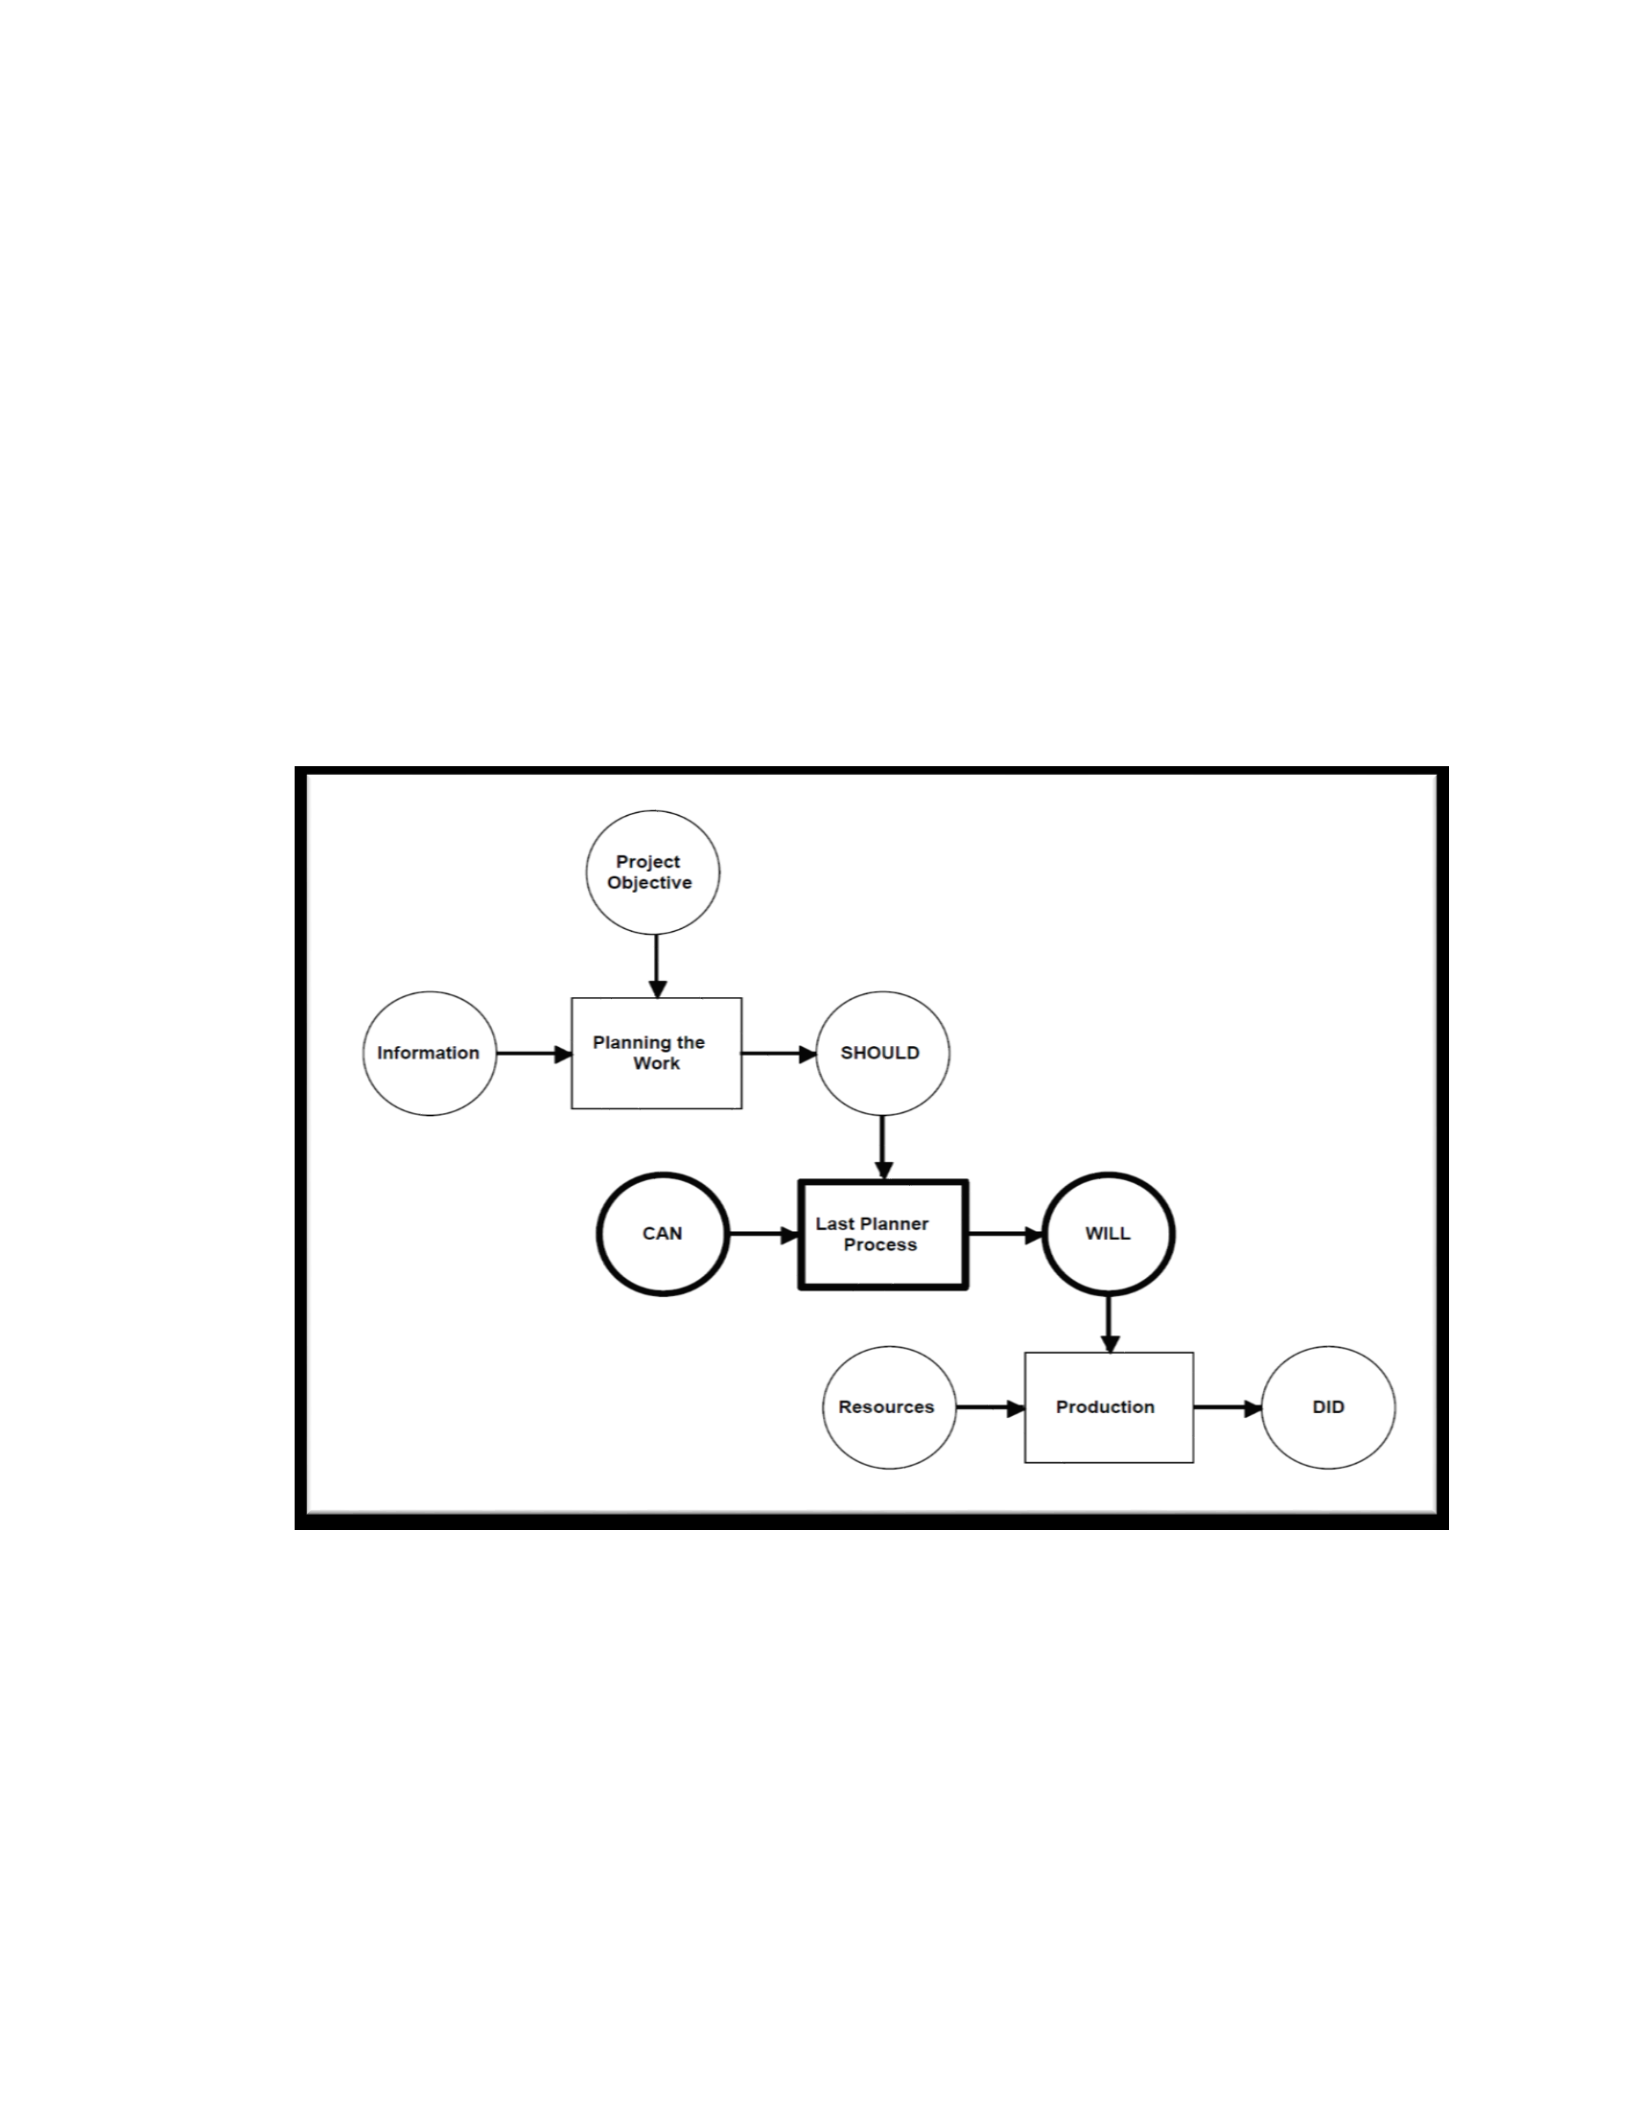
38
The work selected is "Practical" means that all prerequisite work is in place and all
resources are available; Last Planner does not focus on increasing the capacity or matching
the capacity with the load. In other words, it states that only those packages are developed
for which resources are available. It is understandable and absolutely beneficial to make
packages only of the available resources, however, it would be much better to have a
system which makes available all the resources or capacity according to the need or load
of the system and thus make what should be done into what can be done. LPS talks about
transforming Should into Can, however, unfortunately, Last Planner System explicitly does
not explain how to close the gap between “should” and “can”.
Figure 2.6 Last Planner System (Ballard 2000)
2.10.1.2 Removal of Constraints
Typical constraints that need to be removed are information constraints like design,
drawings, permit, contract, procedure, standards, etc. material constraints, tools and
equipment constraints, and workface constraints. Last Planner states all the constraints

39
needs to be removed by constraint analysis before a task package reaches the site, but does
not comprehensively explain the process of constraint analysis to identify and remove
constraints.
2.10.1.3 Control in Last Planner System
In the Last Planner System, control must be proactive and not reactive. In other words,
there is a need of system control which does not act after things get off the track but
prevents the work flow from getting off the track (Lean Construction Enterprise 2015).
Last planner has achieved it at some level by bridging the gap between “can” and “will”,
however, if we see the work flow control of last planner system, it deals on weekly basis
with the concept of percent plan complete (PPC).
To control the work flow, a concept of “percent plan complete” (PPC) is introduced. PPC
is expressed in percentage of planned activities completed of the total number of activities
planned per week. Percent Plan Complete measures the extent to which the front-line
supervisor's commitment (WILL) was realized. Then root cause analysis with the
involvement of last planners is done to find out why the work or assignment could not be
done (Ballard 2000). Nonetheless, unfortunately it does not provide real time monitoring
and control. PPC measures in control enhances the control however, it does not provide
real time or proactive control as suggested by Last Planner System.
Also, last planner system does not explicitly talk about improving the whole system which
precludes any deviation. In other words, reducing the gap between “Should” and “Can”; it
engenders a need for a system which reduces the gap between “should” and “can”. Also, it
does not talk about how to achieve “should” i.e. the desired state of flow and control. To
have a well-integrated “should”, “can”, and “will”, there is a need of desired state of the
project control and management system.
In Last Planner System, packages are formed from the available resources. The resources
are not controlled beforehand so that all the resources could be made available to develop
the desired packages. Also, there is emphasis on work backlog rather than making a system

40
which reduces the need of backlog. Percent plan complete measures the percentage of work
completed per week. It does not provide a control system like in production control which
aims to prevent task package to get off track. This can be done if there is proactive real
time control.
Presently in last planner system, pulling of resources is done from the available resources
on the site. Instead of pulling through the entire value chain, pulling is done only at the last
process. Effort needs to be made to incorporate pulling mechanism in the previous
processes too. There must be a system which makes sure all the resources for what is
needed are available when they are needed to sustain flow. Overall, in spite of these
deficiencies, the last planner system does improve work flow by engaging the parties to
better gather up what has been delivered by the value chain to make the foremen productive.
Unfortunately, there are gaps which needs to be filled to make the flow system robust.
2.10.2 Advanced Work Packaging (AWP)
Advanced work packaging (AWP) is a work flow system developed jointly by CII and
COAA in 2013. “Advanced work packaging is the overall process flow of all the detailed
work packages. It is a planned, executable process that encompasses the work on an
engineering, procurement, and construction (EPC) project, beginning with initial planning
and continuing through detailed design and construction execution. Advanced work
packaging provides the framework for productive and progressive construction, and
presumes the existence of a construction execution plan.” (CII; and COAA; 2013).
Advanced work packaging is a construction-driven process that adopts the philosophy of
“beginning with the end in mind.” (CII; and COAA; 2013). AWP is about getting the right
things to the right people at the right time to save money and improve productivity. AWP
is a tool for managing variances, building flexibility, and accommodating change.
Packages are not released until all constraints have been removed (CII; and COAA; 2013).
2.10.2.1 Workface Planning
“Workface planning is the process of organizing and delivering all the elements necessary
for an installation work package, before the work is started.” (CII; and COAA; 2013). It is

41
a proactive process that enables craft workers to perform their work safely, effectively, and
efficiently. This is accomplished by breaking down construction work (by trade) into
discrete installation work packages (IWP) that completely describe/cover the scope of work
for a given project (CII; and COAA; 2013).
2.10.2.2 Benefits of AWP
Benefits of AWP as mentioned by CII are as follows:
• “Improve safety planning and awareness
• Improve up-front planning
• Improve overall project predictability
• Improve housekeeping
• Reduce cost
• Better alignment, from engineering into construction
• Improve foreman performance
• Better than normal craft retention due to improved morale
• Improve quality of reporting from effective progress tracking
• Improved customer/stakeholder satisfaction” (CII; and COAA; 2013).
2.10.2.3 Types of Work Packages in AWP
There are mainly three types of work packages in AWP as described below.
2.10.2.3.1 Engineering Work Package (EWP) (CII; and COAA; 2013)
EWP is an engineering and procurement deliverable that is used to create construction work
packages (CWPs). The EWP is aligned with the construction sequence and priorities. A
typical EWP for a CWP includes the following:
• Scope of work with document list
• Drawings (e.g., general arrangement and equipment installation)
• Installation and materials specifications

42
• Vendor data (e.g., equipment O&M manuals)
• Bill of materials
• Lists (e.g., line lists and equipment lists)
• Additional pertinent information to support (e.g., permitting studies) (CII; and
COAA; 2013)
2.10.2.3.2 2. Construction Work Package (CWP) (CII; and COAA; 2013)
CWP defines a logical and manageable division of work within the construction scope.
CWPs are generally level 3 activities i.e. per discipline on the breakdown structure which
is aligned with the project execution plan. CWPs are to be measurable and in alignment
with project controls. CWPs are the basis for the development of detailed installation work
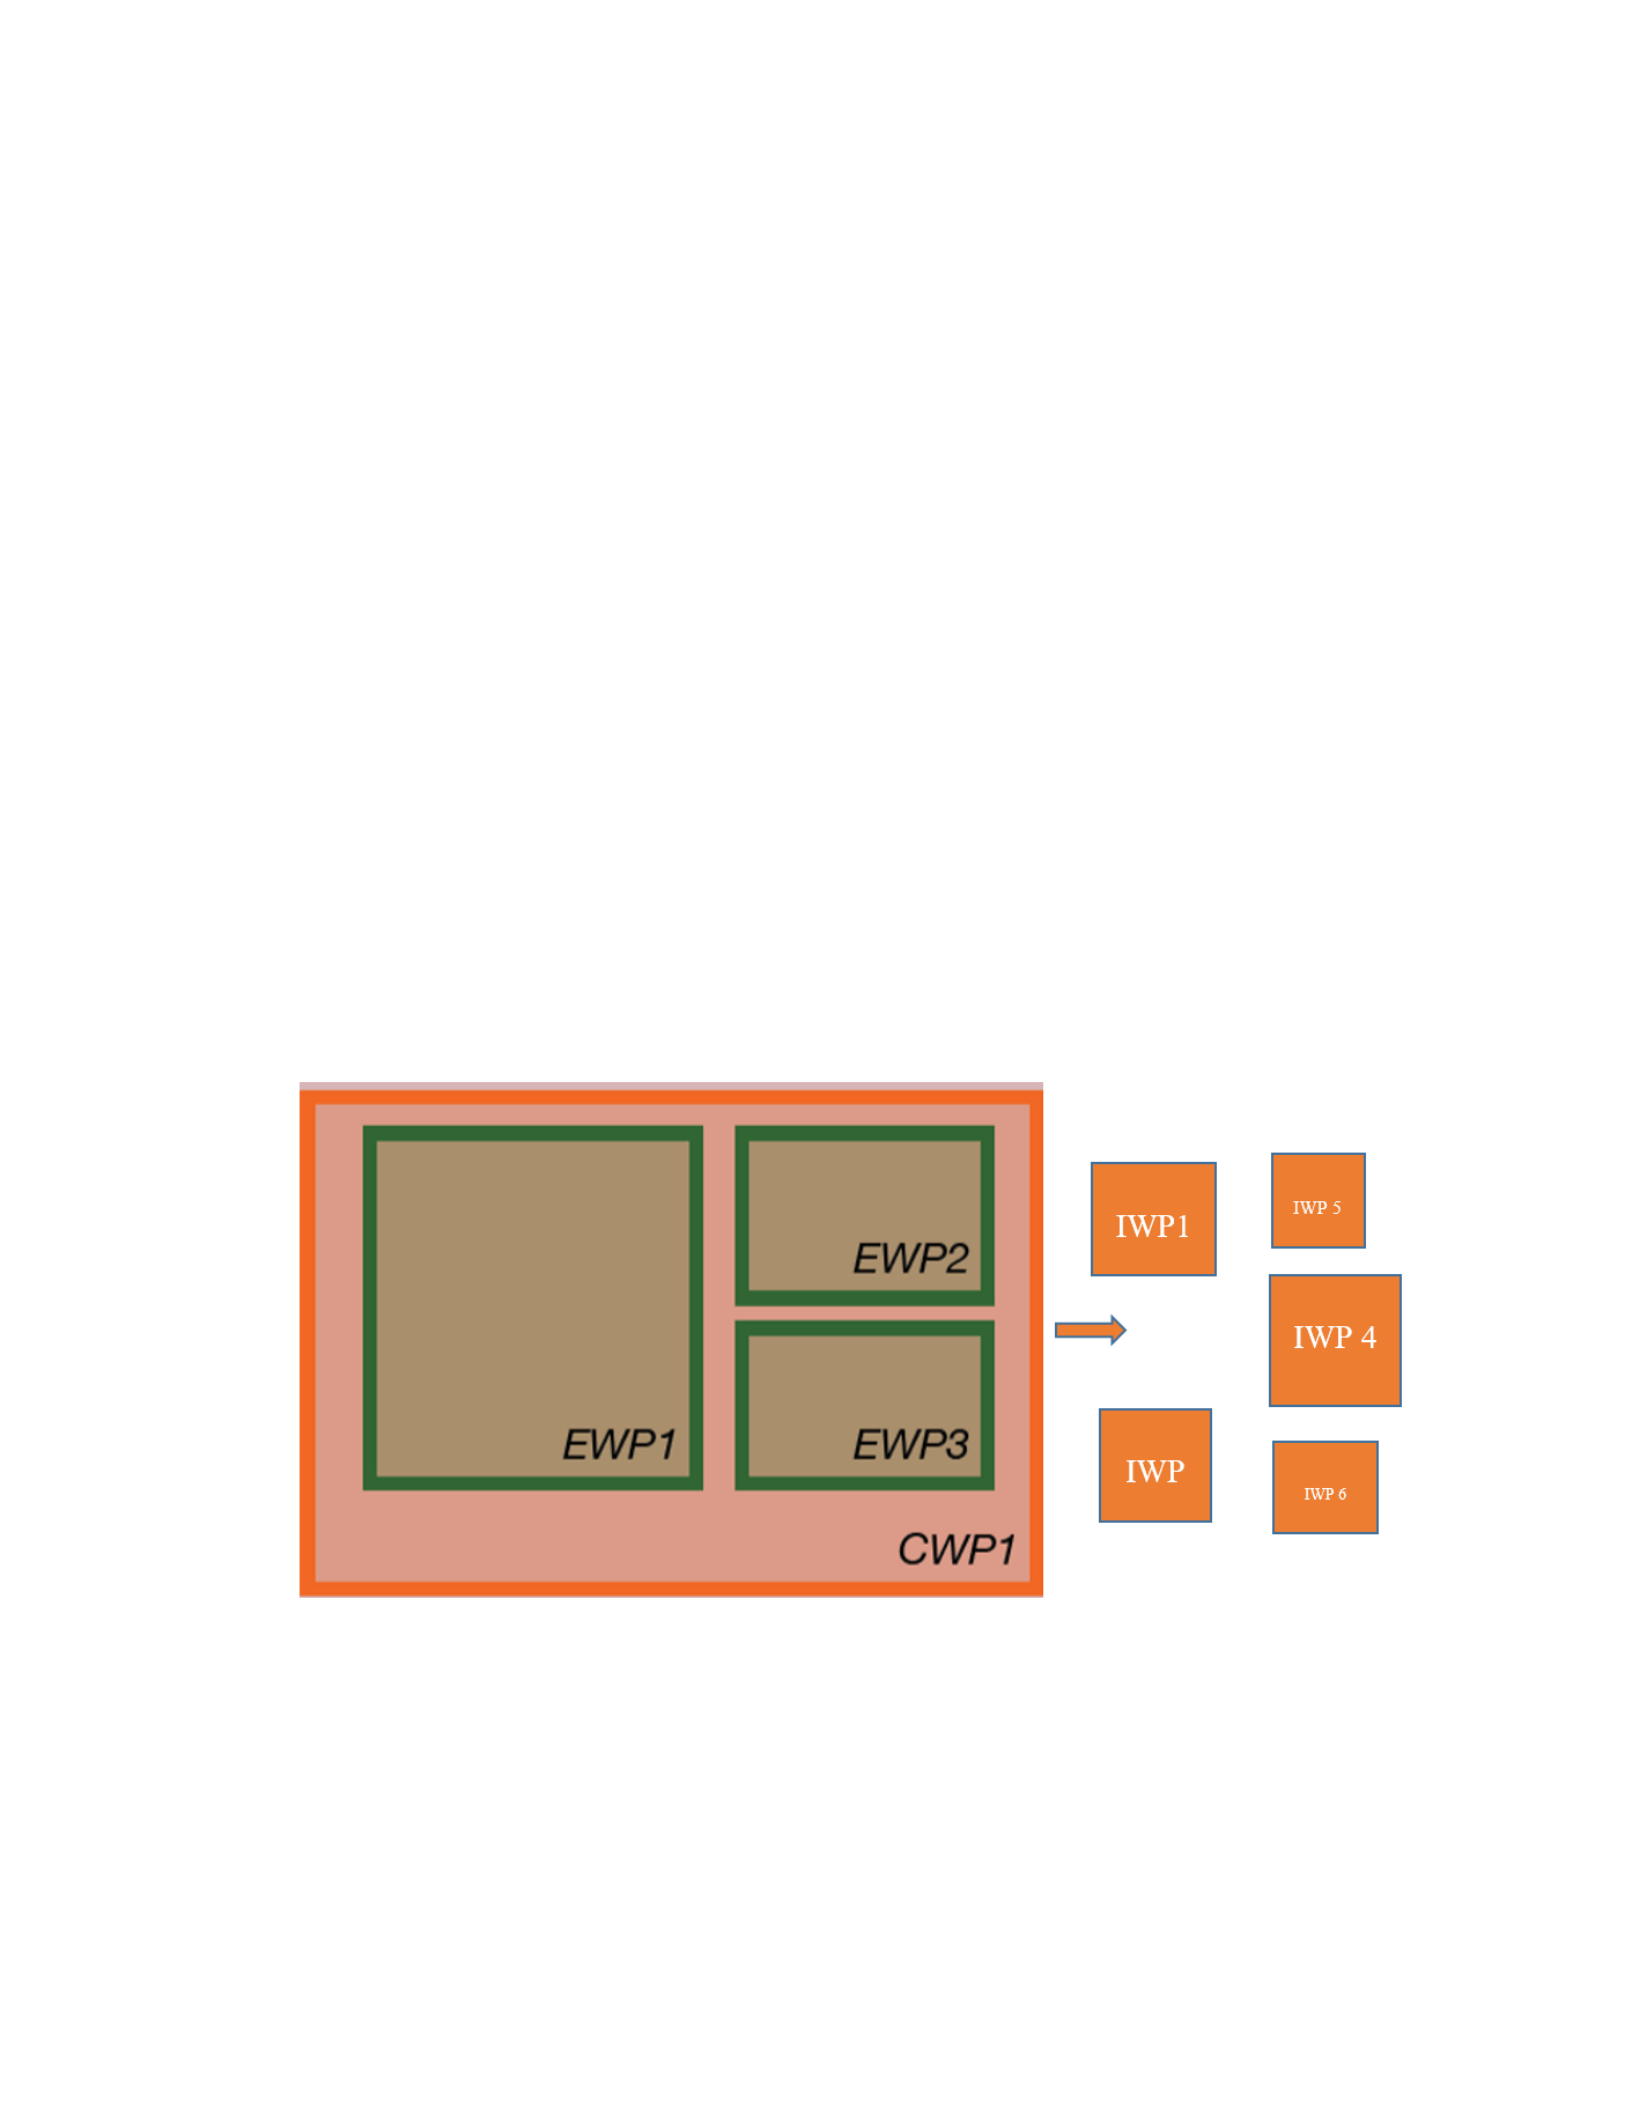
packages. CWP contain more than one EWP. A CWP is typically aligned with a bid
package. A typical CWP includes the following:
• Safety requirements
• At least one EWP
• Schedule
• Budget (work hours/cost/productivity)
• Environmental requirements
• Quality requirements
• Special resource requirements
CWPs are developed over time, from contract through construction execution. Complete
specifications of CWPs grow over time to include productivity factors, detailed cost reports,
and other considerations (CII; and COAA; 2013).

43
Figure 2.7 General Plot Plan of a capital project (CII; and COAA; 2013)
2.10.2.3.3 3. Installation Work Package (IWP) (CII; and COAA; 2013)
An installation work package (IWP) is the deliverable that enables a construction work
crew to perform work in a safe, predictable, measurable, and efficient manner. The duration
of an IWP is about a week. IWP should be approved by the responsible stakeholders, and
any constraints should be mitigated before issuance to the field. The work task packages
described above are similar to IWPs defined here. A typical IWP includes the following:
• “Work package summary—inclusive of description of work, location, system or
facility code, originator, contact information, sequenced work steps, reference
documents, estimate of work hours and quantities, cost codes, witness or hold
points, and special comments
• Quantity work sheet
• Safety hazard analysis, specific to tasks in work package
• Material Safety Data Sheet
• Drawings (engineering and vendor design)
• Specifications (engineering and vendor design)
44
• Change documents (i.e., field change request, deficiency report/non-conformance
report, and design change notice)
• Manufacturer’s installation instructions
• Model shots
• Bills of Materials
• Required tools
• Installation test results forms
• As-built documentation
• Inspection checklists
• Completion verification signatures” (CII; and COAA; 2013)
All elements necessary to complete the scope of the IWP should be organized and delivered
before work is started. Generally, the scope of work associated with the IWP should be
small enough that it could be done by one crew within a week
Figure 2.8 IWP’s Coming out from CWP
45
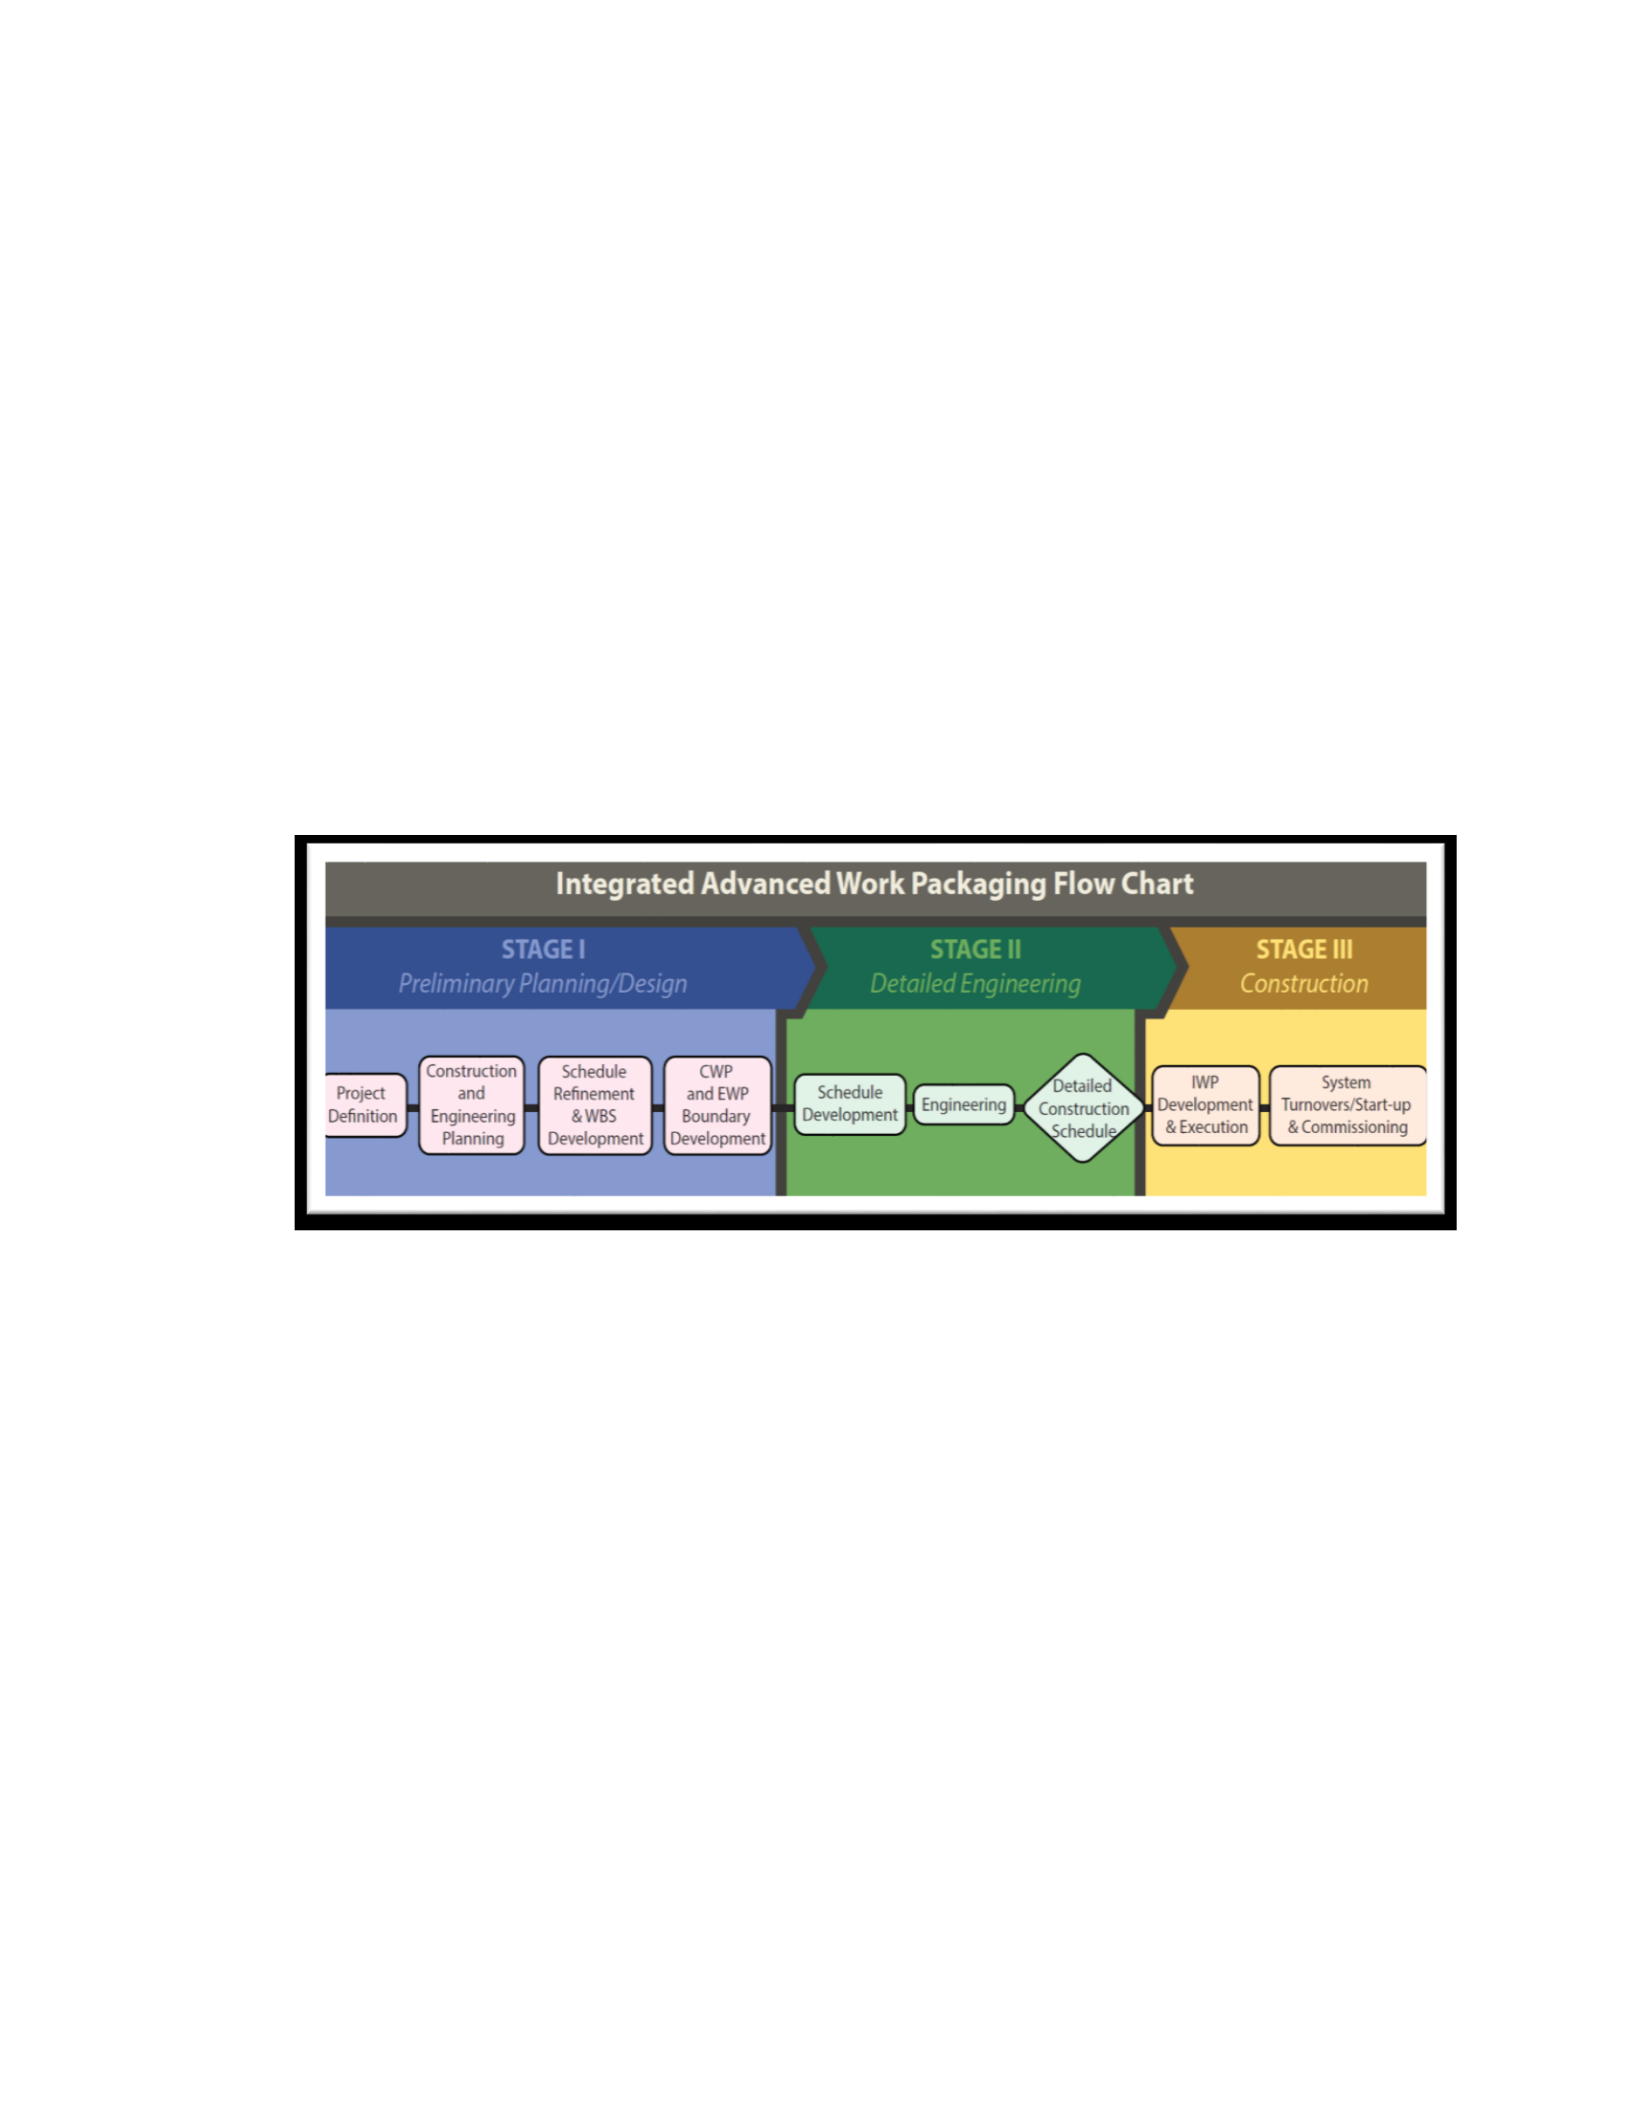
2.10.2.4 Overview of the Integrated Life Cycle Flow Charts of AWP
The life cycle of Advanced Work Packaging (AWP) starts with the beginning of the project
that is from project definition stage or front end loading 1 stage and ends with start-up and
commissioning. With each step comes a set of project deliverables/key activities associated
with effective work packaging. AWP postulates starting of work packaging from early in
the project development. The thesis is mainly concerned with the control aspect of
advanced work packaging and therefore will not go in detail explanation of the life cycle
of the AWP. AWP describes in detail the life cycle of the project from the very beginning,
however, unfortunately has not mentioned about the control aspect of it in stage 1 and stage
2 i.e. “Preliminary Planning/Design and Detailed Engineering.
Figure 2.9 Integrated AWP Flow Chart (CII; and COAA; 2013)
2.10.2.4.1 Overview of the stage 3 – Construction
Stage 3 i.e. construction stage starts with the development of IWPs. Figure 2.10 describes
the life cycle of the construction of IWPs. The life cycle of IWP consist of the following
essential processes. 1. Creation, 2. Document control, 3. Issuance to the field, 4. Control in
the field, 5. Closeout.
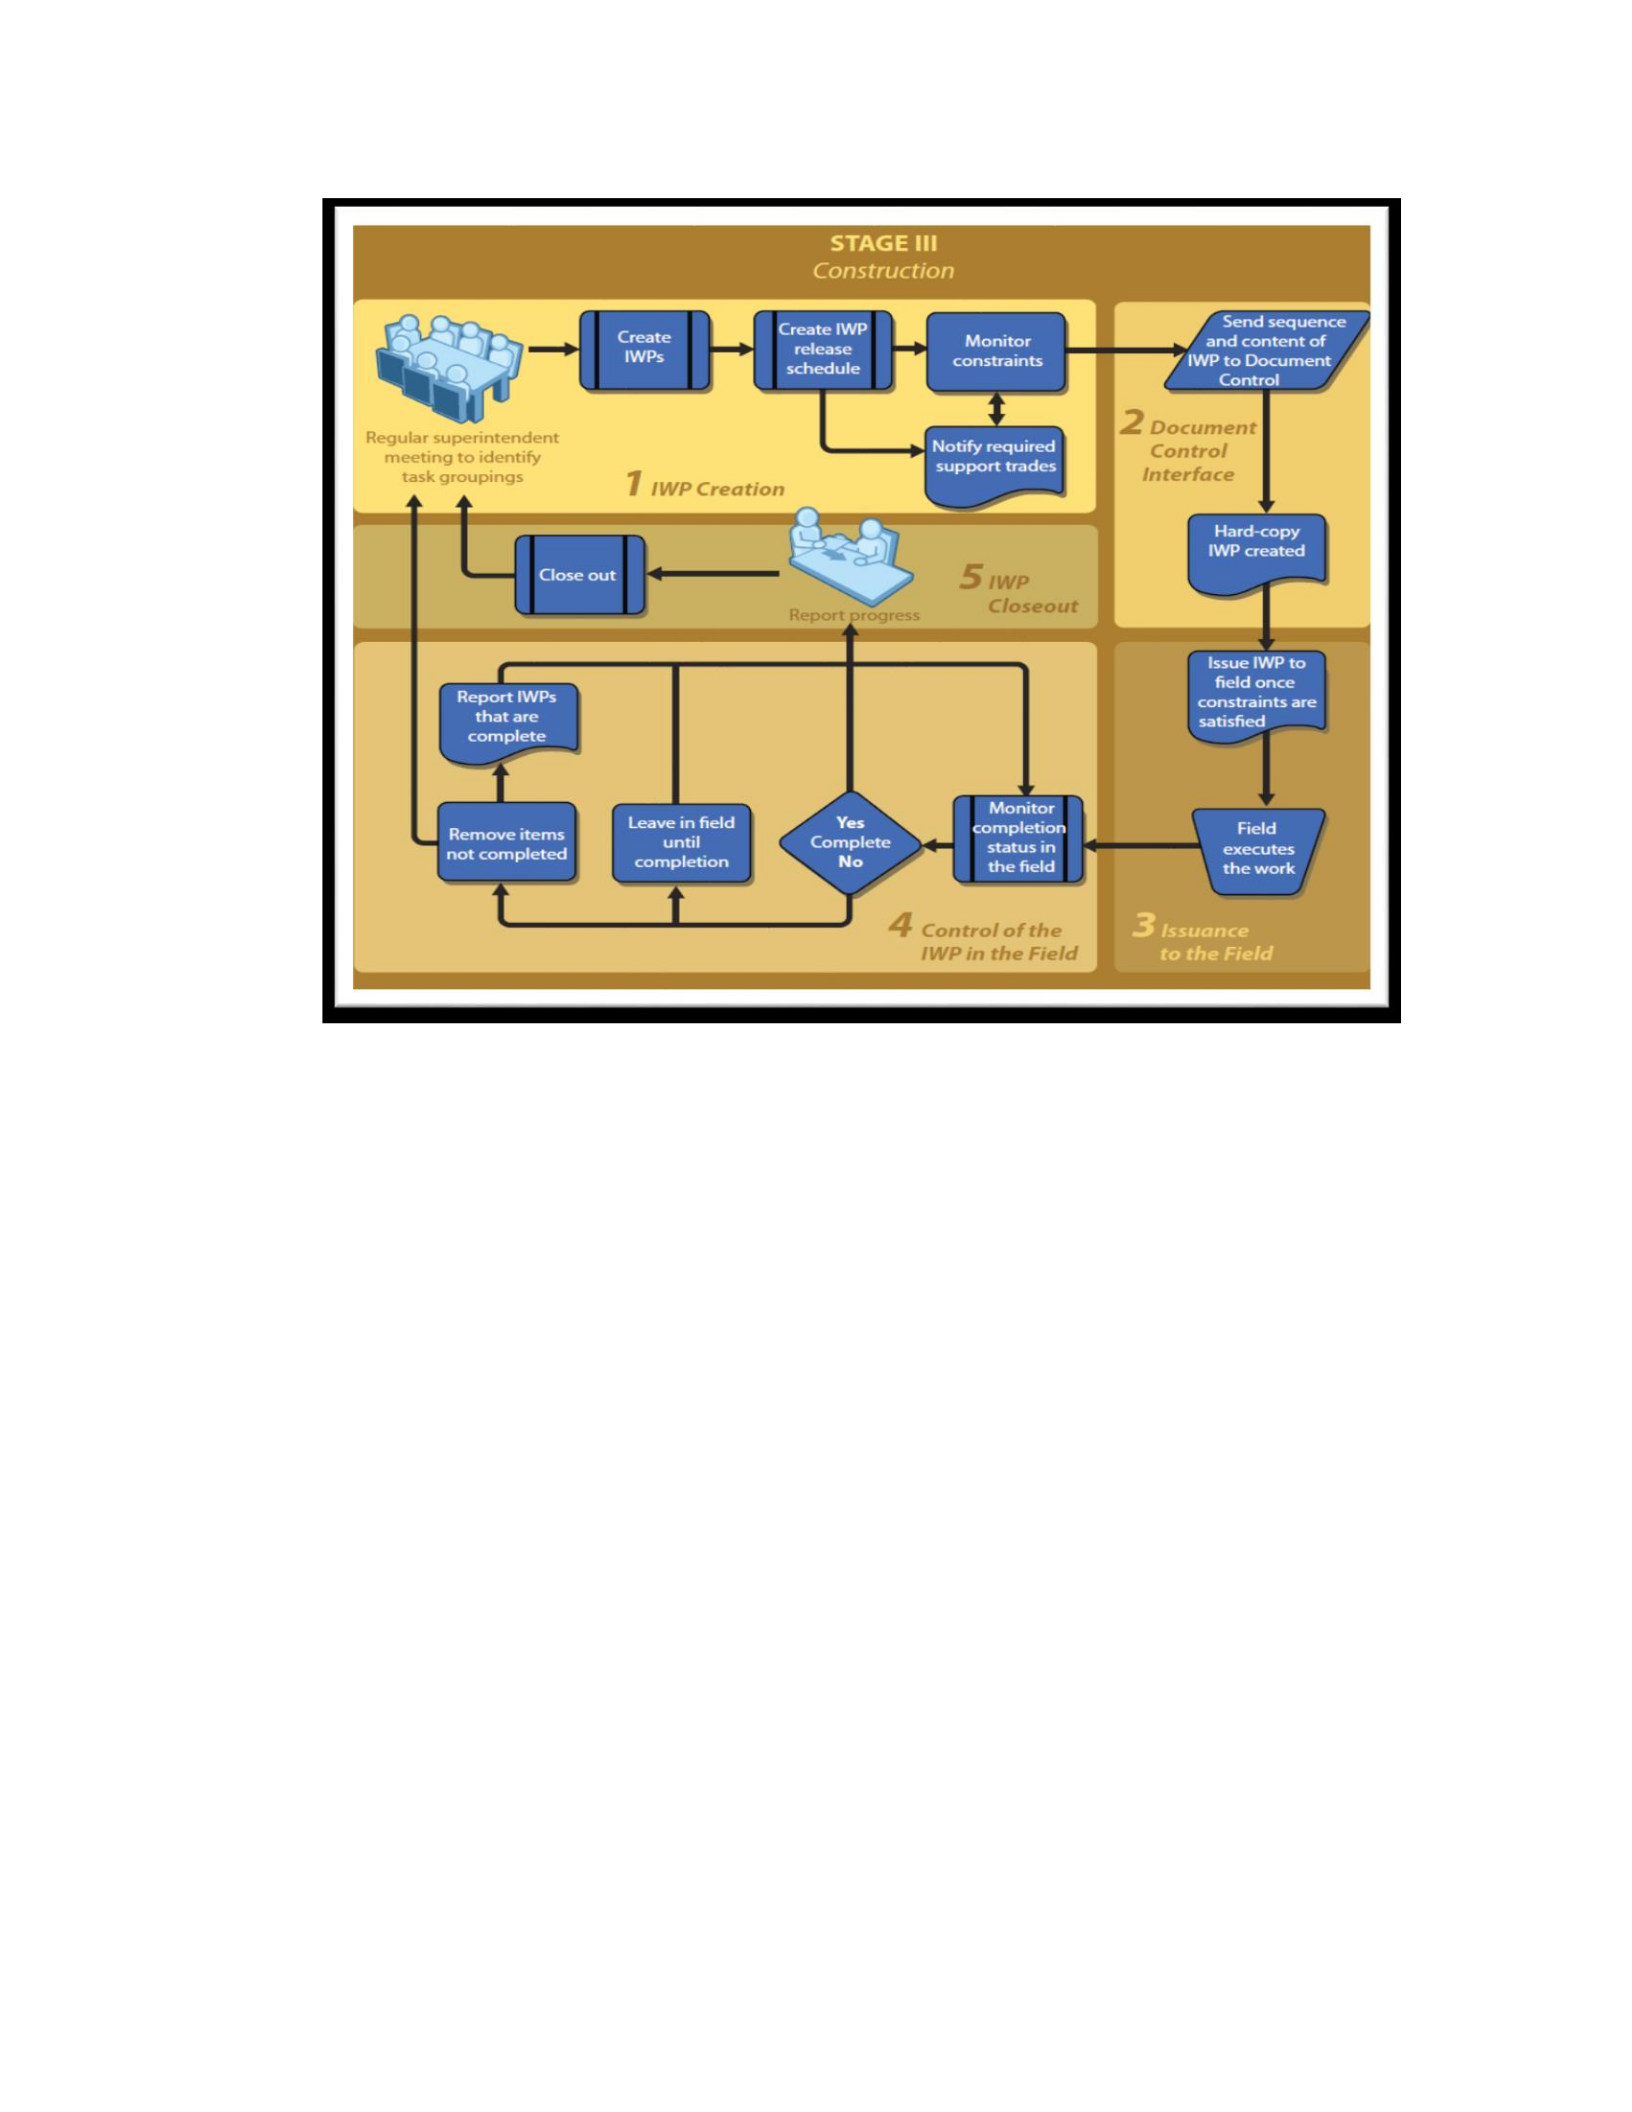
46
Figure 2.10 Stage 3 – Construction: Overview if IPW Life Cycle Flow Charts (CII; and
COAA; 2013)
The necessity of Workface Planner involvement for the development of the IWP is not
adequately justified. The Workface planner is of the similar skill as General foremen, and
therefore, if the system provided the necessary resources in alignment with needs, the
Workface Planner could be replaced by the General foreman to develop the IWPs. Also,
General foreman with its team is responsible for the execution of the IWP, so involvement
of the General Foremen to develop the IWP would give him/her ownership of the work. It
would also motivate general foreman and its team to make and keep commitment of the
work. Involvement of general foreman in the development of IWP would enhance the
knowledge and skills of general foreman and also makes the standardization robust. Further,
unfortunately, AWP does not talk about the use of best practice standards which is very
important for the success of the work packaging. AWP also does not comprehensively state
the involvement of stakeholders like Superintendent, procurement, material management,
safety, quality, etc. that could be involved effectively to verify and consummate the
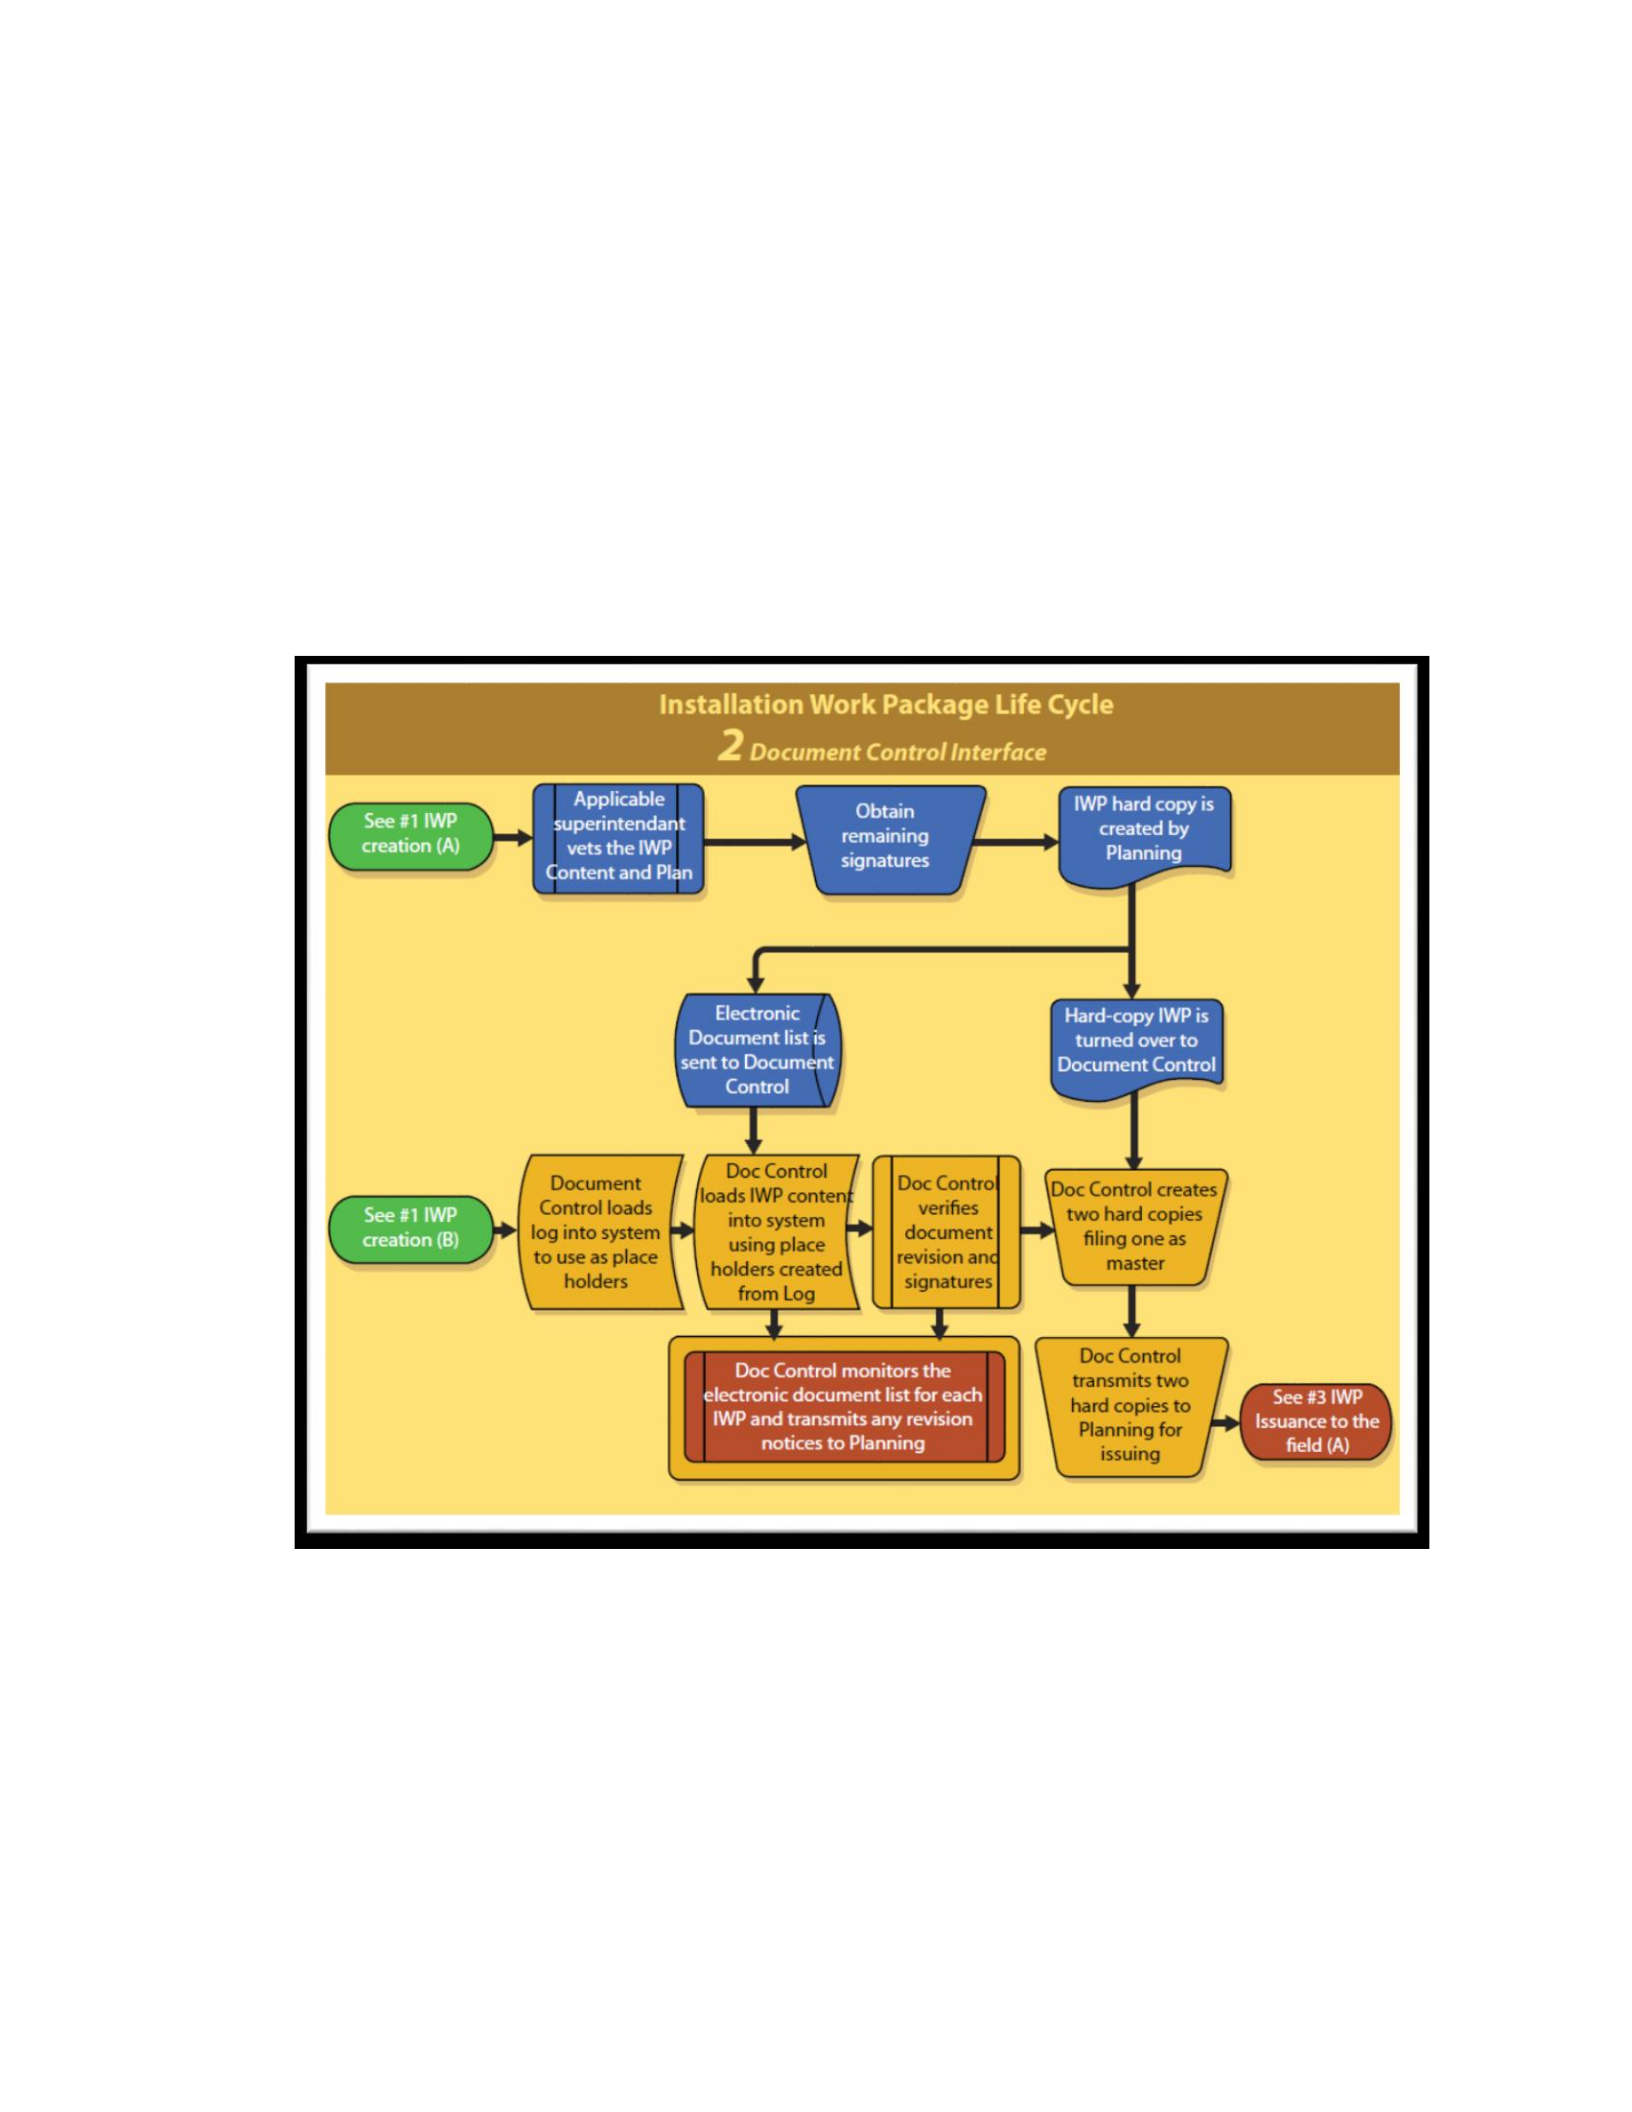
47
development of IWP. Also, it does not talk about the need of a system which integrates all
the stakeholders by providing real time monitoring/information about the progress of the
IWP development.
As we can see in the Figure 2.11 below, there is document control interface. With the help
of standards, commitment and transparency among stakeholders, information, including
control, could be reduced to make the IWP life cycle simple and efficient.
Figure 2.11 IWP Life Cycle Document Control (CII; and COAA; 2013)
Figure 2.12, describes the control of IWP in the field. According to the CII, the control of
IWP should be managed by the responsible superintendent. Also, it suggests involving
Superintendent to check IWPs which may overwhelm the Superintendent (e.g. one who
manages 6 general foremen, each of whom manages 6 foremen). The whole process of the

48
stage 3 needs to be monitored on a daily basis, and progress reporting is done at closure
(CII; and COAA; 2013). Nonetheless, unfortunately it does not explain how the monitoring
and control will be carried out. To have effective control, monitoring ought to be done on
a real-time basis. The control ought to be done at each level of the organization that is from
project manager to the Foreman level. Following are the constraints on IWP needs to be
monitored:
• Craft availability
• Materials
• Scaffolding
• IFC drawings
• Workface constraint
• Safety and permitting
• Quality control
• Schedule
• Equipment’s
• Work Access and Laydown
• Change Order
“For AWP to be more effective, it is crucial that packages are not released until all
constraints have been removed.” (CII; and COAA; 2013). AWP also recommends to
continuously monitor the constraints, however, unfortunately has not explicitly explained
how to do it.
AWP does not explain the monitoring of the installation progress of IWPs in the field.
Further it suggests reporting the progress daily. Since, IWP duration is small around a week,
it would be more effective to have real time monitoring and control. For instance, what if
any IWP installation finishes or stops or faces problems in the middle of the day, then per
daily reporting basis, the crew may be sitting around for the rest of the day and do nothing
until reporting. It suggests the need for a requirement to enable anticipating time variance,
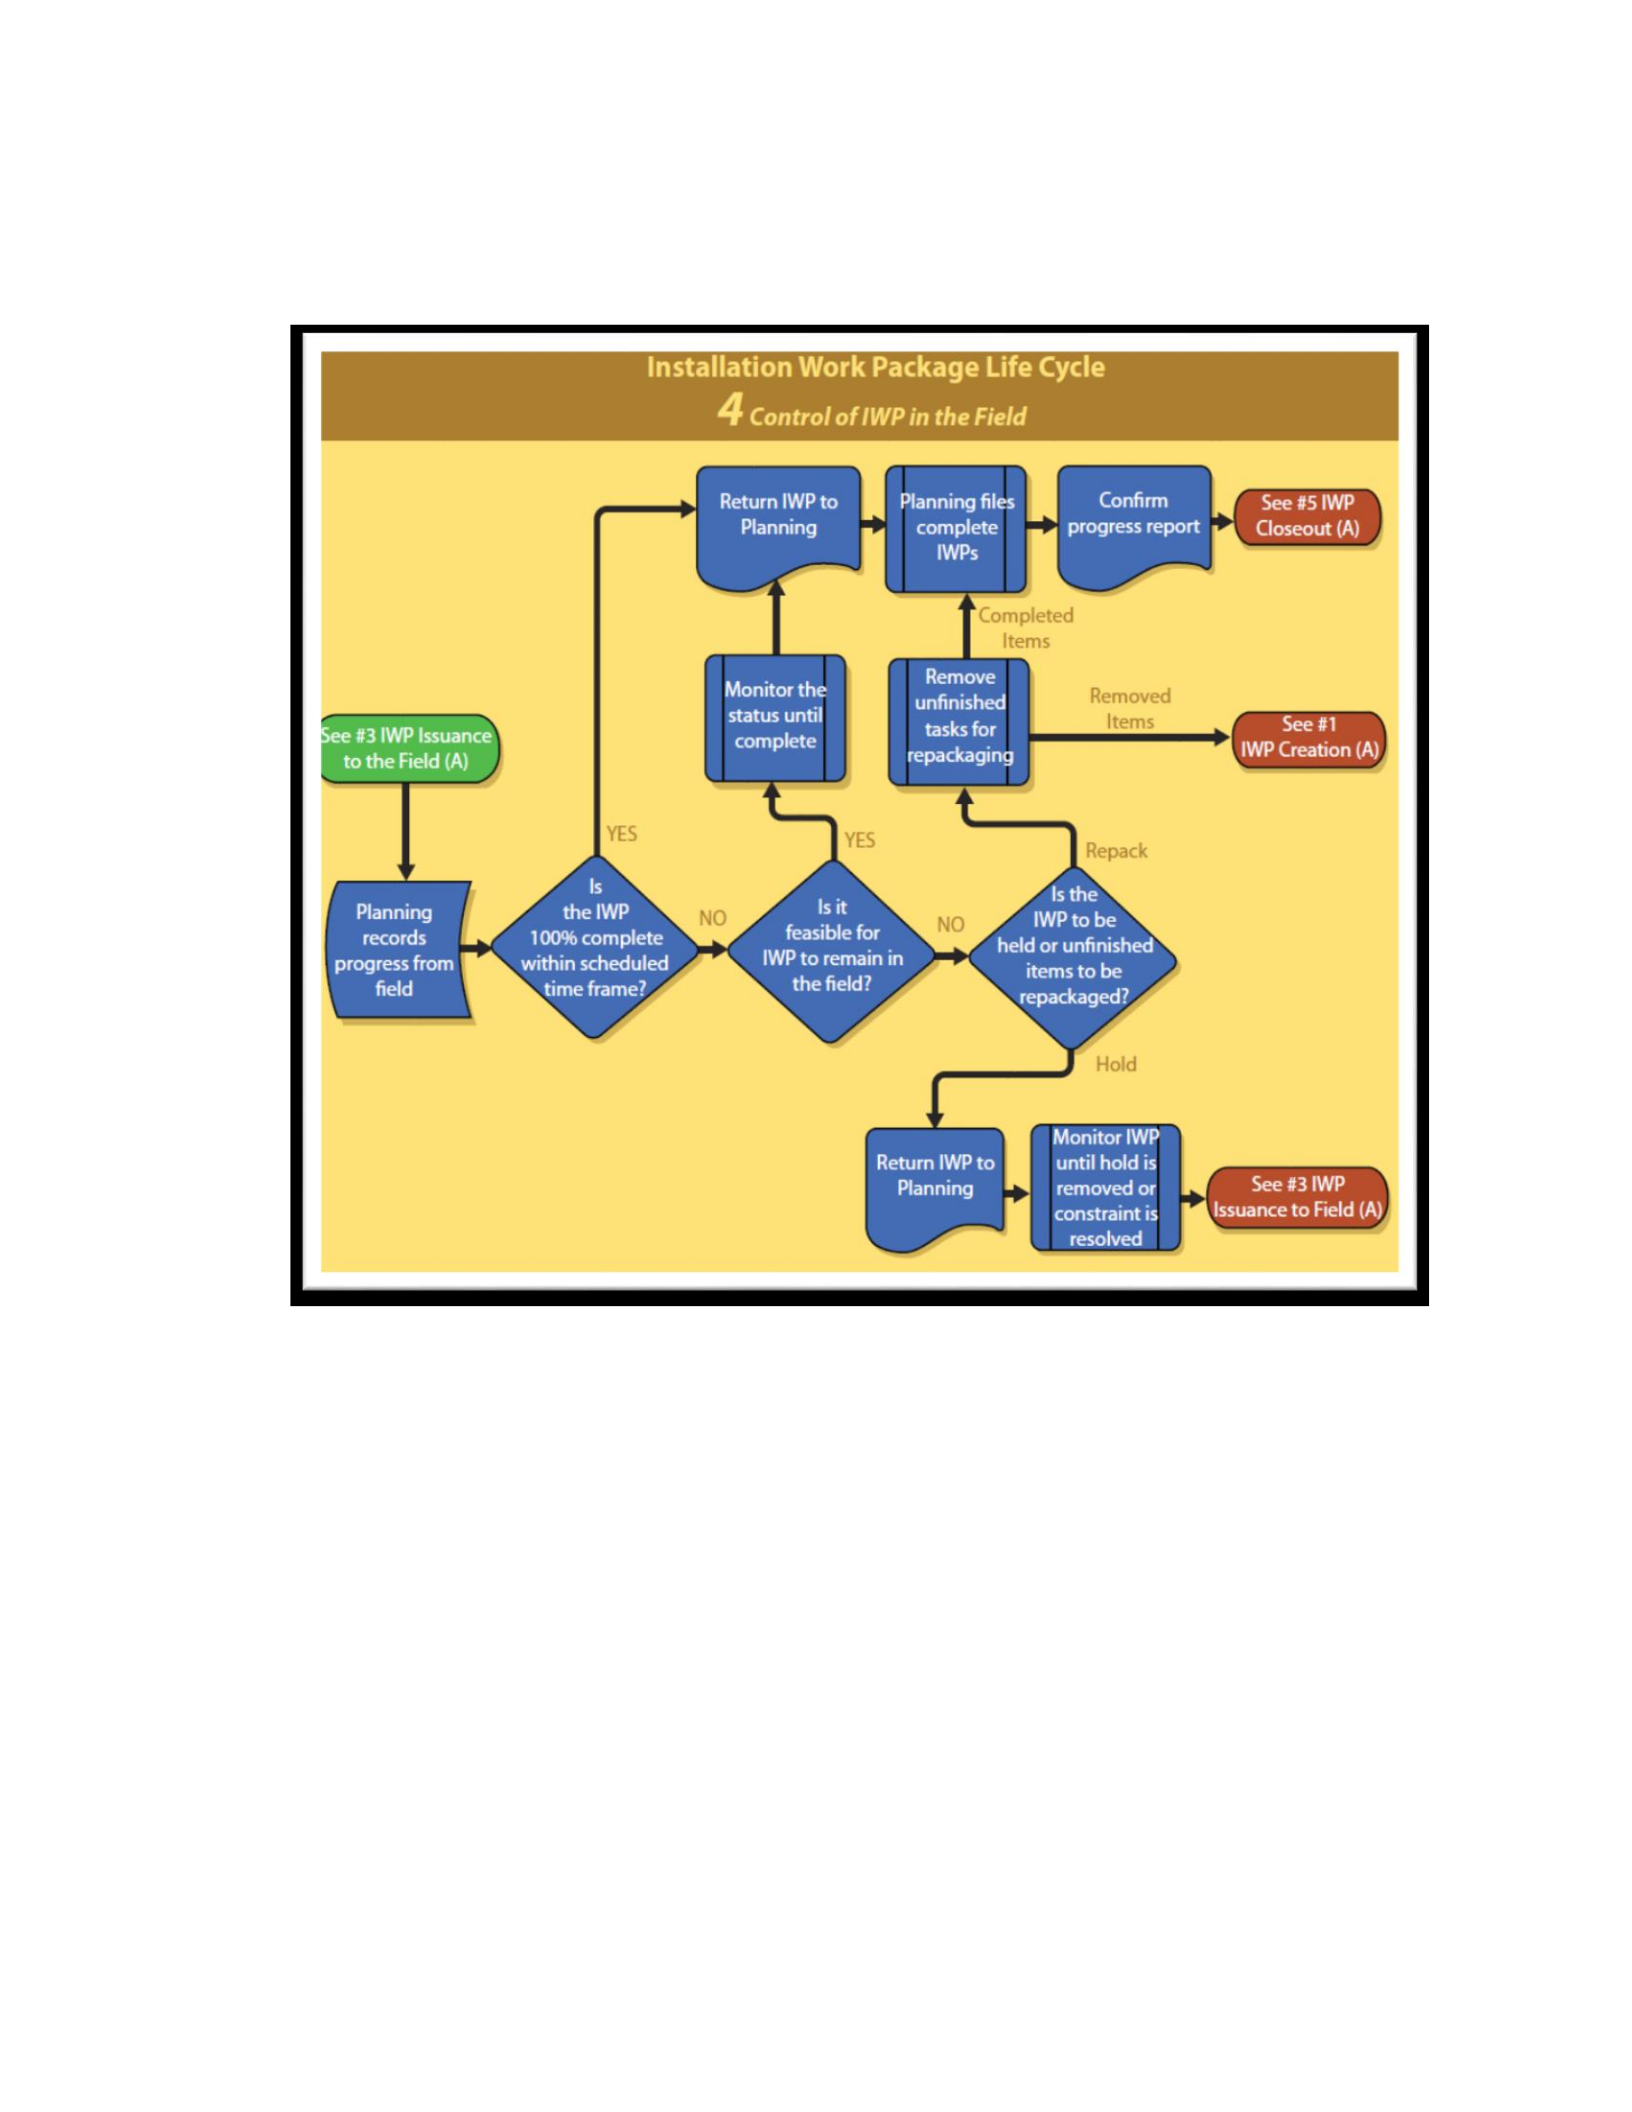
49
before it materializes, or at least immediately upon recognition, and reporting as needed to
resolve issues or balance resources for prevention control.
Figure 2.12 IWP Control in The Field (CII; and COAA; 2013)
After the successful installation of IWP the close-out process takes place that involves:
1) the confirmation of installed quantities, 2) the proper recording of installation deviations
(CII; and COAA; 2013). IWP Lessons learned collection is recommended by the AWP,
however, the process of lessons learned collection and their use for rapid improvement of
standards upon which IWP must be based, has not been explained in the IWP life-cycle.
Lessons learned collection is very important for the improvement of standards and thereby
improvement of the IWP work process outcome.

50
Visual control
Below figure 2.13, is a photograph of a construction site, crews were trying to pre-assemble
a conveyor at ground level that was to be erected to span between 2 large column bents 20
to 40 feet in the air. Project manager came out on the site for inspection and seemed to find
everyone busy working. Indeed, it seemed that 3 members of the crews were very busy
doing it, nothing seemed out of the ordinary. However, they were stuck in fitting one brace
member which did not fit. Just standing there looking at his team for a few minutes, the
Project manager didn’t have any clue that the crew was completely non-productive for 2
hours before and, without intervention, would be 2 hours after he walked out there. Clearly,
something more is required to signal that something is wrong. Sometime during the next
few weeks, this manager would compare actual work with his schedule and budget, and
depending on how much waste and contingency for such poor setup and poor performance
is buried in those tools, he may still not have recognized a problem. Or, if such managers
(using traditional methods) do recognize a problem, a week to 4 weeks later, there is
nothing to do about it. Project management would just find that project has already been
delayed.
Figure 2.13 Construction Site of Pre-assembly of a Conveyor System

51
It suggests that PCMS must require something which enables anticipation and real-time
control. Note that the real-time sensor (e.g., the foreman), is capable of anticipation and
immediate feedback of progress or expected variance relative to plan. Assuming there is a
plan and that most constraints have been removed so that variance is the exception rather
than the norm, the foremen can create the necessary transparency with an indication for
what is not in control. For such a foreman and their general foreman, this is a requirement
to pause, huddle up, and fix it now so that the IWP criteria will be realized or at least that
resources will be balanced for net project gain. Further, this should initiate an update of
standards with the fix so it doesn’t happen again when the standard is used to develop new
IWP. Transparency of this and the resulting status can be provided to Superintendents, area
and project management using visual control.
Visual control is designed to enable a consistent flow of information, material, and
equipment, pulled in according to actual need. It triggers the right things to happen for
teams to sequence work-task packages to fully utilize all work-faces, maintain timely
communication, team alignment and avoid out of sequence rework loops in design and
construction. Also, it makes abnormalities visible to everyone, e.g., delays, breakdowns,
incomplete performance, etc. so that it can be rectified immediately (Patty and Denton
2010b). A significant component of visual control is mistake proofing.
Mistake Proofing
Mistake proofing is an application of rapid improvement discipline, which in other
industries has repeatedly demonstrated that profound improvements can be made and then
made again, to the same work processes, often three to five times before there are even
diminishing returns to the effort to improve. We must never stop striving for improvement
or always be motivated because if we stop our competitors will not stop and we will be left
behind. In construction industry, not much attention is paid on Mistake Proofing to prevent
mistake from occurring at the first place. Mistake Proofing is a proactive approach to
control which prevents mistake or errors to occur at the first place.

52
“The last couple of decades have yielded enough mistake proofing devices and procedures
in so many industries that 100% inspections are economically possible real time for almost
any conceivable process.” (Patty and Denton 2010b).
Following description of mistake proofing is based on the work done by Patty and Denton:
The intent of mistake proofing is to create a structured environment to ensure no defects
are passed downstream, (reducing variability in control downstream), by systematically
removing root causes, eliminating the negative impact of error on performance (Patty and
Denton 2010b).
If any mistake occurs, the process or execution must be halted while immediate action is
taken to identify root causes. “Much experience has shown that the benefits outweigh the
costs of bringing an entire line down. This is because it creates a sense of urgency and
focuses resources on prevention. Everyone knows this can be very expensive if it occurs
often, so it is essential to prevent defects before they happen.” (Patty and Denton 2010b).
Lean
The objective to transform PCMS could be achieved by implementing Lean thinking and
Kaizen in PCMS. Lean is a philosophy to provide more and more with less and less–less
human effort, less equipment, less time and less space-while coming closer and closer to
providing customers with exactly what they want (Womack and Jones 2003). What is
generally lacking in this definition and the work of Womack and Jones, is the key role of
human factors for mutual benefit of all the stakeholders. Without the assurance of mutual
benefit, improvements are short term if they are achievable at all and many will not be.
Lean is the process of continuous improvement by the continuous removal of waste. The
term ‘Lean’ is first coined by John F. Krafcik in his articles “Triumph of the Lean
Production System” in 1988. Lean is the practice of continuous improvement and hence it
is said that Lean is not a destination but a journey; a journey forever for the elimination of
waste and making continuous improvement (Krafcik 1988). Lean implementation is
focused on getting the right things to the right place at the right time in the right quantity

53
to achieve perfect work flow, while minimizing waste and being flexible and able to change.
Lean could be an organization, work process, system anything where continuous
improvement could be achieved is called Lean. If it is applied at organization level, the
organization could be said as Lean organization. Similarly, if it is applied at system level,
the system would be called a Lean system. The objective here is to make PCMS a Lean
PCMS by the application of Kaizen. The Kaizen process is successful because it employs
the Lean thinking approach of designing a flexible, controllable, efficient, and unique
manufacturing process (Womack and Jones 2003). According to Robert Patty, Chihiro
Nakao, President of Shingijutsu (the consulting arm of Toyota) differentiated the Toyota
Way from Womack and Jones’ description of Kaizen by Toyota’s emphasis on mutual
benefit. According to Chihiro, the team is not finished figuring out what to do differently
until they have determined how all the associated parties will win by what they are
proposing to change. (Robert Patty, personal Communication, May 23, 2017). This is
driven by Dr. W. Edwards Deming’s philosophy that you don’t just do business you build
relationships, According to Lepore et.al. “Improving a work process creates a chain
reaction with improved quality, reduced cost, and increased reliability in its wake.” (Lepore
and Cohen 1999) According to CII, there is a huge opportunity in construction industry
through the Lean construction principles (CII 2005).
2.13.1 Kaizen
The incorporation of the Lean Philosophy in PCMS will be carried out through Kaizen.
“Kaizen” is a Japanese word which means “change for better”. It is a step wise process
which is carried out with the involvement of all the skills and stakeholders. So, for PCMS
advancements, it involves all the skill and stakeholders which are related to PCMS.
Following is the summary of the Kaizen: (Patty and Denton 2010b)
• Preparation for Kaizen involves identifying work process problems, or opportunity
to improve; measurement and estimating the value of closing the gap between what
is and what should be. Teams should summarize their findings in ‘situations-at-a-
glance’ and identify skill and stakeholders, principles and methods for solution
development and implementation

54
• A Kaizen is a workshop, to develop the solution of the work process problem with
the involvement of all the skills and stakeholders, and the application of rapid
improvement principles and methods
• Once solutions are developed, Kaizen teams validate and refine the solution
through trystorming and Piloting
• If the desired solution is not achieved, the process is repeated again and again until
the desired best solution is achieved and standardized
• After successful piloting these improvements are built into company standards,
management by standards must be embedded in the culture and governance of the
organization
Above mentioned advancements in PCMS are not the only improvements which can be
incorporated through Kaizen. During Kaizen workshops, many other improvements will
also be innovated and implemented. Many times, without full skill and stakeholder
involvement and other Kaizen methods, improvement initiatives taken by organizations are
not successful or management could not embed those improvements in the culture of the
company. Experience in many industries have shown that Kaizen is such a robust process
that if properly carried out will embed improvements into standards and management by
standards, into the culture of the organization, far more consistently
2.13.1.1 Important Considerations for Kaizen
Following important consideration is highly dependent on the work by Patty and Denton
(Patty and Denton 2010b)
• Abolishment of the culture of already knowing and cordial hypocrisy
• Motivation and encouragement for the executives or senior management to engage
the skills and stakeholders to participate in the Kaizen process – in recognition that
to be successful, all stakeholders must win.
• Alignment and whole hearted participation of everyone throughout the process
• Relentless implementation of the whole Kaizen process and willingness to repeat it
again and again
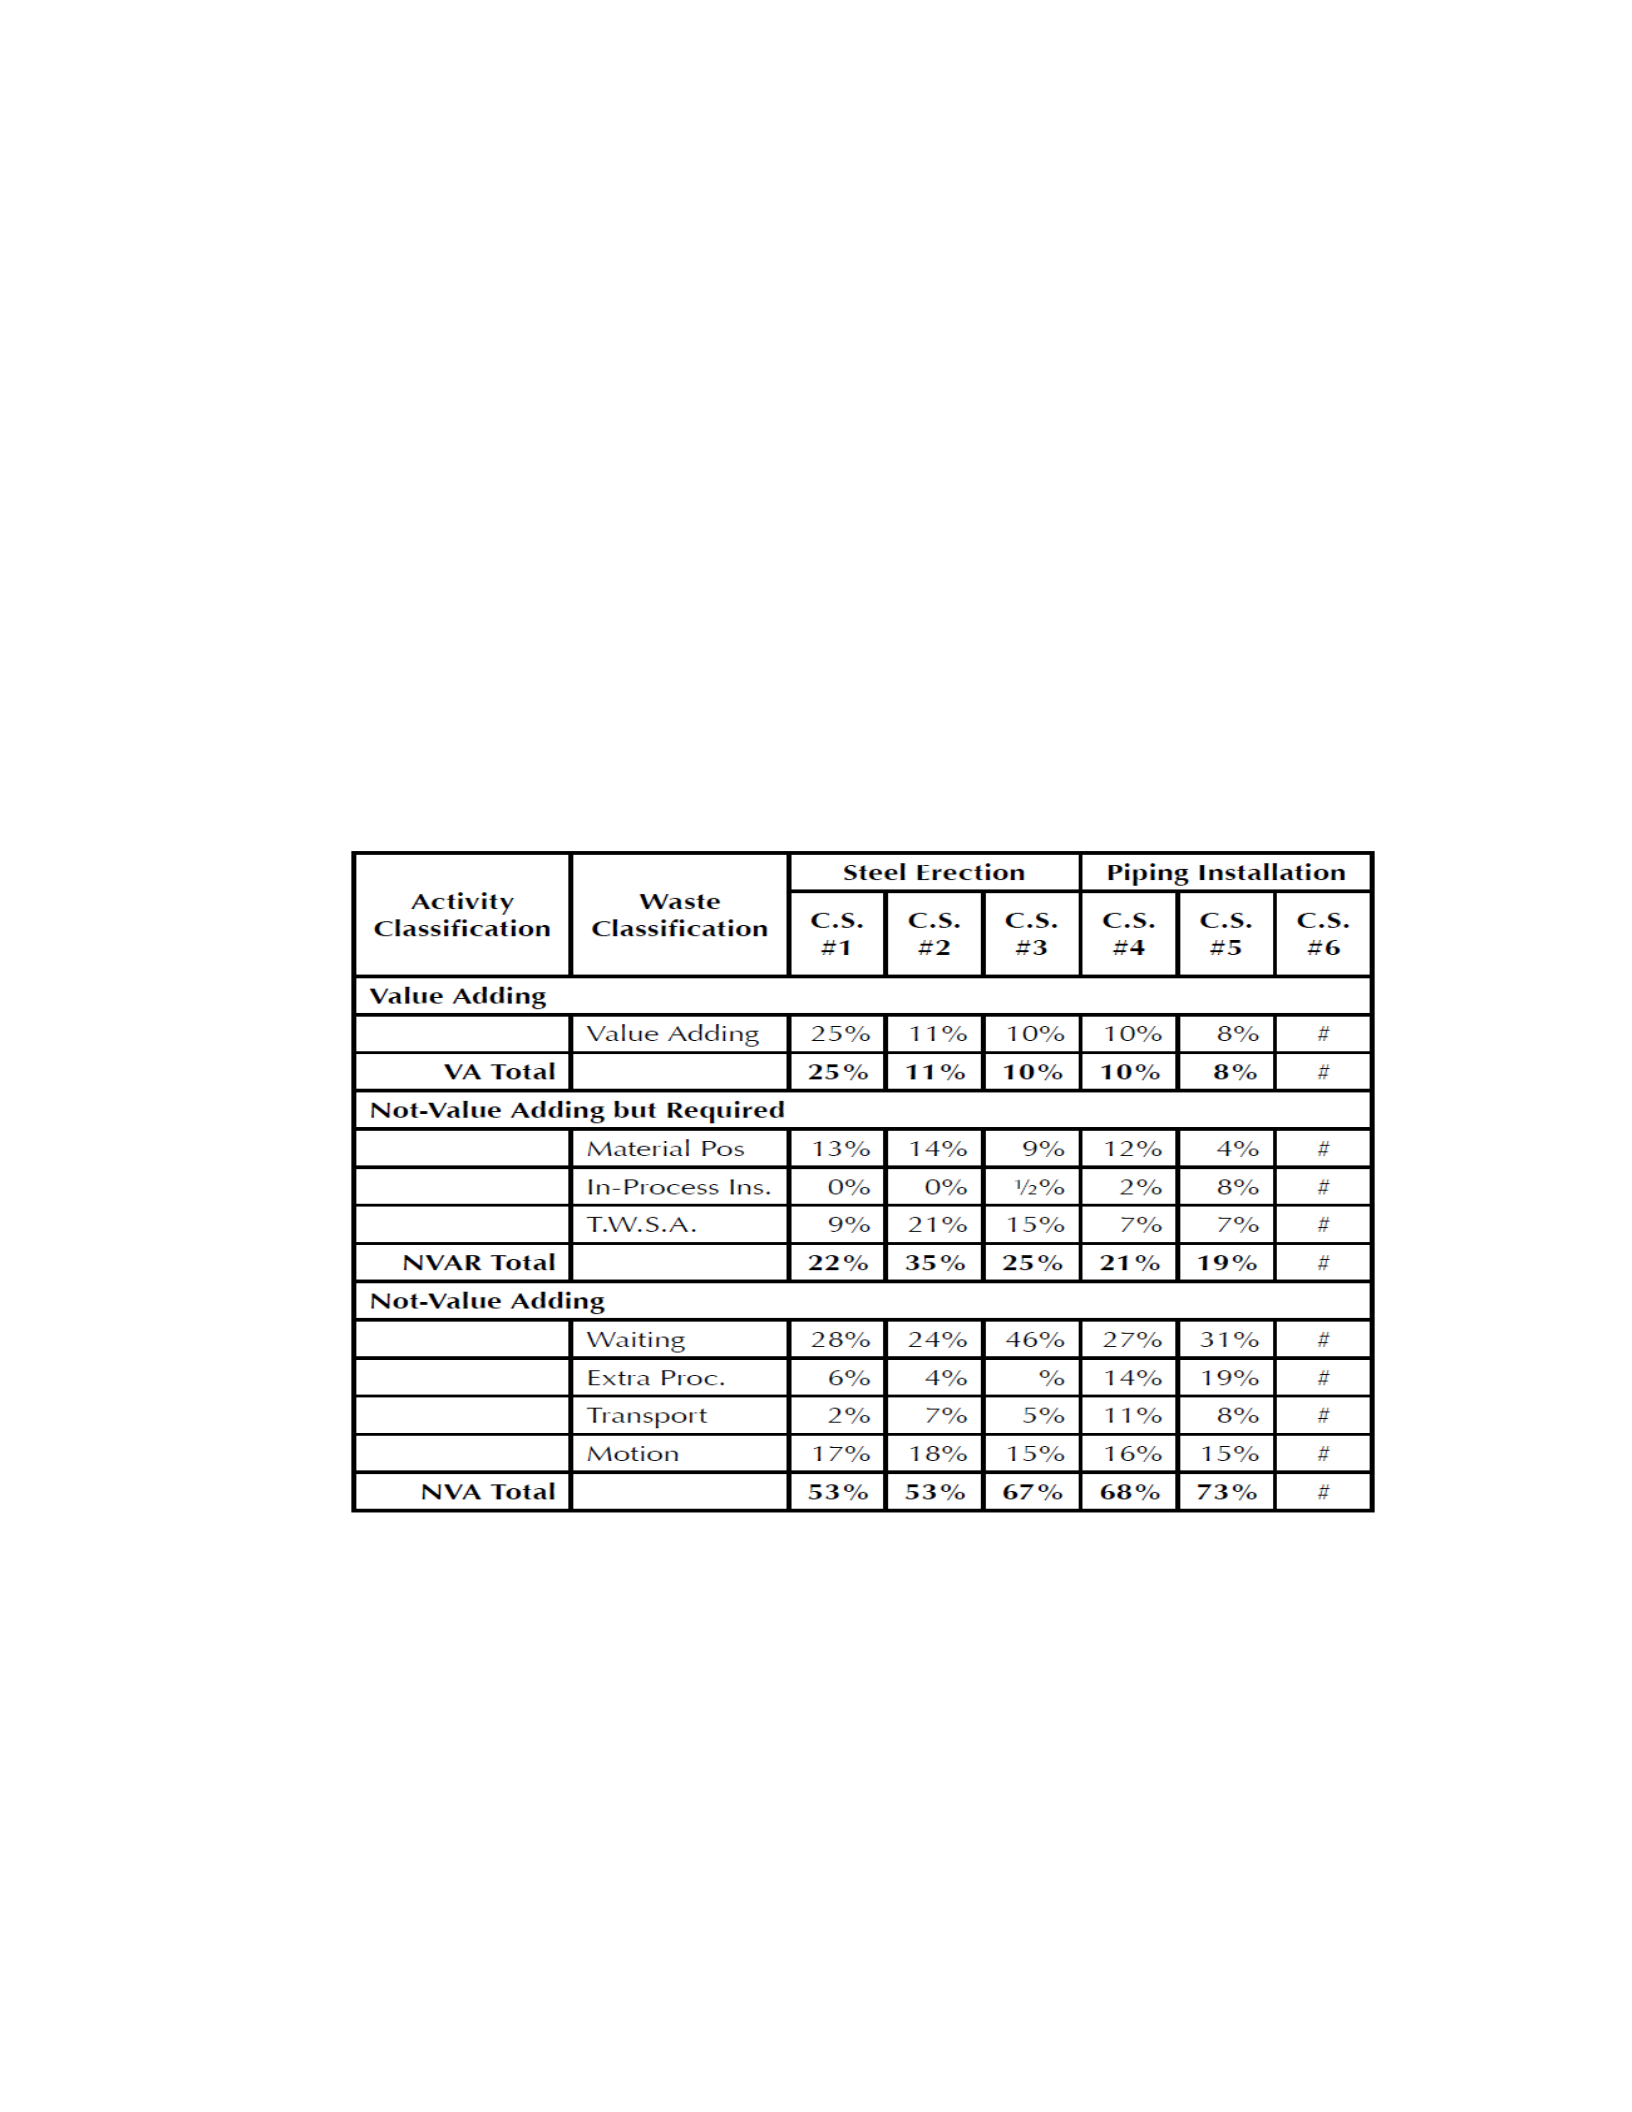
55
• Knowledge and understanding of the “Lean principles”
• Involvement of Kaizen/Lean experts to facilitate the process
2.13.2 Universal Lean Principles
According to Patty and Denton., to apply Kaizen successfully and incorporate Lean, it is
necessary to have knowledge and understanding of Lean principles. In a research by CII,
six different construction projects are taken as case studies shows the following result for
value added work.
Table 2.3 Value Adding, Non Value Adding But Required, And Non-Value Adding
Work (CII 2005)
According to Robert Patty, measurement on various construction projects display the
measure of value adding work in the range of 10% to 40% (Robert Patty, Personal
Communication, May 23, 2017). From the table 2.3, it could be seen that in five out of the
6 case studies conducted by CII, by the value adding work is around 10% Also, there is a
possibility of dramatic improvement by considering construction to be a form of
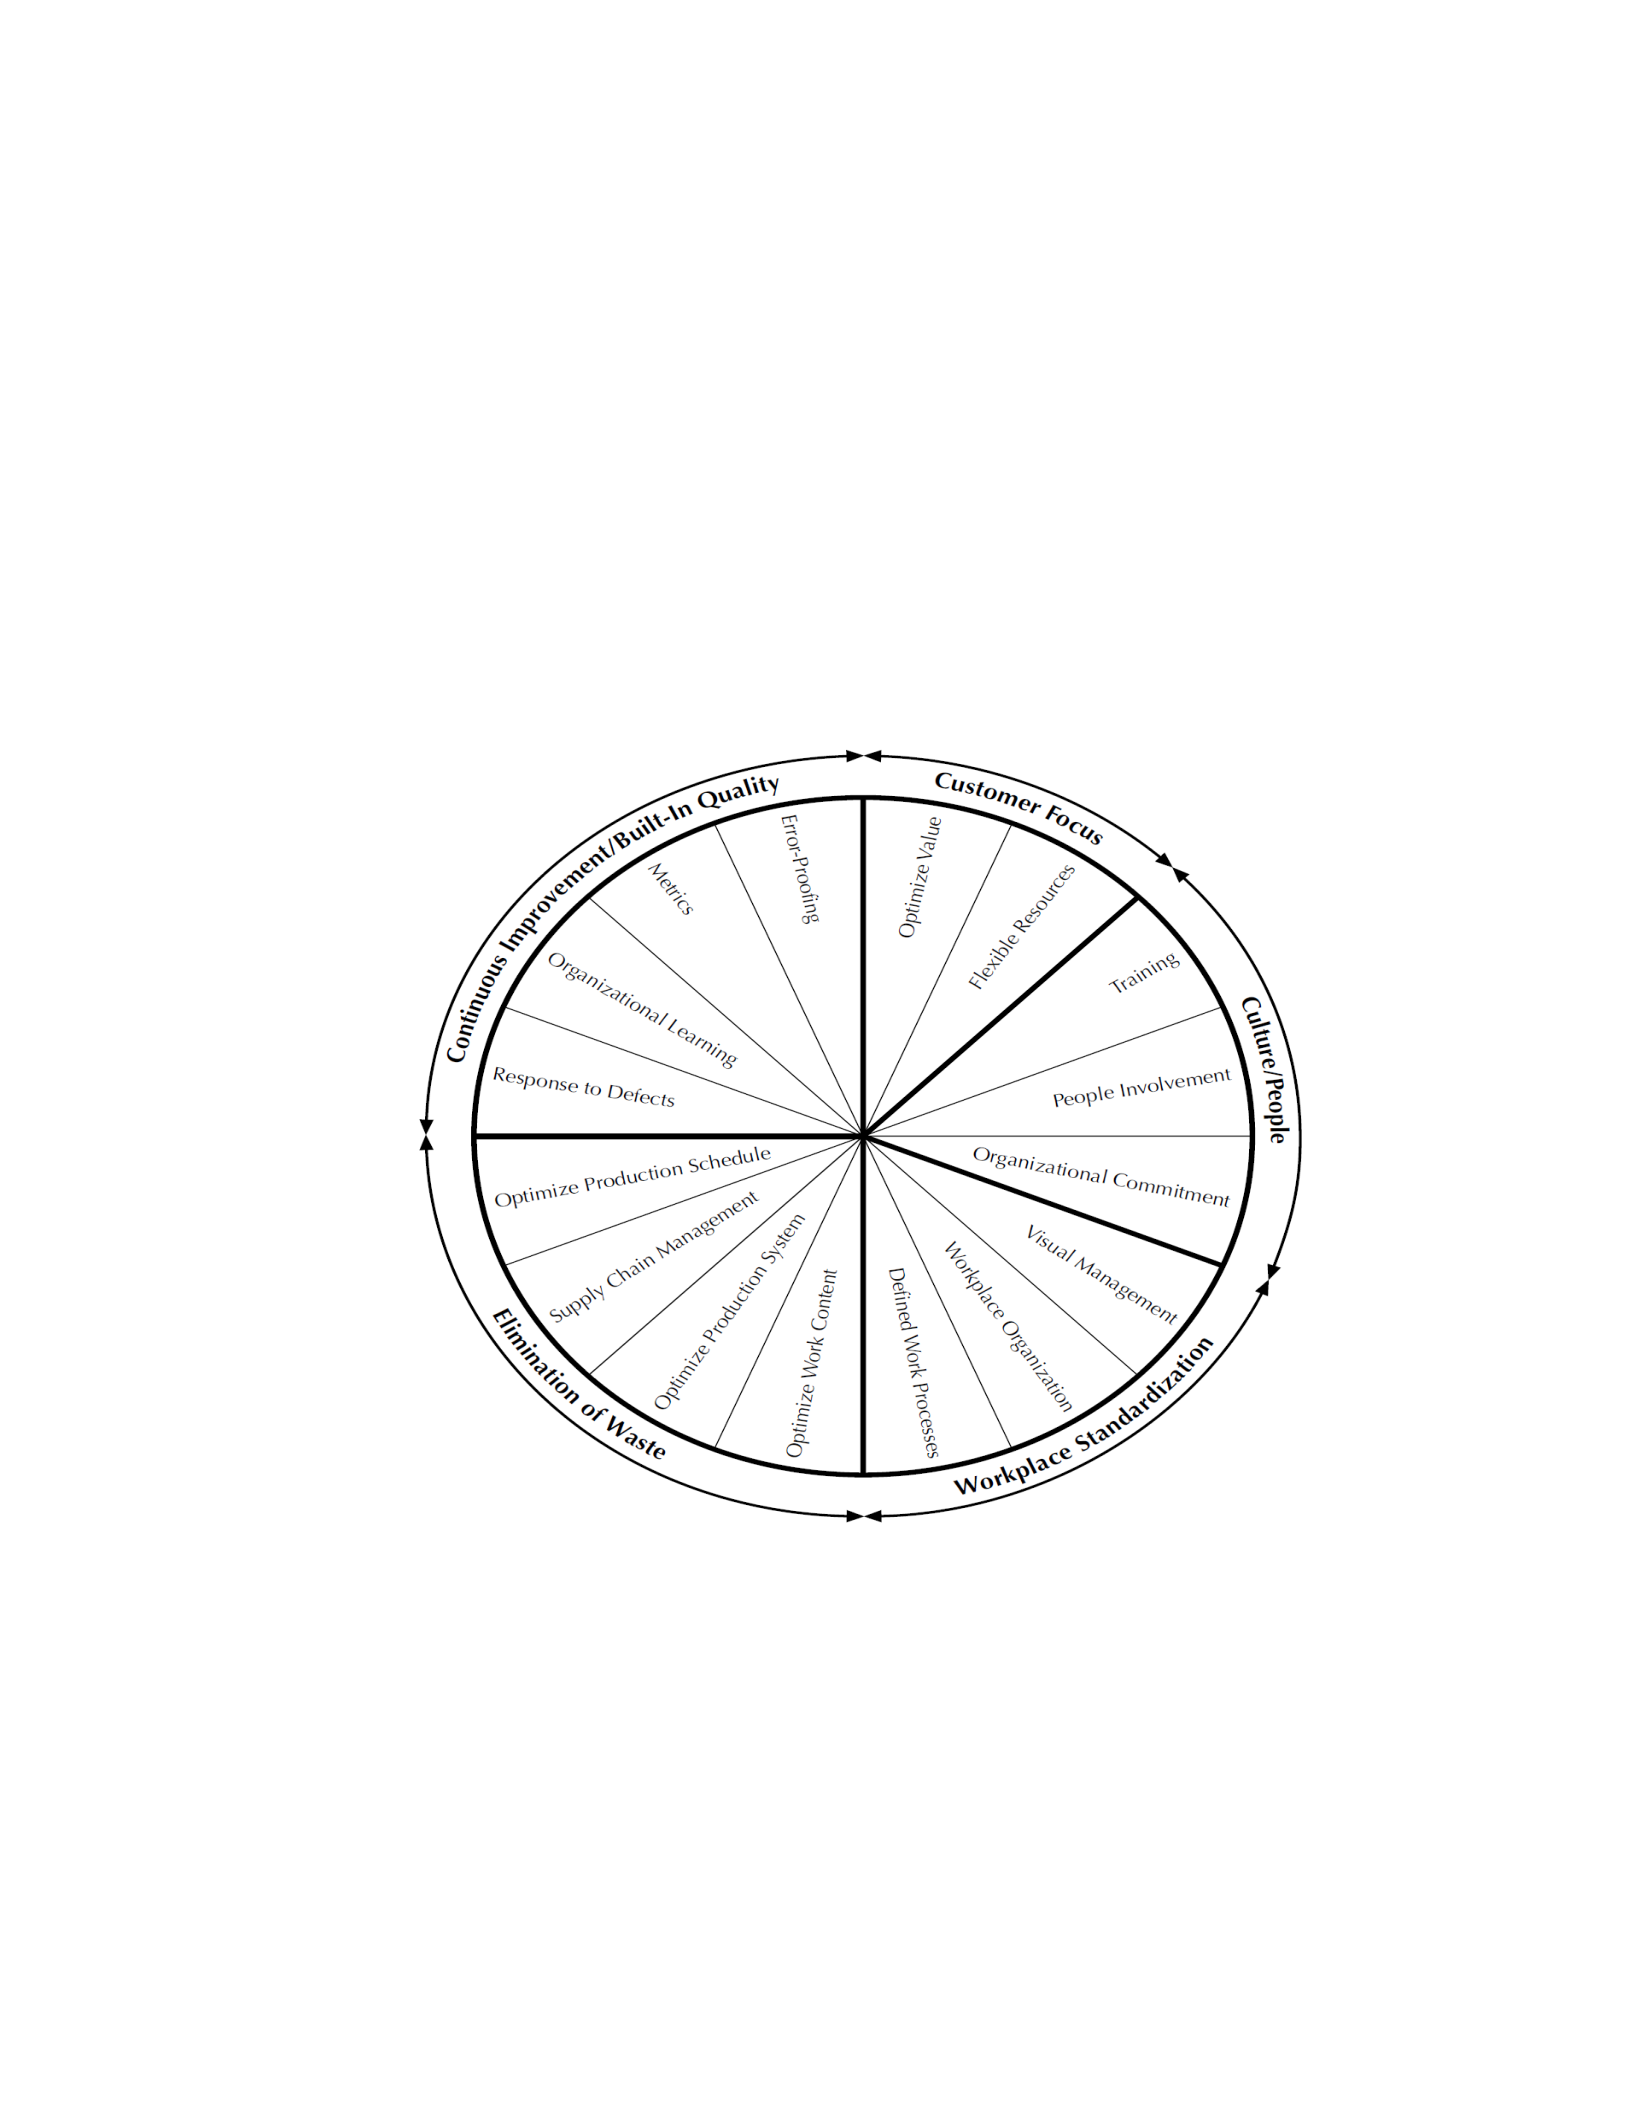
56
manufacturing by the application of Lean principles. The CII team has developed five high
level Lean construction principles:
1. “Customer focus
2. Culture and people
3. Workplace standardization
4. Elimination of waste
5. Continuous improvement and built-in quality” (CII 2005)
To understand Lean principle better, CII has created a Lean wheel as shown below
Figure 2.14 Lean Wheel (CII 2005)
(Note, the foundation of mutual benefit is missing. The failure of these early “Lean
promoters” has fundamentally restrained its progress and benefits)

57
2.13.3 Benefits of Lean/Kaizen in Diverse Industries
According to Patty and Denton, Lean has transformed nearly the entire manufacturing, ship
building, aerospace industry, etc. and can tremendously benefit the construction industry
(Patty and Denton 2010b). According to CII, Many industries have tremendously benefited
from the Lean, and there is a huge potential in Lean to benefit construction industry (CII
2005). A few example of industries which are benefited from Lean are the following:
1. According to Womack et.al., by 1985, Japanese automobile industry become more
than 30% productive verses their US and European counterparts. Toyota:
• cut the industry standard engineering man-hours from 3 million down to 1.7 million
(to design and setup a line for a new automobile),
• slashed project time by 15 months,
• and reduced commissioning/startup time to design production rates and
specifications by an impressive 62%.
Assembly duration and assembly defects of GM reduced by more than 50% and 90%
respectively, relative to its own non-Lean plant (Womack et al. 1990)
2. Aerospace, Atlas 5 vs Atlas 2 production (Patty and Denton 2010c)
• part count reduced by 35%,
• factory assembly time reduced by 70%,
• schedule reduced by 72%,
• on-pad activities reduced from 120 days to 1 day.
3. ABS a steel industry process is benefited. Total production lead time reduction is
almost 70%, average inventory reduction 90% (Abdulmalek and Rajgopal 2007).
4. Production industry is hugely benefited (Singh et al. 2010)

58
• reduction in lead time was 83.14 perent,
• reduction in processing time was 12.62 percent,
• reduction in work‐in‐process inventory was 89.47 percent,
• reduction in manpower requirement was 30 percent.
• rise in productivity was 42.86 percent.
5. According to Womack et.al., Lean car manufacturing project development:
• costs are 40% less,
• completed in 24% less time,
• with 40% less project employees,
• more consistently completed without delays,
• results in faster startup to design production rates and specifications than the non-
lean counterpart (Womack et al. 1990)
Conclusion
The concept of production flow has shown tremendous benefits in the manufacturing
industry and also shows potential for the construction industry. There is 25% increase in
productivity, 10% reduction in total cost, significant reduction in RFIs, less rework, and
increased stakeholders alignment is documented (Brien and Hamdi 2016). The goal of the
construction production flow system is to flow the work. The main objective of the flow
system is to increase predictability and productivity. Project delivery engenders a need of
more robust flow control system which enables real time control integrated with all other
aspects of excellence in the construction flow system.
Aligned break down structure could be utilized to improve the flow. We will see in the
following chapters that real-time visual control at each level of the organization or project
management team from project manager to foreman level can further improve flow. Lean

59
and Kaizen could be utilized to incorporate flow control into the existing PCMS and
continuously improve the state of control excellence in the PCMS.

60
3. PROPOSED ADVANCEMENTS IN PCMS
Introduction
Project control and management system (PCMS) intent is to assure the right thing happens
consistently and reliably throughout the project. The main objective of PCMS is to provide
a desired outcome for the project. It is necessary to have a system set up so that projects do
not go off track in the first place. Further, there must be threshold criteria and protocols for
early warning reporting and facilitation of the managing of opportunities and issues. If a
project goes off track, there must be a real-time control feature so that as soon as the project
starts to go off track or the desired state (or is anticipated to move or actually measured
beyond the threshold), such a condition is transparent to those who need to know and the
protocol requires it be fixed. There should be an emphasis on measuring what is going
wrong using front-line supervisors, engaging skills and stakeholders to immediately correct
what is not under control. Control requires sensing, recording, and transmitting what
happened, correcting the immediate work process, and improving standards for avoiding a
similar performance decline during tasks on future projects. The creation and use of such
standards must not be optional because their creation and use is the foundation of any
system of improvement. Without standards that be used, there is nothing to improve. Using
standards for PCMS, what is known gets built into the standards and then into project
specific plans that get executed. People seek to make and keep commitments so that others
can plan with confidence. Future performance deviation beyond thresholds defined for
control is more frequently anticipated or at least reliably measured and rendered transparent,
triggering countermeasures to minimize poor outcomes.
Proposed Advancement in the PCMS
Proposed advancements in the PCMS are based on a new theory of PCMS, which is
classified into three main features or systems.

61
3.2.1 The Desired State
The desired state is at both the project level and the project control system level. At the
project level, the desired state of control elements is defined in the objectives such as the
budget, schedule, quality, and safety. Also, through its breakdown structure, the desire state
should be defined for each of these objectives at each level below (area, system, discipline,
and task). At the project control system level, the desired objectives need to be achieved
including work process, procedure, technology, tools, methods, skills, and lessons learned.
The control elements including budget and schedule serve to benchmark the status of the
project, especially at the task or work task package level, which can be controlled. Since a
project is a process not an event, controls provide the desired path mapping the process for
the project. The process is comprised of planning, scheduling, estimating, progressing,
forecasting, coordination, alignment, constructability, etc.
3.2.2 Flow Control System
A “Flow Control system” seeks to enable and govern how the desired state or the mapped
path for a project travels so that the system works consistently and reliably. The main
objective of the flow control system is to attain a flow which determines how the resources
(information, materials, equipment, labor, and workface) are processed (sequenced, created,
or procured and delivered). There are two types of flow control system: push flow control
systems and pull flow control systems. Flow control systems ensure that resources flow
and that the desired project controls criteria are achieved consistently and reliably on the
mapped path traveled. These systems enable people to do what needs to be done when it is
needed to be done and involve both push and pull approaches, critical chain scheduling,
critical path scheduling, work packaging, look ahead planning, change management system,
QA/QC, etc.
3.2.3 Measurement System
A measurement system that expects to control the actual progress of the project operates
along with the unit of project production, which is the work task package. This requires
that all project work be planned and packaged at the task level with criteria for performance
measurement, which are discipline, system, area, and project criteria. Task managers (front

62
line supervisors, i.e., foremen, engineering and procurement task leads) then compare the
actual progress of their work against their task criteria and anticipate variance at frequent
intervals. Task managers are both the sensing device and the workface telemetry for visual
control when they report current status and anticipated variance at task completion to their
supervisors. Such information is dealt with appropriately by the task managers and their
supervisors (e.g., general foremen, discipline leads) and provides the first and the best basis
for control. The task level status is rendered transparent by the measurement system in
appropriately amalgamated dash boards (the visual control) at each level up the
organizational breakdown structure.
The key is that each level (system, area) and project manager receives the information. The
supervisors at the upper levels support the task managers in getting what they need when
they need to add value to the project consistently and reliably. Since all breakdown
structures parallel the criteria and organization breakdown structures, the project control
measurement system will provide data at each level for that level manager to compare the
actual with the baseline, anticipated with forecasting, and do what is needed in real time
(shift or balance resources, apply countermeasures, report and discuss what to do with
subordinates, peers and their manager specific to needs as they happen or can be prevented.
At each level, managers can do trend analysis and forecast the progress of their responsible
scope for the project. This involves (specific to the task level breakdown structure and its
rollup) physical measurement, visual control, real time control, progression, forecasting,
earned value analysis, percentage completion S-Curve analysis, schedule control, cost
control, etc.
Experts’ Review
The goal of the proposed advancement is to make the current PCMS a Lean PCMS to
achieve success in the project. This means making the control a proactive rather than a
reactive approach. At each level, it is proposed to incorporate Lean/Kaizen to enhance the
overall system of project controls so that the project does not go out of control in the first
place. The aim of the Lean PCMS is to provide the efficient and effective control needed
for the continuously changing environment of capital project delivery by continuously

63
improving itself and removing variabilities through Lean philosophy and concepts. It is
proposed to incorporate real time visual control over the entire project so that if any
deviation occurs at the task level (recognizing every level above is simply amalgamations
of tasks), by controlling tasks, the above levels (discipline level, system level, area level,
project level) could be brought back to real time without suffering much deviation. Often
project failures, especially mega project failures, may begin small, but can rapidly
deteriorate into failures. By a team focus on getting task level supervisors just what they
need, planning and executing task by task with excellence, doing early measurement,
anticipating task level variance, and providing a rapid response to prevent deteriorating
consequences, projects are executed or brought back on track more reliably. Overall, we
propose here a system that is created to maintain flow of resources and provide control at
the task level so that the system operates consistently and reliably.
Table 3.1 Experts Background
Two models are created to incorporate the above enhancement:
1. Real time visual control flow system model
2. Lean PCMS model
Name
Area of expertise
Industry
Years of
experience
Expert 1
Thomas
Terris
Capital Project delivery, project
operations and management,
Lean, Kaizen
EPC
37 years
Expert 2
Robert
Goings
Work process improvement,
continuous improvement, value
improvement practices, FEL,
project management office
EPC
35 years
Expert 3
Fred
Wellman
Project control, estimating and
costing, cost control
EPC
30 years
Expert 4
Dipak Patel
Project control, planning and
scheduling, scheduling control
EPC
20 years
Expert 5
Don A.
Blake
Lean
Manufacturing/Continuous
Improvement
Aerospace
manufacturing
& operations

64
The models have been reviewed and verified by five industry experts. The background of
these experts are given below. Several interviews were conducted with experts on Lean
and capital project delivery. Through these informational interviews, the models were
reviewed:
1. Lean principles and a Kaizen model for PCMS improvement in heavy industry
capital project delivery was discussed.
2. Impact during the life cycle of the capital project was discussed.
3. Horizontal and vertical integration of breakdown structure was discussed.
4. A proposed system to achieve flow throughout the project, i.e., from front end
loading to start-up of a project, was discussed.
5. The concepts and practices of PCMS and closing the control gap on major projects
were discussed
On the basis of these interviews, two models: 1) Real Time Visual Control Flow System
and 2) Lean PCMS models to improve PCMS in capital project settings were developed
and are proposed here to maintain flow during the EPC phase of the project. Early models
were sent to the experts to review. The experts’ suggestions and comments were
incorporated in the models and the models were refined. Further, the final models were
sent to the experts for final validation, and after the final validation, these models were
documented as shown in this chapter.
Real Time Visual Control Flow System
“Real Time Visual Control Flow System” is a model proposed to overcome the deficiencies
present in the existing flow system models such as the last planner system and advance
work packaging models. The main objectives of this proposed model are as follows:
1. To make the EPC stage more of a pull approach than a push approach.
2. Prevent the project from going out of control in the first place.
3. Provide real time control to the project.
4. Make lessons learned collection compulsory for continuous improvement and
standardization of the flow system

65
5. Facilitate the project management team becoming well integrated, aligned, and
coordinated throughout the project.
There are various concepts which need to be incorporated to develop the real time visual
control flow system model. The concepts are aligned as breakdown structure, critical chain
project management, visual control, amalgamation of push and pull approach, flow system,
life cycle of work task packaging, visual control board, mistake proofing, etc. The concepts
discussed below were amalgamated with the concepts and practices described in chapter 2:
Literature Review to develop a model on flow for EPC named Real Time Visual Control
Flow System Model. The goal of this model is to enhance the flow system by incorporating
real time control into it.
3.4.1 Aligned Breakdown Structures
Cost break down structure (CBS), work breakdown structure (WBS), and organizational
breakdown structure (OBS) are developed, integrated, and aligned vertically and
horizontally at each level. At these levels, there is a package with information regarding
duration, scope of work, cost, and owner. Work task packaging is done at level 4, which
is the breakdown of level 3 construction activity. It is very important that vertical
breakdown structure levels do not go beyond level 4; more vertical levels encourage
unnecessary complexity.
1. WBS: WBS defines the Work Performance Calibration Boundaries (How and at
what level information needs to be collected, analyzed, and reported with the
assessment).
2. CBS: CBS defines the Boundaries of capturing the cost and projections (The
amount/magnitude/gravity of the work is conveyed.).
3. OBS: OBS helps in summarizing the accountability, assessment, and resource
management boundaries for reporting to a specific audience (who needs to be
addressed)

66
The table 3.2, below provides the integrated breakdown structures with their respective
levels. (Dipak Patel, personal communication, Jan 20, 2017)
Table 3.2 Integrated Breakdown Structures
It is indispensable to have an aligned breakdown structure for real time visual control. An
aligned breakdown structure provides better alignment, coordination, and integration for
the project. It summarizes the scope of the work, ownership, reporting, and assessment
structure for the project at each level of the organization. It supports flow by ensuring
consistency between cost estimate and project schedule, facilitates resource loading
schedule, and therefore provides consistent project controls.
All the departments of a project team have aligned breakdown structures with CBS and
WBS. Given below, in the Figure 3.1, is the organizational breakdown structure for project
control, safety, and quality (QA/QC).
Level
Accountability
Analysis &
Reporting
WBS
CBS
OBS
0
Project Level
Project Level
Cost Information at
Project Level
Project Manager
1
Area Level
Area
Cost of an
Area/Stream
Area Manager/
Engineering
Manager
2
System
System
Cost of a System
Superintendent /
Systems Engineer
3
Discipline or
Craft Level
Components /sup-
system (engineering
& construction
“discipline level” e.g.
civil, mechanical,
instrumentation etc.
Cost of the
component or
subsystem
Engineering
Discipline
Head/Craft General
Foremen
4
Task Level
Analysis &
Feedback Level
(lowest level)
WTP (concreting,
formwork,
foundation, beam-
column, etc.)
Cost information at
task level or cost of
a work task package
Task
Owner/Foreman

67
Figure 3.1 Sample OBS of Project Control, Safety, and QA/QC in Parallel with CBS and
WBS
3.4.2 Amalgamation of Push, Pull, and Push-Pull Approach in the Capital Project
Delivery Life Cycle
Based on the literature review, flow is either push or pull, and it transitions from one to the
other through a push-pull interface. Flow in the different stages of a capital project delivery
life cycle could be done through different approaches. Push and pull are the two main
approaches to achieve flow. Pull is superior in its simplicity and ability to achieve flow but
is only possible under conditions that are worthwhile for projects to pursue. These two are
fundamentally different approaches to s achieving and sustaining flow. These approaches
have emerged in advanced manufacturing, and their applicability has been corroborated by
CII, COAA, LCI, and others as being highly effective for improving construction, EPC,
and front-end loading. Below is the representation of various stages of a heavy industrial
EPC project delivery or facility project delivery with the type of flow based on the nature
of the stage.

68
3.4.2.1 Front End Loading (FEL) Stage
According to Robert Patty, the push approach is to be used during FEL by deriving what
needs to be done next from best practices and best sequence standards for FEL performance
excellence. Such planning in the project definition stages requires ideas, experience,
knowledge, and previous project data and must be readily available to such teams. Also,
considered in determining what to do next are the results of what has been completed,
results which often constitute decisions or a guide on what is to be done next. So, until
previous FEL stages are completed, the next one cannot be started. Continuity of work,
skills, and stakeholders is to be maintained in the FEL stages (Personal communication,
Robert Patty, Jan 5, 2017).
During FEL stages, push is applicable because the work face is in the defining stage and
there is no available work face from which work can be pulled; what needs to be done next
during FEL is defined by what was just completed. For instance, until FEL 1 is completed
FEL 2 cannot start. The best practices, concurrent engineering value improving practice
workshops, best sequence, methods, and measures to achieve performance excellence in
the deliverables should be available to the team from FEL work process standards. A long-
range schedule for each phase of FEL should be derived from the standards. Such standards
should be developed by the company from a combination of published industry best
practices, company records, and the experience of company skills and stakeholders.
Company standards development and setup to manage by standards in the company are
achieved through Kaizen, including performance measures, transparency, and governance.
FEL work should be defined from the standards with the schedule sequence as a priority
and as guided by standards and their recommended sequence specific to the project. FEL
work should be defined in work task packages and executed by commitment insofar as the
team can predefine what should be done and agree on how long it should take.
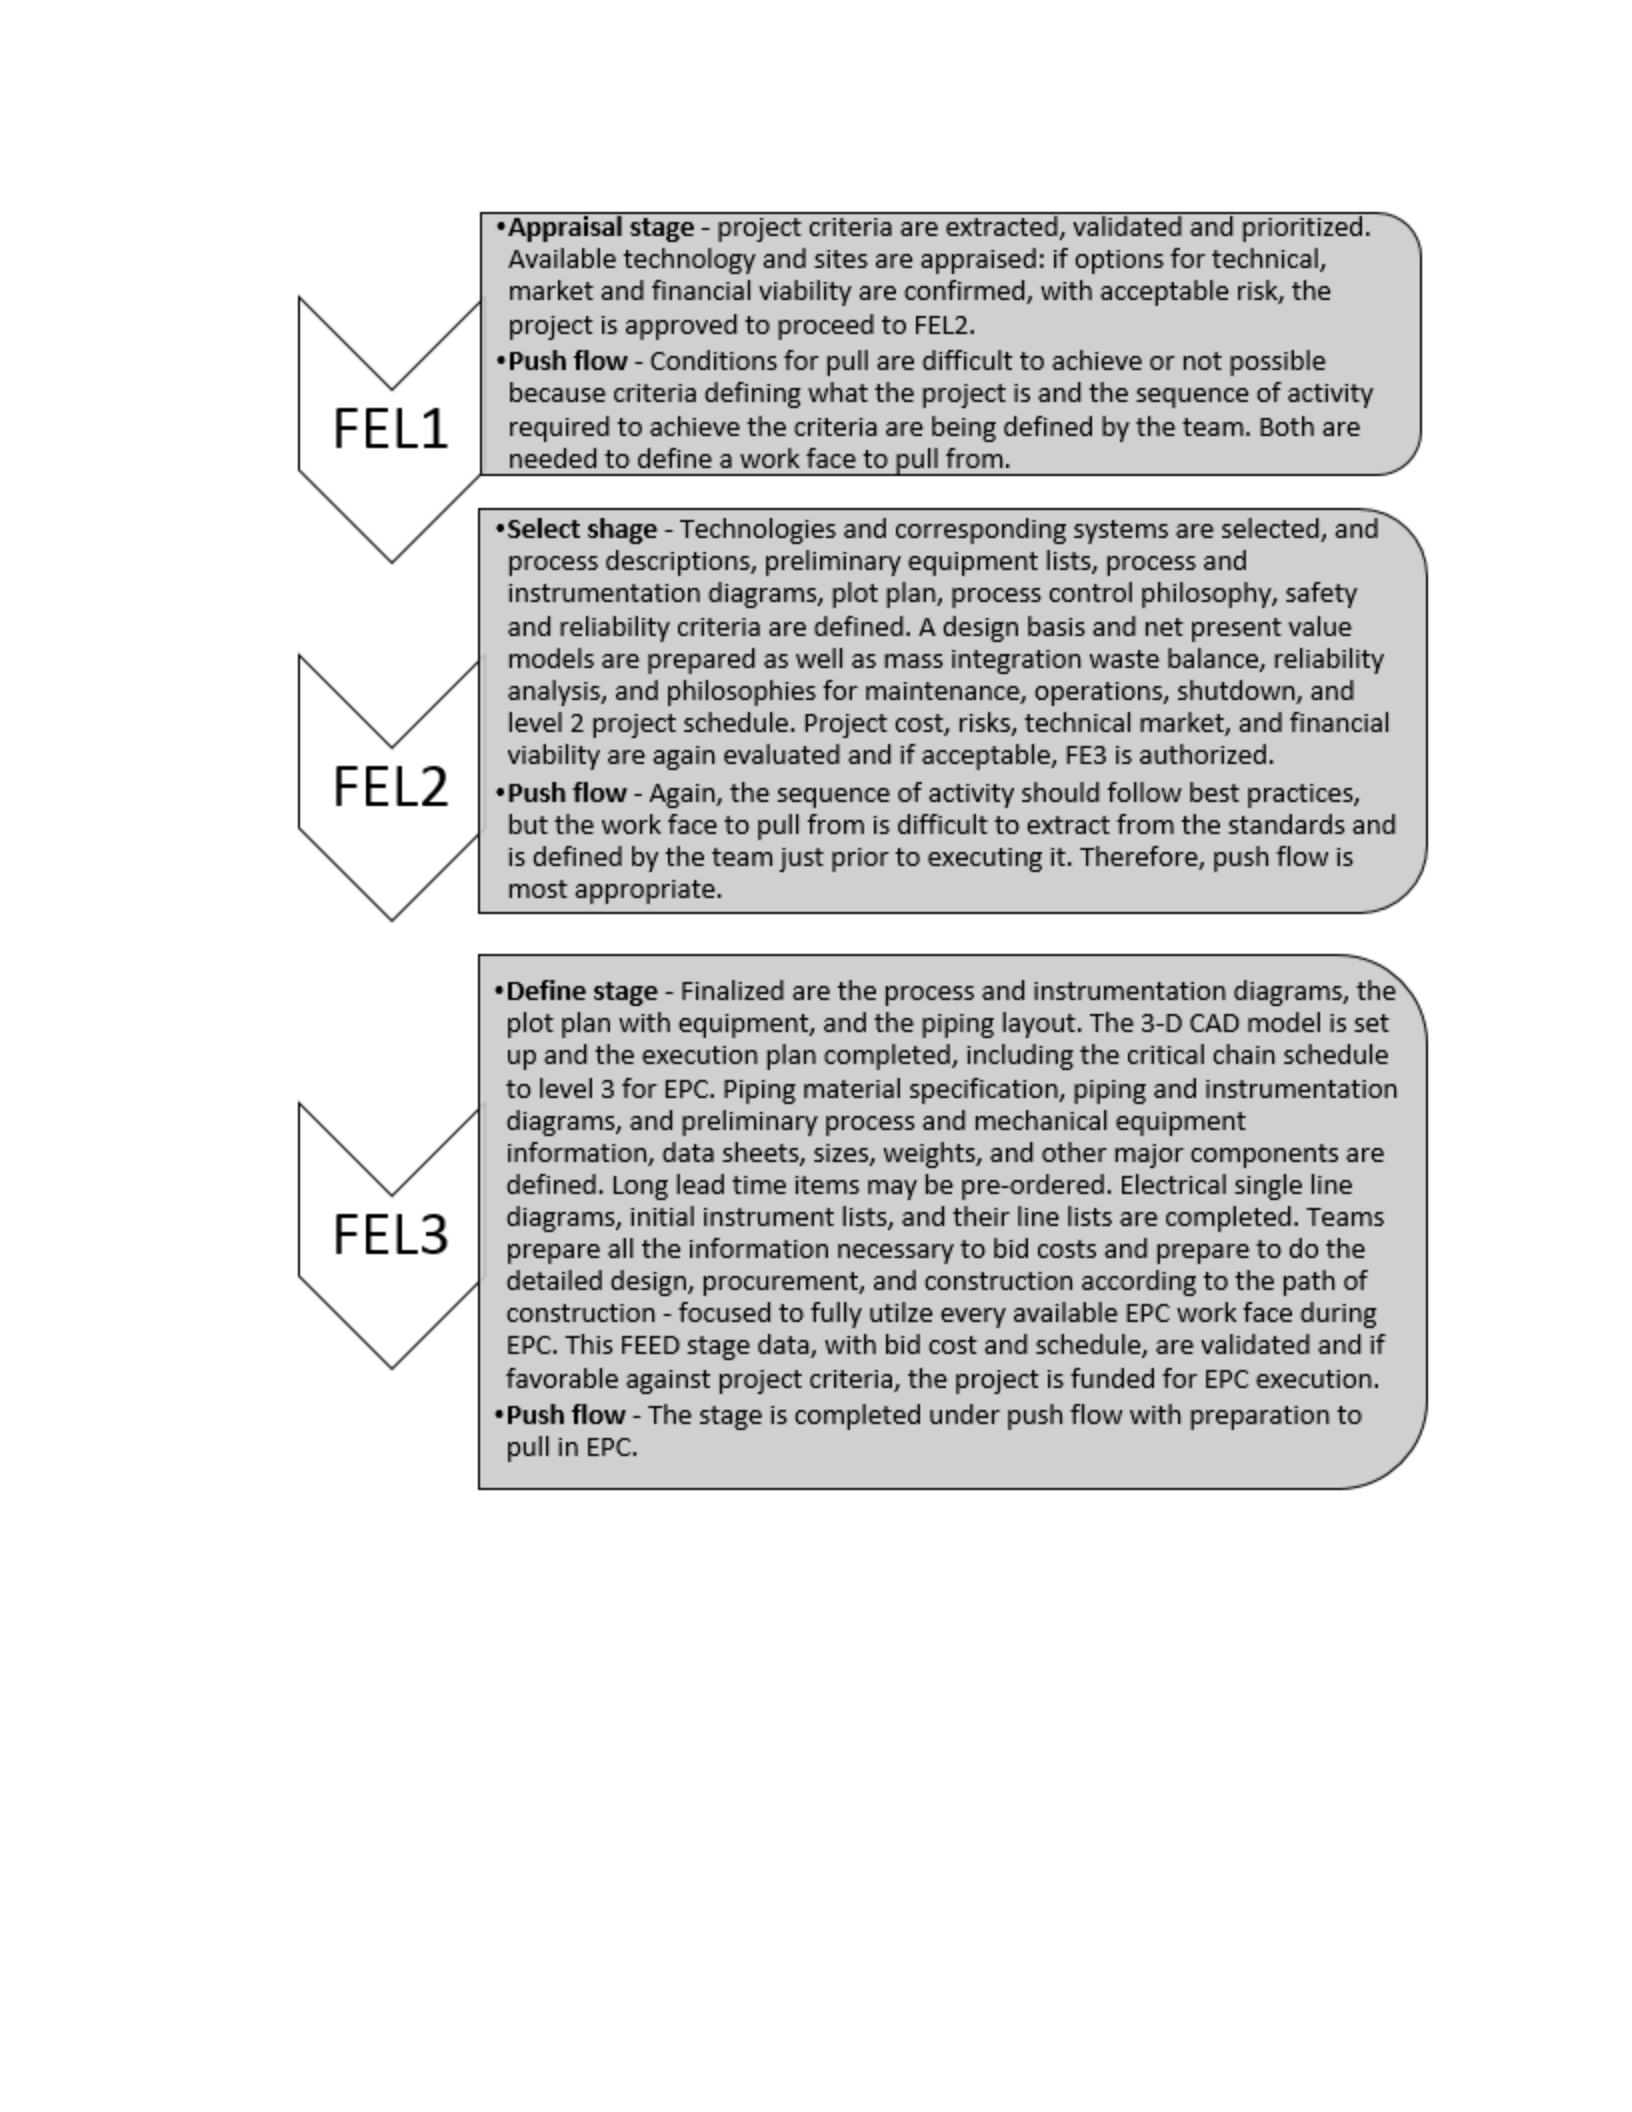
69
Figure 3.2 Front End Loading Stage Description and Flow Control
As shown in the above figure 3.2, front end loading stages are per push approach or push
planning and control. There are three main reasons for this described below.
1. These are stage gated processes so until one process is complete, the next cannot
be started.

70
2. There is no available workface to pull resources. It is mainly based on ideas,
analytical thinking, past data, etc. All the available resources such as skills and past
data are present during this stage and there is no need to pull anything
3. The main resources in the FEL stages are the skills and stakeholders, which are
mostly common in the three stages, and after the completion of one stage, the skills
and stakeholders are transferred to the next stage.
3.4.2.2 Engineering Procurement Construction Commissioning and Start-Up
Per Thomas Terris, traditional control during EPC, based on CPM schedules, is a push
approach with management attempting to control contractors to perform based on
predetermined dates and durations that keep changing. The changes are often due to tasks
that are not well planned or executed, materials, or equipment of subcontractors that is not
available on the committed dates. Traditional management is overwhelmed with the pace
of change in a system which is not designed well to reduce the root causes of change.
Neither are traditional systems flexible to accommodate changes. Traditional schedules
extend, and effective recovery plans are inordinately difficult to derive or implement. The
traditional control is more of a reactive approach which comes into action when processes
go widely off track. For instance, at best, weekly reporting is performed for the progress
of the work. (Weekly reporting is seldom sustained; a monthly or even longer delay is
usual.) Even if weekly reporting were sustainable, this approach for control is not very
effective and must change with a system which is proactive (Personal communication,
Thomas Terris, Jan 17, 2017).
In the proposed model, the engineering, procurement, construction, and commissioning is
done through both push and pull as shown in the figure 3.3. The intent is to attain flow of
just what is needed when it is needed to every available workface so as to complete
construction as fast as possible, with reasonable balancing of resources to optimize cost.
Engineering and procurement will be initially pushed until sufficient work is done during
these stages so that construction can be started and pull flow maintained. The construction
stage is done mostly with pull flow except for the long lead items, which may have been
procured with a pre-determined delivery date and cannot flow per pull planning and control.

71
Nonetheless, if it becomes possible to pull long lead items, this would be more beneficial
and should be implemented. These long lead item installations, under predetermined dates
(push flow) are considered as a milestone. Overall, construction flows in the pull approach
to the milestones, which are established with the push approach because they have pre-
determined dates. Generally, these milestones are the installation of long lead items.
By the completion of FEL 3, all the engineering information must be available to enable
detailed design to proceed according to the path of construction. For example, equipment
and pipe lists should include sizes and weights and frame type. Preliminary weight should
have been determined, and foundation types should have been selected and preliminary
sizes determined sufficiently for estimating hard dollars. Engineering must have everything
they need to define site preparation and do the detailed design from the foundations up. If
this has not been achieved by the end of FEL 3, then construction will usually need to wait
until it has, then engineering can proceed in EPC under push flow control until these
conditions to establish pull flow have been achieved (Robert Patty, personal
communication, Jan 15, 2017).
At the beginning of EPC execution, or as soon as engineering and procurement can begin
and sustain flow following the path of construction, push flow is still used to initially fill
the EPC pull control supermarkets with work task packages (WTPs). Supermarkets are
where detailed design, procurement, preassembly/kitting, and field installation work task
packages are stored before the next process to complete them, as shown below. This
initialization of conditions for pull control is the stage of push-pull interface. It indicates
that engineering and procurement are ahead of construction sufficiently to sustain the flow
once construction begins. A detailed design and procurement process for longest lead time
item has already been initiated. Generally, the longest lead time items are the contractual
milestone, which is a fixed date, and the work progresses to achieve these milestones.
WTPs are needed to ensure that the pre-work is done and completed before the installation
of each long lead item or contractual milestone; workface constraints for the installation of
long lead items are removed. The installation of long lead time items is per push flow;

72
nonetheless, effort should be made to flow the preparatory work for them using the pull
approach.
Under pull control, construction begins at every available workface with WTPs already
fully developed for each available workface. As soon as each WTP is installed, the next
WTP must be waiting and available to begin. Construction will proceed utilizing every
available construction workface. The idea of pull in construction is that field work-task
packaging, procurement, and engineering must keep pace with the actual rate of
construction. Also, the flow system sustains any changes in the construction progress since
construction is vulnerable to change. In such a system, the rate of construction is said to
pull or demand the supporting field work-task packaging process to keep up; the rate of
packaging in turn pulls or demands procurement to keep pace. And procurement pulls or
demands detailed engineering to keep up, all according to the pace of construction (Robert
Patty, personal communication, Jan 15, 2017).
According to Patty and Denton, the effectiveness of pull is to speed up the schedule, reduce
the inventory, reduce the work in process, enhance cash flow, and be more flexible to
change. Except for the project end date and other contractual milestones dates that are
important to the client, all other dates (except for a few long lead items) are removed or
allowed to float according to actual progress. It may be possible for long lead final delivery
dates to float (often to just extend) according to actual progress as well. This means that
procurement does not negotiate a delivery date with suppliers or subcontractors (which
keeps changing under traditional systems). Rather, suppliers are asked, “How long will it
be before you deliver this (or in the case of a subcontractor, how long will it be before you
arrive); do you need to be notified?” In this way, lead times are identified (between release
triggers and product or service delivery) and are negotiated for deliveries and subcontractor
arrival. Activities are established in the schedule to provide such notice that the lead time
agreed upon has arrived, then the deliverable activity is triggered to proceed and the
delivery made by the end of the lead time (Patty and Denton 2010b). Effort is made to
shorten lead times by splitting up the tasks required to achieve final delivery, with shop

73
drawing pre-approval, pre-setup, and first runs before the delivery trigger to ensure that
delivery can be achieved within the duration of the lead time
5
.
Consistent task level preplanning is done for all construction work in field WTPs to
simultaneously achieve all the parameters of performance excellence related to the scope
of the work (safety, quality, cycle time/productivity, duration, environmental protection,
employee morale). Packaging work tasks, procurement tasks, and engineering tasks are
also preplanned to achieve performance excellence.
Flexibility for and transparency of actual progress is provided in this system. Actual
progress of active WTP execution, e.g., field installation, is updated every task time.
Typically, task time is 2 to 4 hours; however, this depends on the type of WTP and can
vary. According to the progress achieved, the schedule is updated weekly or at least
biweekly and made visible to the suppliers and subcontractors so that progress toward their
trigger releases is transparent. This provides the suppliers and subcontractors with the
progress information they need to balance their resources on and off the project. Dates do
not need to be renegotiated each time the schedule changes. Nor is credibility of the
planning degraded by the ebb and flow of the project. Better preplanning and improved
cycle times accelerate the project (albeit, acceleration may be limited by long lead time
delivery dates). Unanticipated problems are quickly observed and resources prioritized to
recover. Team alignment and low variance from planning is achieved and all performance
parameters maintained with schedule and costs reduced. Delays or early completions are
accommodated with optimal progress facilitated.
The level 3 CPM schedule is transformed to a critical chain schedule as described in the
literature review, and activities have dates discernable as of the latest schedule, lead times,
and duration, though most are not fixed and can float. Only the contractual milestone dates
are fixed, some of which typically coincide with long lead time items, and work will be
5
Shortening of lead time is very important; however, it is beyond the scope of this thesis. Patty and Denton
have described the strategies to reduce lead times in chapter 5 of their book, End of Project Overrun.

74
progressed to achieve these milestones. Under pull-flow control, the critical chain schedule
continues to provide the sequence and priority of Level 3 activities or work packages for
the optimal path of construction. This optimal sequence of activities should be according
to the company standards and their best practice sequence. It should be part of the execution
plan and validated by the company and their client management. The 4-week look ahead
schedule is also critical for chain project management where WTPs have dates and duration
discernable from the plan; however, the dates and durations are not fixed and the WTPs
can float in relation to the actual progress.
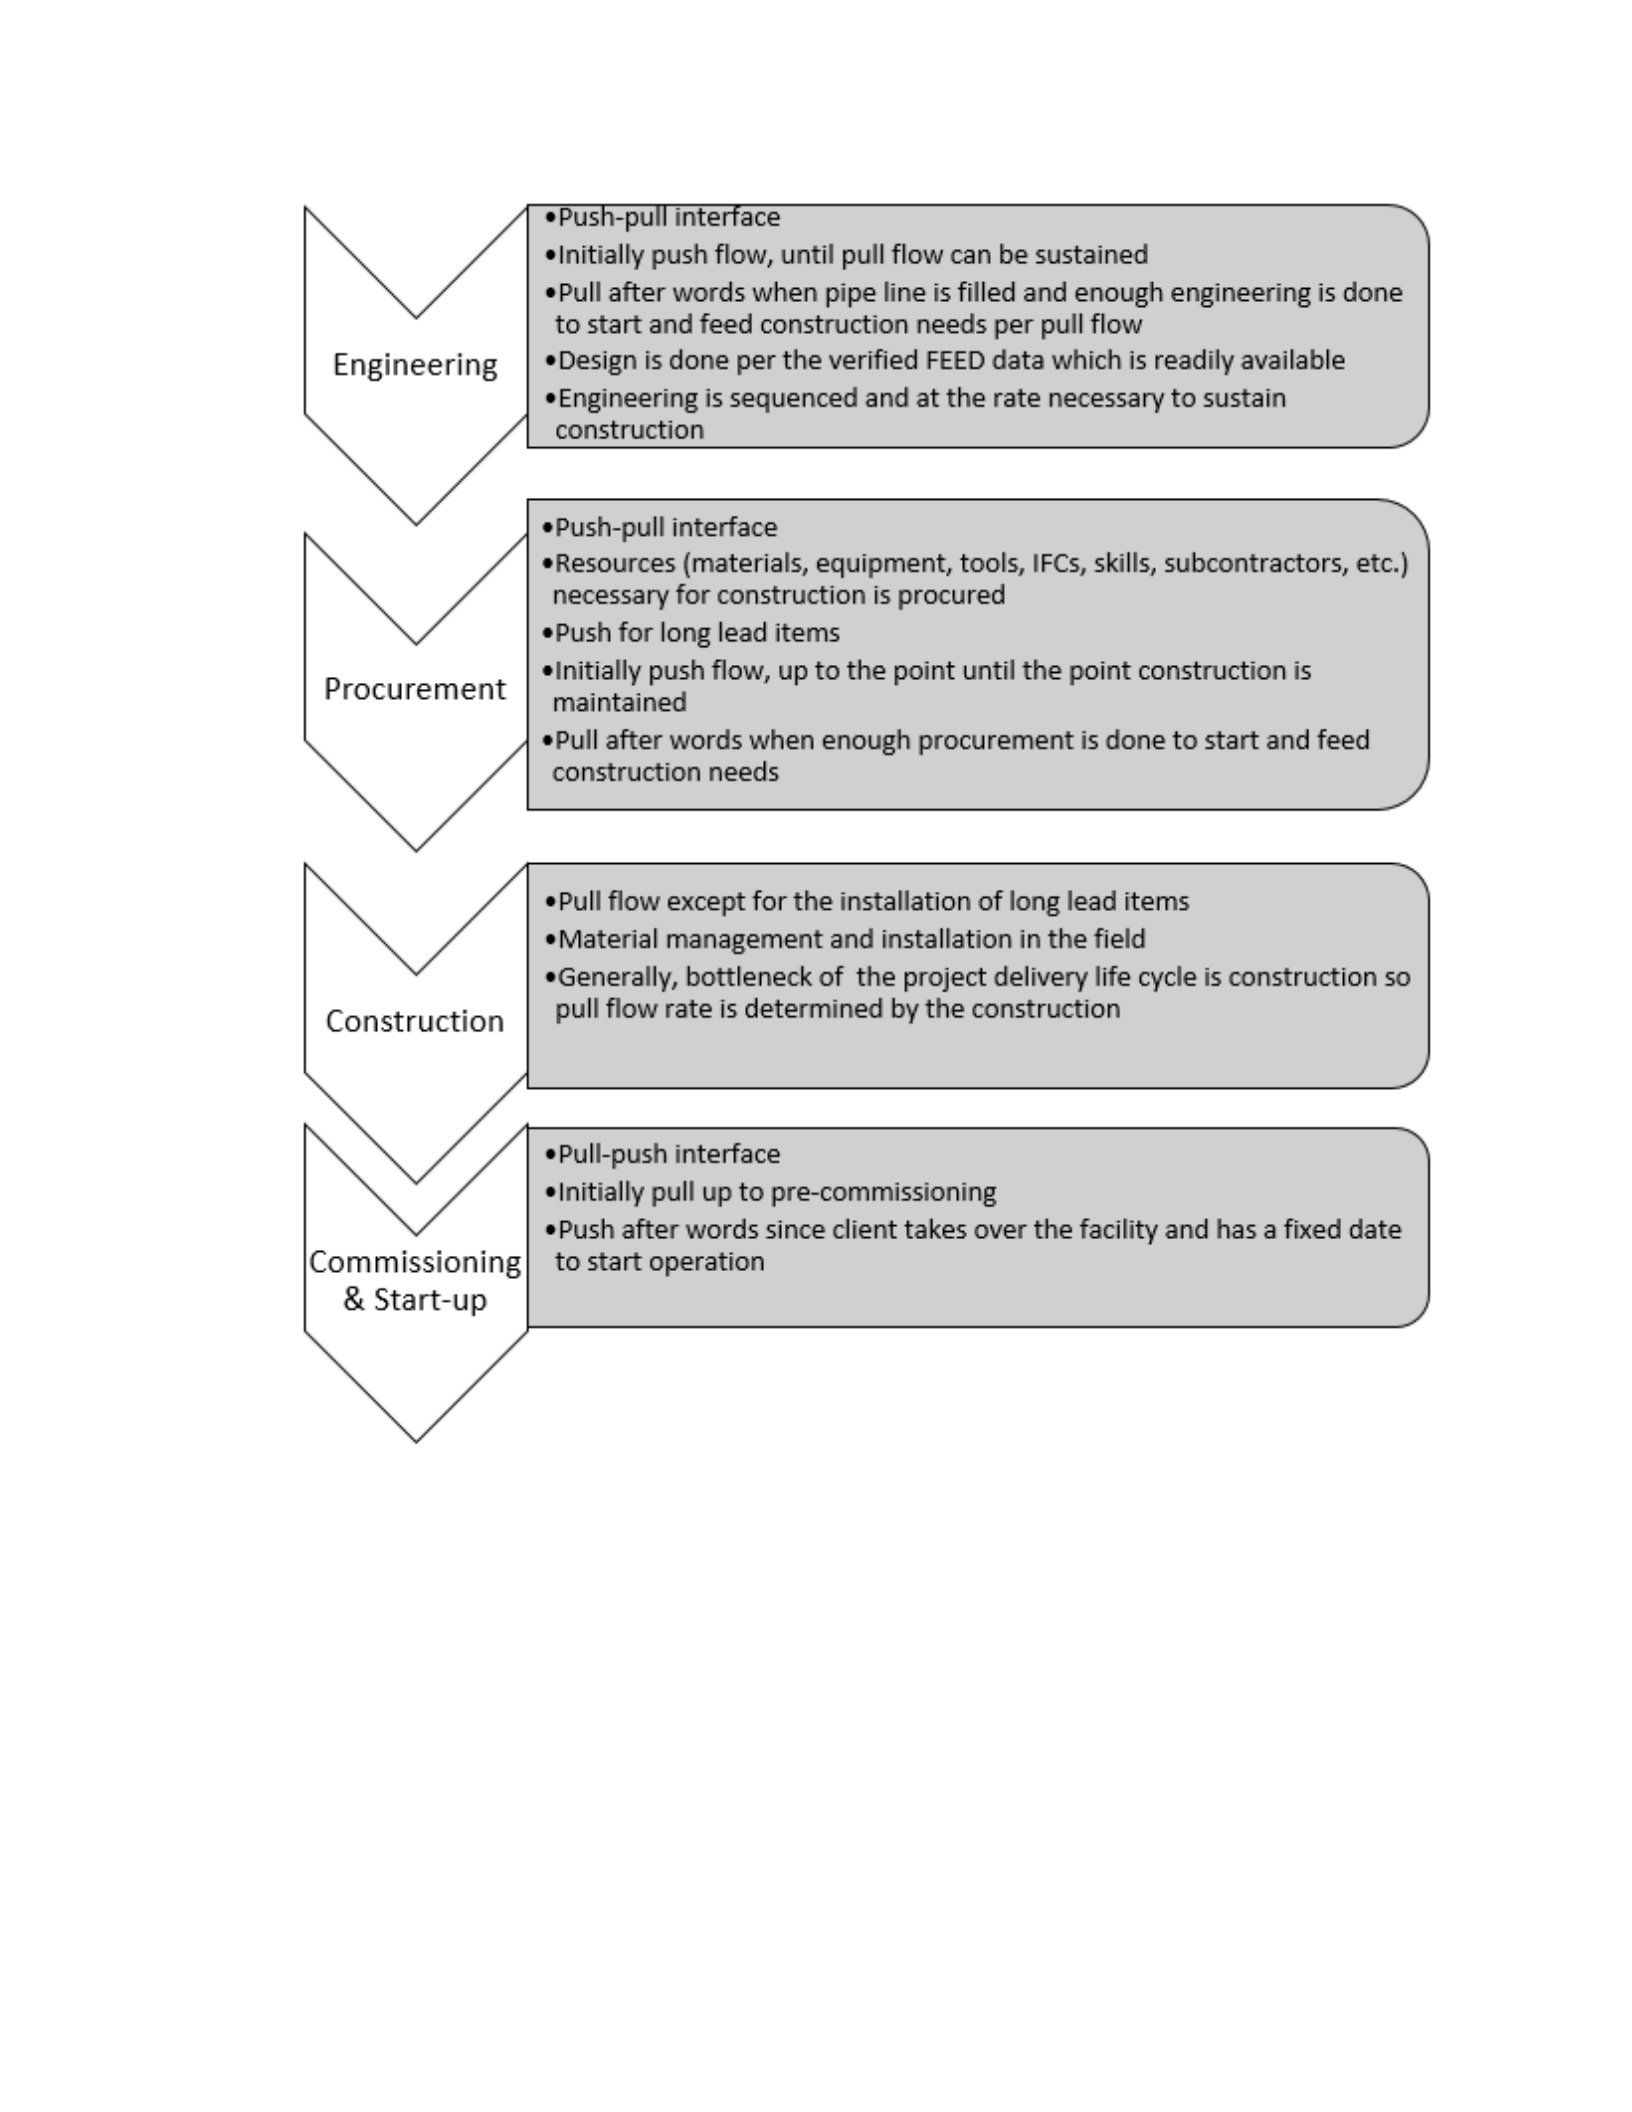
75
Figure 3.3 Execution Stage Flow Control
3.4.3 Life Cycle of WTP
Work task package characteristics are described in detail in the literature review. During
construction, WTPs flow per the pull approach. A very important concept of pull flow is
to have lead times and triggers. Lead time and triggers help provide transparency for the
pull flow control system. Lead time is extracted as early as possible by procurement and
maintained by suppliers and subcontractors. It is negotiated and confirmed with the

76
stakeholders. Long lead time items may have some fixed dates which could serve as the
milestone on the functional contractual schedule.
Lead time varies from project to project and depends on the nature of the project. For
instance, if any project is in an urban location, most lead times would be less as compared
to projects in a remote location. It is necessary to classify lead times into three categories
per the duration of the lead time, as described below:
• Lead times so long that orders are placed during the Front-End Loading Stage
(Dates are established by contract and only the final shipping date is allowed to
shift according to the lead time established and the actual progress of construction.)
• Longer lead time > 90 days (this duration is not fixed and depends on the nature of
the project, e.g. this could be 120 days for a project site in a remote area or 60 days
for a project in an urban area.)
• 4 weeks <medium lead time < 90 days
• Short lead time< 4 weeks (project teams try for almost all lead times at least for
final notice for shipping to be within this time frame)
On the basis of lead time, lookahead planning is decided. As shown in the figure 3.4,
typically, there are three types of lookahead planning: There are 90 to 120 days (3 to 4 per
month) lookahead planning meeting to balance labor and heavy equipment resources in
level 3 activities or level 3 construction work packages (CWP). The CWP is selected from
the updated critical chain schedule contractual needs, planned work face availability, and
logical sequence to achieve the contractual milestones.
Figure 3.4 Typical Look Ahead Planning Horizons

77
In this meeting, the necessary resources (materials, subcontractors, equipment, etc.) and
their lead times and triggers are extracted and the planning done to confirm that the
resources are available. This meeting is attended by the superintendents, concerned general
foremen, scheduler, etc. The 90 to 120 day lookahead meeting should happen every 4
weeks. The resources are triggered on the basis of lead times with some buffer. The level
3 CWPs are placed on the 120 day visual control board as described in the next section.
Sixty (60) days ahead, the level 4 WTPs are extracted and initiated from the level 3 CWPs
already in process on the 120 day visual control board. Various constraints are placed on
the WTP during its development before releasing for inclusion in the 30-day (4 week)
execution plan; WTP is considered as fully developed after these constraints (e.g., actual
delivery, committed but not physically received, completion of a prerequisite task) are
removed by the respective skills and stakeholders. In the next 30 days, these WTPs are
developed and constraints are removed. The WTP is developed according to standards
already built in the organization. The standards are generally built during the process of
Lean/Kaizen as described below in the Lean PCMS model. WTPs with constraints removed
or with prerequisites confirmed for on time completion are put on the 1 week visual control
board as shown below.
The different procedures needed for the installation are placed in the WTP by the general
foreman (who is responsible to plan the WTP). WTP plans created by the general foreman
are verified by the respective stakeholders. The foreman responsible to execute the WTP
will validate everything. Other validation is done according to the governance required to
ensure proper planning. For instance, safety may verify all WTPs when new general
foremen or superintendents join the team. After the consistency of safety planning
excellence is verified, the safety team may randomly verify WTPs from that team unless a
problem is evident. Similarly, the superintendent verifies the installation procedure and
confirms it on 100% of the WTPs of new general foremen, ensure they take into account
best practices, and then randomly verify as long as there is no reason to do otherwise. Not
all the WTP procedures are verified by the stakeholders (superintendent, safety, quality,

78
etc.); only a few are randomly selected by the stakeholders to verify due to the time
constraint associated with 100% validation. The stakeholders may verify any WTPs that
have complex procedures or the general foremen may request the verification of any
specific WTP. If standards do not yet exist for development of some WTPs, a standard
should be developed by the general foreman during WTP development and then validated
in a mini Lean/Kaizen process, which is improvised as needed. Material management
makes sure all the required resources are ready and bags and tags, palletizes, or otherwise
packages it per the WTP requirement. In this, way material management removes the
constraint on resources.
The WTPs are developed in the period of 30 days before they need to be executed and are
placed in the supermarket when ready for the next phase (e.g., engineering tasks complete
and ready for procurement). During the 4-week lookahead meeting, the fully developed
WTPs are sequenced in the 4-week look ahead visual control board as described in the next
section.
During the one-week lookahead meeting, WTPs need to be installed next week are released
at the workface and all the resources are placed at the workface.
During the installation week, WTP is installed.
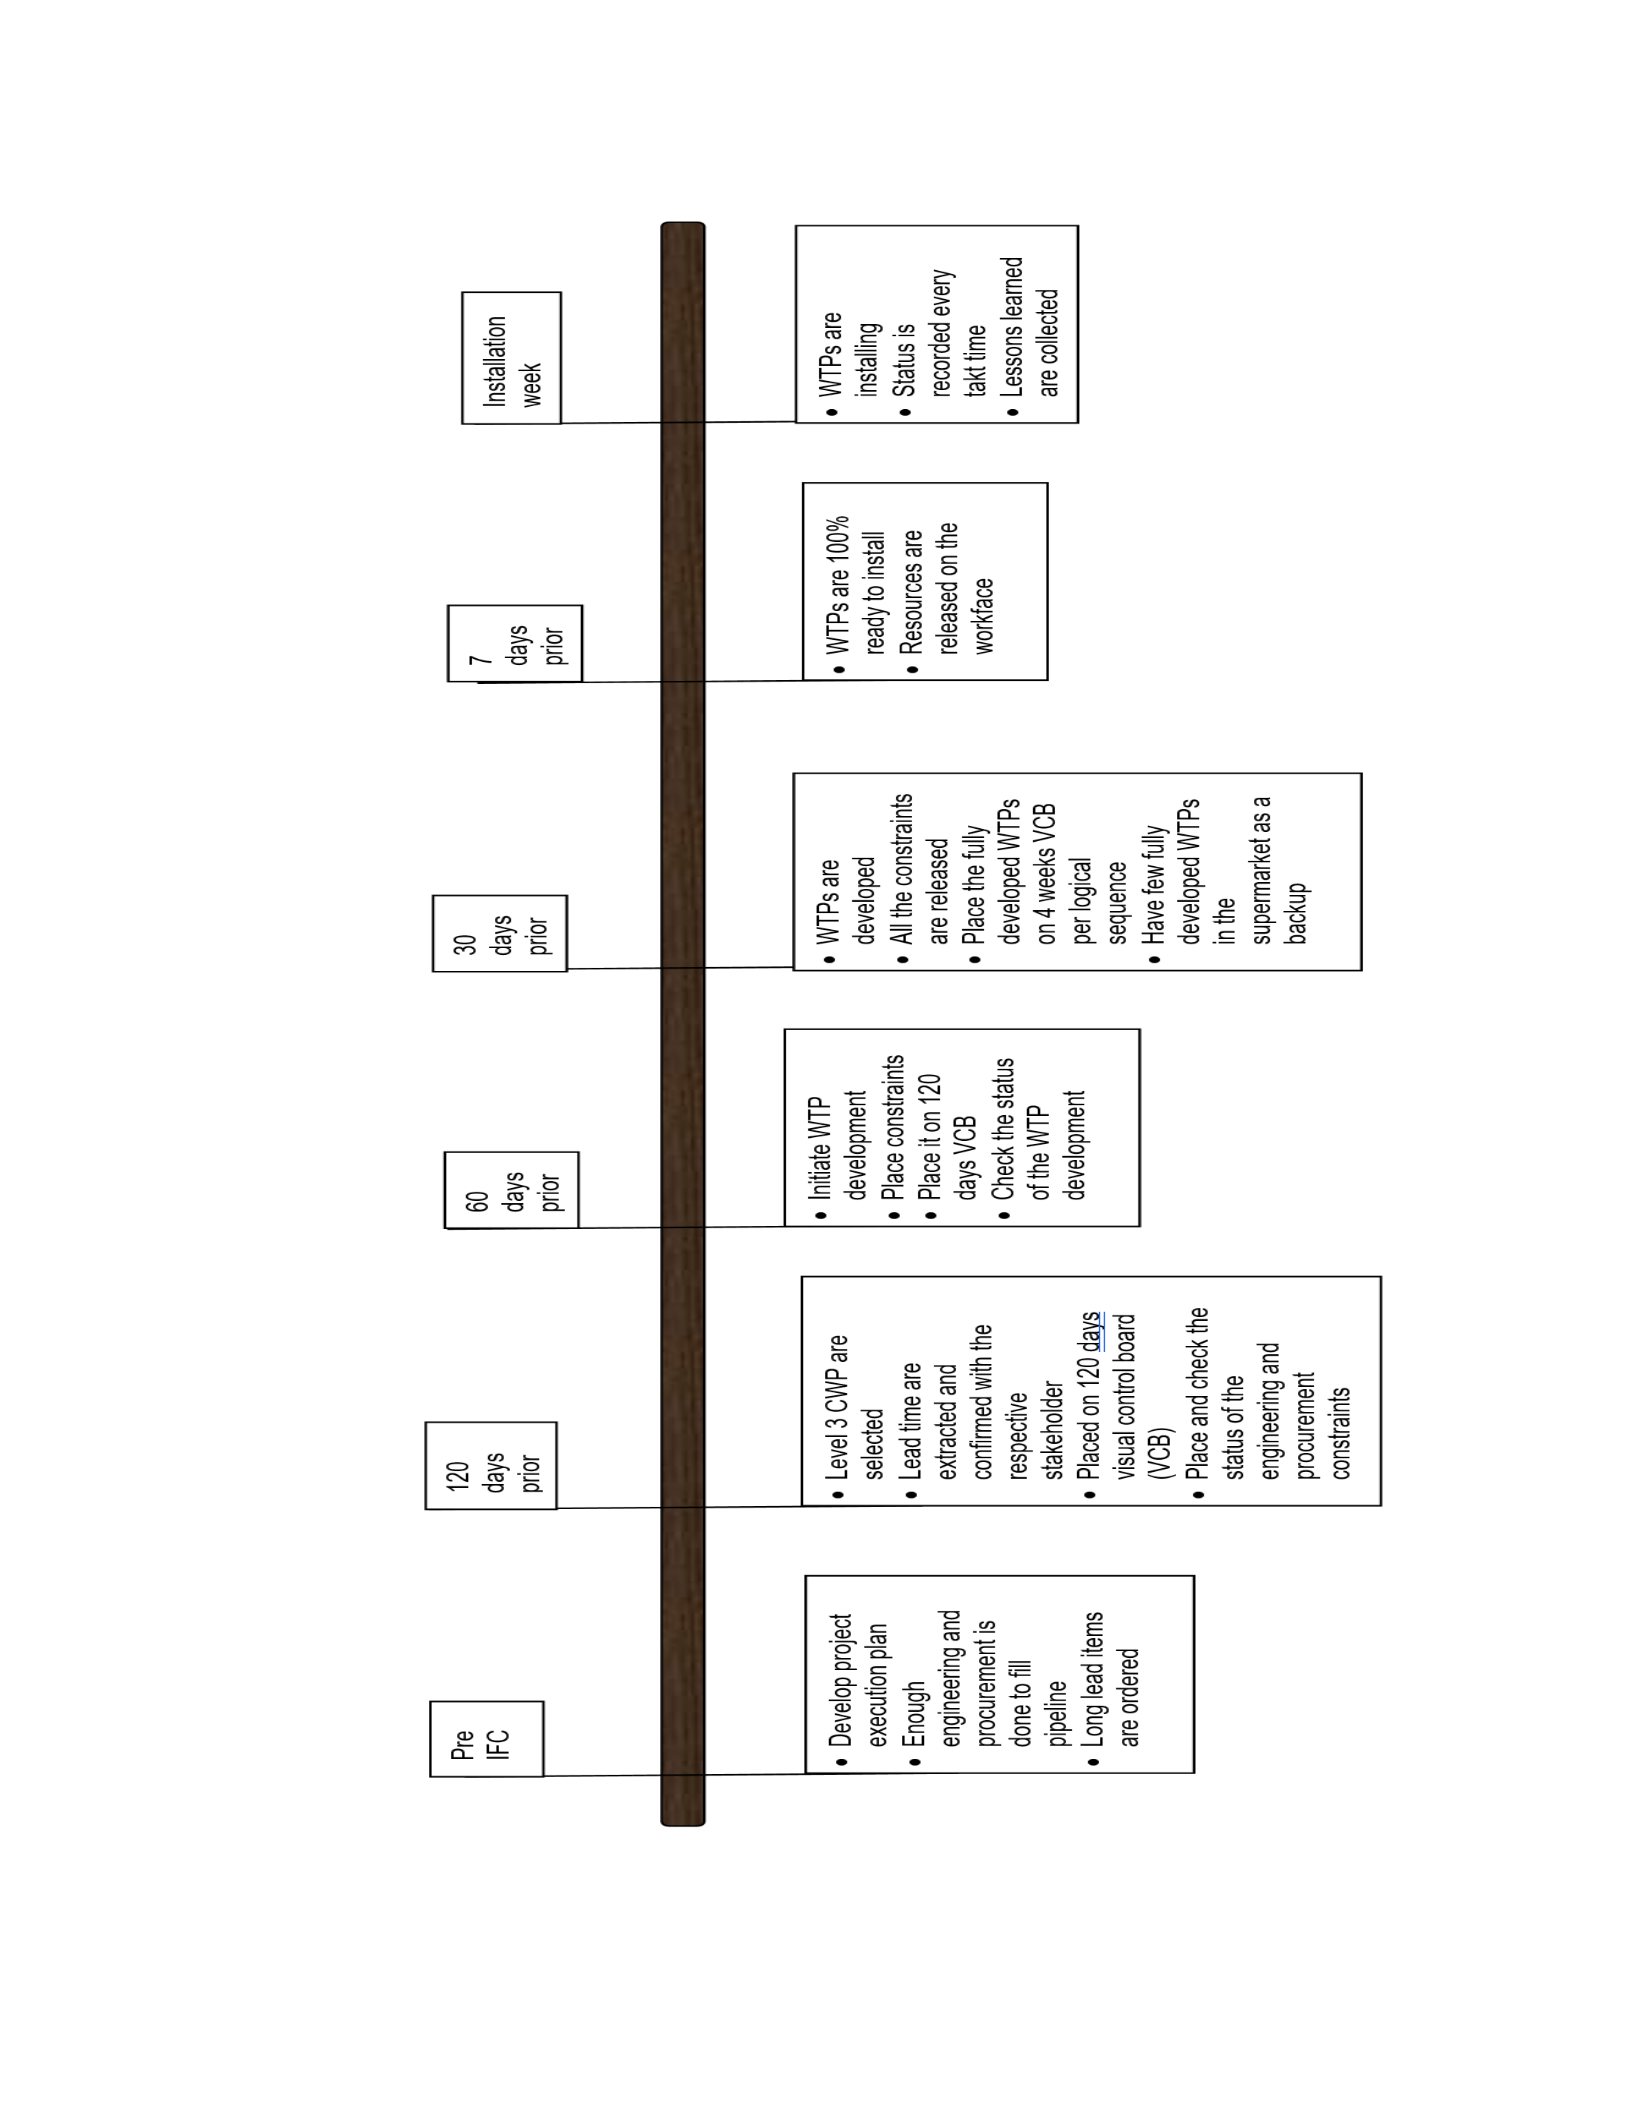
pajoa|joo
ale
paues|
SUOSse7]
«
SW}
YE}
Alana
papiooal
S|
Sn}EIg
«
Hulyjeysul
ale
SIM
°
BOE)
IOM
aU}
UO
paseajal
ale
sainosayy
«
[Jeysul
0}
Apeal
00)
SE
SdIM
*
yaam
UONe||e\SU|
dnyoeq
B
se
jayleuuadns
34}
Ul
SdLM
pedojanap
Alin}
Ma}
BABY
aouanbas
jeal6o|
Jad
AOA
S¥99M
p UO
Sd
LM
pedojsnap
Any
au)
aae|q
pasea|al
ale
SJUIEJSUOD
SU}
II
padojaaap
ale
SqIM
®
Joud
sAep
juawdojaaap
dM
at
Jo
SNJeIS ay]
YOOUD
GOA
sep
OZ}
UO}!
BdB|q
«
SJUIENSUOO
BOB
juawdojaaap
ALM
Seu)
sjule}suoo
juawainooud
pue
Buesulbue
uj
JO
snje}s
AU]
YORYO
PUP
2B
|
(0A)
pe0q
jo.juOO
jensiA
SACP
(Z|,
UO
pade|q
Japjoyayeys
anqoedsel
OU}
URIM
PAU
YUOo
pue
payaesxa
ale
all
pes]
pajdejas
ale
dMND
¢
[Ae]
«
palapo
ale
swe}!
pea|
Huo]
«
auljedid
ly
0}
up
S|
Juaweaunoold
pue
Bueaulbua
yBnouy
«
uejd
uoynoaxe
yoatoid
dojanaq
«
Joud
shep
0¢
Joud
shep
09
Joud
shep
02}
ddl
ald
79
Figure 3.5 Preparation for and Life Cycle of WTP

80
3.4.4 Visual Control and Mistake Proofing
This model heavily relies on Patty Denton’s description of the concepts of visual control.
Visual control enables a flow control system, which provides real time control and
maintains flow by making the flow of level 3 CWPs and level 4 WTPs apparent to each
level of the organization. It provides a proactive approach and has a real-time control to
the flow.
The principle of visual control is to make things visually obvious. It is proposed to enable
visual control to monitor and control the real-time progress of WTP development and
installation. Proposed is a visual control board where WTP’s progress is monitored through
color coding. This idea comes from the Andon lights and flow control board concepts
described by Patty, et. al. The intention is to real time control the flow of CWPs and WTPs
development, sequence, and installation, which supports and enables pull flow control.
Now if some mistake or error happens during the flow, mistake proofing is carried out.
However, if mistake proofing cannot be carried out for valid reason, the error must be noted
in the lessons learned so that mistake proofing will be done after the project ends during
the Kaizen process. At the time, mistake proofing is improvised on a small scale. Mistake
proofing eliminates future variabilities and thus provides a proactive control.
3.4.4.1 Visual Control Board (VCB)
Visual control is performed through a visual control board. CWPs and WTPs are monitored
and controlled throughout their individual life cycle. The VCB is at each level of the
organization and renders the real-time status of the CWP and WTP to its owner and
stakeholders. For instance, general foremen have VCB at the discipline/craft level, and the
superintendents have a different VCB at their system level displaying what they need to
know including the provision for drill down to the Craft Level VCB when needed.
Managers have a different VCB at the area level specific to their area of responsibility, and
project managers have a VCB at project level and have access by drill down to all the visual
control boards. Similarly, material management, safety, procurement, engineering, quality,
etc., have VCB per their ownership, scope, and boundary of the work.

81
3.4.4.2 Color Coding of the VCB
Red indicates that WTP or CWP has problems and will experience delays. For instance,
lead time will be late as confirmed by the respective stakeholders. Red packages need the
attention of the supervisor. Supervisors must involve other stakeholders and fix the
problem concurrently. Immediate action should be taken to recover the delays and correct
any errors. Root cause analysis is performed for the WTPs and CWPs, which has turned
red. The reason for the delay is noted down in lessons learned so that it could be mistake
proofed and incorporated in the standards during the Lean/Kaizen process. Red packages
that are finally completed can only be validated as being complete by the superintendent
after the lessons learned are collected. In this way, it makes lessons learned necessary for
any CWP or WTP that has turned red or could not be completed as planned.
Yellow indicates that the team executing a WTP or CWP is struggling, but believes they
will resolve the concerns and still achieve their package completion in the duration as
planned. For instance, progress for a WTP is not per the planned rate, and the team has
asked for and received additional resources and are working to catch up. During installation
week, it indicates that the team is experiencing problems but have determined a solution;
in the opinion of the task lead, WTP will not result in the team being late delivering their
completed task. For such a work task package, the need to collect lessons learned by
management to avoid future recurrence is evaluated.
Green indicates that the condition of the WTPs and their summary representation in CWPs
are excellent. For instance, during installation week, green indicates that particular WTPs
are on time and in the opinion of the task lead work task package will be completed on or
ahead of the duration committed by the task lead as mentioned in the package.
Blue indicates emergency. Here, the emergency and project manager must be involved.
Examples are an existing crane breakdown, a safety incident, or near miss above the level
of a minor first aid accident, etc.
Transparent or no color indicates there is no WTP for the particular discipline foreman.
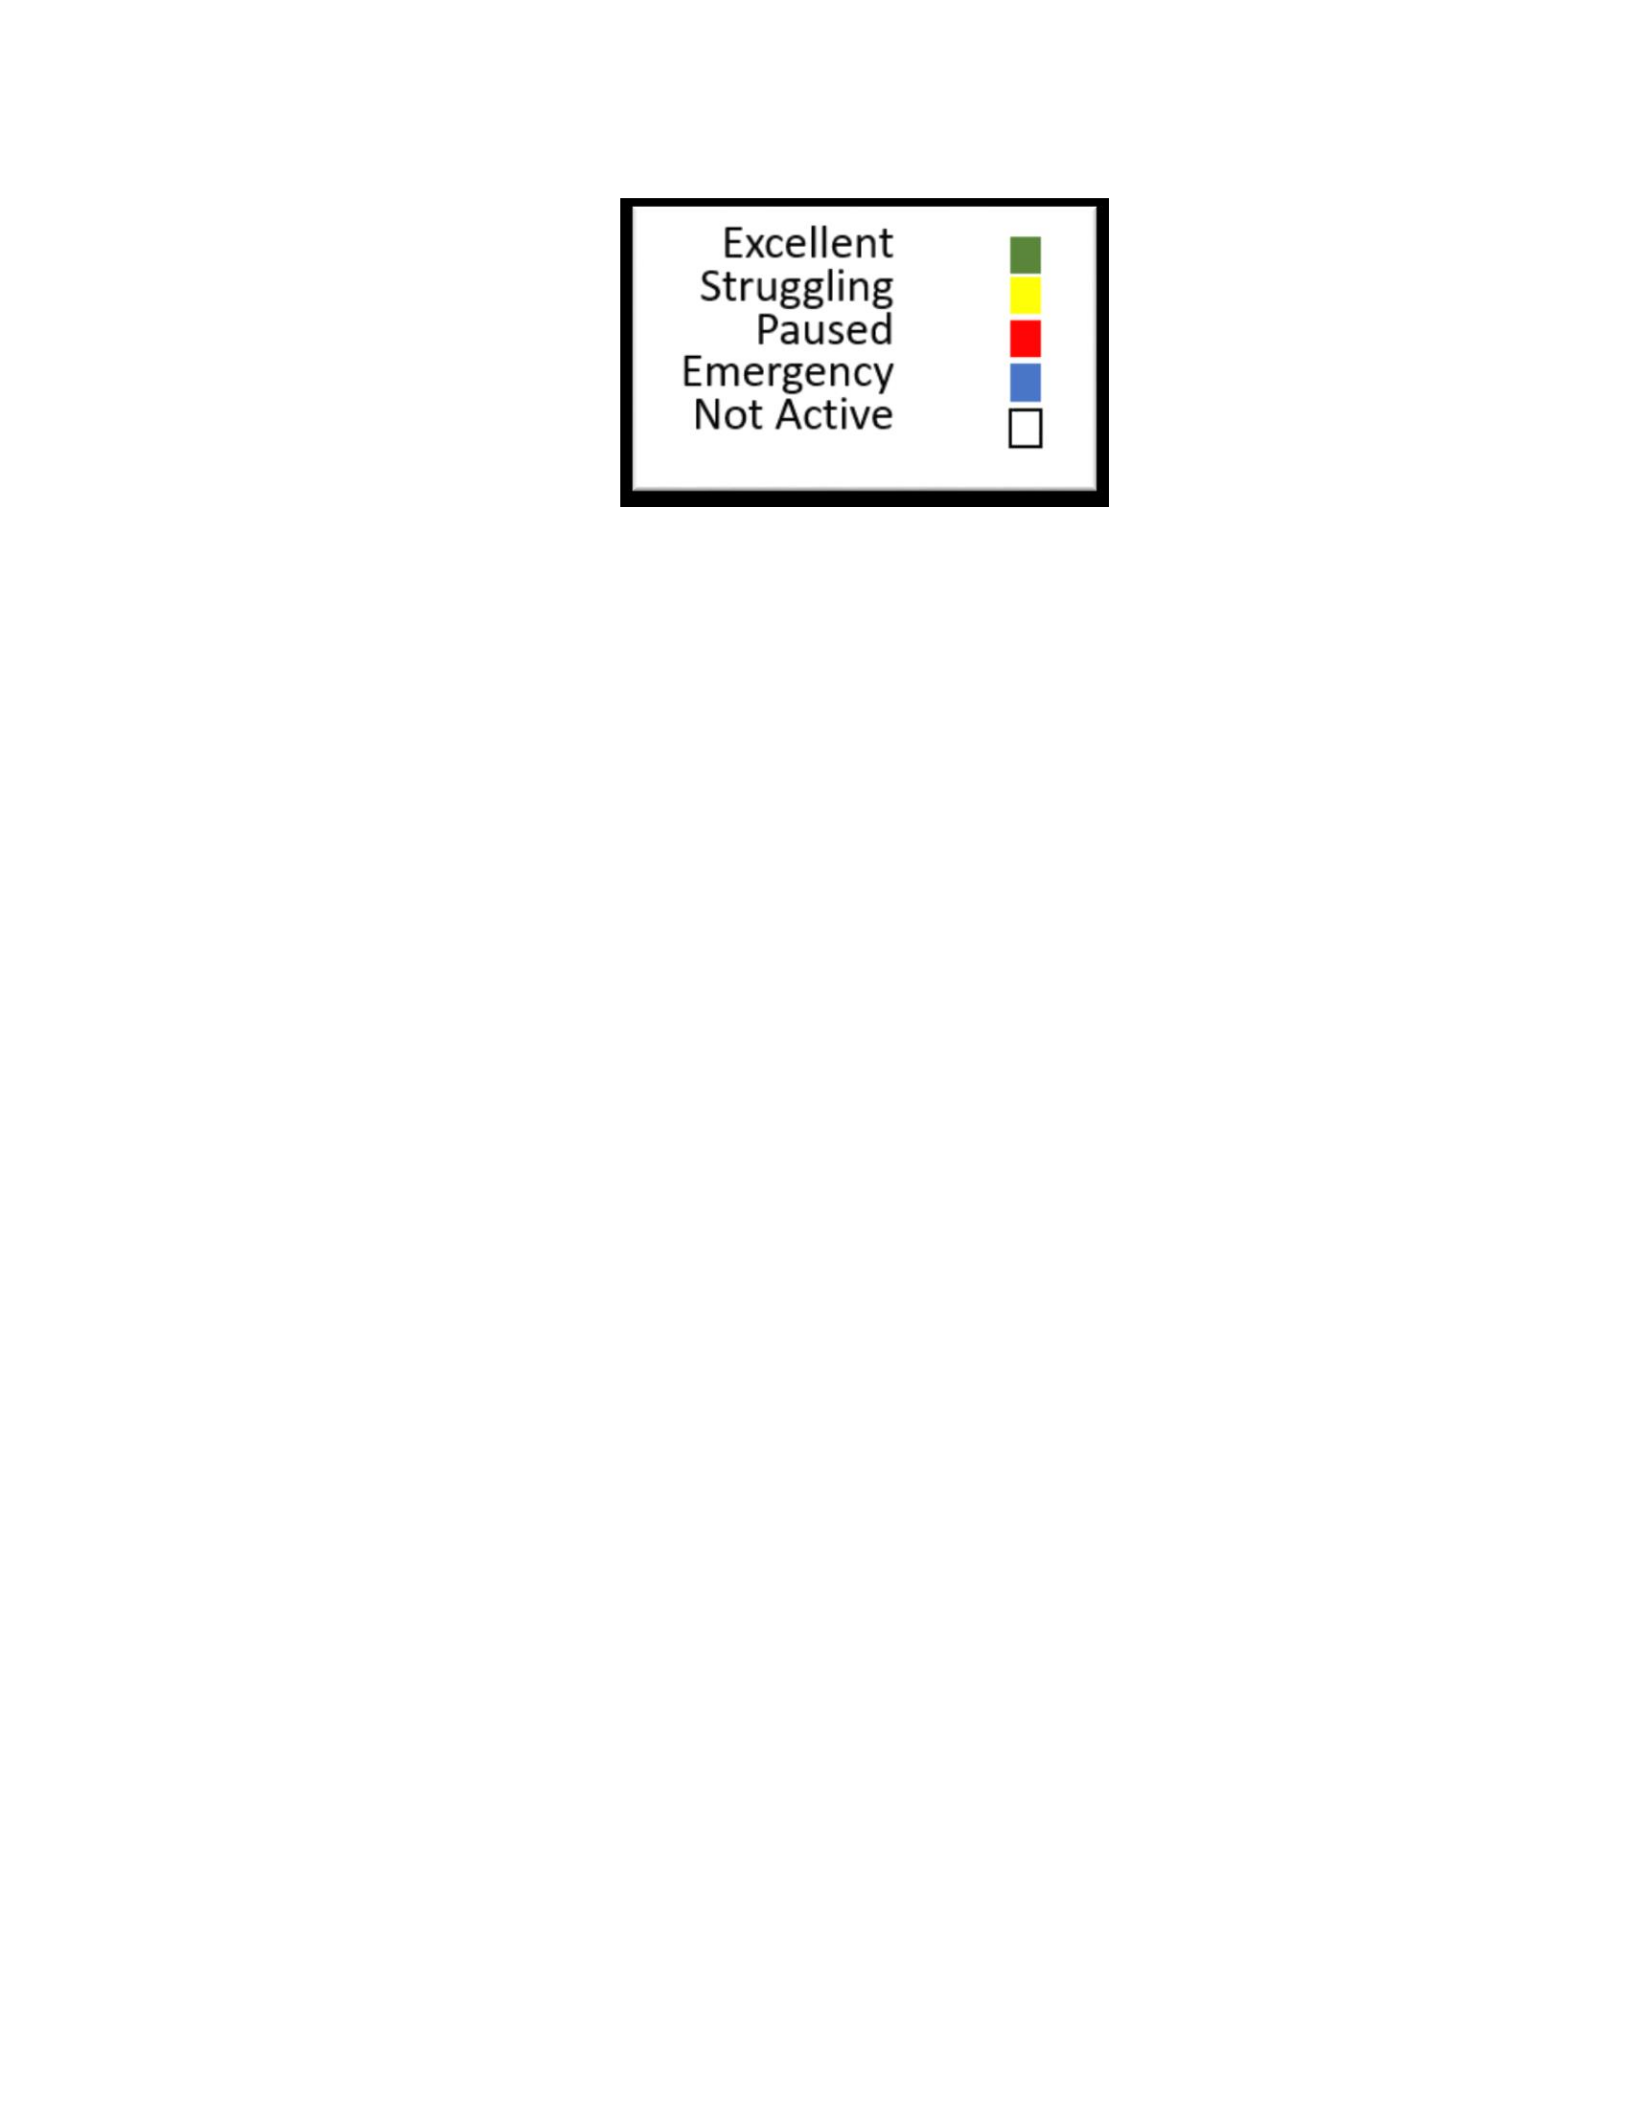
82
Figure 3.6 The Meaning of Andon Colors in Visual Control Boards
3.4.4.3 VCB at Each Level of the Project Management Team with the Life Cycle of
WTP
There are Visual Control Boards (VCBs) at each level of the project management team
from project manager level to the general foreman with their own VCB. The VCB at each
level of the project is described below.
3.4.4.3.1 Project Level or Project Manager Level
Project managers (PM) and superintendents have access to the project level visual control
board. Here the project is broken down into areas. Figure 3.7 & 3.8 - Project Level visual
control board below is an example of an LNG project which is divided into six areas
displayed in different colors. The project manager has access to all VCBs at each level of
the project. For instance, in the displayed project level VCB, area 2 is blue during
installation week, which indicates that there is an emergency at Area 2. The PM can access
“area 2 VCB” by clicking on the blue area 2 button. By accessing “area 2 VCB,” the PM
knows which exact system has an emergency and can access the particular “system VCB”
which, in this example, is system 3, etc. Finally, the PM can know the exact WTP or CWP
in an emergency situation. In this way, the project manager has access to the status of each
area, system, discipline, CWP, and WTP in the project or access to all the VCBs in the
project. This system can also be expanded at the program level.
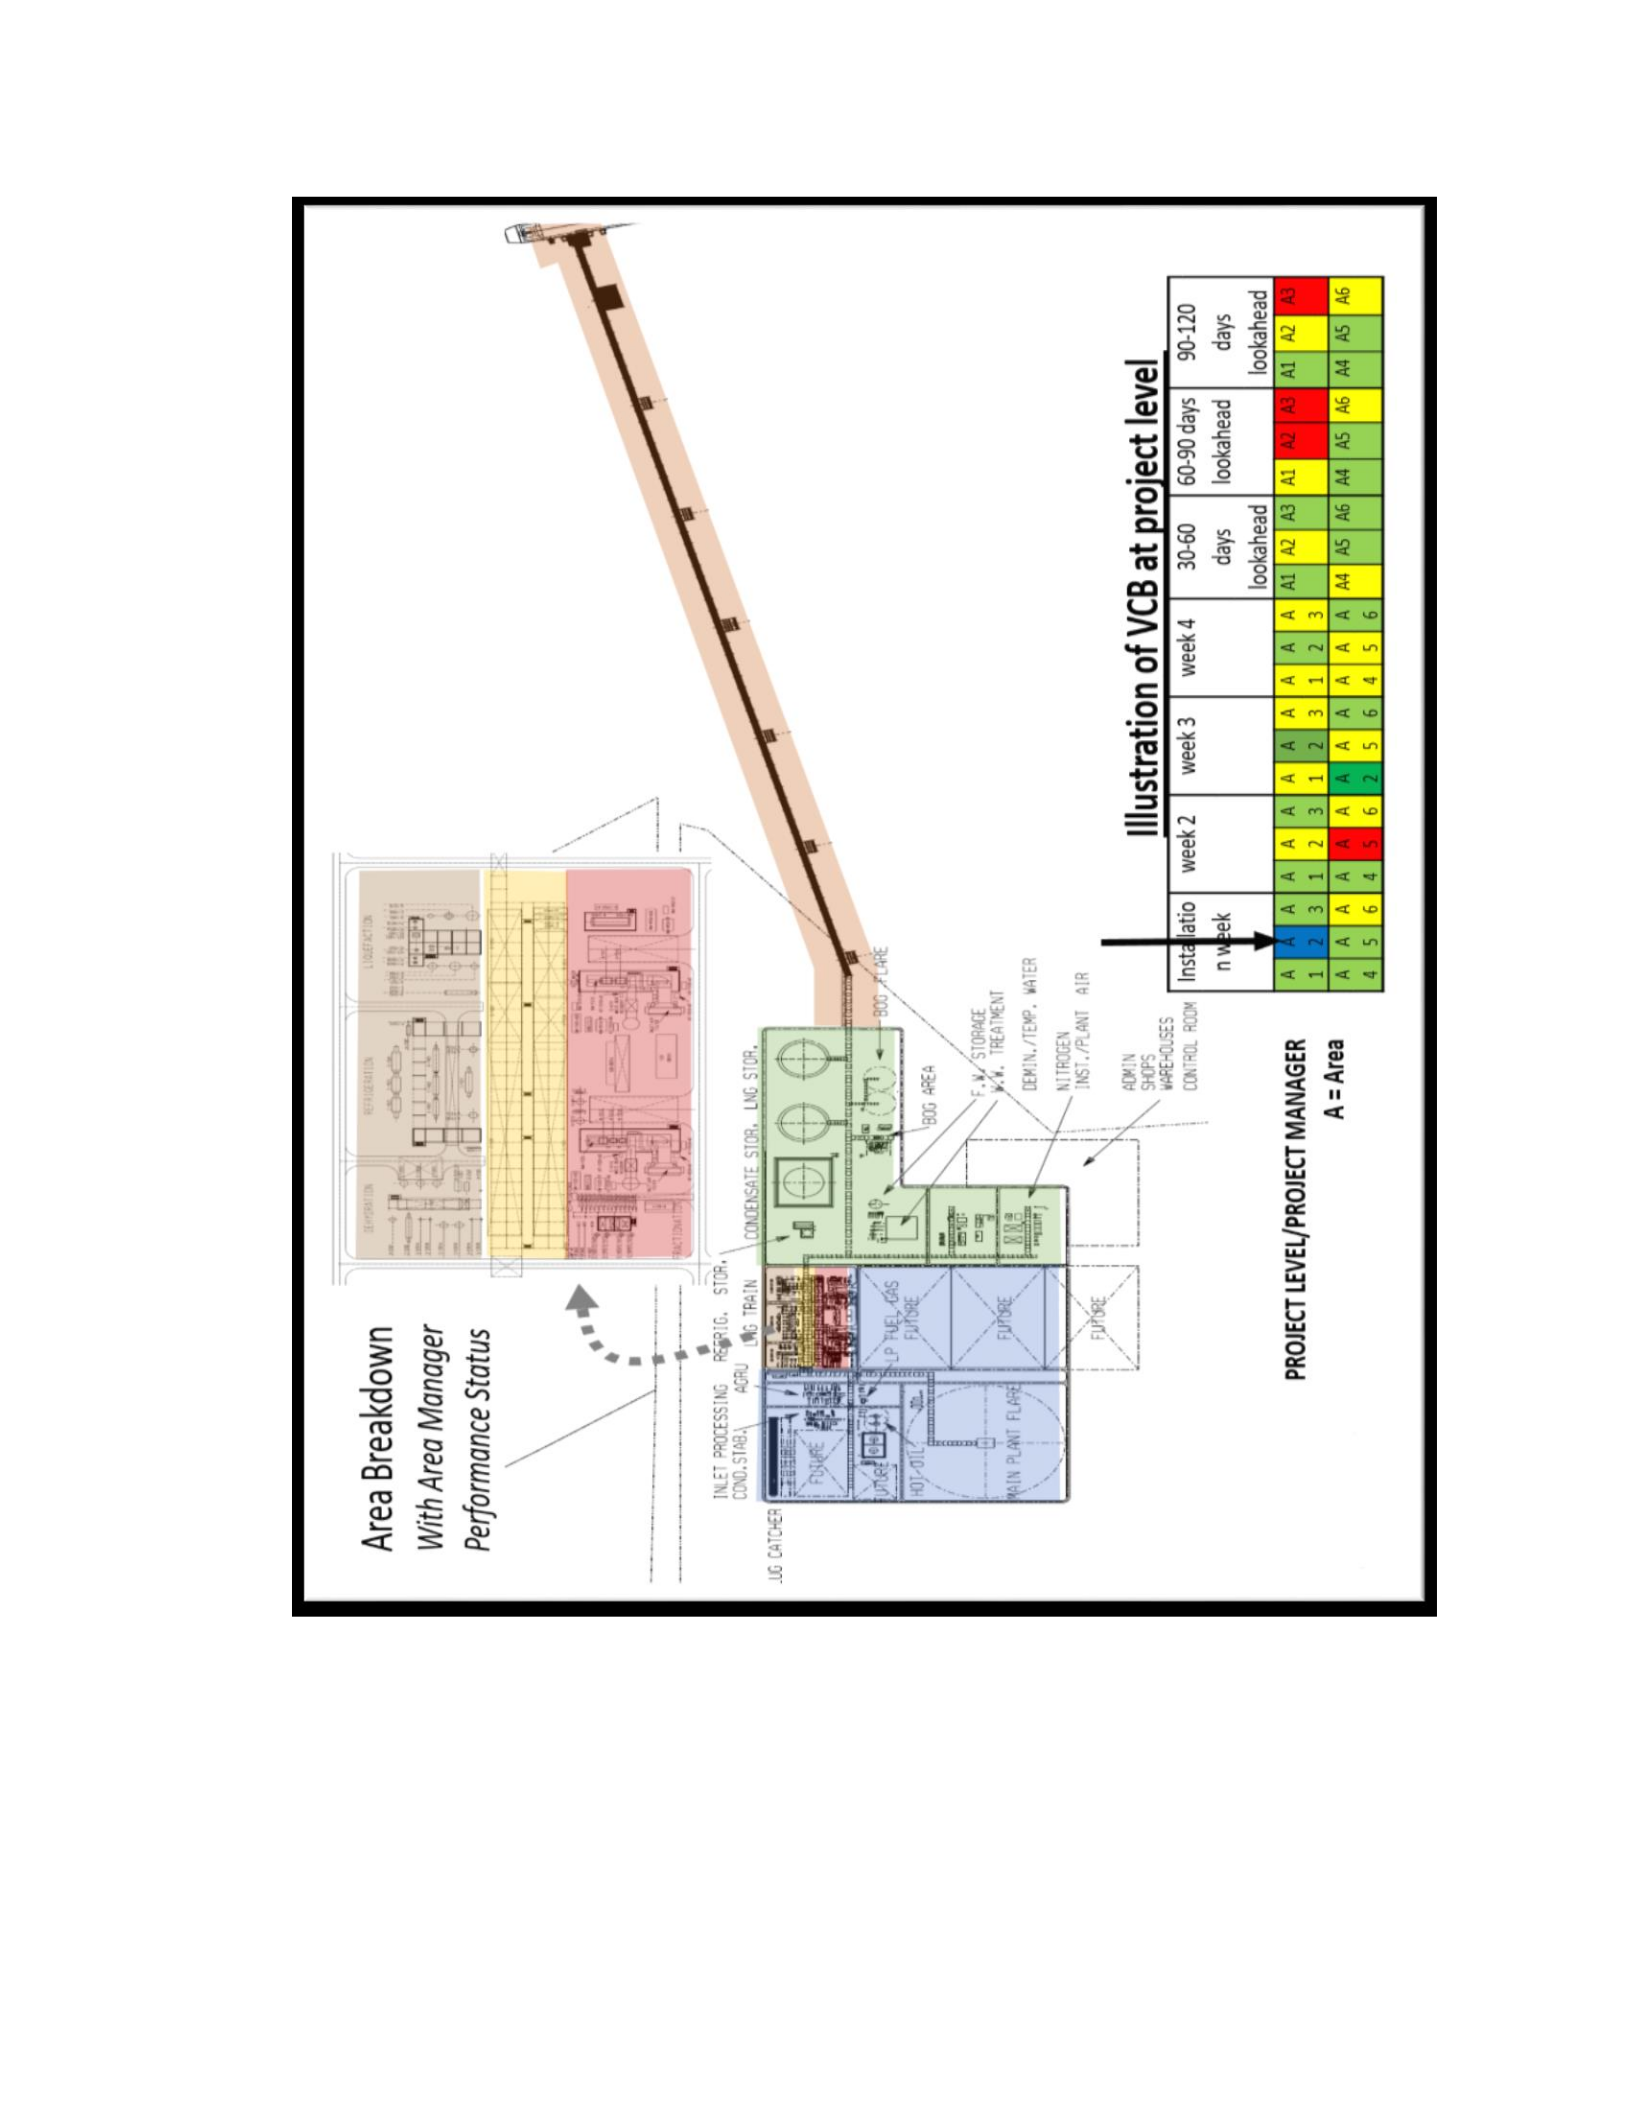
83
Figure 3.7 Representation of an LNG project divided into respective areas along with
Project Level VCB

84
Figure 3.8 VCB at the Project level or Project Manager Level
3.4.4.3.2 Area Level or Area Manager Level
There is VCB control at the area level, which shows the status of each system within the
area. The area manager can access all the VCBs within the area just as the project manager
can do this within the project, meaning that the area manager can know the status of each
system, discipline, and WTP in the area.
A) Area 2 VCB expanded version
Figure 3.9 Area 2 with VCB
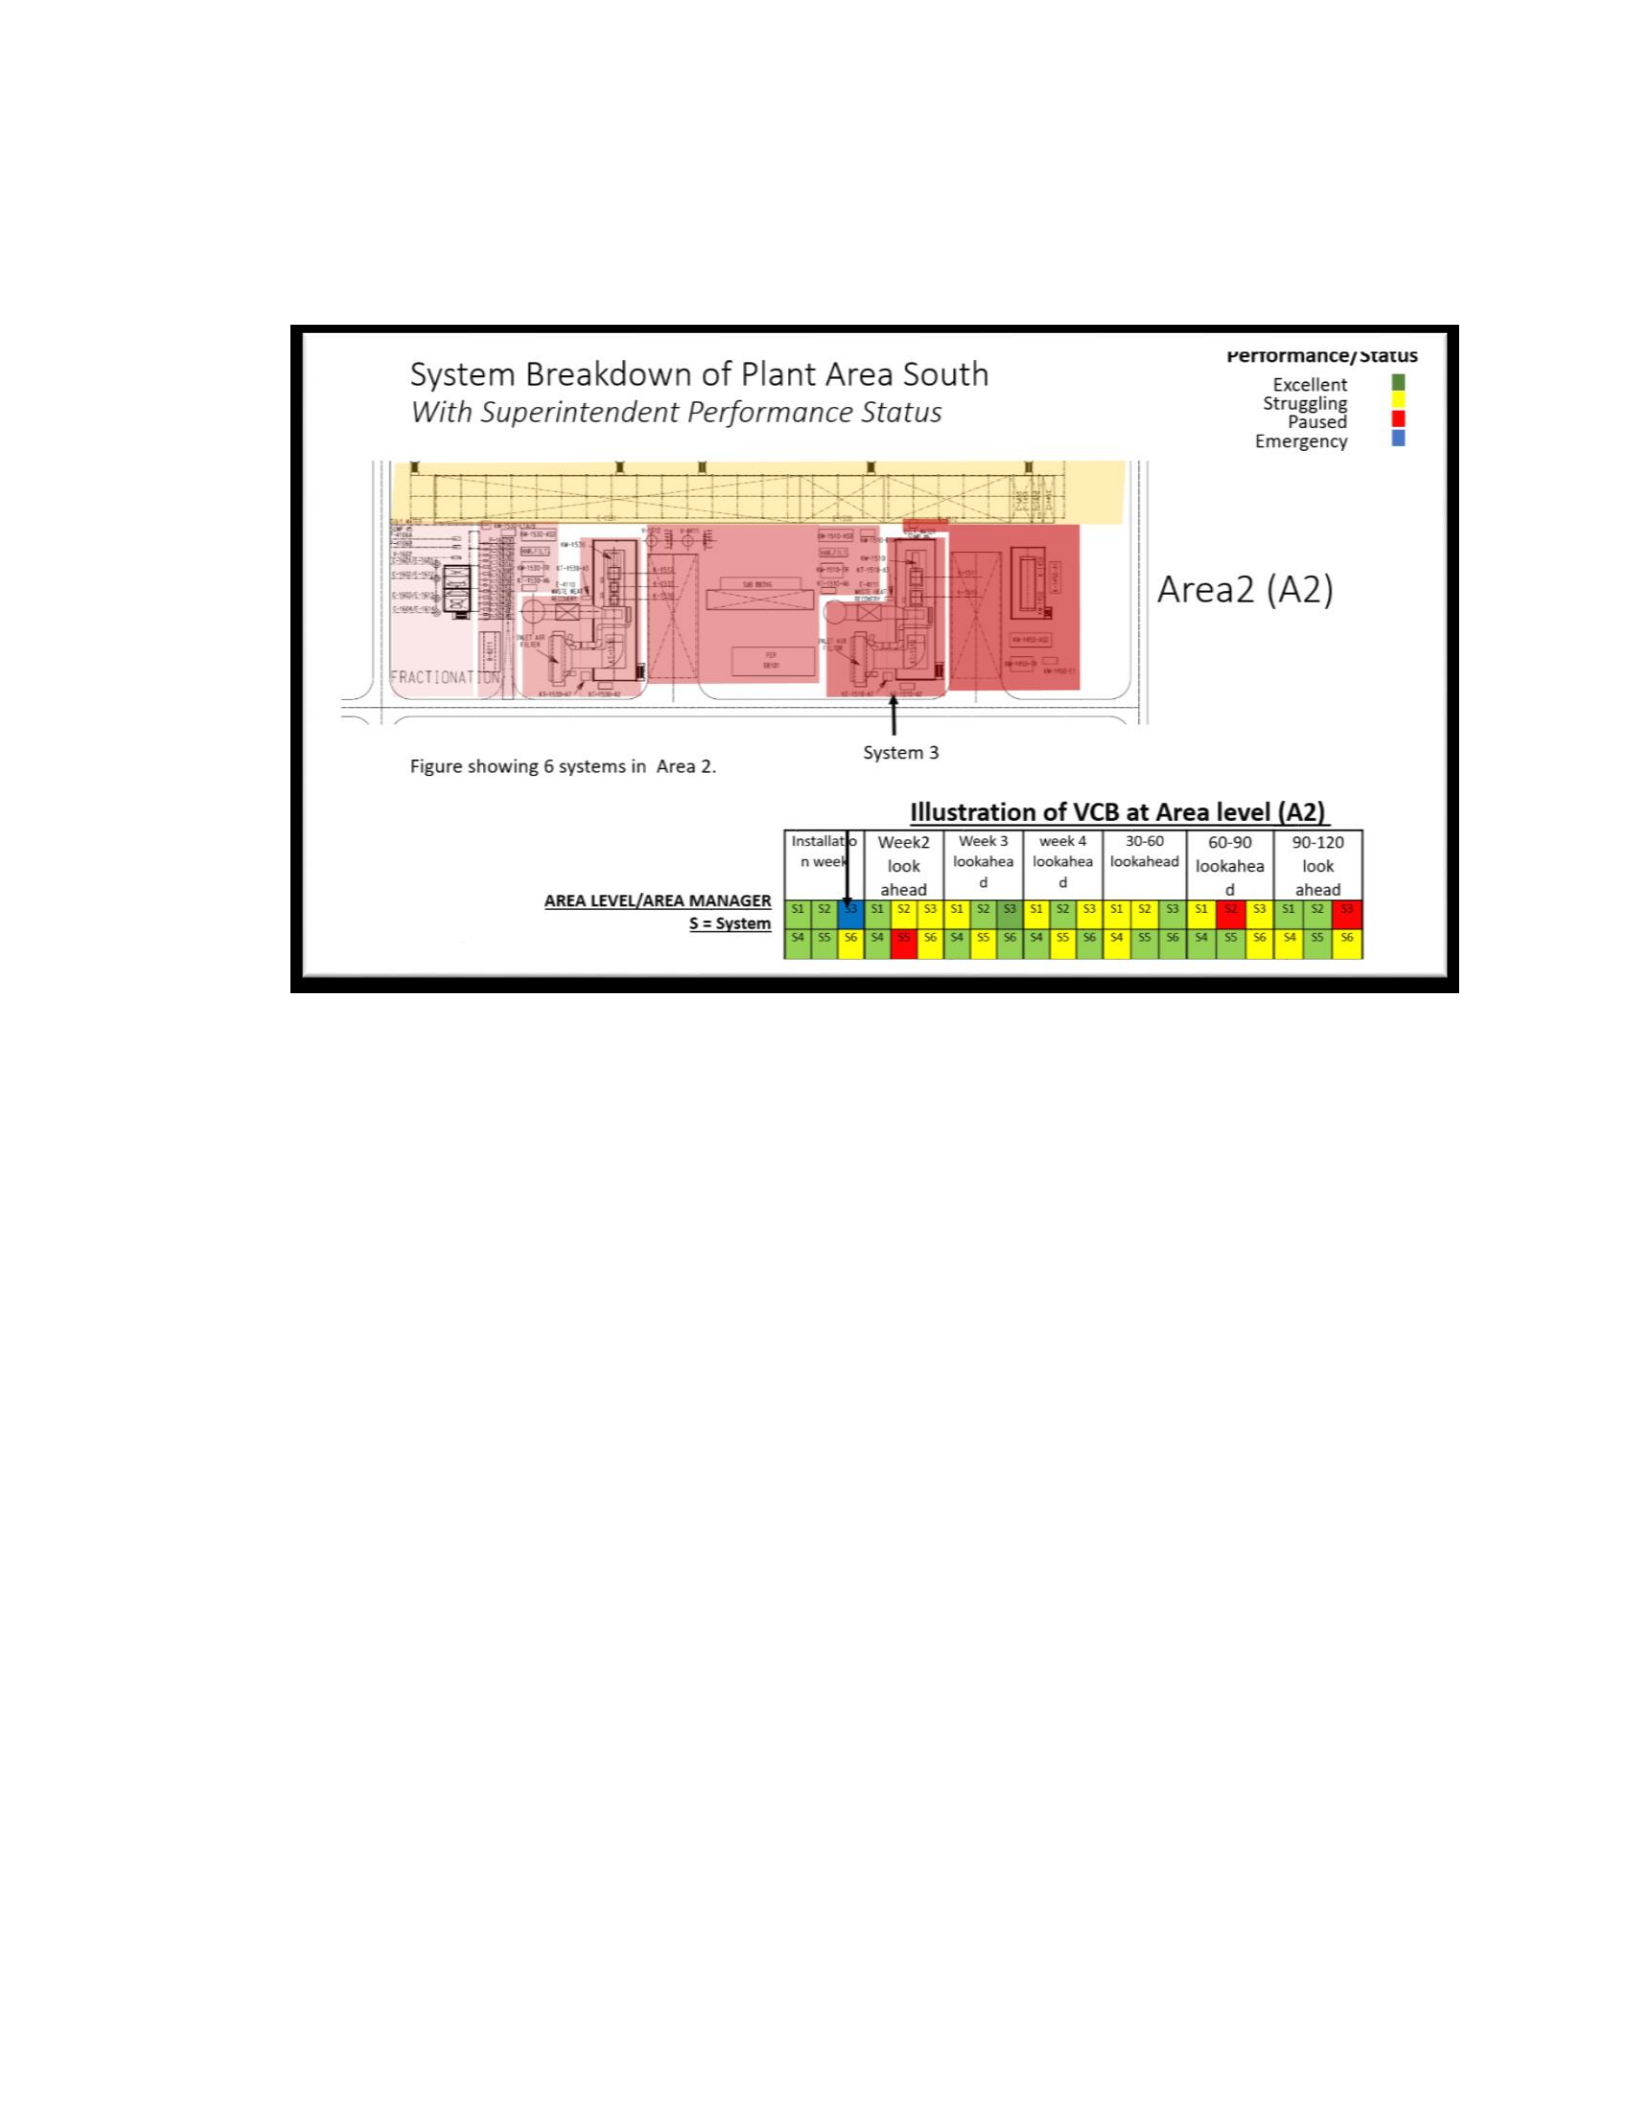
85
Figure 3.9 continued
B) Area 2 with VCB
The VCB above shows that the S3 or system 3 has some emergency. The Area 2 manager
can access the exact discipline and work task package which is in emergency.
3.4.4.3.3 System or Superintendent Level
There is VCB control at the system level which shows the status of each discipline within
the system. The superintendent can access all VCBs within the system. The superintendent
can find out the status of each discipline, CWP, and WTP within the system. 120 days
before installation, level 3 activity is placed on the VCB by the superintendent. Level 3
CWPs are placed based on the updated bi-weekly schedule, logical sequence, resource
availability, and contractual need.
Constraints are placed on the CWPs. The main constraints are issue for construction (IFCs,)
permits, materials, tools and equipment, special training or skill requirements, etc. These
constraints are placed by engineering, procurement, and materials
management/preassembly under the review of the superintendent and general foremen for
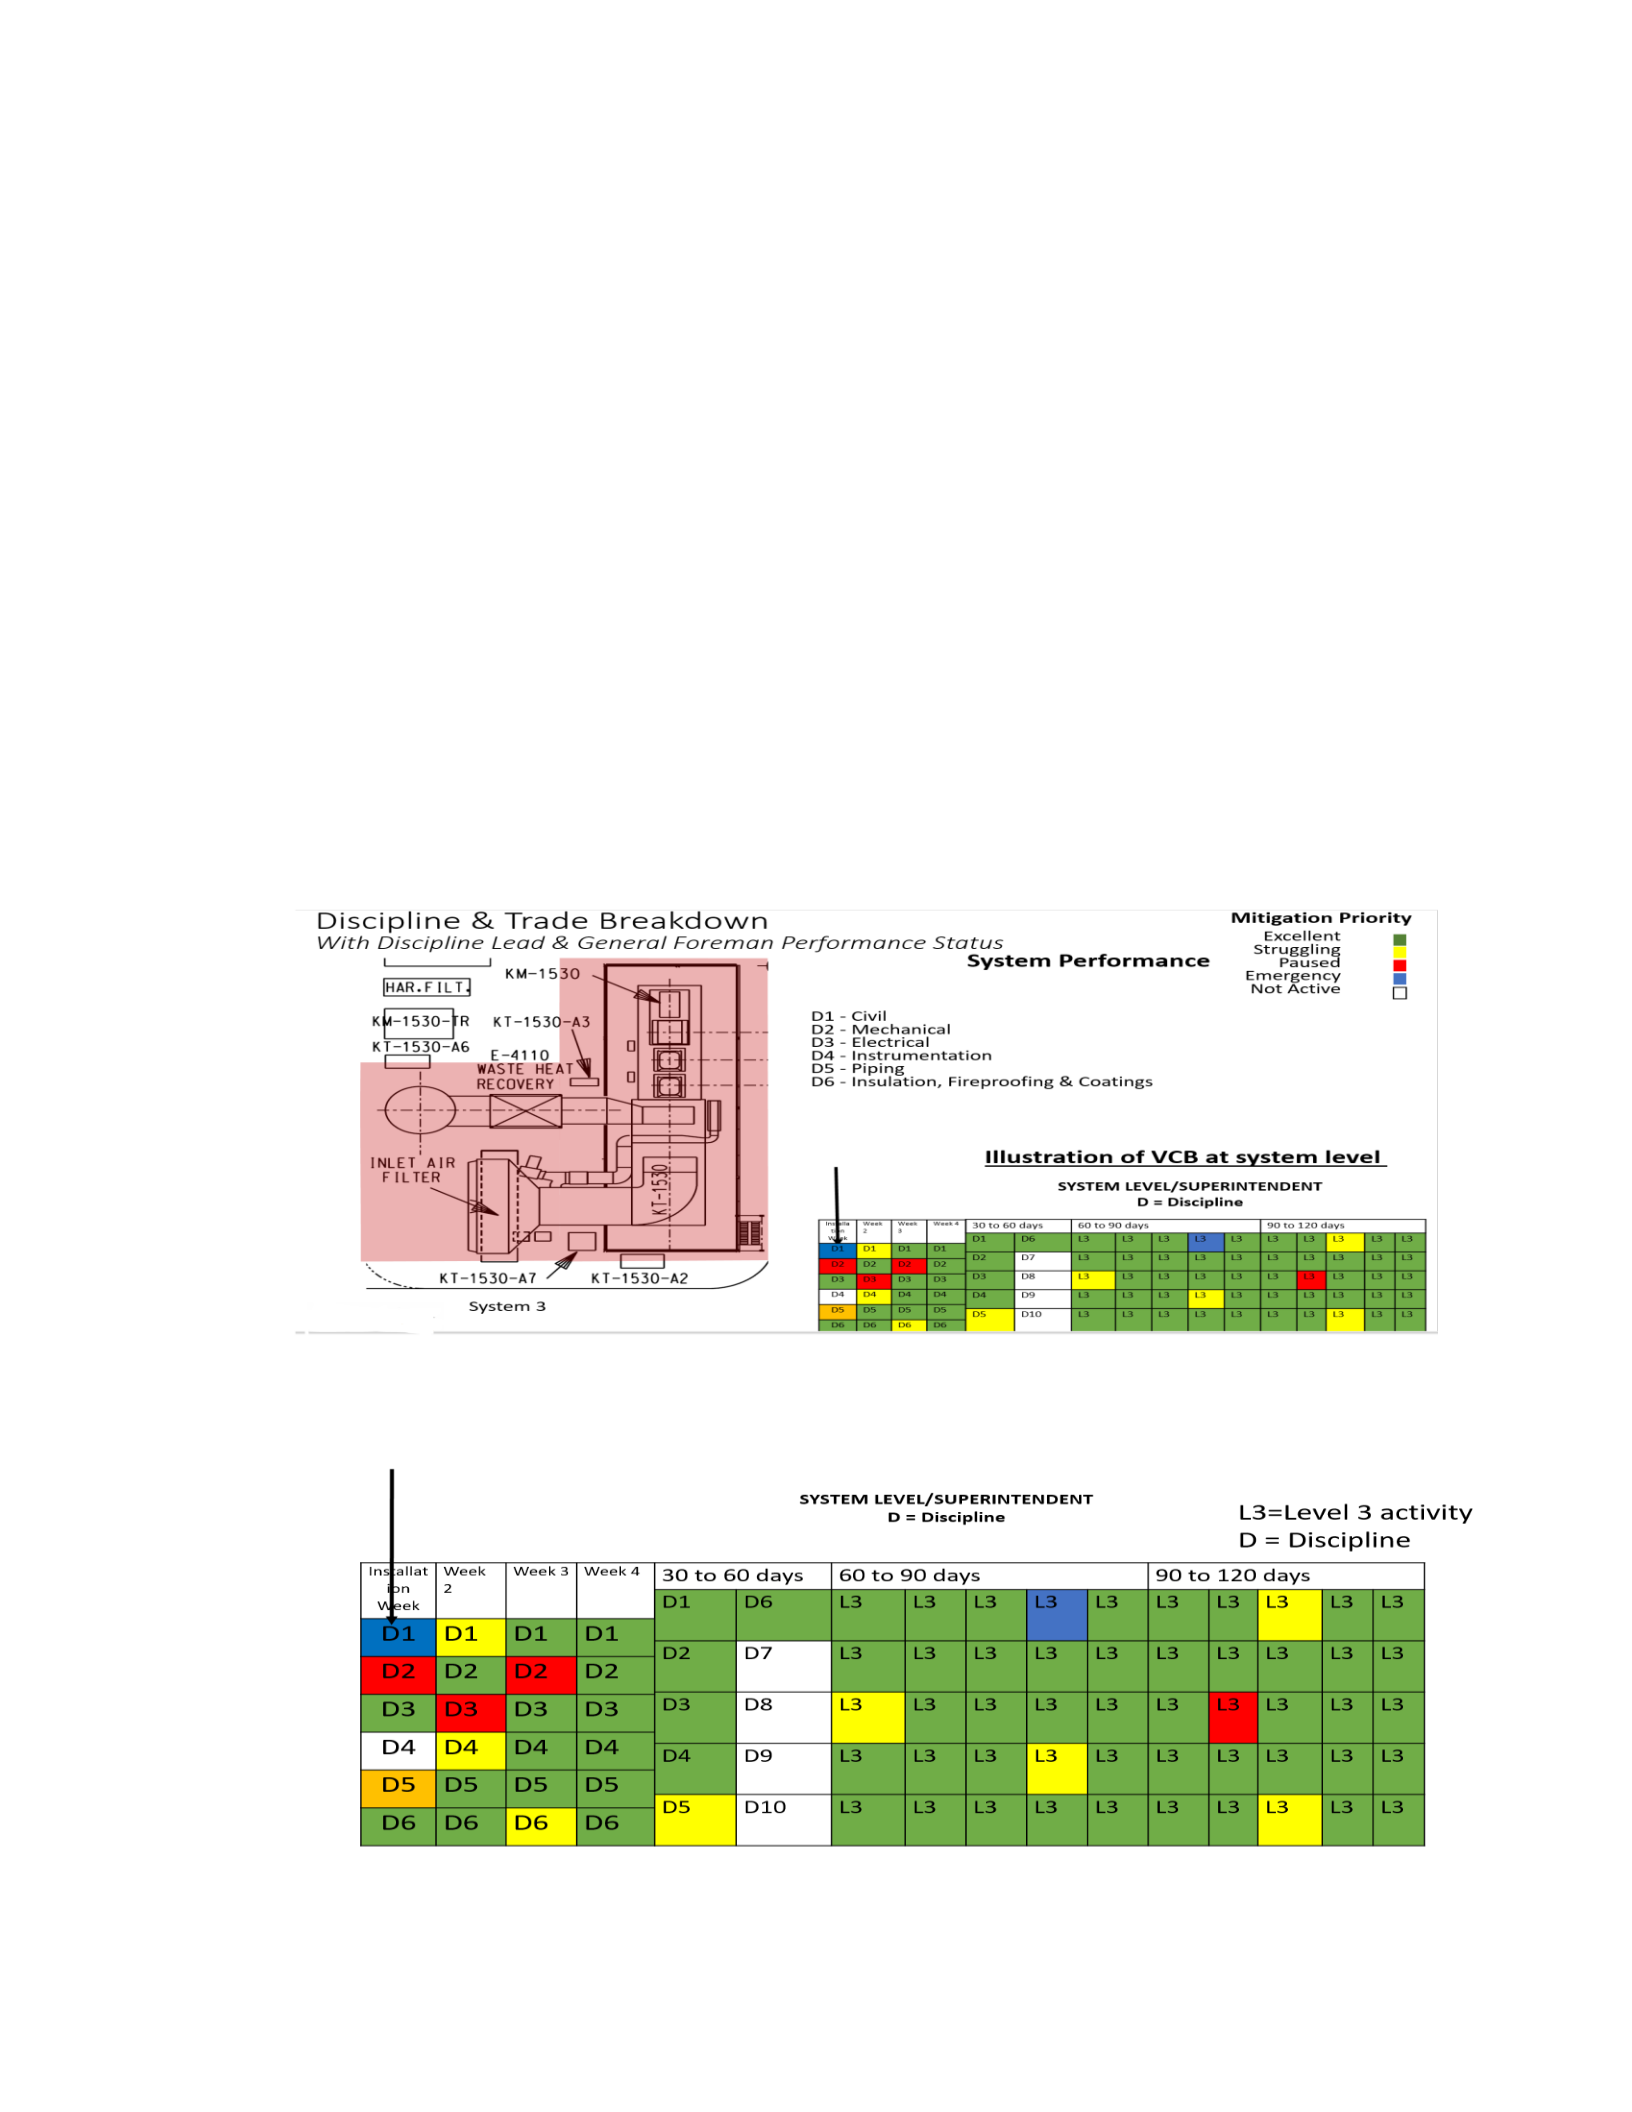
86
90 days or 120 days lookahead meetings. The respective stakeholders such as material
management, procurement, engineering, and construction also have access to level 3
activities and are responsible to maintain the status of the CWPs placed on the VCB in task
time intervals. The stakeholders are responsible for their own WTPs, the completion of
which, as planned, removes the constraints. Removal of resource constraints signifies that
the resources are received at the site by the material management. If the engineering and
procurement and any preassembly process are proceeding as planned, the respective CWPs
remain green. Yellow here indicates that the WTPs for the respective CWPs are
experiencing difficulty, but are confirmed by the respective stakeholders to be completed
on time, and if the respective teams continue to perform according to the schedule, the
materials and other resources will reach the site as needed.
A) System with VCB
B) Expanded version of (superintendent) system level VCB
Figure 3.10 System 3 with VCB

87
From installation week to 60 days ahead of installation, the discipline status is shown on
the VCB. The superintendent could access the WTPs any time within 60 days of installation.
From 60 days to 120 days status of the CWPs or level 3 activity (L3) is shown on the VCB.
In the figure 3.10, D1, D2……D10 is the discipline and L3 is the level 3 activities or CWPs.
3.4.4.3.4 VCB at Discipline or General Foreman Level
WTPs are initiated from the level 3 CWPs placed on the 120 days VCB, 60 days before
installation. General foremen initiate the WTPs in soft form by placing constraints and
writing procedures for safety, installation, quality, etc. The standards are already built into
the system, which includes WTP installation procedure, WTP installation safety, WTP
installation quality, and skills. As mentioned earlier, constraints are placed on the process
or procedures for which standards are not already in the system. Also, if the procedure is
new or if the general foreman is new or not familiar with the procedure required for the
WTP installation, procedure constraints are placed on the WTP. Resource requirements are
also placed on the WTPs in the form of constraints. During the next 30 days, the WTPs are
developed by removing all the constraints with the help of respective stakeholders. The
WTPs which could be totally developed are only placed on the 4 week VCB, and must be
100% ready (all the constraints are removed including workface constraints, resource
constraints, and procedure constraints, etc.) before they are released to the workface.
The WTP is placed on the central database management system (CDBMS). As soon as any
new WTP is initiated, the respective stakeholders are notified and find out if any constraint
needs to be removed by the respective stakeholder. For instance, if there is a procedure
constraint for safety, safety is notified to check the safety procedure mentioned by the
general foremen. Also, procedures are randomly checked by the respective stakeholders
even though procedure constraints are not placed on the WTP.
During Kaizen, standards are developed for the lessons learned and incorporated into the
system as standards. Also, if any flaw is found in an already built standard, it is mistake-
proofed during the small Kaizen improvised at the time or during the big Kaizen done after
the project completion with the help of lessons learned collected.

88
The WTPs are initiated by the general foremen according to the standards (safety, work
procedure, quality, environment, etc.). Once WTP is initiated, the superintendent randomly
selects a few of the WTP and reviews it. The standards are checked by the respective
department stakeholders and if there are any discrepancies, the constraints are put in red
color. This means the general foremen have to contact the respective stakeholder to discuss
the constraints and eliminate them or turn them green or yellow by incorporating their
suggestions. General foremen also put constraints on resource requirements, which are to
be removed by the respective stakeholders responsible for providing those requirements
such as shop drawings, materials, equipment, kitting tools, crafts or skills, etc. These
constraints are put in red color. Stakeholders work on removing the constraints and making
them either yellow or green. Yellow basically shows that there is some problem in
removing the constraints and more attention is needed. Green indicates that constraints
have been removed by the respective stakeholder and everything is set to move the package
forward.
Only those WTPs move forward which are completely developed (all the constraints are
removed except for the workface constraint, which will be removed by the time WTP
reaches installation week) and needed on the field based on the progress of the work. If any
changes occur, the affected WTP could be stopped or modified any time due to the real
time visual control. This makes the model flexible in terms of the impact of the change and
shields it from the negative impact of change. This model is more a pull approach than a
push approach since what is needed and when it is needed are pulled based on the status,
progress, and rate of the project. This provides real time information so that the
stakeholders can set a priority for the WTPs and thus maintain a consistent and reliable
flow.
The 4-week VCB: The 4-week board has the information of all the WTPs for 4 weeks.
Only WTPs which can be fully developed by the time it is released on the site to the
workface are placed on the 4-week VCB. WTPs are categorized and placed on VCB per
level 3 activities.

89
A) 30 to 60 days to install (general foreman) discipline level VCB
30 to 60 days to install
WTP
WTP
WTP
WTP
WTP
WTP
B) 4-week (general foreman) discipline level VCB
Figure 3.11 Discipline level VCB at the General Foreman Level
The VCB (activities and tasks shown along with their sequence) is updated every week
after the 4-week lookahead meeting to add new WTPs. Week 1 is the installation week for
the WTPs. Progress status and readiness are updated every task time. The installation week
WTPs is updated by the task lead/foreman every task time, which is generally 2 or 4 hours.
Green indicates that the WTP is on or ahead of schedule. The 4-week VCB also has
provision to show the status of the WTP if it is ahead of the planned installation time so
that the next WTP can be started early.
The activity on arrow (AOA) shown in the 4-week VCB represents the WTPs distributed
per discipline. The thick lines represent the level 3 CWPs and the thin lines represent the

90
level 4 WTPs. WTP includes WTP name, code, resource information, standard procedures,
predecessor and successor WTPs with solid and hollow constraints, etc. Also, all WTPs’
linkage to the predecessor and successor WTPs will be highlighted. Now, the solid circle
connection among the WTPs shows workface constraint link among the WTPs. This
implies that until the previous WTP is completed, the next one cannot be started. The
hollow circle means that there is only a logical link among the WTPs, that is, logically it is
most appropriate that after the previous WTP, the next WTP should be released on site.
However, there is no compulsion or workface constraint for doing this. Close out of the
task means that the WTP is installed successfully and after inspection is erased from the
visual control board by the general foremen. Lessons learned must be collected for each
WTP. For the WTPs that have turned red, yellow, or blue during the 4-week lookahead,
lessons learned must be collected or the responsible superintendent must determine that
there is nothing to be learned. Therefore, these WTPs should only be deleted from the 4-
week VCB by the superintendent after the lessons learned are collected. In this way, lessons
learned collection becomes mandatory for the WTPs that have experienced execution
problems. Positive lessons learned also should be collected for the WTPs which are
completed ahead of time or when opportunity is otherwise apparent to any member of the
team.
For 30 - 60 days, the WTPs are in the development stage. WTP’s green status indicates that
the packaging process is proceeding normally for all the constraints to be is removed and
all the resources are gathered, bagged, tagged, or otherwise secured for that specific WTP.
Yellow status indicates that a problem relative to the plan exists, but the team believes they
can solve it and not be late. Resources that are not yet on site are confirmed to be available
from other superintendents in the area or from vendors and suppliers that will be on site
and on time. Red indicates that the preparation will not be on time as presently determined
by responsible task leads and that help is needed to make the deadline. Blue indicates
emergency, both red and blue, so the attention of the supervisors is immediately sought by
the foreman.

91
For 7-30 days, the WTPs are in the 4-week VCB. This implies that the WTP is under
development and all the constraints are being removed. The green status of WTP indicates
that progress is normal for all the constraints to be removed and all the resources to made
ready at the workface. Workface constraints occur (all workfaces are not likely to be fully
utilized) if the status of the WTP installing becomes difficult and turns red or blue.
In the 0-7 day period or installation week, the WTPs’ green status indicates that the
particular WTP is on or ahead of schedule. Yellow status indicates that the WTP is facing
some difficulty but will make it on time per the task lead. Red indicates a delay, and blue
indicates emergency.
Priority of the WTPs is based on two factors, 1) preference due to closeness of WTP or
CWP to the installation week, 2) preference due to colors: Blue, Red, Yellow, Green If
there is Red, then the foreman must immediately contact the supervisor and together they
have to act and lessons learned must be collected. Yellow means that the particular WTP
or CWP needs more attention and so it is handled by the foreman and general foreman.
Blue indicates an emergency and may need to involve the superintendent, area manager,
or PM (or perhaps a project services lead, such as safety) to tackle the situation.
3.4.5 Stakeholders and Constraints Involved in the Development of WTP
Engineering, procurement, material management, safety, quality, environmental,
construction, etc., are the key stakeholders involved in removing the constraints of WTP
and developing it. The main potential sources of the constraints are: 1) workface, 2)
standard procedure, 3) safety and permitting; quality and control 4) IFC drawings 5)
schedule duration 6) lead time and trigger, and 7) resources such as materials, pre-
fabrication, craft availability, construction equipment, tools, scaffolding, etc. Color coding
is based on the intensity of the problem. For instance, if planned progress toward removal
of any constraint in the task plan halts, then the responsible task lead turns the package
and-on to red. Doing so should automatically change the and-on for the corresponding level
3 activity and the corresponding level two CWPs red. If an emergency occurs, the status of
halted (red) or strained (yellow) do not matter as much until the emergency is resolved.

92
Blue indicates the highest intensity of need for management attention. Similarly, if any
constraint resolution halts, the package and-on turns red.
3.4.6 Benefits of Proposed Model of Flow System
Benefits of the proposed of proposed “Real Time Visual Control Flow System” model is
described below.
2. In published AWP, the workface planner is responsible to develop IWPs
6
or WTPs
who are not as familiar with the actual status and ground reality of the project as
the actual responsible discipline lead or general foreman would be. Neither
workface planner is responsible for the execution of the WTPs. The Real Time
Visual Control Flow System Model enables the respective general foreman along
with the respective foreman, who are responsible to execute the work, to develop
and execute the WTPs.
3. Since the responsible general foreman develops the WTPs for their foreman, it
gives them a real sense of ownership of the work, enabling them to make and keep
commitments for the installation according to the standards upon which the WTP
is planned.
4. WTPs are developed from the already built standards which were developed during
the process of Lean/Kaizen. The collaborative knowledge of the entire project
management team along with the best practices published by others is built into the
standards. Following such standards makes the package world class. Also, since the
execution team (general foreman and foreman) are responsible for developing and
executing the WTPs per standard, they gain experience applying the knowledge and
skills built into the standards and transfer this to the WTP execution team of craft
people.
5. Since this model provides real time status at each level of the project team, it
engenders better alignment, coordination, and integration of the entire project
management team (PMT). It is like the whole PMT is working as a single entity
6
IWP or installation work package is the level 4 work package. It is the term coined by CII. In this thesis a
similar concept known as WTP or work task package is used.

93
with a great level of collaboration and flexibility throughout the project to provide
a shield from the change and its negative impact, such as reworking the project (by
removing many root causes and dealing with the remaining variability so that there
is a minimum impact on the project).
6. Unlike the last planner system, which directs the development of the packages from
additional resources on the site, this model improves the packaging supply chain
and makes sure everything is present on the site which is needed when it is needed
so that the general foremen can develop their own WTPs and install them along
with the foremen they are managing.
7. Real time visual control works on the principle of making it obvious what people
need to know to prevent them from going off track or to bring them back on track.
Thereby, this prevents the project from going off track in the first place and if it
gets off track, people know what is going on and where to focus their time to bring
the project back in real time without letting more deviations occur.
8. The real time visual control feature enables pull flow control in EPC by providing
real time monitoring of the development and installation of WTP and thus enables
all the benefits of the pull flow control system.
9. Since this model enables the pull approach, it tends to incorporate the benefits of
the pull approach, which are to reduce the work in process, reduce the inventories,
enhance the cash flow etc.
10. This model is effective with the changing nature of the construction project.
11. This model use and process should be defined in the project execution plan and can
set a priority for the entire PMT. For instance, blue WTP or CWP has more priority
than the red one and the nearer the WTPs or CWPs are to the installation week, the
higher the priority is.
12. It enables real time control at all levels of the project.
13. It enforces mistake proofing so that errors and mistakes can be prevented in the
future, and it provides a sense of proactive control by removing variabilities from
the system.
14. It enforces lessons learned in practice by making lessons learned mandatory, which
is extremely important for improvement and standardization.

94
Lean PCMS
Lean PCMS is the second model to enhance the PCMS which is described below.
3.5.1 Introduction
Implementation of any new model in the organization is a challenge. This model intends
to implement the first model described above. In fact, Lean is a proven effective way to
implement any improvements in the organization.
Lean ways of advancement have benefited other industries tremendously and now the
construction industry can receive more benefits from it. This thesis includes a model of
Kaizen which can be incorporated into the construction industry and bring about initial and
sustained improvement of the entire PCMS.
According to the literature review, Lean is a philosophy of ongoing improvement by the
continuous elimination of wasting of time and wasting of any other resource. Kaizen is one
of the tools that incorporates Lean thinking. In this chapter, it is proposed that Lean/Kaizen
be utilized to improve the whole system of PCMS. Here, we refer to the PCMS improved
by the incorporation of Lean philosophy and Kaizen as Lean PCMS. PCMS becomes Lean
in a stepwise and continuous improvement, which is the Lean way or Kaizen way of
improvement called Lean PCMS.
The ultimate goal of Lean PCMS is to have a desired system of PCMS so that a project
never gets out of control. The project runs on the mapped path the entire time; i.e., what is
planned gets built. Nonetheless, for the construction industry, which is an open system and
is affected by the external environment, eliminating the root causes of all uncontrolled
change seems unlikely and therefore, a system is also needed for a project that goes off
track then comes back into real time without much deviation as described in the real time
visual control flow system model. Lean/Kaizen helps for incorporating the real time visual
control flow system model as well as it continuously works for improving the entire PCMS
so that a project does go off track. This is done by improving the system standards (work
process, procedure, policies, tools, etc.) and governance of the PCMS. The key to

95
improvement is the establishment and governance by standards and the collection of
lessons learned, which the real time visual control model makes mandatory. Through
Lean/Kaizen, collaborative standards are developed. Improvement of the system of
standards and governance always takes place through collaborative knowledge, so best
practices and lessons learned are engrained in the standards.
Lean principles were explored in the literature review. A customized model of Kaizen to
be used in the construction industry is developed for the uplifting of PCMS. This
Lean/Kaizen model can be utilized to improve not only PCMS but any other system in the
construction industry such as material management, change management, contract
management, etc. It is proposed that Kaizen experts be included when applying Kaizen for
the first time (Mika 2006). This means the model of Lean/Kaizen must be applied and
should be repeated again and again.
3.5.2 Appraisal Stage: Development of Situations-at-a-Glance
This stage starts with the appointment of Kaizen or Lean experts in the organization. A
steering team is to be formed consisting of credible executives along with senior, mid and
lower management (Patty and Denton 2010b). The skills and stakeholders selected need to
relate to the discipline or area required to participate in the Kaizen process. For instance,
to enhance PCMS, skills and stakeholders related to PCMS are needed to participate in the
Kaizen process. Pre-reading materials on the principles and existing best practices and the
improvement process itself are sent to all the participants.
3.5.2.1 Selecting Representative Skills and Stakeholders
According to Martin et.al., selection of representing skills and stakeholders has the
following criteria:
3.5.2.1.1 Qualifications
• To effectively explain the issues and opportunities from their discipline or
experience of their stakeholder organization
• Experts in other disciplines or stakeholder organizations related to the PCMS

96
• To be able to quickly learn new principles, and methods, and to apply them to the
issues at hand
• To have leadership qualities
3.5.2.1.2 Aptitude and Authorization
• Ability to gather issues and experience from peers they will represent
• Willingness to bring up issues that ought to be aligned in discussions
• Desire to reach unity rather than size up the Situation and render a partially resolved
tough executive decision
• Rather than compromise, keep peers aligned, representing discipline or stakeholder
organization aligned with team decisions so team decisions will not be disowned
(Martin and Osterling 2007)
3.5.2.2 Kick-off Meeting
According to Patty and Denton, the kick-off meeting is held to present the outline of the
process to the participants and encourage their participation. This meeting discusses:
• The outline of the Kaizen process
• Why management is requesting participation of all the stakeholders
• Executive Steering Team expectations of the Kaizen team of skill and stakeholders
including expectations for mutual benefit (Patty and Denton 2010b)
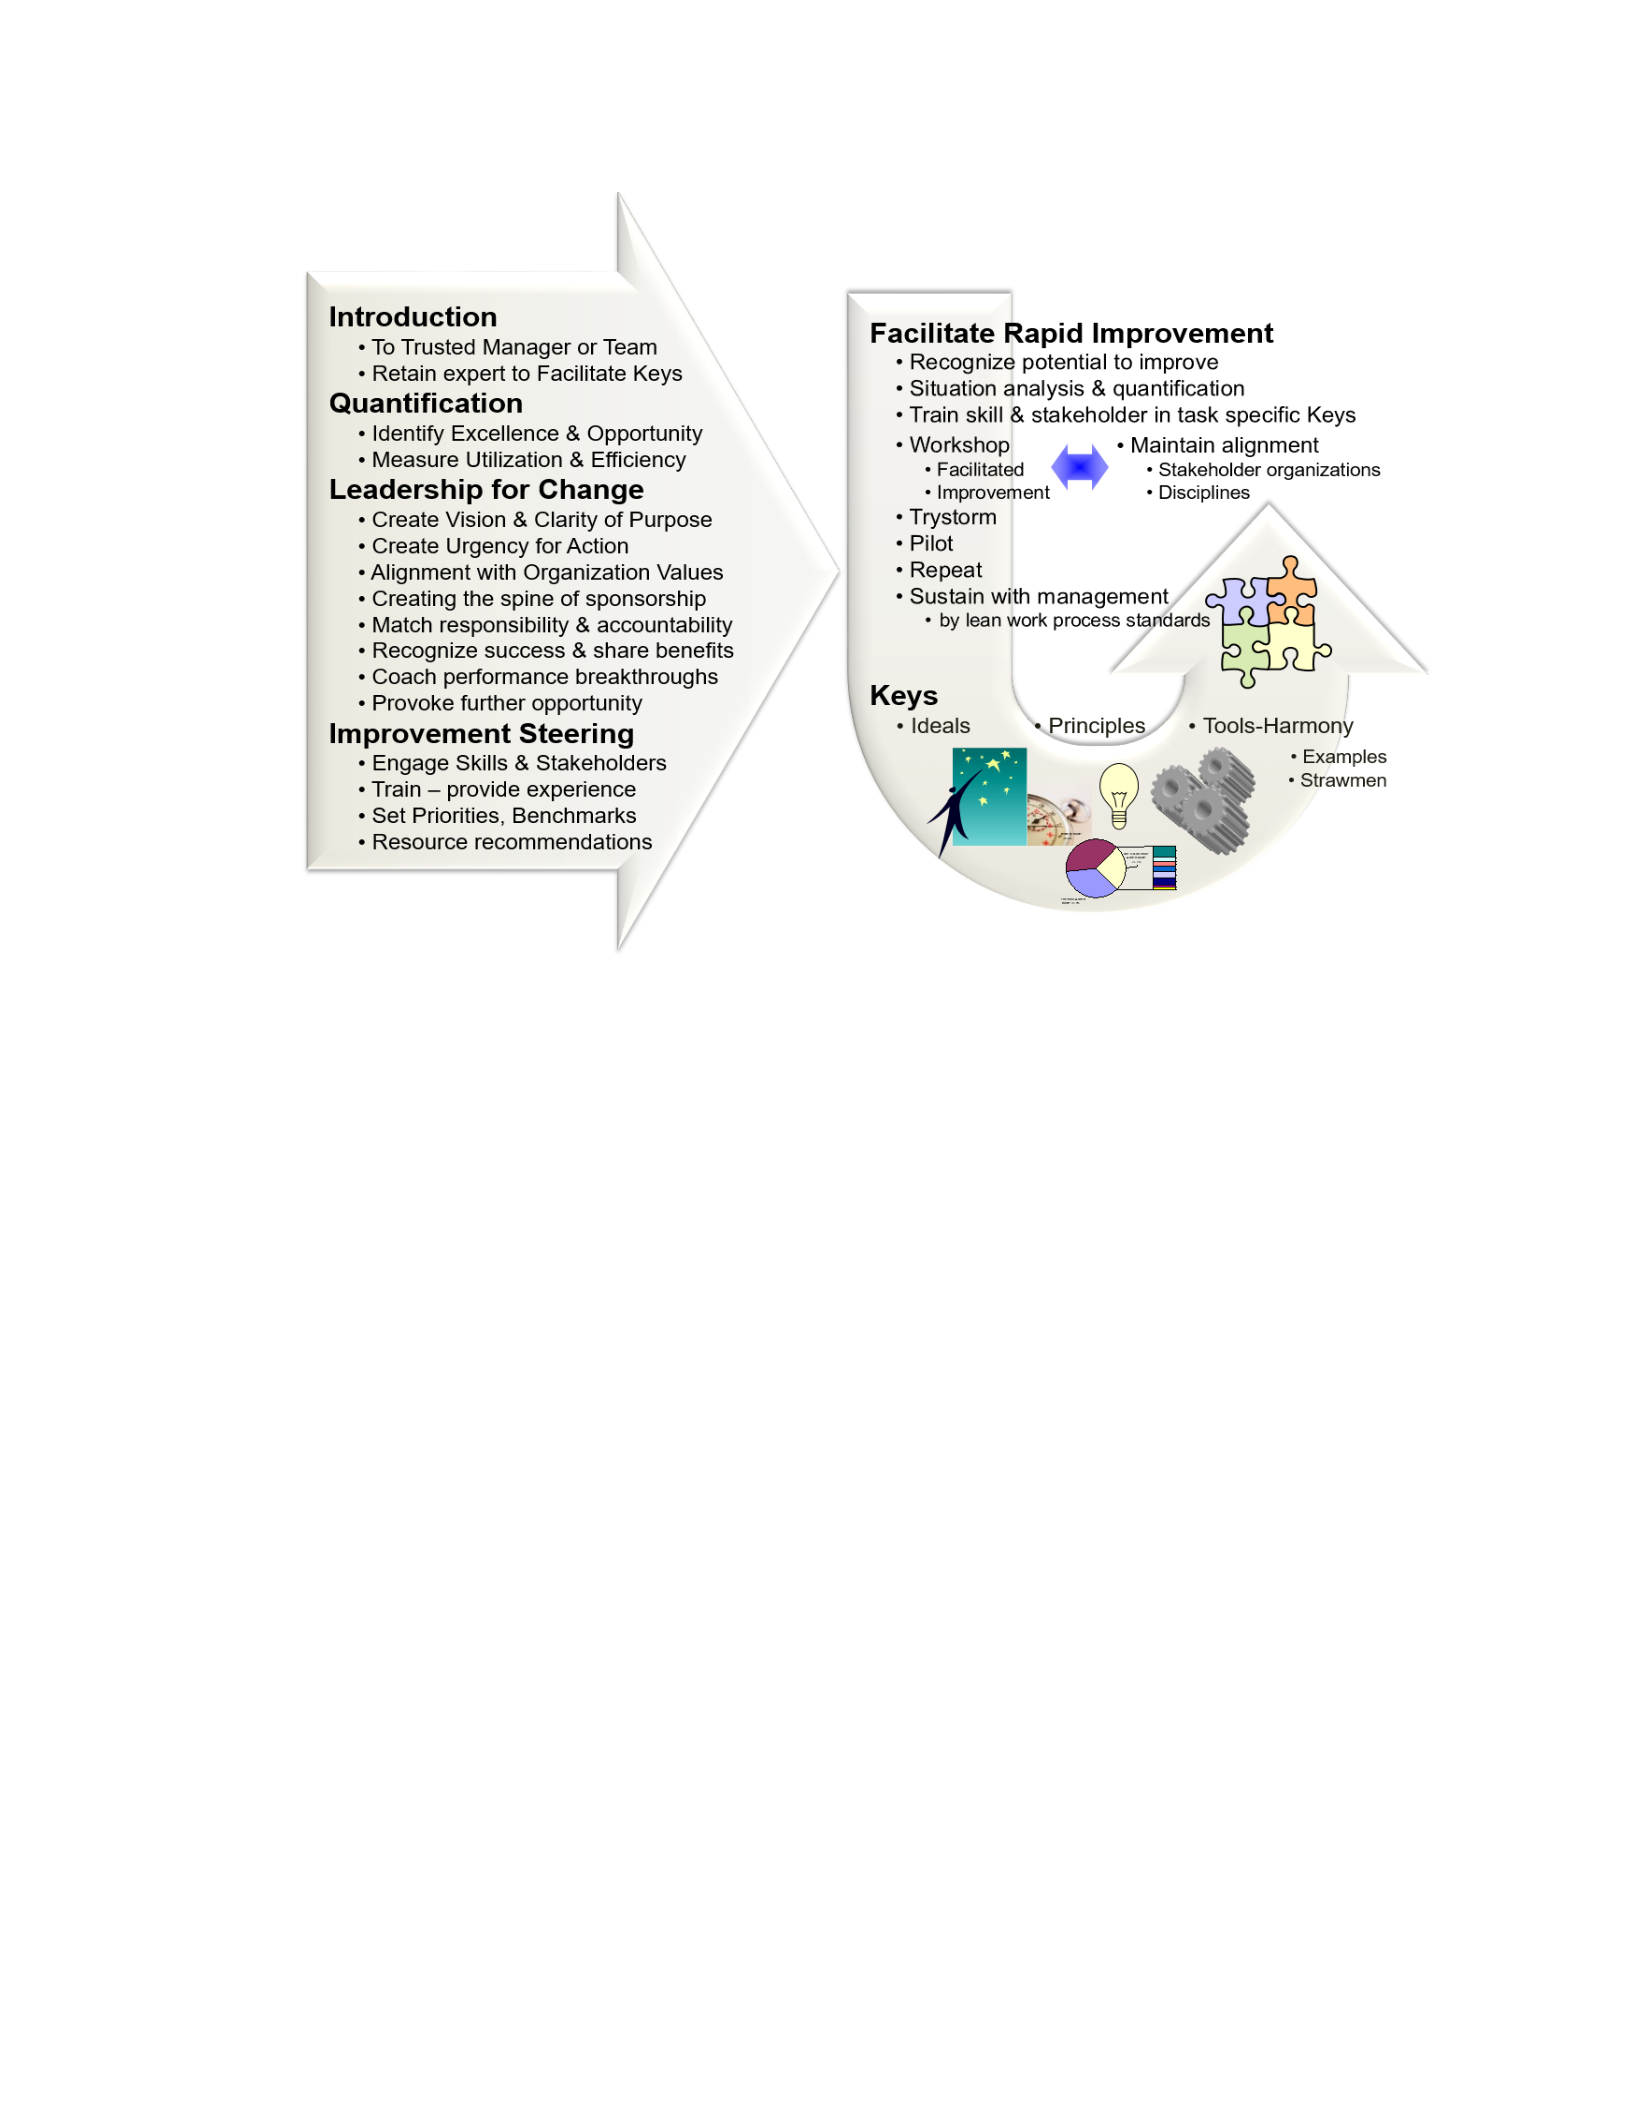
97
Figure 3.12 Kick off meeting presentation slide (Patty and Denton 2010b)with some
improvement such as “leadership for change” and “creating the spine of sponsorship”
3.5.2.3 Pre-Read Interview Preparation
In this document, experts present their extracted overview of the best practices and
concepts used in the construction industry PCMS. One such document which has been used
in real Kaizen is in appendix C in chapter 4. This document is intended to inspire thinking
and help participants to prepare for the extraction interview. The areas (PCMS) which
require improvement are listed in the document. This document intends to make
participants think about the two or three most “broken” work process “Situations”
identified by the steering team that to be discussed in the interview. This document is
prepared by extracting the best that has been going on in the PCMS industry around the
world.
3.5.2.4 Extraction Interview

98
Face to face interviews are held between the experts and each key skill or stakeholder. The
main goal of the interview is for the experts to listen carefully to the participants and gain
a very clear understanding of:
• Background - what happened or is at risk of happening in circumstances faced by
participants
• Root Cause - what specifically caused each Situation
• Recommendation - how to repeat positive-impact Situations and how to avoid
negative-impact Situations
In this interview, negative Situations that prevent projects from having an outstanding
performance as well as positive Situations that can be repeated in other areas of a project
to increase performance are discussed and noted down. Sometimes project team members
do not realize that the way they are approaching something, e.g., “doing this task my way”
or “doing this task in a different way” might be helpful toward making other work
processes more efficient and effective (Thomas Terris, personal communication, Dec 1,
2016). After the interviews, an appraisal workshop is carried out where these things are
discussed in groups and “Situations-at-a-Glance” are developed for use in formal facilitated
Kaizen to follow.
Context is very important and needs to be discussed in the interview. Context is the set of
circumstances or facts that surround a particular Situation. Context can be defined as being
where opportunities for improvement exist, or in order to drive success (Robert Goings,
personal communication, Dec 2, 2016).
All this will allow the company’s management to make a very informed selection of the
improvement opportunities that will have the most profound impact toward closing
performance gaps. The interviews and workshop(s) are the gathering mechanisms for
existing knowledge that will be combined with the latest principles, methods, and tools
during Kaizen workshops to derive solutions, followed by implementation, in order to
actually close the performance gaps.

99
3.5.2.5 Extraction Workshop(s)
The engine of the improvement cycle that leads to operational excellence begins with
interviewing a company’s key personnel, and further alignment around the problems and
potential solutions is achieved in the workshop(s) that follow. In preparation for extraction
workshops, the information extracted during individual interviews is consolidated and
sorted around similar themes. Preliminary “Situations-at-a-Glance ” are developed around
each theme. Each Situation-at-a-Glance will describe what the individuals have disclosed
for which they know “What Is,” “What Should Be,” and “How to Close the Gap.”
Key steps in the Extraction Workshop(s) are as follows.
1. Operational Excellence Teams
Following their interviews, as described above, the company’s employees who were
chosen to participate as skill and stakeholders in the Operational Excellence Initiative will
come together with the experts. The company employees will be placed into several cross-
functional teams with a lead/scribe (taking detailed notes) for each.
2. Extraction Workshop(s) Directions
All cross-functional company teams will meet to review selected Situations-at-a-Glance.
This meeting should be facilitated by Kaizen experts to help participants validate, detailed
circumstances, quantify impact, suggest improvement methods, and organize Kaizen teams
to address each Situation-at-a-Glance . Directions will be provided to “think big,” out-of-
the-box, and to think beyond the present, looking ahead with appropriate consideration for
what is behind them in their experiences with the company (Robert Patty, personal
communication, Dec 2016).
3. Begin Extraction Workshop(s)
The cross-functional company teams will address Situations-at-a-Glance (which came
from the interviews) validate them, ensure detailed circumstances are provided, quantify
the impact, and suggest improvement methods. Team leads/scribes will help their team
complete the steps, and teams will present their Situations at the conclusion of the
workshop(s) (Mika 2006).

100
4. Addition of Advanced Principles, Methods, Tools and Training Modules
The expert team will review the results of the extraction workshop(s) and, where
appropriate, expand the vision for potential improvement by the addition of advanced
principles, methods, tools, and modules that will be used to train the company skill and
stakeholder teams that will actually make the improvements during the subsequent
implementation phase Kaizen workshop(s) (Patty and Denton 2010a). The final Situations-
at-a-Glance are reviewed along with the company steering team for alignment to facilitate
prioritizing, staffing, and scheduling the Implementation phase of Kaizen to address them.
Table 3.3 Sample Situation-at-a-Glance
Situation-at-a-Glance (Developed during interviews)
Title:
Team Lead: (Company spine member)
Team Members: (It is the executive steering team’s responsibility to resource the
representative skill and stakeholders. The Team Lead and selected team members
should validate that all necessary skill and stakeholders are represented, and where
holes exist, help to identify and recruit the necessary team members to achieve what
management is expecting of them)
What Is: (Consider User-as-your-Customer Perspective, Input-process-output)
Evidence of What Is: (Credible Evidence of the Need to Improve, Root Causes.
Include examples to illustrate and describe what is the real problem, who is impacted
(stakeholders, clients, employees, subcontractors), what are the risks and the
dissatisfaction)
What Is the Pain: Identify, Describe and Quantify: (The impact of leaving the gap
open, to: quality, safety, information flow, material & equipment flow, productivity-
labor, reliability, the cost to close the gap)
What Should Be: (Not limited by the Best Practices you have Seen or Heard of)
How to Close the Gap:

101
3.5.3 Implementation Stage
The implementation stage of Kaizen is described below.
3.5.3.1 Training of Steering Team and Kaizen Team Leads
A steering team member or other trusted skill or stakeholder should be selected to lead
each Kaizen team. These Kaizen leaders will be trained for expectations specific to their
responsibility relative to the Situations-at-a-Glance they will be responsible for leading a
team to address. Team leads will work with their team members to preview their Situations-
at-a-Glance and extract associated issues and concerns specific to the team.
3.5.3.2 Kaizen Introduction and Overview Presentation of Situations-at-a-Glance
and General Training
Team leads will present their Situations-at-a-Glance to the entire Kaizen assembly. Skill
and stakeholders in and beyond the hosting company will be included if and where the
steering team believes it appropriate (e.g. subcontractors, technical service providers,
clients of the company, etc.).
3.5.3.3 Situation-Specific Team Training
The training modules prepared for the Situations-at-a-Glance will be presented to each
Kaizen team by an expert or company member who is prepared to provide the training.
3.5.3.4 Immersion in the Problem at Hand.
The Kaizen team leaders immerse their teams in the chosen Situations, considering the
circumstances described, the relationship to other work processes, and applying the
principles, means, and methods that are specific to the Situation.
3.5.3.4.1 Trystorming
Try-Storming is practical, nuts and bolts brainstorming, where the team does not get
distracted by thinking too long and too hard about whether or not something will work
before they just try it. The team is immersed in developing improved system (a new or
improved work process or a tool or technique) and then trying it in the context where it

102
will be used to determine the details along the way. The team will measure results and
provide more improvement for the system (Venkateswaran and Ikuma 2011).
The teams generate about seven potential solutions before proceeding to select the best one
or two. Note that experience has shown that the “wild solutions” (which, with effort,
become breakthroughs) begin to emerge only after three to five more “conventional
solutions” are already generated. The team may choose to combine the best aspects of
several potential solutions into a hybrid. They will work the interfaces with work processes
not yet improved (the rearview mirror view).
The teams prepare one or more solutions to be piloted, including what will be measured.
Mockups are excellent ways to visualize what the problems are for a Situation. Often, it is
only when something is actually built that the team is able to fully conceive it and convince
others of what will work. Full skill and stakeholder sets, rapid prototyping, including shop
equipment, materials, and a broadly-experienced “mechanic” are often very useful to
address a need and quickly derive an effective solution (Jimmerson and Weber 2015).
Uniform measures will be utilized where feasible.
3.5.3.5 Present Solutions to Company Management
The teams get back together as one group and presents their solutions to company
management and the other teams.
3.5.3.6 Piloting of Solutions
Successful solutions which get buy-in from management will be piloted by the company
on projects, and results are measured, which allows for further improvement.
3.5.3.7 Full Rollout of Solutions
Solutions with successful pilots will be standardized and deployed with the appropriate
governance to sustain the improvement.

103
3.5.3.8 Continuous Improvement
The company will continuously improve performance on projects using the new work
processes, tools, techniques, and skills. The company may establish work process swim
lane diagrams with position standards in the company to include improvement. The process
will be repeated.
As stated, solutions may be the development of improved or new work processes with
associated tools and techniques. Also, criteria may be established for development of
advanced equipment and related work processes, tools, and techniques in order to utilize
the new or improved work processes. Where advanced equipment is involved, intellectual
property and resulting benefits will be shared as determined equitably by the team members.
Appropriate particulars will be established as the opportunities are defined and both
intellectual, financial, and management resources are brought together.
3.5.4 Sample Work Process Swim Lane Diagram with Position Standards
Below figure 3.4, is a sample of a mapped swim lane diagram, which is the main output of
the Kaizen process. This is a swim lane diagram of the development of Level 1 project
execution planning and scheduling. It is just a sample and was prepared by Robert Patty
and Dipak Patel during the Kaizen practice session.
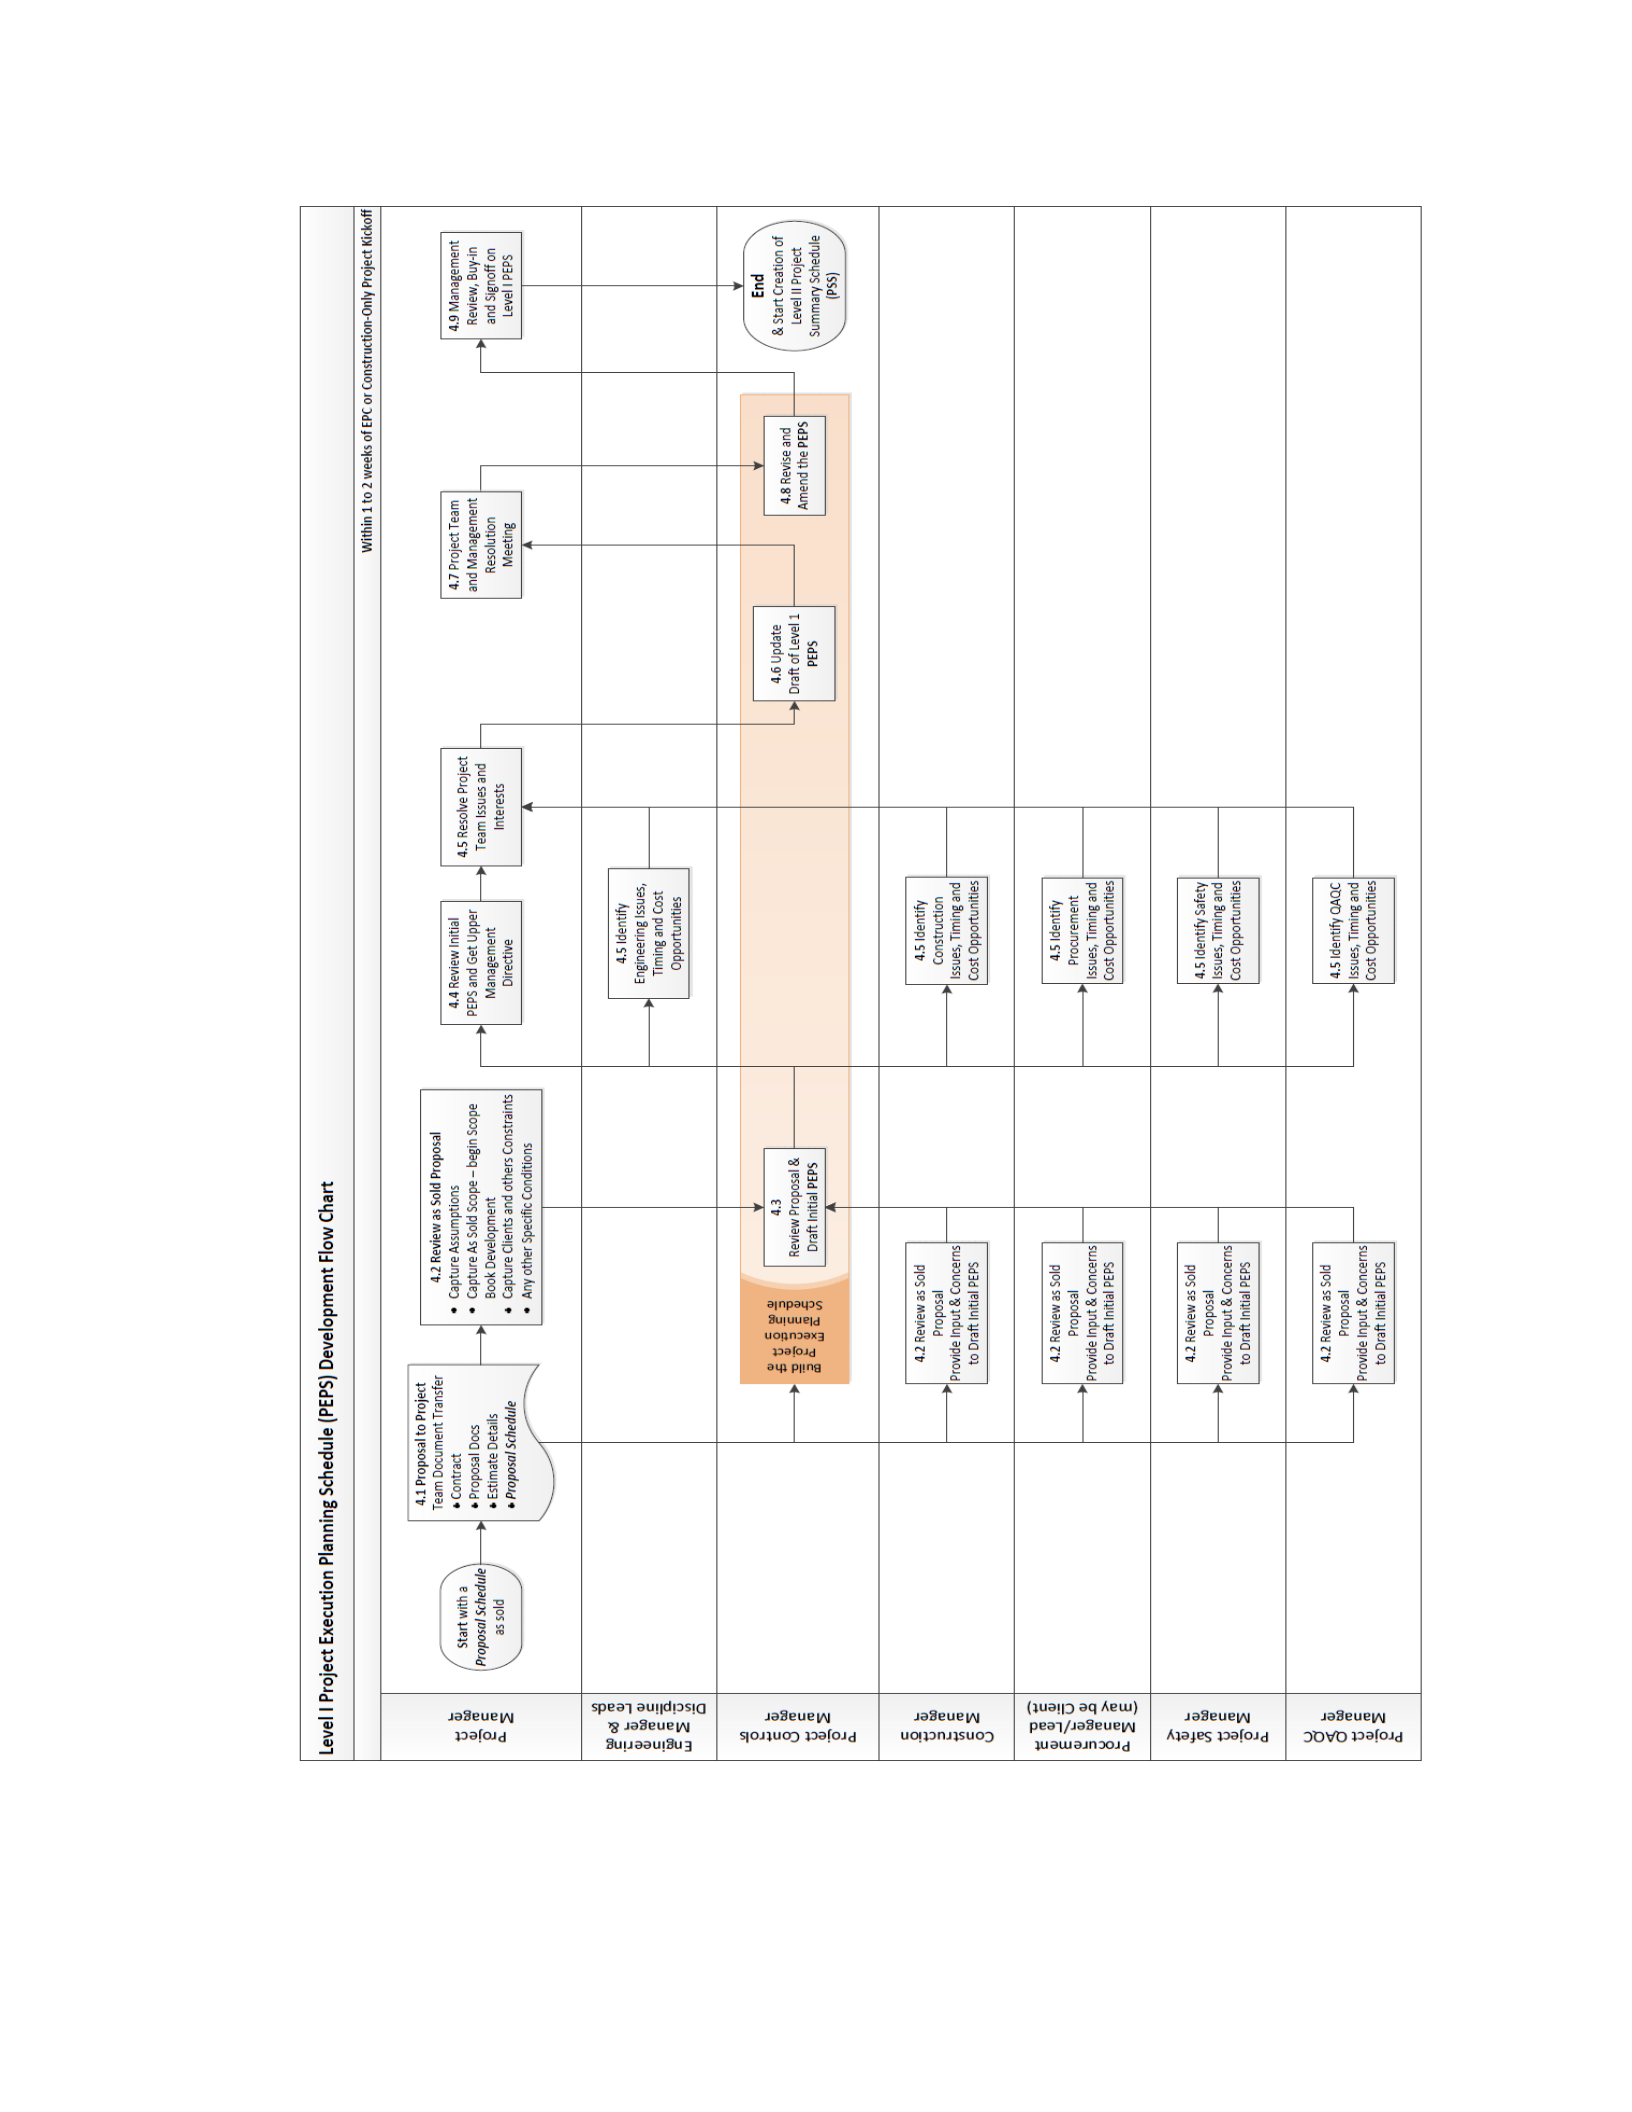
104
Figure 3.13 Level 1 project execution planning swim lane diagram

105
Conclusion
A new theory of project control and management system (PCMS) is presented which
classifies the PCMS into Desired State, Control Flow System, and Measurement System.
Two models are given which achieve real time proactive control during the construction
project delivery. The first model, “Real Time Visual Control Flow System,” provides real
time control at the workface where value is added; it provides real time control to the
development as well as the installation of work task packages. WTP is the level 4 smallest
building blocks of the project. It adds real value to the project and by providing control to
work task packages, the project is prevented from going off track in the first place. In
addition, model 1 makes lessons learned mandatory, which prepares the foundation for the
second model to work effectively. The second model, “Lean PCMS,” is to provide
proactive control by improving the project control and management system. It standardizes
the governance structure or the control system (work process procedure, tools, etc.) with
the help of lessons learned collected during model 1. Further, Lean PCMS model embeds
model 1 into the system a company uses to plan and execute a project. In the industry, it is
always a great challenge to implement or incorporate any improvement initiative into the
system of company responsibilities, processes, and supporting software. Model 2 also helps
in incorporating model 1 into the system and to continuously improve the PCMS as well
as model 1, which would be a part of PCMS once it is implemented by the organization. It
requires many (5-6) iterations of the application of model 2 to reach the Kaizen level
(defined as market dominating performance with sustained continuous improvement that
is faster than competitors); these iterations will also enhance the first model.

106
4. A CASE STUDY ON LEAN PCMS KAIZEN APPRAISAL STAGE
IN AN EPC COMPANY
Introduction
This chapter covers the appraisal stage of Kaizen to rapidly improve the PCS of an EPC.
The EPC company does heavy industrial projects and was facing project failure (per IPA
standards, exceeding budget and schedule by more than 25%). The total duration of the
Kaizen appraisal stage was 15 days. During the Kaizen appraisal stage, stakeholders related
to project controls participate in the Kaizen appraisal stage. Kaizen not only incorporates
concepts and practices already developed, but also facilitates in developing new concepts
which particularly fit the particular settings. During Kaizen, teams consider how to
customize existing or new concepts to meet company needs and embed them into their
system. This is done by creating or improving the way things operate to best deliver value.
Each organization is different due to the many variabilities of location, people, culture, size,
types, etc. When they use Kaizen, teams improve, innovate, and embed aligned
improvement into the system (work process, procedure, policies, governance structure,
tools, software, culture etc.) of the company in their own way. Kaizen not only improves
the systems a company decides, but also embeds (institutionalizes) that
improvement/innovation in the company’s system for delivering value. Further, Kaizen
improves the internal capacity (strength and motivation) of the company to make further
improvements in the future.
Kaizen is a step-wise incremental process for improvement. But a company must go
through Kaizen many times to reach the pinnacle of the industry. In addition, to maintain
this state of zenith, a company must sustain the process of Kaizen. This is why Kaizen must
be embedded in the company’s system. For instance, a company should have a policy that
before starting or after finishing a project or even several times a year, it must go through
the Kaizen process.

107
Overview of the Kaizen Improvement Cycle That Drives Rapid Improvement
This section describes the Kaizen appraisal stage and the Kaizen implementation stage.
The appraisal stage determines “What Is” and to move to “What Should Be”. The
implementation stage consists of five steps designed to determine to “How to Close the
Gap”.
4.2.1 The Appraisal Stage
This section describes the appraisal stage. The appraisal stage consists of eight (8) steps
designed to determine “What Is” and to move to “What Should Be”.
1. Assesses a company’s current operational excellence in order to give its
management a synopsis of the degree of performance gaps.
2. Measures the current state of performance and quantifies opportunities for
improvement.
3. Defines the context in which current opportunities for improvement exist in order
to drive success.
4. Allows management to make a very informed selection of the improvement
opportunities that will have the most impact toward closing performance gaps.
5. Creates an environment conducive to change, including visible and enthusiastic
support from management in the organization.
6. Drives the gathering of existing knowledge that will be used to close performance
gaps.
7. Leads to the preparation of six to eight “Situations-at-a-Glance.” These Situations
are structured to define: 1) “What Is,” e.g. the current Situation that exists within
the company which is causing less-than-reliable excellence in performance. 2)
“What Should Be,” e.g. defining a new or improved work process that would
improve the performance and/or its reliability and enhance the company’s path
towards market differentiating operational excellence. 3) The methodology for
closing the performance gap, along with highlighting the associated benefits and
required resources for gap closure.

108
8. This becomes the plan for the Implementation Stage, during which credible skill
and stakeholder analysis is facilitated to ensure firm gap closure.
4.2.2 The Kaizen Implementation Stage
This section describes the implementation stage. The implementation stage consists of five
steps designed to determine to “How to Close the Gap”.
1. Involves management selecting the top (approximately) three to six Situations to
pursue using Kaizen and adds more as confidence builds using Kaizen toward
closing performance gaps.
2. Entails management with the assistance of rapid improvement/Kaizen experts
selecting each Kaizen improvement team lead (typically spine of the company; see
reference in chapter 2) and assigning the team’s full skill and stakeholders to ensure
proficient performance of the work.
3. Training: At the beginning of Kaizen, improvement team members are assigned to
the work process improvement process and are trained on best practices, rapid
improvement principles, and methods specific to their assigned performance gap
closure task.
4. During implementation of Kaizen, develops solutions via the work of a full skill
and stakeholder team.
5. During Kaizen implementation, the team will try implementing its solution by
trystorming (fast-track implementation with further improvement as needed) of the
new or improved work process on a project. If the necessary project specific
conditions are not currently available, the conditions are simulated with the
improved work process using the skill and stakeholder team. Upon success, the
team will pilot the new or improved work process with impact data collection. Upon
successful piloting, the team will then seek approval for deployment or establish
criteria for further improvement. Data collection is a follow-on in that metrics are
to be collected during the appraisal stage and before the improvement effort.
Current and ongoing metrics will continue toward monitoring the path to

109
operational excellence. The metrics will also augment management decision-
making and future marketing of the company’s differentiation due to improved
operational excellence.
4.2.2.1 Rewards of Kaizen Implementation stage
Over all Kaizen implementation stage rewards work process improvement in the
following ways.
1. Facilitates development and implementation of new or improved work processes
and provides training, experience, and confidence in team members and their
executive leaders for rapid improvement.
2. Implementation of Kaizen creates improved standards and deployment policy. It
supports competency certification criteria and development of employee training
modules and testing.
3. Establishes the company’s organizational ownership of the new work processes and
authority and responsibility for their continuous improvement.
4. Launches the company’s implementation governance policy, auditing, and
deployment across the company’s divisions with transparency for the company’s
clients (where appropriate).
5. Validates full deployment and operational excellence for rapid stepwise
improvement.
6. Offers a repeat cycle for development of best practice work process standards for
all project stages from the business case, pre-FEED (FEL 1 and 2) and FEED (FEL
3) through EPC and startup while greatly improving client capital costs, operations,
and maintenance.
7. Creates awareness and celebrates success.

110
Case Study
The author was involved in a project which involved the Kaizen appraisal stage in an EPC
company. He worked on site under the guidance of industrial consultants and lean experts
on the project and thus was a part of the consultant team. (Due to confidentiality, the name
of the EPC company is not given).
4.3.1 Overview of the Appraisal Stage
This section describes the overview of the appraisal stage performed at the company. It
consists of remote work and on-site work.
4.3.1.1 Remote Wok
1. Consultants requested and received information from the EPC. A list of the
requested information is attached in the appendix (A).
2. Consultants reviewed the EPC’s past performance, the improvement created, and
the challenges faced.
3. Consultants facilitated the EPC executive in the development of a “The charge
statement” to the EPC organization /employees that an improvement initiative was
conducted needing their honest, contextual, and comprehensive input with no
cordial hypocrisy.
4. The charge statement: Reasons for the Kaizen initiative by EPC based on
performance data - how it will involve and benefit them as well as improved
prospects for success. The intent was to prepare a summary review of company
strengths and successes as well as market based challenges and opportunities.
5. EPC with the assistance of EPC executives established the appropriate executive
sponsorship of the initiative (initiative means the Kaizen appraisal stage initiative
by the company). The result was the formation of an initiative Steering Team by
the EPC, which provided executive guidance and oversight of the consultant
services and supporting the EPC effort.
6. Pre-Read of Kaizen workshop methodology was sent to the steering team by the
consultant. This Pre-Read is attached in the appendix (B).

111
7. Consultants worked with the initiative Steering Team to create a roster of the EPC
personnel who were to be interviewed in the appraisal phase and participate in
workshops for reviewing and prioritization of opportunities.
8. Consultants requested a confidential review of the EPC reports associated with
recent projects, prepared and provided “pre-workshop” documentation (a list of the
documents attached in the appendix A; actual documents cannot be attached due to
confidentiality clause) to the initiative Steering Team and for use with other
participants in the initiative. This documentation provided consultants with an
overview of the work process improvement methodology.
4.3.2 On-Site Work
On-site work by the Kaizen appraisal stage consulting team is described below.
1. Consultants sent representatives to the EPC’S headquarters.
2. The kick-off meeting was initiated with the steering team along with a kick off
presentation with the skills and stakeholders of the EPC.
3. During the kickoff presentation, the executive “charge” was presented to the EPC
organization by the executives of the EPC along with the consultants.
4. Skill and stakeholder sets were selected by the initiative Steering Team for the
extraction interview and workshop to document, “What Is,” “what is the pain,”
“What Should Be,” and “How to Close the Gap.” Key personnel included in the
extraction interview and workshops were executives, senior management, project
management, (including superintendents, general foremen and foremen), as well as
project controls, HSE and other project services, subcontractors, and department
leaders.
5. The pre-read for the extraction interview was sent to the selected skill and
stakeholders to prepare them before participation for the extraction interview. The
company’s employees who were chosen to serve as steering team members and
representative subject matter experts (SME’s) and stakeholders in the Operational
Excellence Initiative received interview preparation questions to pre-read and

112
explore Situations with colleagues and peers they would represent in the interviews
and workshop(s). This pre-read is attached in the appendix in (C).
6. Extraction interviews were done one on one with consultant attention to maintain
recognition or confidentiality of sources as desired and according to the disclosures
made by each person being interviewed.
7. The interviews and workshop(s) are the gathering mechanisms for the existing
knowledge that will be combined with the latest principles, methods, and tools
during implementation in order to actually close performance gaps.
8. Collected data and information about what is done well that should be continued
(not lost) in the EPC’s efforts to improve, and “concerns” that include, but go
beyond, lessons learned generally resulting from workshops in a public setting.
9. This allowed participants to voice any concerns they had with any element of the
EPC’S Capital Project Delivery work processes, supporting structures, and systems.
Exploration of concerns encompassed policies, procedures, standards, other
documentation, methodologies, etc.
10. Consultants sorted the collected interview information into items which could be
improved by individual disciplines or departments making the improvement, and
which could best be achieved by the involvement of multiple disciplines,
departments, or even companies. To enable rapid improvement, all but the easiest
to implement was consolidated into Situations-at-a-Glance, hereinafter referred to
as “Situations” to rigorously develop and refine the reasons, challenges, and options.
11. The extraction workshop was conducted by consolidating diverse skills and
stakeholders of cross functional teams. Each team worked on different Situations
in the workshop. The workshop evaluated knowledge gained from positive and
negative experiences, which produced inputs for further analysis of root sources of
the EPC’s performance on capital projects.

113
4.3.3 Engine of Kaizen Appraisal stage
The engine of the improvement cycle leads to operational excellence begins with
interviewing a company’s key personnel and ramps-up in the workshop(s) that follow. Key
steps in the Extraction Workshop(s) are as follows.
1. Operational Excellence Teams: Following the extraction interviews, as described
above, the company’s employees who are chosen to participate as skill and
stakeholders in the Kaizen Initiative come together with consultants. The company
employees are placed into several cross-functional teams with a lead/scribe (taking
detailed notes) for each and consultants facilitated the teams.
2. Extraction Workshop(s) Directions: All cross-functional company teams met to
review selected Situations. This meeting was facilitated by consultants to help
participants validate, detail circumstances, quantify impact, suggest improvement
methods and Kaizen teams for each Situation-at-a-glance. Directions were provided
to “think big,” out-of-the-box, and to think beyond the present, looking ahead with
appropriate consideration for what is behind them in their experiences with the
company (their rear-view mirror).
3. Begin Extraction Workshop(s): The cross-functional company teams addressed
Situations-at-a-Glance (which came from the interviews), validated them, assured
detailed circumstances were provided, quantified the impact, and suggested
improvement methods. They may suggest Kaizen implementation teams for each
Situations-at-a-Glance and develop additional Situations-at-a-Glance where
appropriate. Consultants provided intermittent facilitation by participating with
teams and also rotated among teams, helping them remove barriers and stay on
track. Team leads/scribes helped their team to complete the steps as the consultants
move in and out. Teams presented their Situations at the conclusion of the
workshop(s).
4. During the workshop, the Situations were reviewed in a structured manner to
evaluate and extract additional learning and how it might be used going forward.
5. The Situations were illustrated with lessons learned: 1) Background (what
happened), 2) Root Cause (what specifically caused it) and 3) Recommendation

114
(how to repeat positive-impact lessons learned and how to avoid negative-impact
lessons learned).
6. Template of “Situations-at-a-Glance” given to the team participated in the
extraction workshop
7. Consultants worked individually and collectively with those who participated in the
interviews and workshops toward editing the collected lessons learned and
Situations to ensure high accuracy in what is developed.
8. At the EPC’S offices, the consultants facilitated a workshop with the initiative
Steering Team and other EPC participants, selected by the Steering Team. This
workshop reviewed the Situations and collected further lessons learned from the
EPC’S past capital projects.
9. The consultant representatives, reviewed the 6 to 8 developing Situations and added
related experience and research results to expand the vision of What Is at other
organizations in and beyond the EPC industry, What Should Be, and options for
improvement-team consideration on How to Close the Gap.
10. Kaizen workshop(s). The consultant reviewed the results with the company steering
team for alignment and to facilitate prioritizing, staffing, and scheduling the
implementation phase of Kaizen to address them.
11. The Situations were combined, as necessary, and appropriately ranked by workshop
attendees in terms of 1) high impact to improvement needs, 2) degree of difficulty,
3) cost (order of magnitude, benchmarking), and 4) what/which if improved first,
would make it easier to improve something else that is important to implement.
Consultants identified the highest priority 6 to 8 “Situations-at-a-Glance” which
were then fully developed for the Kaizen implementation stage.
12. Using this ranking, and in consideration of the EPC priorities and resources, the
initiative Steering Team selected the top 6 to 8 Situations to pursue with the next
steps.
13. At the EPC’s offices, the consultant representatives, (specific to the top 6 to 8
Situations), reviewed the EPC’s existing standards, procedures, directives, norms,
job descriptions, field and project management manuals, and other governance
documents and protocol. They performed a gap analysis, for these 6 to 8 Situations,

115
to identify content, scope, or sequence-related variance between what is provided
to projects and what would be needed to address the Situations. This information,
together with the consultant gap analysis, will be attached as exhibits to the related
Situations.
14. Consultants formalized the information collected into 6 to 8 Situations which will
be the focus of presentation at a meeting between the consultants and the EPC to
facilitate the initiative Steering Team toward further alignment of the EPC priorities
and resources, for the following.
• Immediate improvement of simple solutions
• Selection of the EPC rapid improvement team leads and full skill and stakeholder
representatives for rapid improvement Kaizen using each Situation
• Decide on the sequence and timing for rapid improvement Kaizen
4.3.4 Template of Situation-at-a Glance
This template was given to the team participating in the extraction workshop. The team
worked on the template during the extraction workshop. Skill and stakeholders from
various departments such as engineering, construction, project control, scheduling,
estimating, risk management, procurement, etc. participated in the workshop.
This integrated and diverse team worked on the template together. They discussed and
described “What Is” the current state of PCS, “evidence of what is”: Evidence from the
experience with previous projects such as everything going out of sequence; “What Should
Be”: What participants think should be the state and practices of PCS, “How to Close the
Gap”: How they think they can close the gap by including best practices, methods, and
principles. All this was documented by the participants.

116
Table 4.1 Template Situation-at-a-Glance
4.3.5 Expanded Version of “Situations-at-a-Glance” on Integrated PCS
Consummated by Project Control and Lean Experts
(Due to confidentiality, the edited version of the Situation-at-a-Glance is presented below.)
This is one of the Situations among the 8 Situations expanded by the consultant team.
Author is presenting this because this thesis scope is limited to the advancements in PCS
by Kaizen.
(Note: Following is a sample Situations-at-a-Glance, presented here as experience of the
industrial consulting team and several companies. Any resemblance with any single
company is not intended and is coincidental.).
Team,
Situations-at-a-Glance have the following categories:
Management Charge: The upper management personnel to whom this team will report
regarding the Kaizen initiative
The Spine Leader: Member of the spine who leads the development of this Situation
and the Kaizen Implementation Stage.
Skills and Stakeholders: those who participate in the development of this Situation
and the Kaizen Implementation Stage.
What Is: The current Situation.
Evidence of What Is: Proof of specific “incidents” that give credibility to What Is.
What Should Be: The ideal Situation in the future.
What Is the Pain: (it is not just the pain of closing the gap, but it is also the pain of
leaving the gap open or partially open or having a gap closure strategy that is not timely,
not wholly effective and the costs and degree of difficulty outweigh the benefit.
How to Close the Gap: Actions required to close the gap.
Best Practices, Principles and Methods: Specific to closing the gap
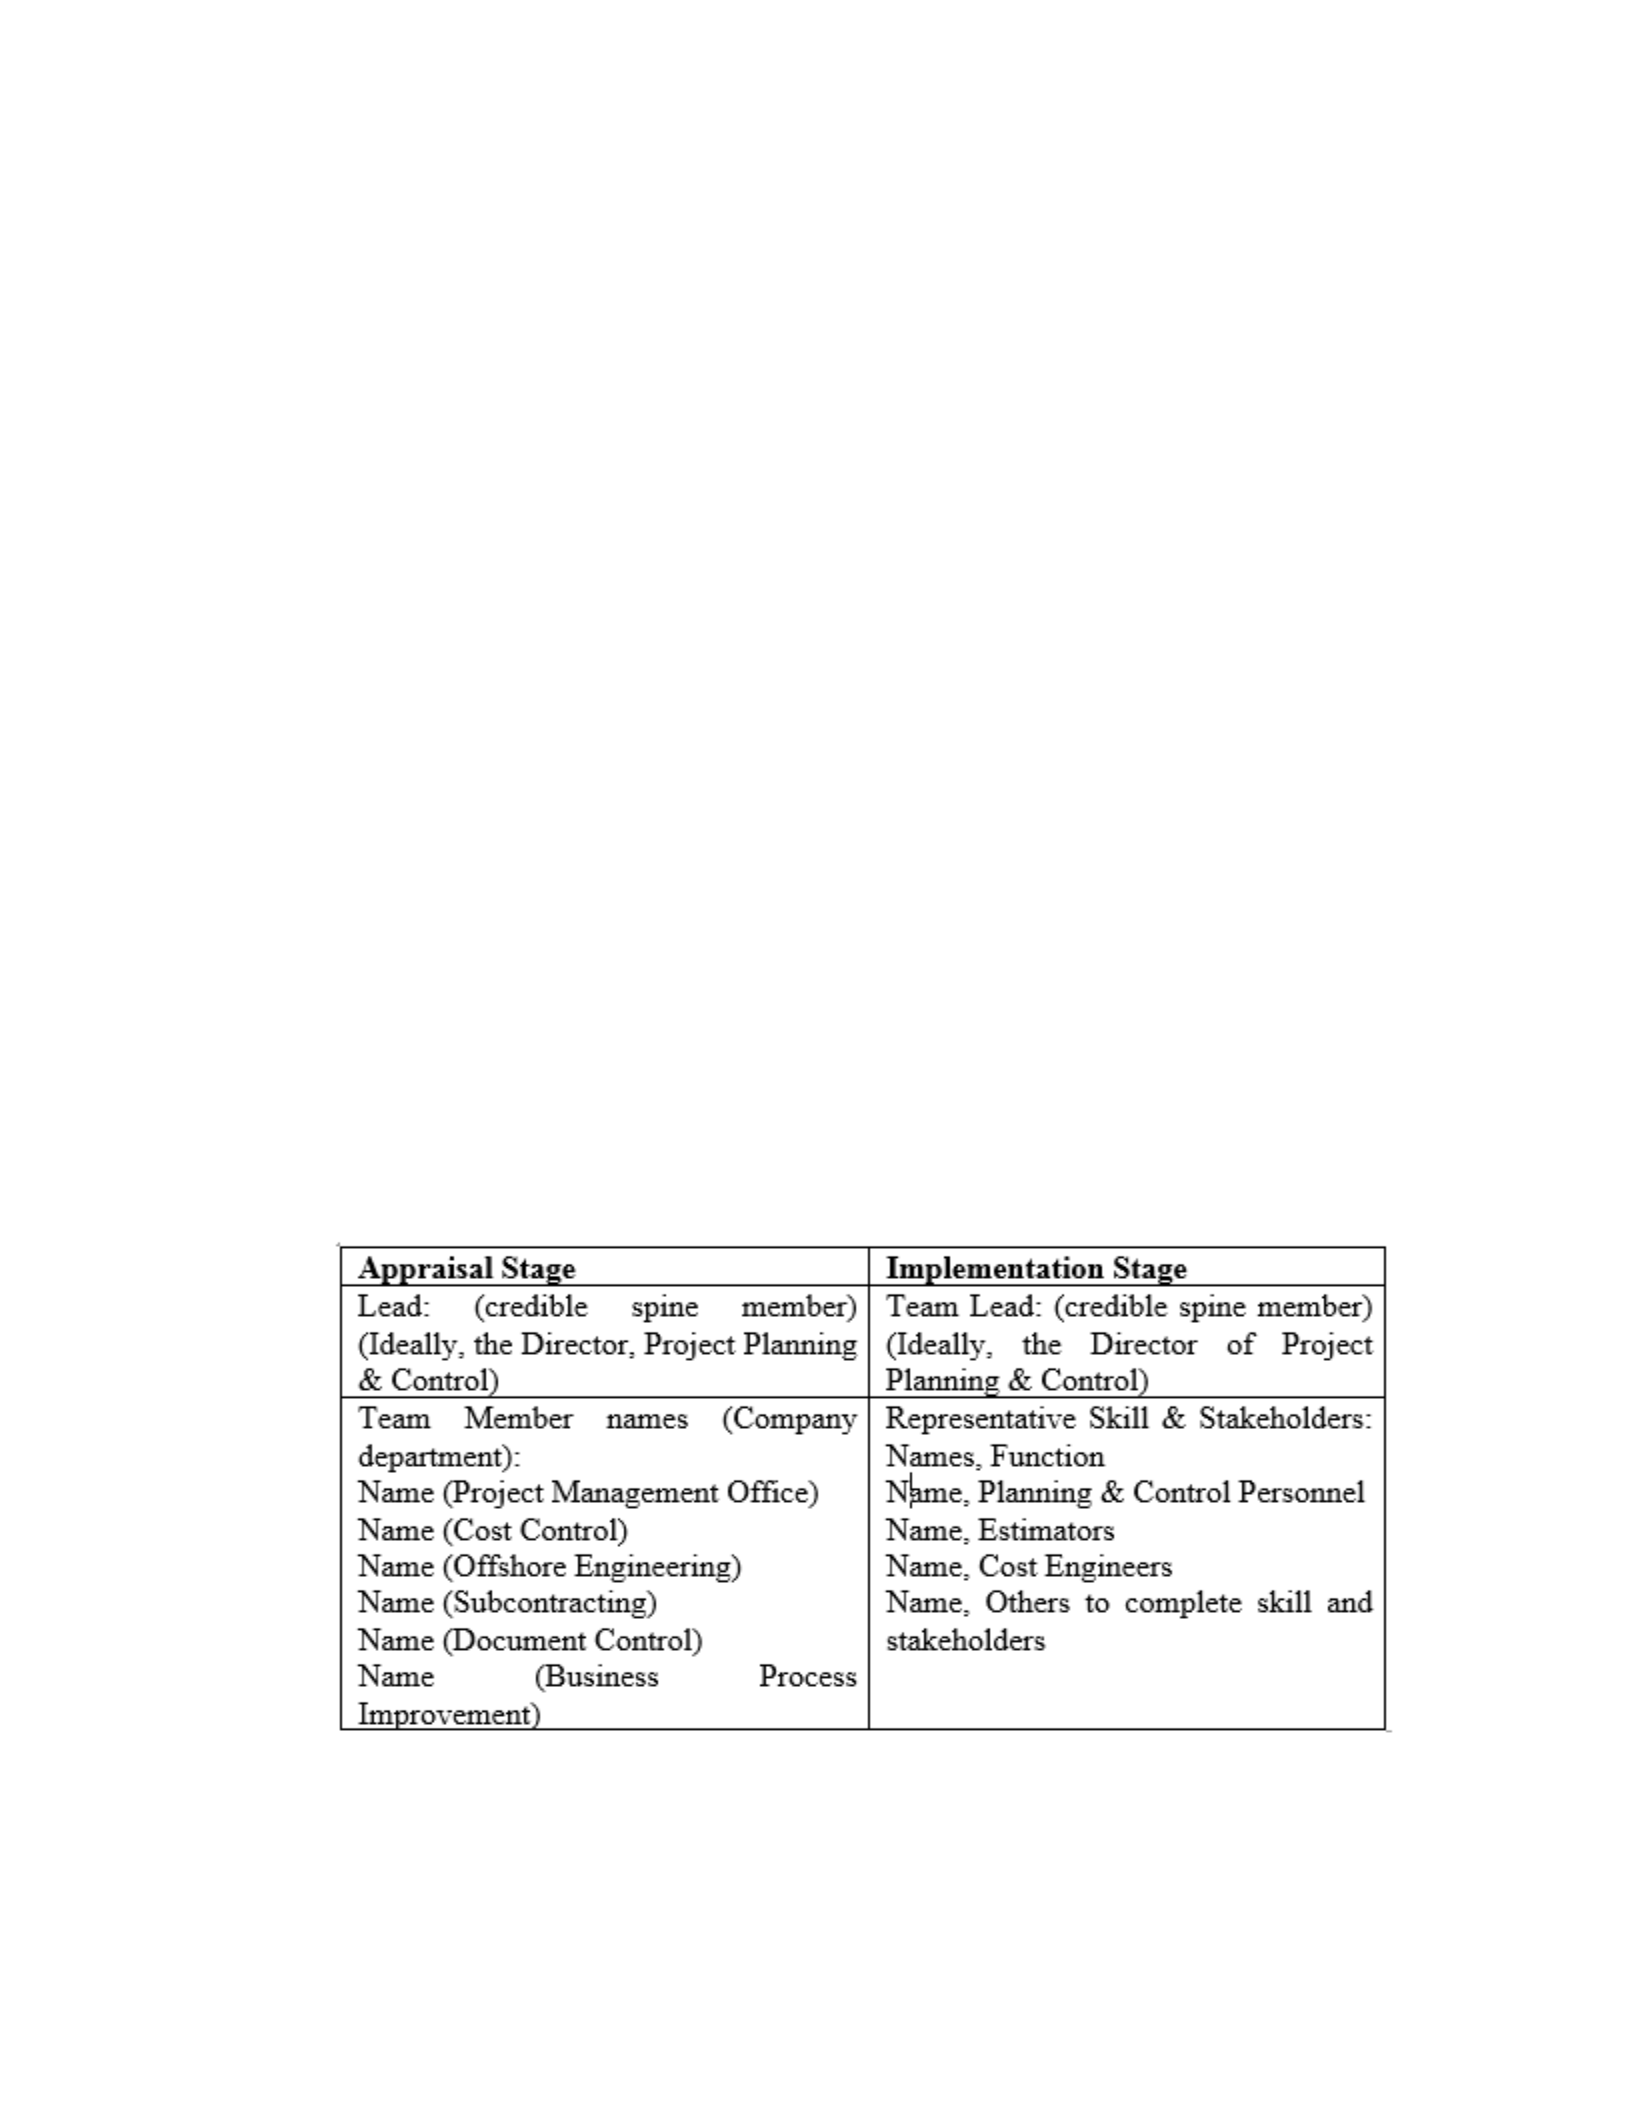
117
4.3.5.1 Executive Charge
1. Derive the functional project controls organization.
2. Derive aligned work process standards for project controls as defined herein (to
reliably achieve What Should Be) with all supporting documents (sample
deliverables, input templates, user criteria for supporting software systems, gap
analysis with existing software systems) and recommendations for filling software
gaps.
3. Derive project controls position standards and project controls related task items
for the people interfacing with the project.
4. Trystorm performance simulation on [Name of] project, during Kaizen.
5. Pilot on [Name of] project, beginning 2 - 4 weeks after Kaizen.
6. Deploy standards with governance within 3 - 6 months following Kaizen.
4.3.5.2 Teams
Following table 4.2 shows the position involved during Appraisal stage and
implementation stage.
Table 4.2 Teams Selection during Appraisal Stage and Implementation Stage

118
4.3.5.3 What Is
Following table 4.3 shows the sample of What Is
Table 4.3 Sample of What Is
4.3.5.4 Evidence of What Is
Following table 4.4 shows the sample of Evidence of What IS
Table 4.4 Sample of Evidence of What Is
1. No field progress management system/protocol/process.
2. No adjustment to progress for scope growth consideration.
3. Project info not integrated.
4. No detailed progress measurement for each subcontractor.
5. Schedule did not include engineering discipline input / deliverables.
6. No scheduled workshop conducted prior to finalizing the baseline schedule.
7. System lacks use of a production unit for control, i.e., the task package in FEL,
E, P, C.
8. Work face utilization is not optimized for resources or sequence.
9. CPM uses relationships to establish desired sequence, activities contain buried
contingency, and multitasking is pervasive, especially in engineering.
1. Poor cash flow forecasting due to lack of input from projects
2. Schedule delays
3. Cost overruns
4. Less project profitability

119
4.3.5.5 What Is the Pain
Following table 4.5 shows the sample of What is the Pain
Table 4.5 What Is the Pain
4.3.5.6 What Should Be
Following table 4.6 shows What Should Be
Table 4.6 Sample of What Should Be
1. Developing new integrated project controls function and supporting systems
2. Revisiting work process and procedures
3. Investing in establishing or improving the existing systems
1. The EPC has an approach to project controls that should be aligned with
industry best practices and basic fundamentals of project controls. Investment
in fundamentals will pay for itself several times over.
2. If project controls are deployed manually, there will be higher diligence required
and commitment to a more labor-intensive process versus deploying controls
using an industry software solution.
3. Software systems require significant upfront investment but have the advantage
of building a solution once and using it many times in the future. Software
systems together with expert interaction also provide a platform for continuous
improvement.
4. The EPC should have a project controls organization with the organizational
clout that is peer-to-project directors/managers and reports directly to a
controlling director level, or higher, in the organization (e.g. VP Director,
Finance).

120
Table 4.6 continued
4.3.5.7 How to close the gap
Following table 4.7 shows the list of How to Close the Gap
Table 4.7 Sample of How to Close the Gap
5. The project control function is to deliver to task package level planners all the
information necessary to package from level 3 scheduled activities and
sequence the work face planning to optimize task package sequences.
6. Physically completed task packages will drive the statusing, earned value, and
improvement necessary to achieve and sustain operational excellence.
7. Achieve performance-at-the-source via all task leads simultaneously working
together.
8. Critical chain principles should be used, enhancing CPM.
1 Create a Project Controls Organization
2 Ensure Skills and Experience
3 Ensure Codified Project Control Data
4 Estimate for Control
5 Project Scope WBS-Work Package
6 Use Physical Progressing
7 Drive Detailed, Well-Communicated Project Reporting
8 Keep Clear, Concise, and Reliable Historical Data
9 Strong Estimate Validation Must be Deployed:
10 Project Team to Hold Workshop to Communicate after the Kick-Off-Meeting
11 Adopting Advance Work Task Package Concept Early in the Project
12 Construction Driven Schedule
13 BOQ Update
14 Establish Project Change Management System

121
Table 4.7 continued
A brief description of the above list to How to Close the Gap is given below.
4.3.5.7.1 Create a Project Controls Organization
The EPC must create a project controls organization with the organizational clout to be
peer-to-project directors/managers who report directly to the operations director. Define
the function and core responsibilities for estimating, cost engineering, planning/scheduling,
and risk groups within project controls. Align and identify key deliverables and skill and
stakeholders from these groups against the project lifecycle (work process mapping). Work
with skill and stakeholders to establish governance.
Detail out functions including the following:
1. The estimating function core purpose is to prepare operations cost estimates to
support proposals and change orders.
2. The cost control core function is to manage the project operations budget
(operations cost estimate for an awarded project) and to coordinate progress
measurement and reporting by all project functions.
3. The planning/scheduling core function is to prepare proposal schedules with input
from all project functions and then to manage/steward/maintain the project
schedule following award and during execution with input and support from all
project functions, including work task packaging and work face execution planning.
The latter is not owned by project controls but forms the basis for control and
progressing the project.
15 Forecasting
16 Parallel Breakdown structure
17 Coordination
18 Integration
19 Progressing
20 Effective and Concise Reporting

122
4. The risk management function (identification and treatment) begins in the proposal
phase to provide a basis for establishing contingency in the operations cost estimate
and continues after award during execution.
4.3.5.7.2 Ensure Skills and Experience
The EPC must assess their existing capability in estimating, cost engineering, and
planning/schedule engineering. These resources need to be quantified in terms of
certification, years of experience, and track record. They must assess gaps and attract new
talent as needed.
4.3.5.7.3 Ensure Codified Project Control Data
All systems, automated or manual, must use the same codified schema to allow for basic
data and analysis of data to emerge. Failing to do this first and most important step will
result in a poor system of project controls. Estimate (WBS/CBS/OBS), Schedule
(WBS/CBS), Cost (CBS), Execution (OBS), and Supply Chain (WBS/CBS/OBS) and
Scope (WBS) need to be codified using an integrated coding schema.
4.3.5.7.4 Estimate for Control
Estimates are frequently set up to produce a final number, and not enough are set up to
control the project during the execution phase. However, the industry best practice is that
estimates need to be structured to support project controls. They must be organized so that
all cost categories are separate and can function as a basis for control. This means following
a good work breakdown structure and a well-established code of accounts that should be
established early and cover the entire project scope. An estimate which is designed for
controls provides an excellent basis for evaluating subcontractors’ proposals. By breaking
down the estimate pre-submission to bid puts the project controls organizations in a
position to challenge some areas of a subcontractor’s bid or bring about discussion in other
areas.
A common WBS must be deployed. As a fundamental practice, there is a best practice
approach of a cost and schedule developed around a common work breakdown structure
(WBS). Part of this is estimating for control by project scope. Based on each scope,
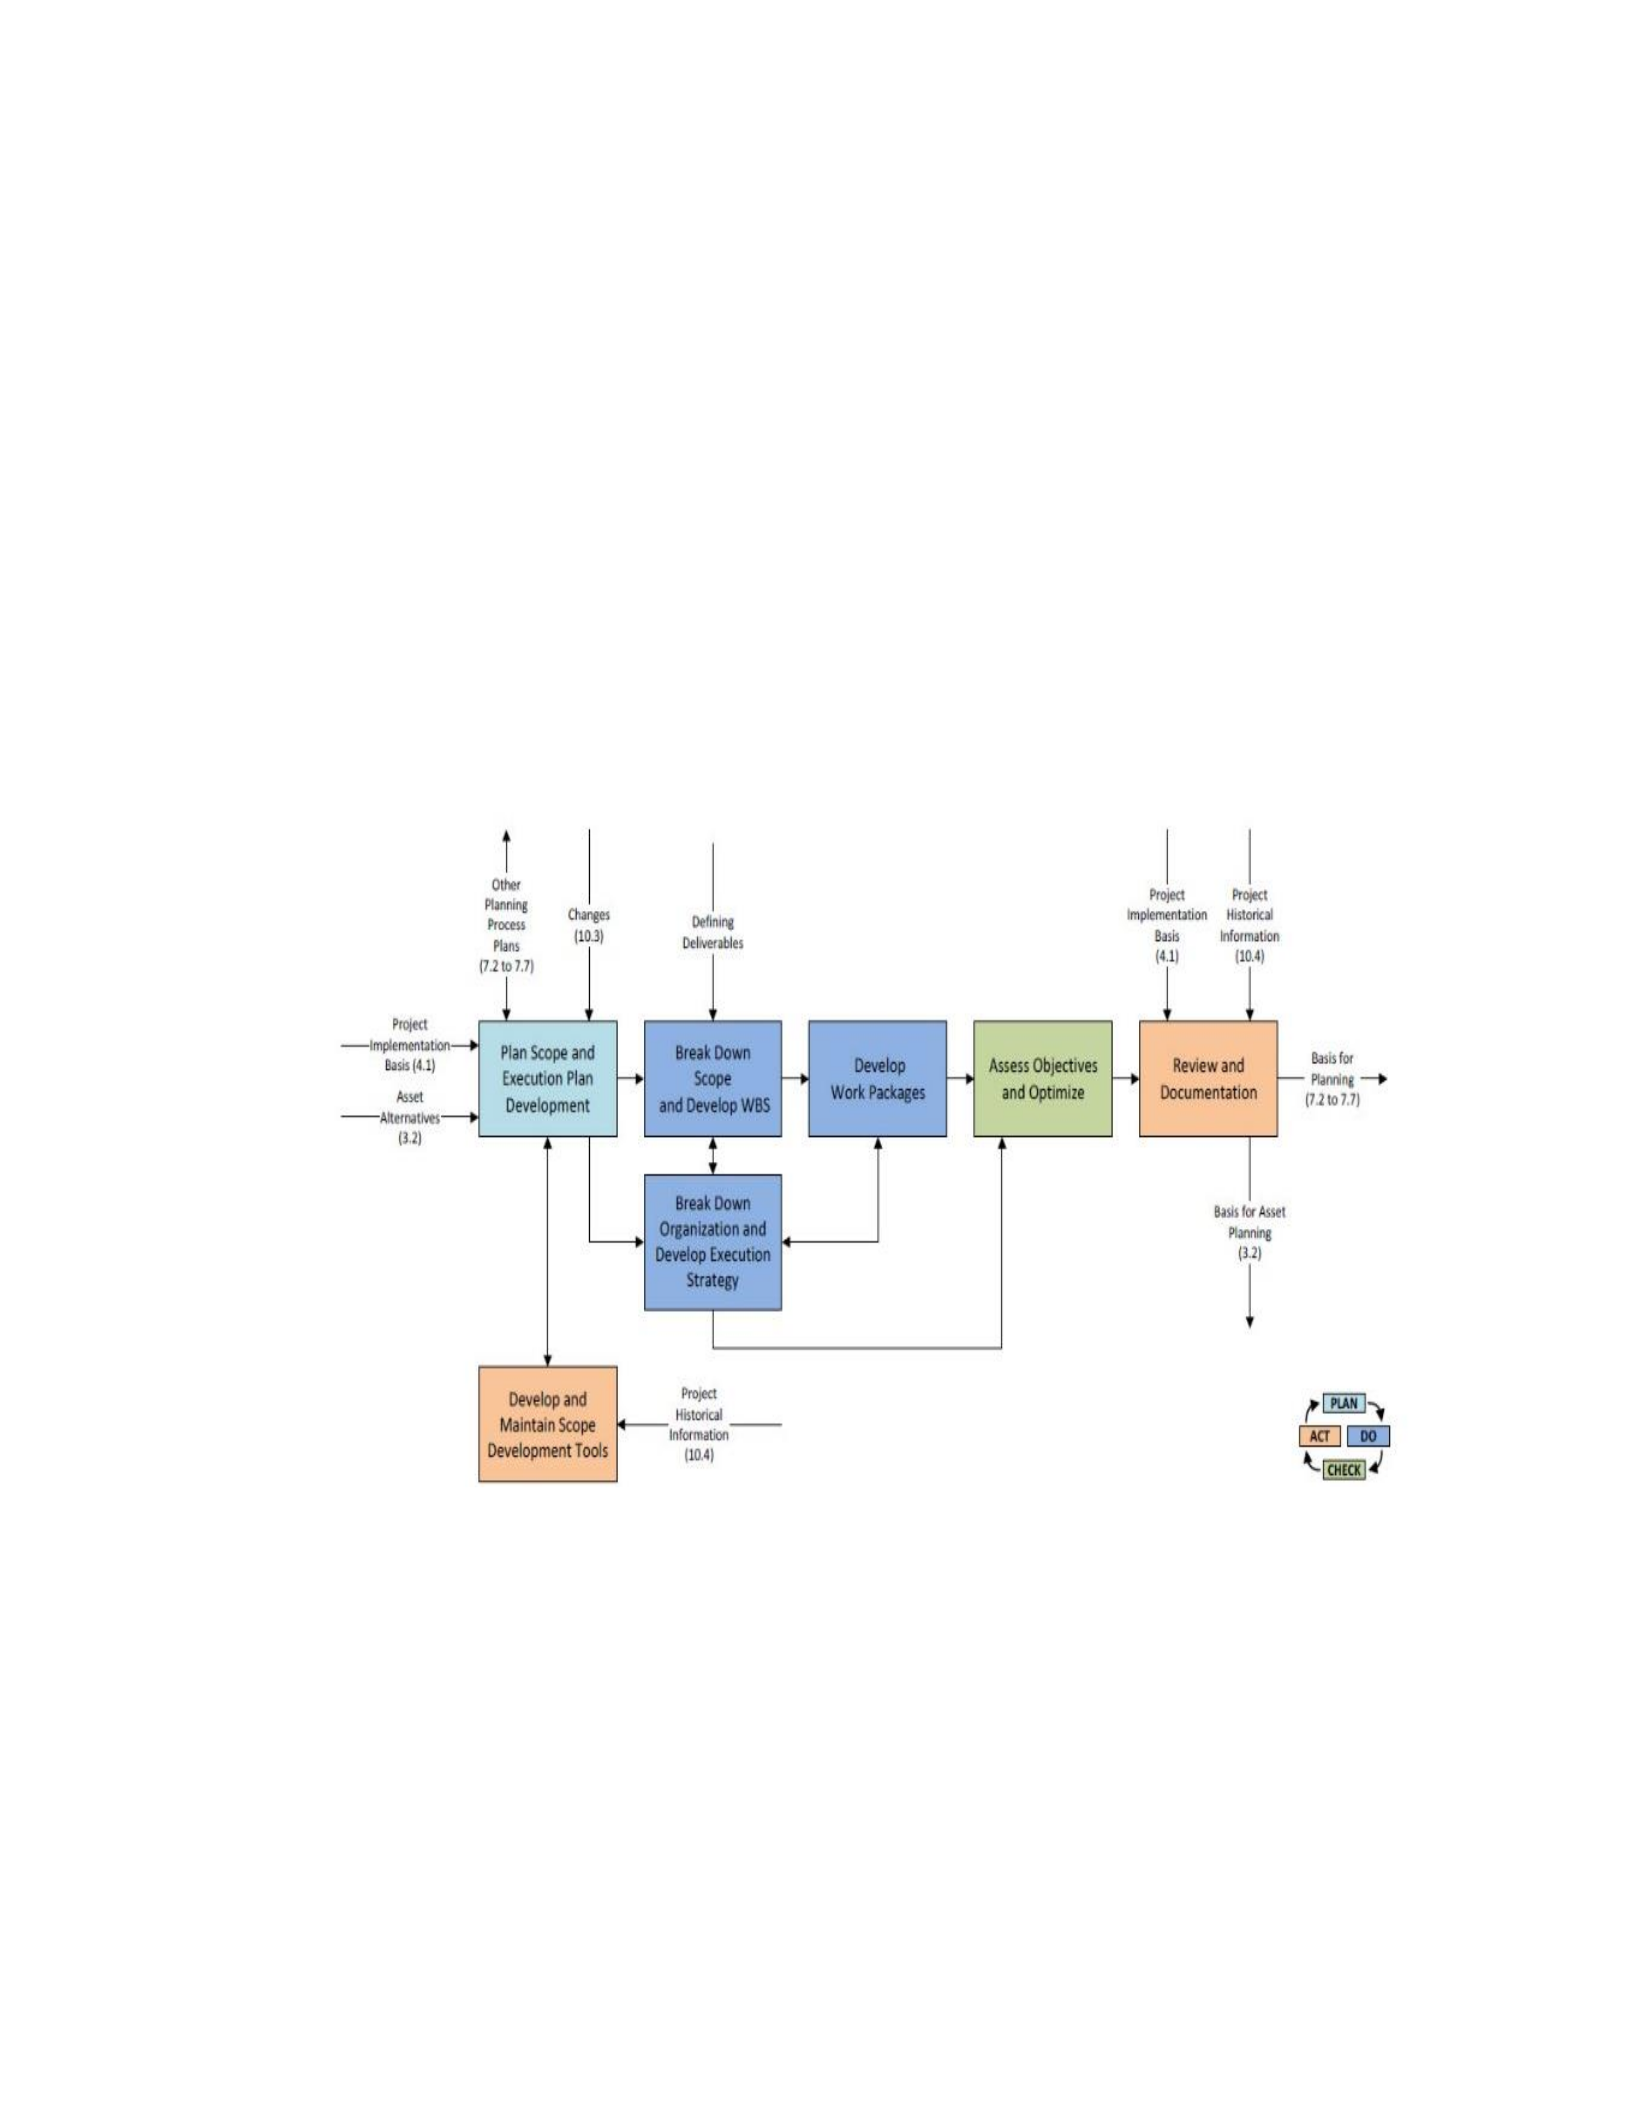
123
building a work breakdown structure that breaks the project down into successively finer
gradations of specific elements or deliverables to levels 2 or 3 of the WBS is often used to
release major segments of work called Work Packages. Tasks at level 4 planned to
complete level 3 activities are here designated as task packages. Work packages are the
basis of building the project schedule and the project cost estimate with the obvious
objective of having the schedule and the cost estimate aligned, perhaps not line-by-line but
certainly at the work package level. This way, we can implement a robust controls process
during execution where we can monitor both the project schedule performance on the work
package level and the cost estimate on the work package level. Below are a few illustrative
examples of best practices.
Figure 4.1 Best Practice Process Map for Project Scope and Execution Strategy
Development
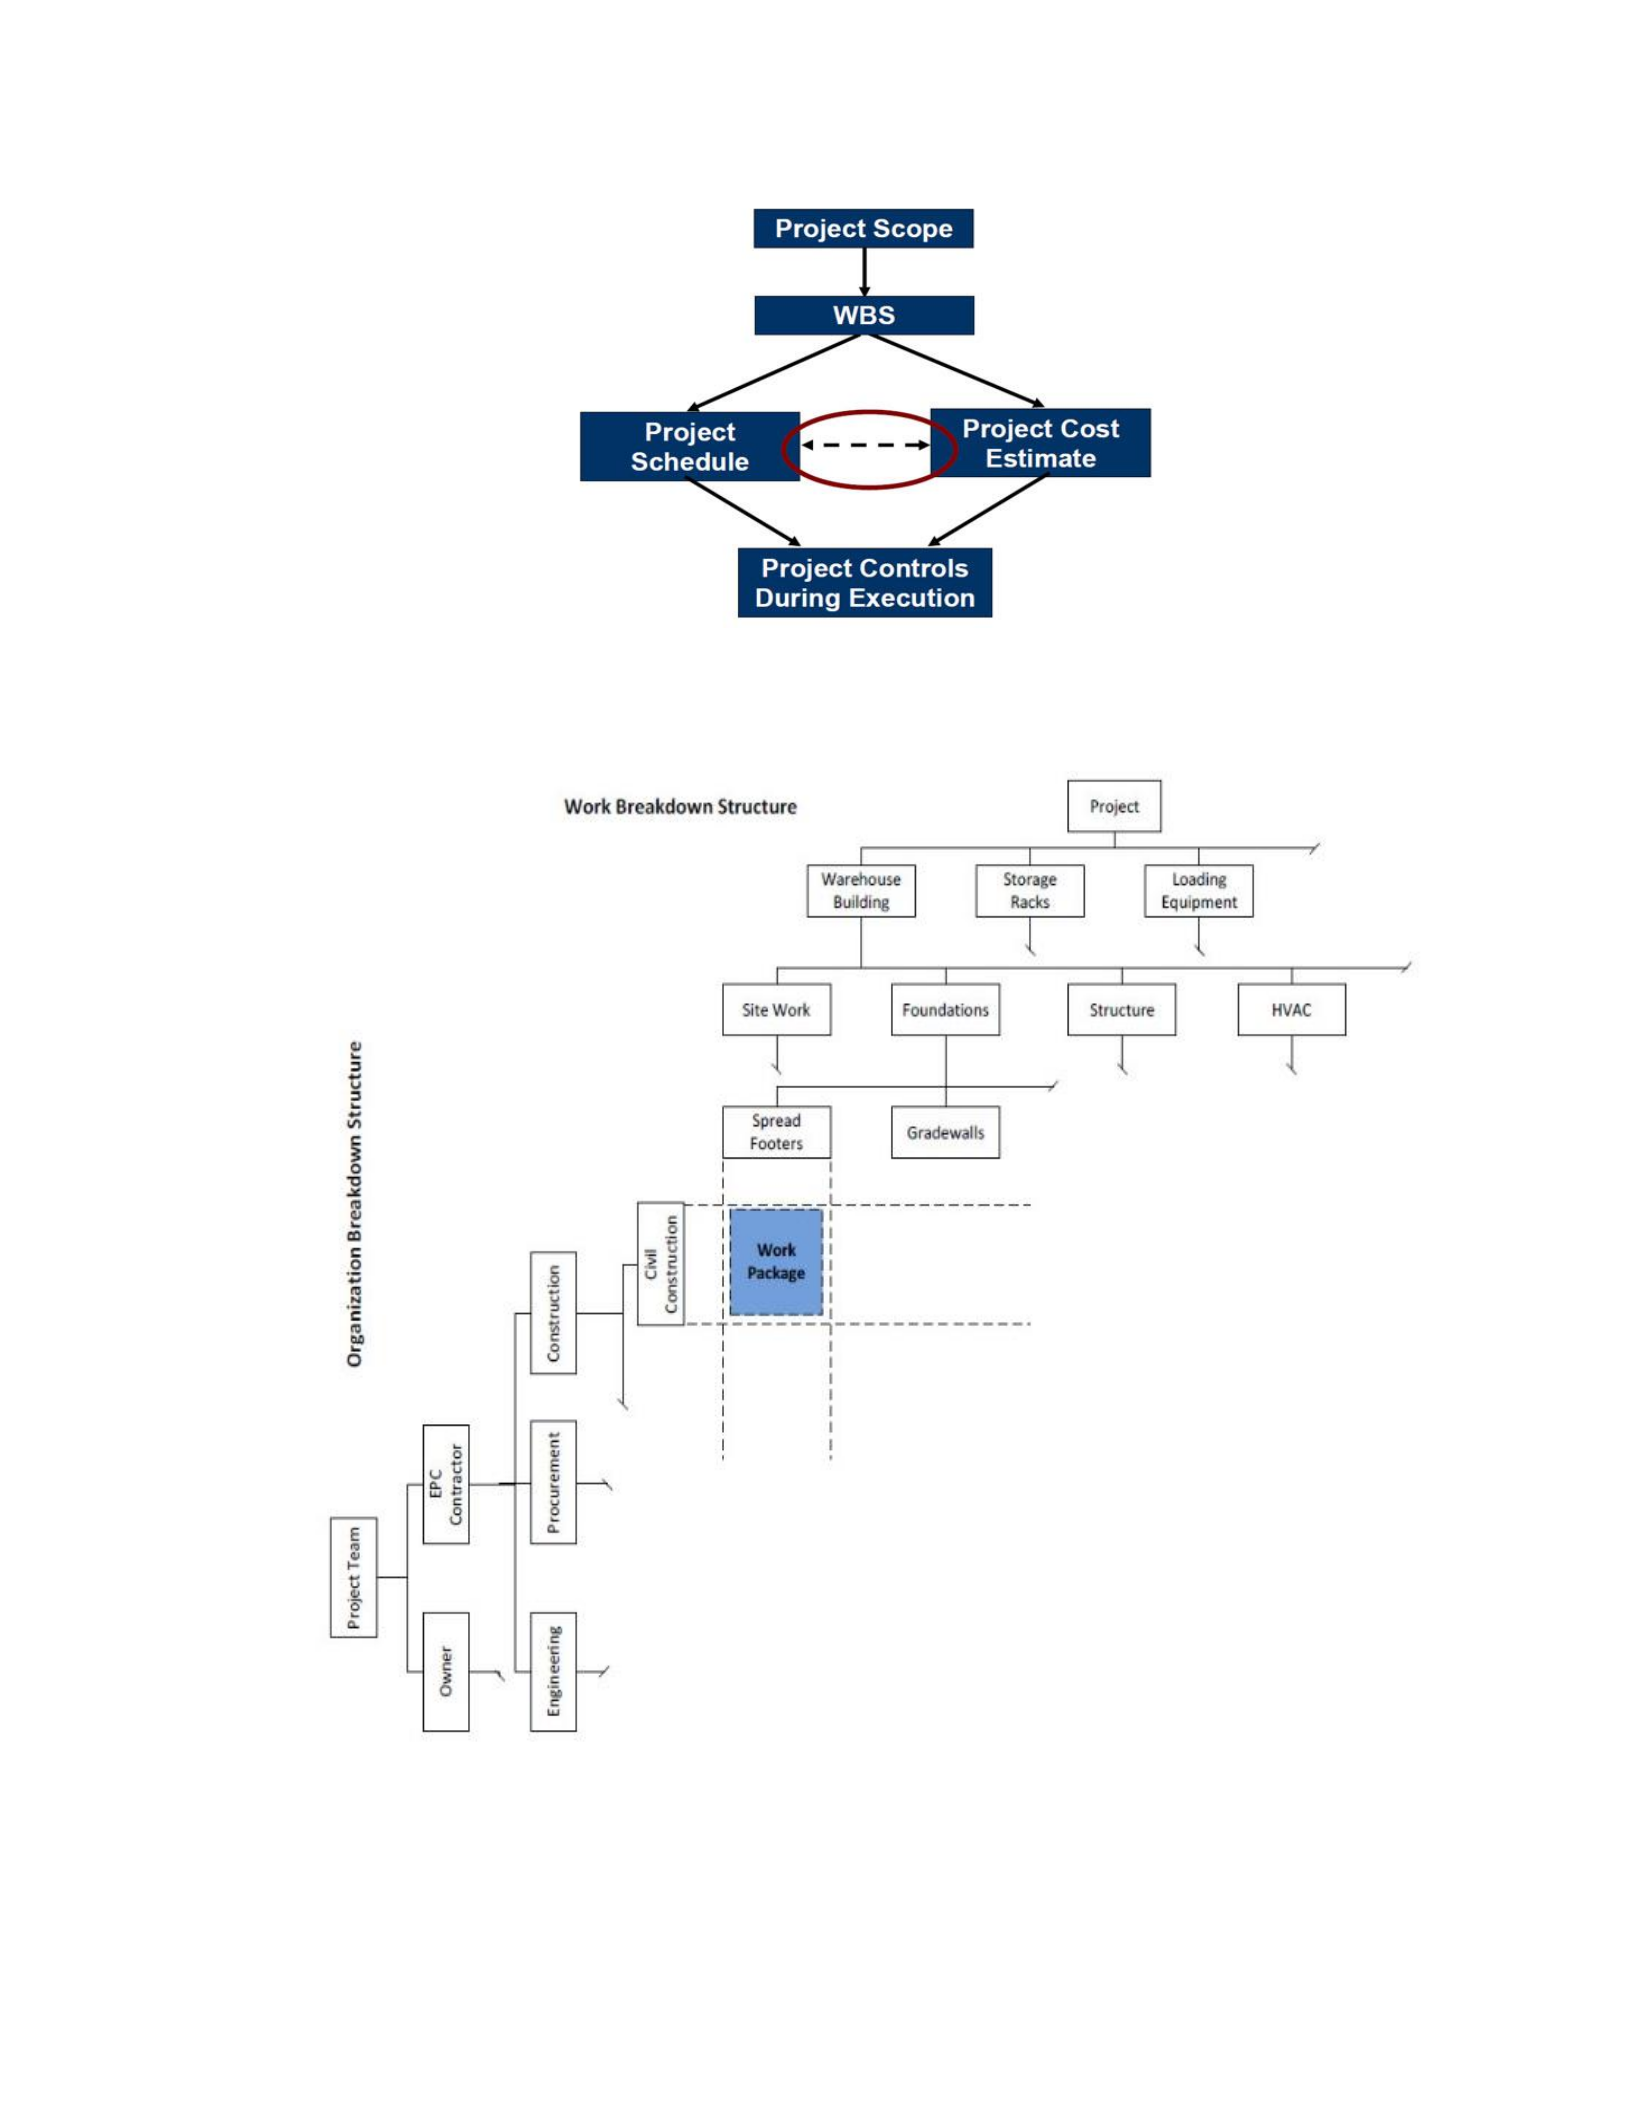
124
Figure 4.2 Best Practice Project Scope and Execution Strategy Development
Figure 4.3 Example of the WBS, OBS, and Work Package Concept

125
4.3.5.7.5 Project Scope WBS-Work Package:
Benefits of a common WBS include the fact that each cost and schedule estimate should
be designed using common work breakdown structure and cost breakdown structure. The
tangible benefits of both deliverables include the following.
• Facilitate cash flow analysis and earned value analysis
• Help ensure consistency between cost estimate and project schedule
• Facilitate resource loading schedule
• Provide consistent project controls
A well-structured estimate by WBS provides visibility into the man-hours, resources, crews,
etc. It becomes more transparent and facilitates a resource loaded schedule at the same
WBS level to ensure that the schedule expectations will not require a higher level or a
larger peak of resources that will be available or that the project can withstand either by
space or availability. So the whole common WBS approach provides a basis for consistent
project controls in terms of moving through to execution.
4.3.5.7.6 Use Physical Progressing:
Simply put, physical progressing is a method to measure completion or work progress. It
is a mechanism used to understand how far the work has progressed using actual
deliverables or actual measurable items as opposed to simply estimating percent complete
or even worse, hours or cost (as a percent of estimated hours or costs) as a measure of
progress. Physical progressing is an essential component in project controls and is a skill
that helps maintain the control of projects. An objective of the method of physical
progressing is its reliability and providing better project controls.
Merely just tracking cost as a method of progress is risky because a large amount of money
can be spent without actually accomplishing much. In contrast, physical quantities or
events (ideally, the completion of a task package where all work is packaged) can be
identified and help measure actual progress. Physical progressing helps the project team to

126
ascertain (find) where gaps exist between the amount of money spent and the scope
completed.
Steps to physical progressing include the following.
1. After building a cost estimate and based on agreed quantities, load the scheduled
level 3 activities with the quantities using the parallel break down structure. Then
break down level 3 activities to the task package level and load each package with
quantities to be completed by that package.
2. Completion of each task package constitutes the measure for status as well as
earned value, and the combination of task packages roll up into completing level 3
activities for which they were packaged. Validation of task package completion
eliminates the traditional need for quantity surveys and the inaccuracy and
negotiations associated with them. Task packages are sufficiently granular (small)
that percent completions are irrelevant to control and no longer used.
3. Determine the overall progress of the project by summing up the completed task
package quantities into completed level 3 activity quantities.
4. Divide earned sum by total value of all items to determine percent complete based
on actual deliverables.
Additional guidelines for physical progressing include the following.
1. All work done in front end loading, engineering, procurement or construction
should be in the set of task packages. Task packaging is only done for the next 1 to
4 week moving window of execution. Due to the dynamic nature of the work to
accommodate flexibility for what is actually happening, task packages are not
developed beyond the next 4 weeks of work.
2. At authorization (to proceed with EPC execution), at the end of front end loading,
the estimate needs to be structured to support physical progress.
3. One of the critical measures that the industry should use to gauge projects is
whether the cost estimate is structured (broken down in parallel with the schedule

127
work breakdown to level 3) so that it can be used to measure physical progress for
the engineering deliverables as well as the construction.
4. Tracking physical progress is as important in lump-sum contracts as it is in
reimbursable contracts. Physical progressing provides the ability to spot poor
performance early so remedial action can be taken. In addition, payments should
be based on work progress and physical progress measurement allows payment for
work done on a verified basis.
4.3.5.7.7 Drive Detailed, Well-Communicated Project Reporting
Frequent and detailed progress reporting is correlated with better outcomes. The higher the
frequency of project reporting the better is the project control system. Still, obviously, that
frequency and detail are dependent on the size and complexity of the project.
The baseline assumption to reporting is that it presupposes the following: All the pieces of
the project control system are already in place, the project should be estimated for control,
there needs to be a physical progressing mechanism in place, and good schedules are in
place in the beginning which can serve as a basis for control and forecasting.
Reports, dashboards, and supporting protocol should be structured to support the human
interface between stakeholders. The status of what is happening relative to commitment at
the task level is best known by the task lead who is responsible to execute it. The task lead
commits to all task execution excellence criteria (safety, quality, duration, productivity,
environmental protection, and employee morale). Task leads, in frequent (e.g., every 2 hrs.
or 4 hrs.) consideration of how they are doing relative to the integrated and aligned
commitments, is the most important measure for control of the project.
Task leads must identify variance and if they go beyond a pre-agreed threshold, they must
contact their supervisor to enable supervisors to provide a balanced response for net project
gain. It is this task plan, task lead alignment, commitment, and communication that enable
control.

128
Reports and dashboards are to roll up information from what is happening at the task level
to serve as the communication mechanism to convey information to upper levels of
management regarding the current and future health of the project. They also act as a
barometer to inform stakeholders of key performance indicators regarding the project.
Whether the right things are happening, consistently and reliably, indicates the reliability,
quality, timeliness, and effectiveness of the reports. The management culture as well as the
reports will determine how well management facilitate control of a project.
A monthly project review meeting will be conducted by management and the project
manager along with project team and they should prepare a detailed project status including
progress, actual cost, EAC cost, resource requirement, concerns, Client feedback, project
risk, invoice & payment status, and cash flow etc.
A procedure and e-system should be established for flow of revision information from
Engineering, SCM & Construction.
There are reporting best practices geared to every aspect of project controls: estimating,
cost engineering, scheduling and business intelligence and analysis necessary for
continuous improvement or external benchmarking.
The frequency of reporting is correlated directly with the increasing acceleration of the
project execution schedule by the following.
1. Task level planning, coupled with frequent reports that provide a tool for keeping
on schedule by identifying schedule variations on a timely basis.
2. Without the plans and commitment by task leads for frequent consideration and
reporting, delays in projects may go undetected or unnoticed by the project team
until it is too late to prevent loss of safety, time, or costs.
3. Schedule benefit for clients is strongest on reimbursable projects because this
contracting strategy places the cost risk for schedule delays on the owner or client.

129
4.3.5.7.8 Keep Clear, Concise, and Reliable Historical Data
If the project controls organization does not maintain a reliable historical database of past
project costs, then the cost specialists will have a very difficult time validating future
estimates. An effective historical database, aligned with both estimating and project
management needs, is rightfully described as the life blood of a company creating and
increasing differentiation in industry performance. Institutionalizing not doing so is a
warning that the company cannot rely on past performance. This means it has not
established standards or cannot rely on its people to execute according to standards that
have been established. This state of affairs should be regarded as a profound management
failure in fiduciary responsibility, putting both its clients and itself at profound financial
risk, which is typical of mega project management in the industry.
The project manager and the project cost specialist of each team have the responsibility to
ensure that historical data is saved back into the database. This can and should be done in
the standards themselves, which are used to develop future sequences and best practice task
package plans. It means feeding back information, task package by task package, as it is
completed and rolling up cost, durations, and criteria through the standardized breakdown
structure as they are completed. This requires getting all the detailed information and
putting it into the right format so that it can be incorporated into the project documentation
and data systems as well as the standards for future estimating and performance excellence.
The client must decide with the contractor at the beginning on the format that is needed so
that the data can be uniformly collected and updated into the project systems database in
order to drive competitiveness in target costing on future projects.
Key steps and benefits in maintaining good historical data include the following.
1. Maintaining reliable, historical project cost database in or aligned with standards
for planning and estimating them for aligned performance excellence.
2. Using historical data, standards, and best practice sequences to validate future
project estimates and proposal schedules, as well as proposed execution plans.
3. Project Team and project Cost Specialist must extract and populate the historical
database with stiff penalties for failing to do so.

130
4. Historical data acquisition can be highly facilitated by optimizing project controls
systems and software to ease the process. And through using optimized coding
schemas, this data can be delivered continuously, task package by task package
completion from the inception of the project.
5. Asking for a detailed cost proposal and detailed task by task and final closeout data
sends a message to the organization, contractors, and subcontractors of the high
value placed on project controls practices and accountability.
6. Organizations that follow these practices systematically obtain better and more
competitive proposals.
4.3.5.7.9 Strong Estimate Validation Must be Deployed
Quite often and in a majority of cases towards the end of Front End Loading, the basic
estimate, the bottom up authorization grade estimate in terms of quantities, and
productivities estimates and units is developed. So, what is found that differentiates good
project controls are those that do a separate and robust validation of that estimate.
A common approach is to be able to compare ratios of different cost categories from
benchmarked data that has been collected over several years to understand installation
ratios and other ratios as shown in the table 4.8. Gather, Analyze, Test, and Benchmark
historical project costs at the WBS and System levels. Perform bottom up estimates at the
end of Front End Loading or Programming stage ensuring that format and coding adhere
to both estimating and project management needs for control.
Make or ensure good correlation between estimates and benchmark values including.
Estimate comparisons must be congruent to benchmarked historical data or more
importantly, the benchmarking data must conform to how projects are estimated. The
primary concern is to ensure project management buy-in on the estimate and use of best
practice standards to continue to improve market differentiation and to ensure controls
using those estimates and standards in the project. Doing so must not be optional, and
governance must be in place to assure the project is done well before executives approve
each proposal.
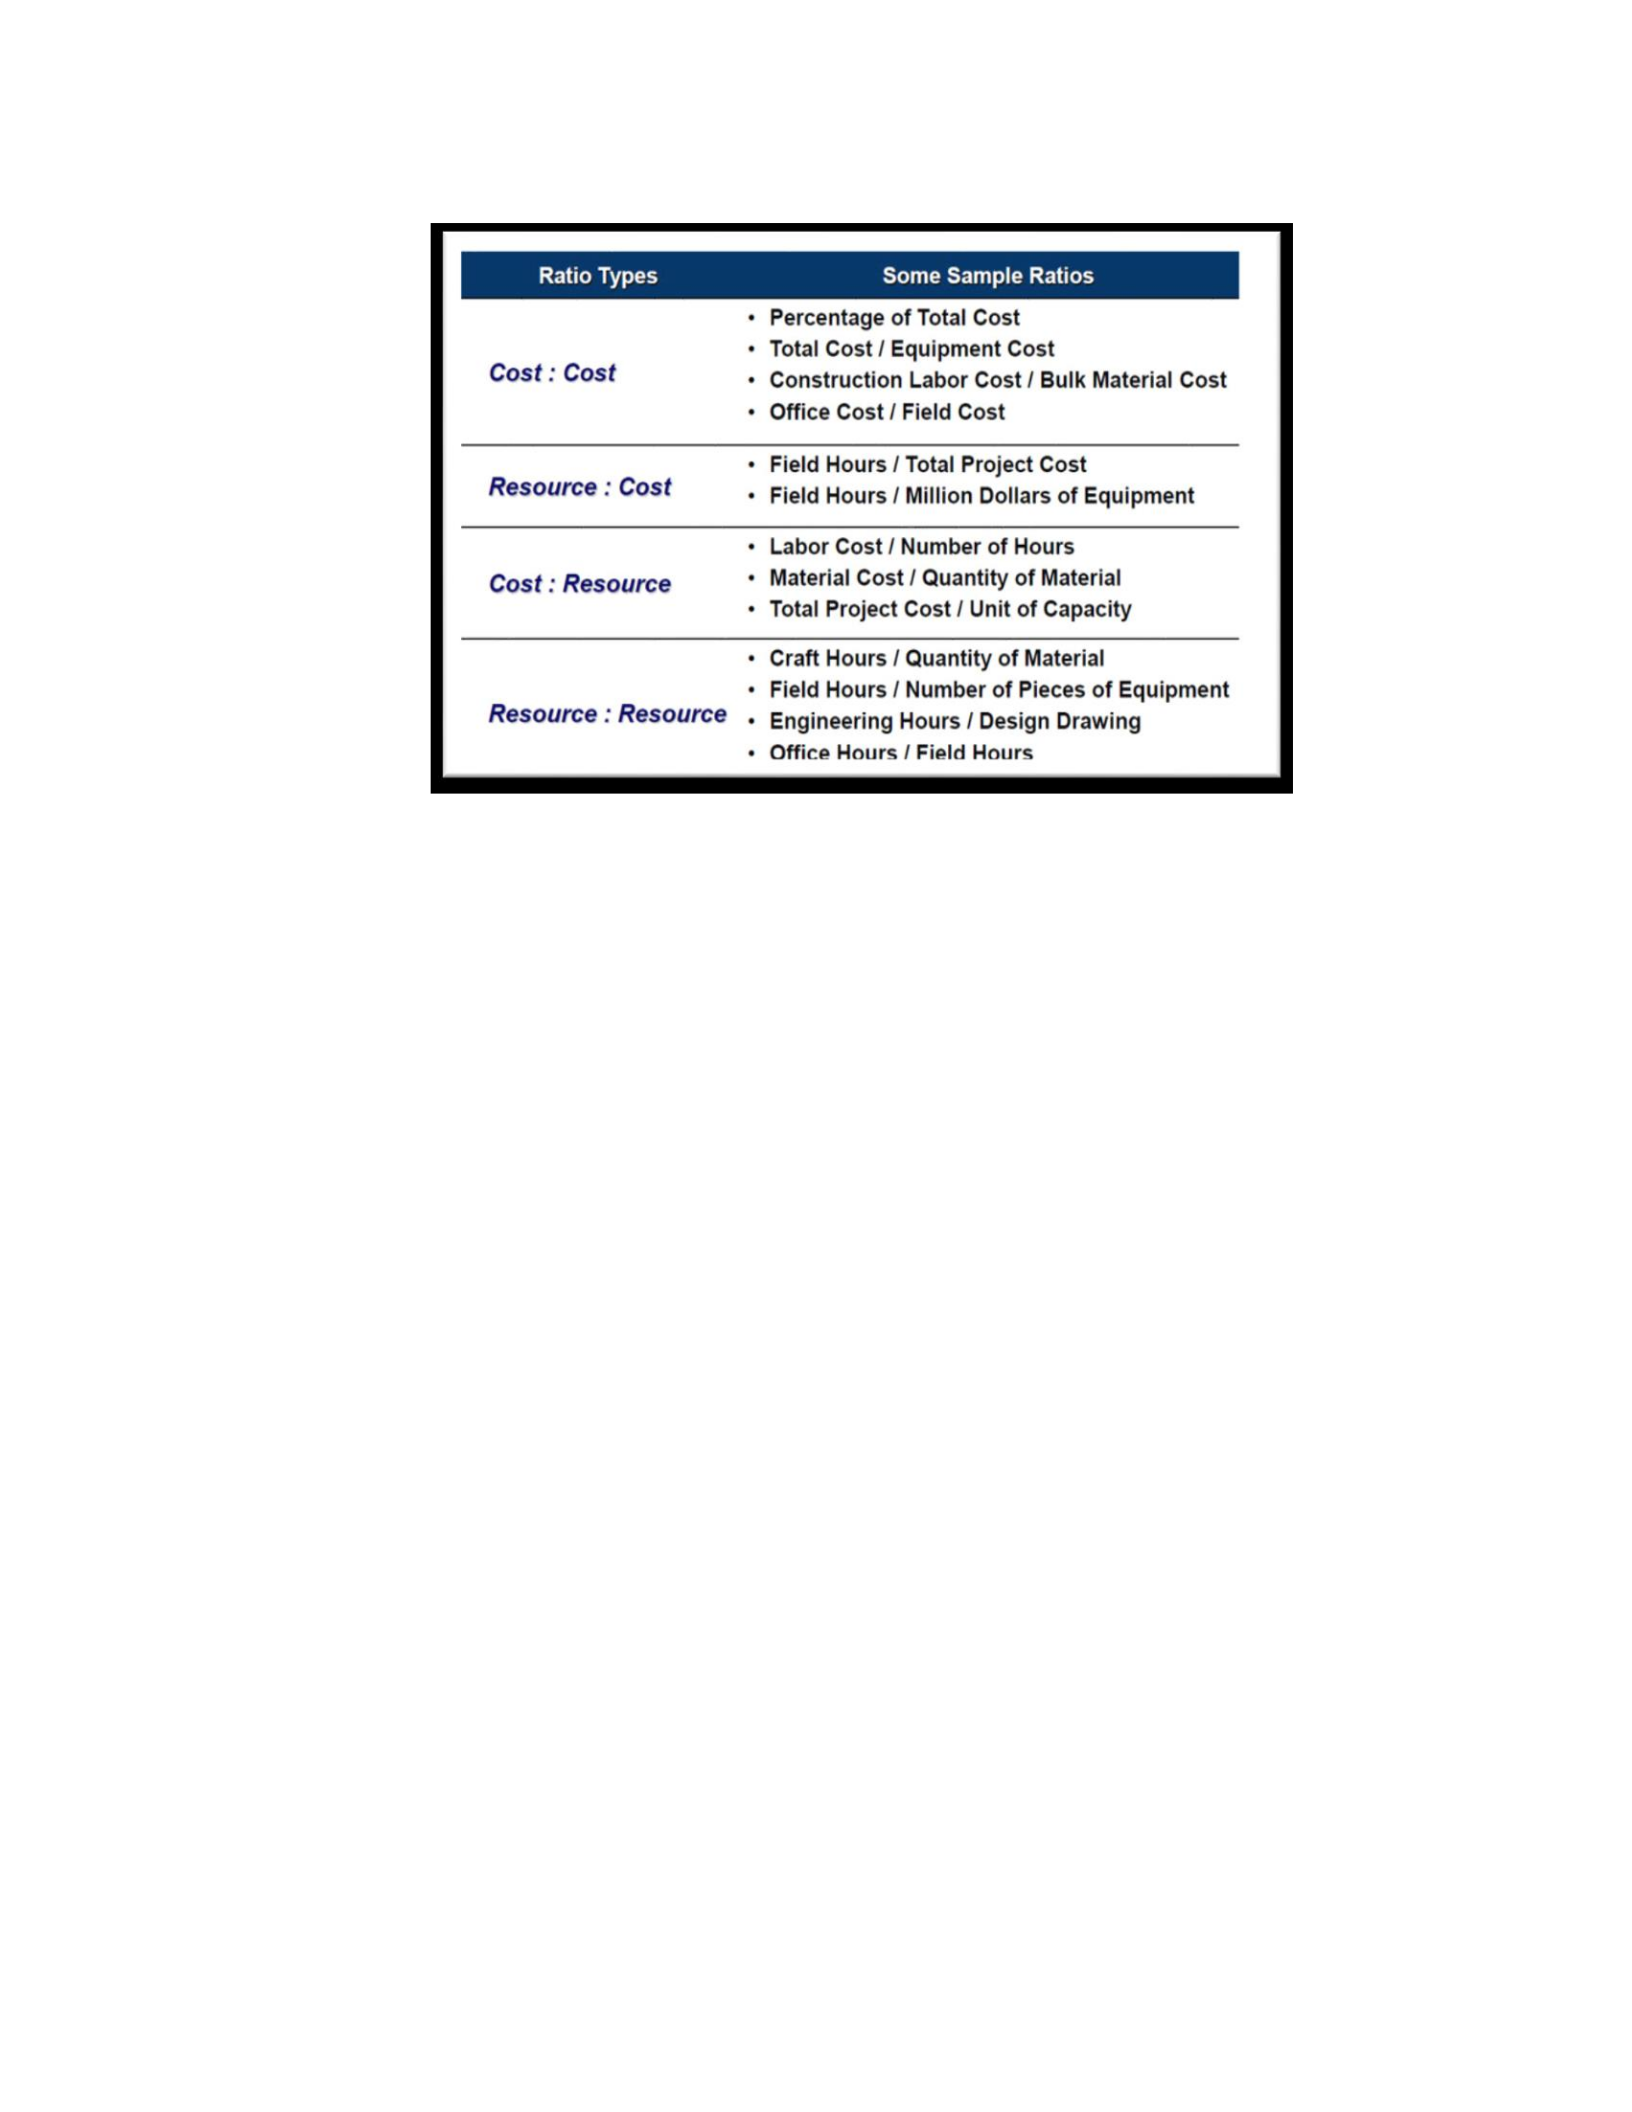
131
Table 4.8 Sample Ratios to Set Benchmark
The challenge is that this process requires estimate data from the company history in a
format that supports the validation process. Some common sources are for past projects
and the actual ratios experienced on previous projects with a prospective new project. Or
compare with past estimates or check estimates. Also, compare with relative cost metric
or ratios from past sources or archives.
4.3.5.7.10 Maintain Estimator Independence
The point here is to ensure a checks and balances process to help guarantee a cold eyes
type of input into the project controls processes and to help limit any opportunity for bias
or other errors in the process. Ensure that the estimators are free from undue bias. project
managers or executive sponsors or especially clients can be biased toward a favorite project
or have a predetermined cost in mind.
Research has shown that over the years, there have been numerous cases of
underestimating a project due to pressure from the project team or the management, who
believe the project will be lost if the costs are too high. Often the cost or price is accurate,
and setting too low of a price with a bias actually sets the project up for failure in terms of
cost overruns or not meeting the business objectives.

132
On the other hand, in some company cultures, they overestimate the project because of the
punitive company culture associated with even minor overruns. Doing so establishes an
upward spiral of costs and a lower performance with a buffer to cover the real lack of
aggressive, mutually beneficial improvement in the work process.
Costs continue to rise in the construction industry relative to performance as they decline
year over year in other industries. Overestimating is yet another means to mask continuing
failures to improve the work process to effectively deal with increasing project sizes and
complexity.
4.3.5.7.11 Project Team to Hold Workshop to Communicate after the Kick-Off-
Meeting
This meeting will clarify as sold and establish a contractual interpretation of scope so that
the “scope creep” and “gold-plating” circumstance at-large can be avoided.
Considering lessons learned from previous projects. Construction sequence/methodology
and commissioning requirement should be conveyed to engineering & procurement team
so that priority criteria and need can be understood by the project team. Emphasizing the
importance of lean engineering or fit for purpose design.
4.3.5.7.12 Adopting Advance Work Task Package Concept Early in the Project
Adopting the advance work task package concept in early stages of the project and
preparing work packages for 1 to 4 weeks of E, P, & C. Task packaging will be done for
Commissioning and Startup as soon as the project execution is 4 weeks away.
4.3.5.7.13 Construction Driven Schedule
Engineering and procurement schedule must have good details to monitor the status with
transparency and must be developed based on construction priority driven needs. All the
decisions needed for detailed engineering to follow the path of construction should have
been completed during the FEED stages. FEED deliverable must include the necessary
data for a top down to bottom up transition in design to occur at the beginning of the
detailed design. This corresponds to the transition from system to area design. The EPC

133
contractor must assess the Situation and FEED deliverables and if necessary complete the
FEED stage design (during early EPC) so that this is the case.
4.3.5.7.14 Update BOQ
The dedicated person in charge or the project engineer will be responsible for maintaining
the BOQ (bill of quantity) register with reason for change, contributing factors as well as
the responsible party who will bear the implications of cost, time, and resource aspects.
BOQ will be grouped and identified by PCWBS (project controls work breakdown
structure), subcontractor, material type, plant, area, etc. Bulk quantity preparation and
releasing basis dates and activities should be established with milestones in the schedule
and tied to the bulk construction area activities. BOQ basis should be released along with
each release of BOQ.
4.3.5.7.15 Project Change Management System
Each Discipline Lead Engineer must maintain the design change log for his/her own
discipline. All leads on the assigned project must update the information prior to every
weekly project team coordination meeting. The engineering manager must maintain the
consolidated design change log and ensure that the change is applied and impacts identified
and resolved or mitigation treatment happens (Reference Situation entitled: Establish
Project Change Management System).
4.3.5.7.16 Engineering Design Budgeted Hour by Document Deliverable
Each engineering design discipline budgeted hour must be established by deliverable
document type and the interim design stage gate milestones completion. Project controls
should provide budget, actual, productivity, and forecast at completion and performance of
man hours (MH) per document type to the Lead Engineer. The Lead Engineer must provide
a record of actual hours spent on deliverables and resolve the deviations into standards for
estimating and changing orders (where appropriate). It is the Lead Engineer’s
responsibility to get deviations approved by project management and manage the
implications of those deviations. A drawing hold log and withheld budgeted hours for those
holds must be established. On hold clearance from field engineering, the budgeted hours

134
to discipline must be released. Getting timely clearance of a hold is the responsibility of
the field engineering team.
4.3.5.7.17 Forecasting
Schedule control and cost control must produce forecast reports every month with a clear
basis from past period performance for the MH required to complete the remaining work,
the quantity to complete at a proper productivity rate, and the time aspect with the existing
resource level as well as a suggestion on how productivity can be improved, recovery
achieved, etc.
Parallel Breakdown Structure: Construction project controls must have a detailed
breakdown of quantities (task package by task package) from field engineering and work
closely with E, P, & C, and all revisions must be reported regularly to them.
4.3.5.7.18 Coordination
Monthly look-ahead schedule along with back log activity in the form of monthly goals
should be distributed to the project team every month. The coordination meeting should
focus on achieving the progress as per the schedule. A printed hard copy should be posted
on the notice board as well as in the task force area. Construction should be communicated
with the head office (H.O.) engineering team for all site changes.
The project controls manager must attend daily/weekly/monthly construction meetings and
should provide the work front available for construction. Expediting reports including
warehouse material available status should be continuously reported to the project controls
manager so that the general foremen can know what materials are available associated with
task package planning.
All project data such as issuance of drawing, purchase order (P.O.) for material,
subcontractor, and services must notify the project controls manager, who will share the
same information to the cost and schedule team for control. The project controls manager
is proactively involved with E, P & C team for BOQ control and evaluating any BOQ
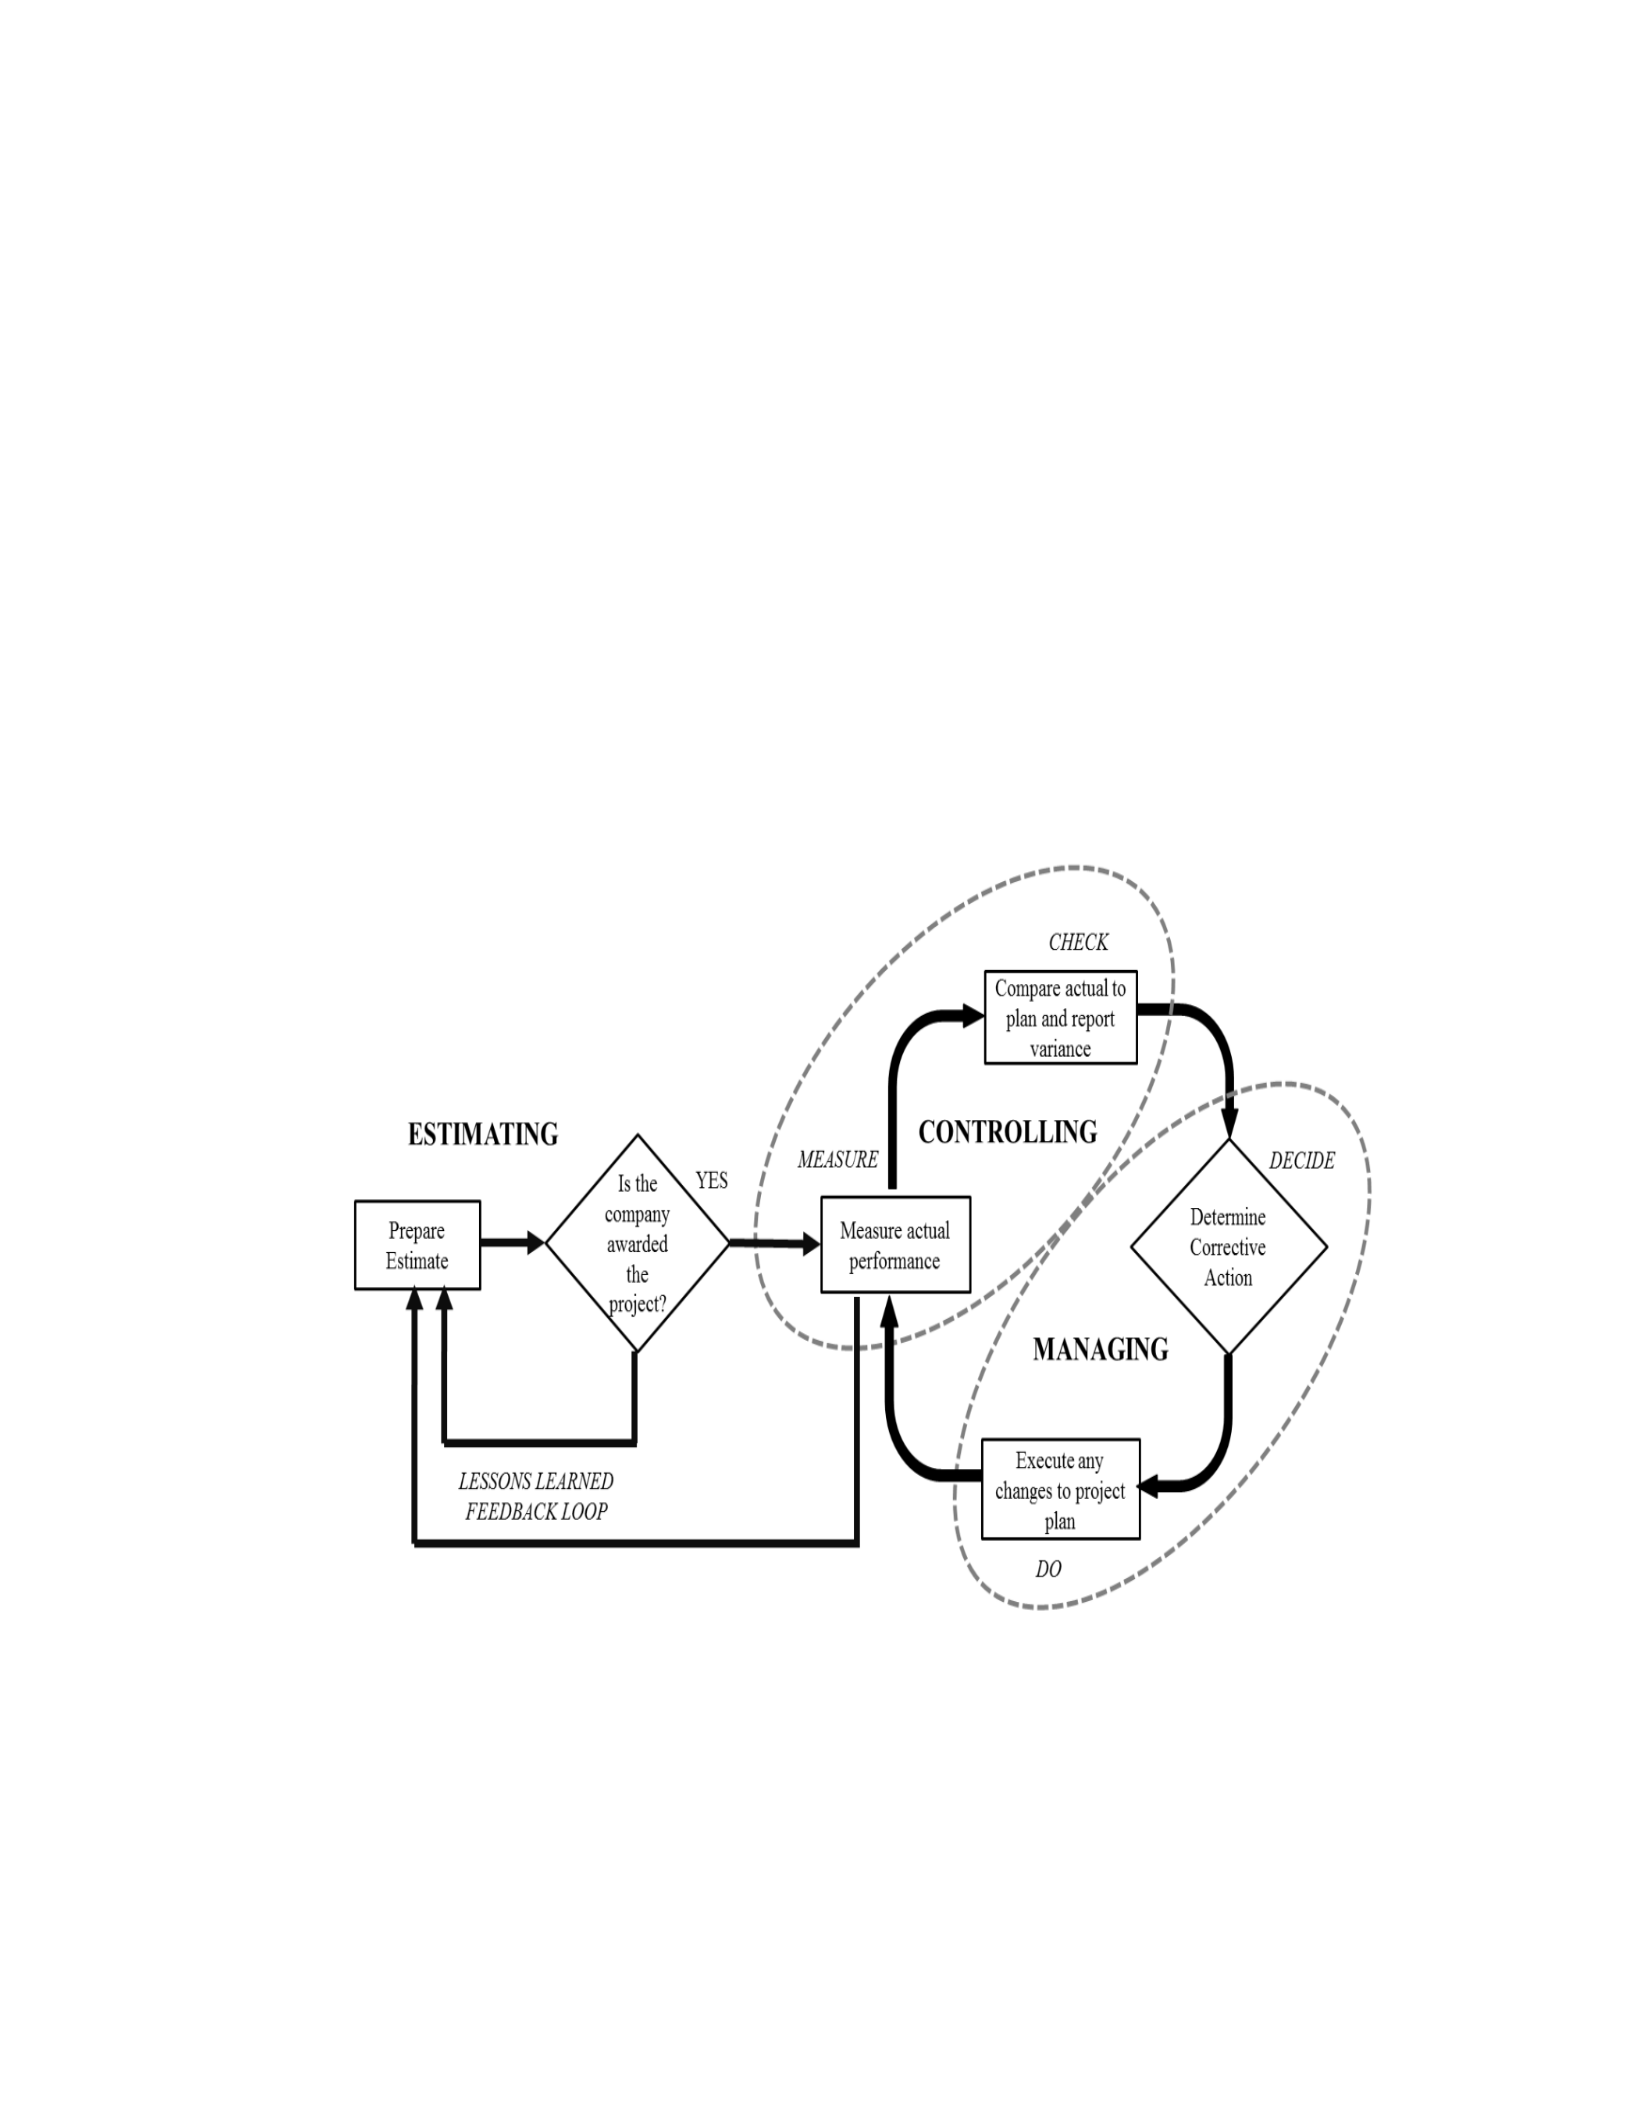
135
variation that arises. The project controls manager shall receive notification whenever an
engineering document is issued to a Client. He/she should discuss with the engineering
manager and engineering team the changes made on deliverables. If changes are originated
by the Client and not within the contract scope, then the manager must immediately initiate
the MOC (Management of Change) procedure.
4.3.5.7.19 Integration
Integrated 3D Engineering system, integrated procurement and material management,
welding management, spool management, and construction management system will be
provided to the project team to effectively plan task packages & control the project. Ensure
the integrated project control system to manage estimating, cost, schedule, and risk.
Figure 4.4 Best Practice Integrated Project Control System

136
4.3.5.7.20 Progressing
The engineering progress measurement system should be developed and it should capture
the progress whenever a document is transmitted to a Client. This system should be able to
generate a report per document type that contains MH & Cost budget, actual based on spent
MH & cost from SAP using import options, forecast, S-Curve for plan, actual, and forecast.
The current Excel spreadsheet is time consuming and project controls spend lots of time
on data entry rather than on analyzing the data and suggesting corrective actions or catching
up progress. Construction project controls should work closely with the construction team
& QC team to gather the actual progress based on completed task packages (that reflect
quantity and all other applicable conditions faced by the task team) and share the same
information with cost control for calculating the actual cost and ETC cost on a monthly
basis. A 3D model must be accessible to the site office on completion of a 30% model
review or upon mobilization (whichever is sooner) to do a review for constructability by
field construction personnel (for this purpose only).
4.3.5.8 Kaizen Implementation Planning to Close the Gap
The first step of Kaizen Team Training is to review the purpose, elements, and operation
of an industry best practice project controls functional organization.
Following the organizational development described above, standards must be developed
to support all the functions of project controls. Relative to achieving performance at the
source via all task leads, the following items need to be included in the training:
1. Control happens by each level of the organization obtaining what they need to make
sure that the right things happen in the area they are responsible for (i.e., at their
particular level).
2. General foremen must ensure that packages they prepare and sequence will achieve
every level 3 activity and that all work to be performed is in a package. Further, the
general foremen must ensure that each foreman they manage has what is needed to
start and complete tasks without stopping, with safety, and with the required quality,

137
productivity, environmental protection, and duration to meet overall project
priorities. Other systems and management must support this effort.
3. Similarly, each engineering discipline lead must assure that all design work is
packaged to meet overall project priorities, which include the path of construction.
Engineering discipline leads must assure that by their task packaging and
sequencing, each of their engineering task leads has what is needed to start and
complete each design task package without stopping.
4. Procurement leads must ensure that they do the same for procurement tasks and the
task leads that will execute the procurement.
5. Task leads (for engineering, procurement, or construction (foremen)) then become
the primary means of control. Task leads review and align their supervisor’s task
plan to assure their team (crew) has everything needed to start and complete the
task package without stopping, with safety, and with the required quality,
productivity, and duration.
Once unity/alignment is achieved, the task lead is the one who commits to do it.
Further, task leads provide the necessary transparency for real-time management control
by keeping their immediate supervisor informed of the status of their tasks, as they happen.
Task leads are the first line of full performance control, just as the foremen are for safety.
The supervisors (engineering and procurement discipline leads, general foreman) are
responsible to establish and maintain alignment according to the schedule priorities and
actual progress. Superintendents and project engineers ensure performance of the
discipline leads and general foreman and others up the chain of command. Critical chain
principles should be used, enhancing CPM.
The recommendation after the successful team piloting of the above is that the team review
readings on the following additional best industrial practices, cross-pollinated from the
control process in advanced industries that is methods impacting total cost and schedule
reduction with simultaneously improved control reliability. Another Kaizen approximately
6 months after implementation of the above is normally recommended to implement the

138
items below. The team should begin their review and consideration of these additional
practices.
• Pugh matrix – Improved basic data extraction and deployment to the task level
• Mistake proofing – Reliability of work process time, safety, and outcome assurance
• Six Sigma – Applied statistical approach to organization and quality control
• Relational competitive partnering – Create ultrahigh performance trustworthiness,
enabling high-early stage supplier & subcontractor involvement, lower actual cost,
and increased mutual benefit
• Concurrent engineering – Enabling aligned task level deployment of project
criteria.

139
5. SUMMARY AND RECOMMENDATIONS
Summary
Large and mega EPC capital delivery projects are considered to be some of the most
complex projects in the world due in part to the involvement of a large number of
stakeholders. Construction industry performance on mega projects is not good. A high
percentage of capital projects, especially megaprojects, fail. The overall rate of
construction productivity has been level or declining for the past 20-25 years. At the same
time, the productivity gap between construction and other industries has been increasing.
Inadequate project control and management system is a primary reason for the poor
performance of the construction industry.
Based on the McKinsey forecast described in chapter 1, there will be massive investment
in construction projects in the near future. Also, the complexity, size, and demand of speed
for construction has substantially increased. This points to an urgent need for rapid
continuous improvement of control.
Control over projects should be maintained by the project control and management system.
But control can only be improved by enhancing the project control and management system
(PCMS). When the concepts and definition of control are investigated, it has been found
that control in EPC is more of a reactive approach and comes into action when things get
off track. The current inadequacy of control can now be reduced by making it more real-
time and proactive. So there is a need to change the PCMS into being more proactive and
real-time rather than reactive.
A literature review was conducted to understand “What Is,” “What Should Be,” and “How
to Close the Gap” between them by enhancing the project control and management system.
Various concepts and practices have been studied such as flow system, project controls,
advanced project control and management system, advanced work packaging, Lean,
Kaizen, mistake proofing, life cycle of capital project delivery, and visual control.

140
When the flow system of a construction project was studied, it was found that the system
is based on critical path method (CPM), which is a push approach. Other flow systems such
as advanced work packaging (AWP) and last planner system (LPS) were found to be based
on the work packaging concept. Unfortunately, discrepancies have been found in these
flow systems. Further study suggests that there is a need for real time and proactive control
of the flow system. A pull flow system is given preference over a push flow system and
work has been done to make the flow system more of a pull approach. Pull flow systems
work best when they are performed with proactive and real-time control. This suggests a
need to establish a real time and proactive approach to control. Real time control is
established using the principle of visual control, aligned breakdown structure, critical chain
project management (CCPM), work packaging, and on concept, etc. To have proactive
control, variabilities should be eliminated by standardizing the governance structure (work
process, procedure, tools, policies, etc.). This can be done with the help of mistake proofing,
lessons learned, and Lean/Kaizen.
A theory is here proposed which classifies the PCMS to comprehensively understand its
features and objectives. The PCMS was classified into: 1) Desired State of PCMS, 2)
Control Flow System, and 3) Measurement System. Two models were developed and
presented to enhance the PCMS. The first model is “real time visual control flow system”
and is presented here to enhance the existing flow system by corroborating it with aligned
breakdown structure, optimal blend of push and pull planning and control, real time control,
visual control, making and keeping commitments, making lessons learned compulsory,
mistake proofing, real time reporting at each level of the project management team, and
CCPM to make resources available when and where they are needed. The second model,
“Lean PCMS,” was presented to achieve the desired state of excellence of PCMS through
providing proactive and real-time control. A customized model of Lean/Kaizen is
presented to enhance the governance structure of PCMS. It eliminates variabilities by
standardizing the work process, procedure, policies, etc. with the help of lessons learned,
inclusion of all stakeholders, and Lean/Kaizen thinking.

141
These models were approved by industry experts. Several interviews were conducted with
the experts to refine the models. Also, the effectiveness of the principles, concepts, and
practices, such as the flow system, pull planning, and Lean/Kaizen used in the development
of the models was verified by institutions such as CII and LCI, and different industries
including automotive manufacturing and aerospace production.
A case study was performed and reported using the Lean/Kaizen appraisal stage in the
engineering, procurement, and construction (EPC) industry. In the case study, the appraisal
stage of the Lean PCMS model was applied on a real project in the EPC company. The
appraisal stage implementation of Lean PCMS is explained in detail here. The case study
was done in order to comprehensively understand the working of Kaizen.
Benefits and Contribution
The main goal of this research is to improve the overall performance of the construction
industry through focusing on successful EPC capital projects delivery. The aim is to
improve control over the project to eradicate many problems related to productivity and
several sources of project failure. To do this, there is a need to improve the project control
and management system (PCMS) which provides control over the project.
A new theory on the classification of PCMS will help in thoroughly understanding the
features, objectives, and functioning of the PCMS. Two models comprising the theory were
created to make control real-time and proactive rather than reactive. The theory also
enhances the flow system of the capital project delivery.
The first model, “real time visual control flow system,” enhances the existing flow system
including advance work packaging and last planner system by making it more of a pull
approach rather than a push approach. This creates an optimal blend of push and pull which
helps and sustains flow in the system. This model also provides real time visual control at
each level of the organization. It enhances alignment, coordination, and integrity of the
project management team, which is indispensable for the success of complex capital project
delivery. It also adjusts to the changing environment of the construction project by
142
providing real time control at each level of the organization. The proposed advancements
in PCMS through this model enable ownership, making and keeping commitment at each
level of the organizations, and authority to the front-line workers. In addition, this model
makes collections of lessons learned mandatory, which is essential for the improvement of
governance structure.
The second model, Lean PCMS, rapidly and continuously enhances the PCMS to cope with
the growing need, complexity, size, and demand for fast project execution of capital
projects. This model provides the desired state of PCMS, which can provide the desired
control over the project. The model gives a proactive approach of control by the removal
of many root causes of variability and standardization of governance structure. It will also
help project teams prevent the project from getting off track in the first place.
Limitations of the Study
The models created are best suited for capital projects. Therefore, other areas of the
construction industry such as building and infrastructure need to customize the model
based on their own needs, priorities, and criteria. Also, the first model works best if the
complete project is done by the EPC and if subcontractors are not involved. Nonetheless,
involvement of subcontractors will require a few modifications to the model and a
provision of different contract strategies.
Recommendation for Further Studies
The model will be best suited when all the stakeholders outside the EPC firm such as
subcontractors, vendors, and project management consultancy are involved in
incorporating the advancements. This requires a new contract strategy which motivates all
the stakeholders to incorporate proposed advancements in PCMS. For instance, several
times during project planning and execution as well as after the project ends, subcontractors
and vendors involved with the project need to be included during the process of Kaizen for
further improvement. Also, subcontractor general foremen need to be involved with

143
standardization and work task packaging development. Therefore, more studies are needed
to evaluate and develop methodology on contract strategy and to enable it.
As we saw in the life cycle of the project delivery, the front-end loading (FEL) stage is
done per push flow. Further studies could assess if work packaging could be done at the
FEL stage and if pull could be incorporated. In addition, improved user interfaces need to
be developed to more fully integrate control systems and to create visual control out of
project value streams.

