


Introduction The reform and opening up in the late
The reform and opening up in the late 1970s, known as the Chinese economic miracle,
triggered noteworthy Chinese economic growth in the following decades (Ray, 2002),
with an average gross domestic product (GDP) growth rate of 9.95% between 1979 and
2011 and reaching the highest GDP growth rate of 15.2% in 1984, according to National
Bureau of Statistics China. The process of reform and opening up is also the process of a
change in cooperate governance in China, particularly more state-owned enterprises
(SOEs) towards privatisation (Xu and Uddin, 2008). Nowadays, the Chinese economy is
experiencing its fifth great institutional change of SOE reform - mixed ownership reform
(Lin et al., 2020). Specifically, mixed-ownership reform aims to promote market reform
of SOEs and mitigate business dependence on government (Wang et al., 2021), and has
undergone five stages – decentralization (1978-1984), transformation of control rights
(1985-1992), separation of ownership and control of the company (1992-2002),
reorganisation of the ownership of SOEs (2002-2012), mixed ownership reform (2012 –
present) (Lin et al., 2020; Li et al., 2013). Since 2012, China's rapid economic growth has
reached a turning point due to the exhaustion of its late-stage advantage, and economic
growth has entered a slow-growing period (e.g. Lo, 2018; Wang, 2015). During this
period, the Chinese government has made several efforts to accelerate economic growth.
One of the most cited is innovation, which researchers believe is necessary at this stage of
the economic slowdown (e.g. Chen et al., 2018; Lo et al., 2022). The concept of
innovation is broad, and this thesis concentrates on innovation at the firm level.
Researchers usually categorised innovation measurement into innovation input and
innovation output. Innovation input is measured by R&D activities, for example R&D
expenditure and R&D intensity (e.g., Cavdar and Aydin, 2015; Kamien and Schwartz,
1982; Kurt et al., 2015). Innovation output is measured by patent data, for example the
number of patents (e.g., Di Vito et al., 2010; Decker and Günther, 2017; Griliches, 1990).

Firm innovation performance plays an important role in firm profitability, because
innovators are able to somehow shield themselves from market forces (Love et al., 2009).
In practice, many factors can drive firm innovation performance, for example information
and communication technology (He et al., 2023), corporate governance (e.g., Chi, 2023;
Fan et al., 2023; Shaikh and Randhawa, 2022), gender diversity
(Tonoyan and Boudreaux, 2023), investor sentiment (Lin, 2023), policies (Chen and Jin,
2023). This thesis is interested in ownership structure, which is one part of corporate
governance. Different corporate governance in different countries generates various
national corporate innovation and entrepreneurship systems, which, in turn, induce a
difference in firm competitiveness over the world. Hoskisson et al. (2004) conclude two
types of corporate governance which facilitate different types of innovation: (1) a market-
based governance system promotes explorative and revolutionary innovations by taking
advantage of its dynamism, flexibility and diversity; (2) a relationship-based governance
system supports exploitative and incremental innovations due to its continuity, stability
and commitment. Besides, internal control systems and managerial incentives determine
the allocation of R&D investments so as to influence firm innovation performance
significantly (Aaboen et al., 2006, Birkinshaw et al., 2008). As to narrowing down the
research area from corporate governance to the ownership structure, previous research in
emerging countries assesses how these firm ownership impact innovation in emerging
countries (e.g. Choi et al., 2011; Chen et al., 2016; Rong et al., 2017; Liu et al., 2017;
Zhou et al., 2017). Most studies, however, concentrate on the relationship between one
specific ownership structure and firm innovation performance, such as the research on
concentrated ownership (Nguyen et al., 2015; Clò et al., 2020), institutional ownership
(Rong et al., 2017; Li and Ji, 2021), state ownership (Zhou et al., 2017; Dong et al., 2022;
Lo et al., 2022), insider ownership (Chen et al., 2013; Liu et al., 2017; Cheng et al., 2021),
and foreign ownership (Chen et al., 2016; Dong et al., 2022). Those five ownerships are
what this essay focuses on. Only a few scholars are interested in comparatively analysing

the impact of two or more ownership on firms' innovation activities in emerging
economies (Choi et al., 2011; Jiang et al., 2013; Li et al., 2014). One empirical reason can
be that the more ownership structures considered, the more time consuming to collect
data. However, the advantage to have five ownership structures discussed in this thesis is
obvious, as those five ownership structures cover all ownership in Chinese firms. Thus,
we can have a comprehensive discussion about how five ownership structures affect firm
innovation using the most recent data, as shifts in the political environment, foreign trade
environment or business environment can change the relationship between firm
ownership and innovation.
Using data from the Shanghai Stock Exchange between 2013 and 2019, this thesis focuses
on the impact of five ownership structures on firm innovation. In this context, innovation
refers to firm performance innovation, specialised and diversified innovation. The
findings reveal that firm concentration of ownership is positively related to firm
innovation performance, while foreign ownership and firm innovation performance are
negatively related. Otherwise, there was no significant linear relationship between firm
ownership and innovation performance. Thus, a new sample period was applied in this
case.
However, the innovation performance of concentrated ownership does not differ
significantly between the different levels when a threshold is used. In contrast, the study
of insider ownership indicates a positive effect on innovation performance when insider
ownership is below 5% or above 20%. In particular, insider ownership above 20% has a
greater impact on innovation performance than insider ownership below 5%. This result is
partially consistent with the work of Song et al. (2015). Furthermore, state ownership is
positively associated with innovation performance only when it is less than 5%, which is
partially consistent with previous findings (Choi et al., 2011). In addition, the results find
that only firms with more than 20% foreign ownership damage innovation performance.
There is no significant difference between different levels of institutional ownership in

terms of firm innovation performance. Hence, it fills the research gap about thresholds of
ownership structure and offers a guidance for current mixownership reform in China.
Third, the findings suggest that firm ownership is not related to innovation specialisation
or diversification but more external factors impacting the firm's decision to specialise or
diversify. Therefore, it fills the research gap about the determinants of firm innovation
diversification and specialisation.
1.2 Research Aims
The Chinese government has launched a number of initiatives to foster innovation and
find new sources of economic growth amidst a deceleration in economic growth. Since
2012, the Chinese economy has entered sluggish growth from the rapid economic growth
associated with reform and opening up. In response to the notable change in the economy,
the Chinese government has adopted a series of measures to stimulate economic growth,
including mixed-ownership reforms and exploring opportunities for further cooperation
and development with other countries. This thesis aims to examine the relationship
between firm ownership and innovation, investigate the relationship between five
ownership structures and innovation performance in China, find the thresholds that
influence company ownership and innovation, and how different levels of company
ownership affect innovation specialisation and diversification.
1.3 Research Objectives
The first purpose of this study is to investigate the relationship between five ownership
structures and innovation performance in China. As the literature on innovation
performance emphasises country-specific institutional factors while interpreting each
country's innovation performance (e.g. Abdullah et al., 2002; Di et al., 2010), this thesis

focuses on the emerging institutional setting with a large and rapidly developing market.
Traditional Schumpeter-inspired economics of innovation, and recent advances in his
work, seem incapable of explaining why firms sharing similar exogenous circumstances
may behave very differently in terms of innovation. By contrast, the literature on
corporate governance offers several helpful perspectives for understanding firms'
innovative activities. Belloc (2012) suggests three main aspects of cooperate governance
concerning a firm's innovation performance – ownership structures, labour and cooperate
finance. In this thesis, ownership structures are the focus.
The second objective is to find the thresholds that influence company ownership and
innovation. Firm ownership will be divided into different levels, and this thesis examines
the relationship between different levels of firm ownership and innovation. Wright et al.
(2005) suggest that the fundamental of effective corporate governance in research can be
the integration of agency theory and institutional theory, as this contribution may offer a
novel framework. Thus, a firm, which can implement efficient management in changing
environment, relies on a suitable structure between ownership, control device and
monitoring mechanism. Therefore, in this thesis, innovation will be analysed using
different levels of firm ownership to identify the thresholds that affect the relationship
between firm ownership and innovation. It will allow shareholders and firm managers to
better understand the relationship between firm ownership and innovation, and to use the
thresholds flexibly to build mixed ownership structures that allow firms to benefit from
different firm ownership.
The third objective is to see how different levels of company ownership affect innovation
specialisation and diversification. This thesis utilises the concept of knowledge to analyse
innovation specialisation and innovation diversification.
Knowledge plays an important role in the survival, growth and innovation of a company
(Healey and Mintz, 2021; Yu and 2021). The varying firm performance depends on the
firm's own knowledge base (Grant, 1996). The accumulation of a knowledge base adds to

a firm's competitiveness, facilitates research and development (R&D), and ultimately
transforms knowledge into commercial products (Cohen and Levinthal, 1990; Arora and
Gambardella, 1994). The degree of knowledge accumulation can be divided into two
categories, depth of knowledge and breadth of knowledge. The depth of knowledge helps
to strengthen the firm's capacity to absorb new knowledge, integrate external knowledge
into the firm's knowledge base, use external knowledge proficiently and effectively, and
increase the firm's competitiveness (Yang et al., 2017). The breadth of knowledge
facilitates the expansion of the scope of knowledge to bring new inspiration for
innovation (Katila and Ahuja, 2002), and the firm's capacity in adapting to technological
changes in related fields (Volberda, 1996; Srivastava and Gnyawali,
2011).
1.4 Research Questions
In order to achieve the research objectives, the following research questions need to be
addressed:
1. What is the impact of firm ownership on innovation performance?
2. What is the impact of different levels of firm ownership on innovation
performance?
3. How do different levels of firm ownership affect innovation specialisation?
4. How do different levels of firm ownership affect innovation diversification?
1.5 Background
1.5.1 Chinese Economy
Since the reform and opening up, the Chinese economy has entered an era of rapid
growth. From 2003 to 2013, Figure 1.1 indicates that the GDP growth rate in China
remained above 10% except for 2009, followed by a decline in growth rate to below 10%.
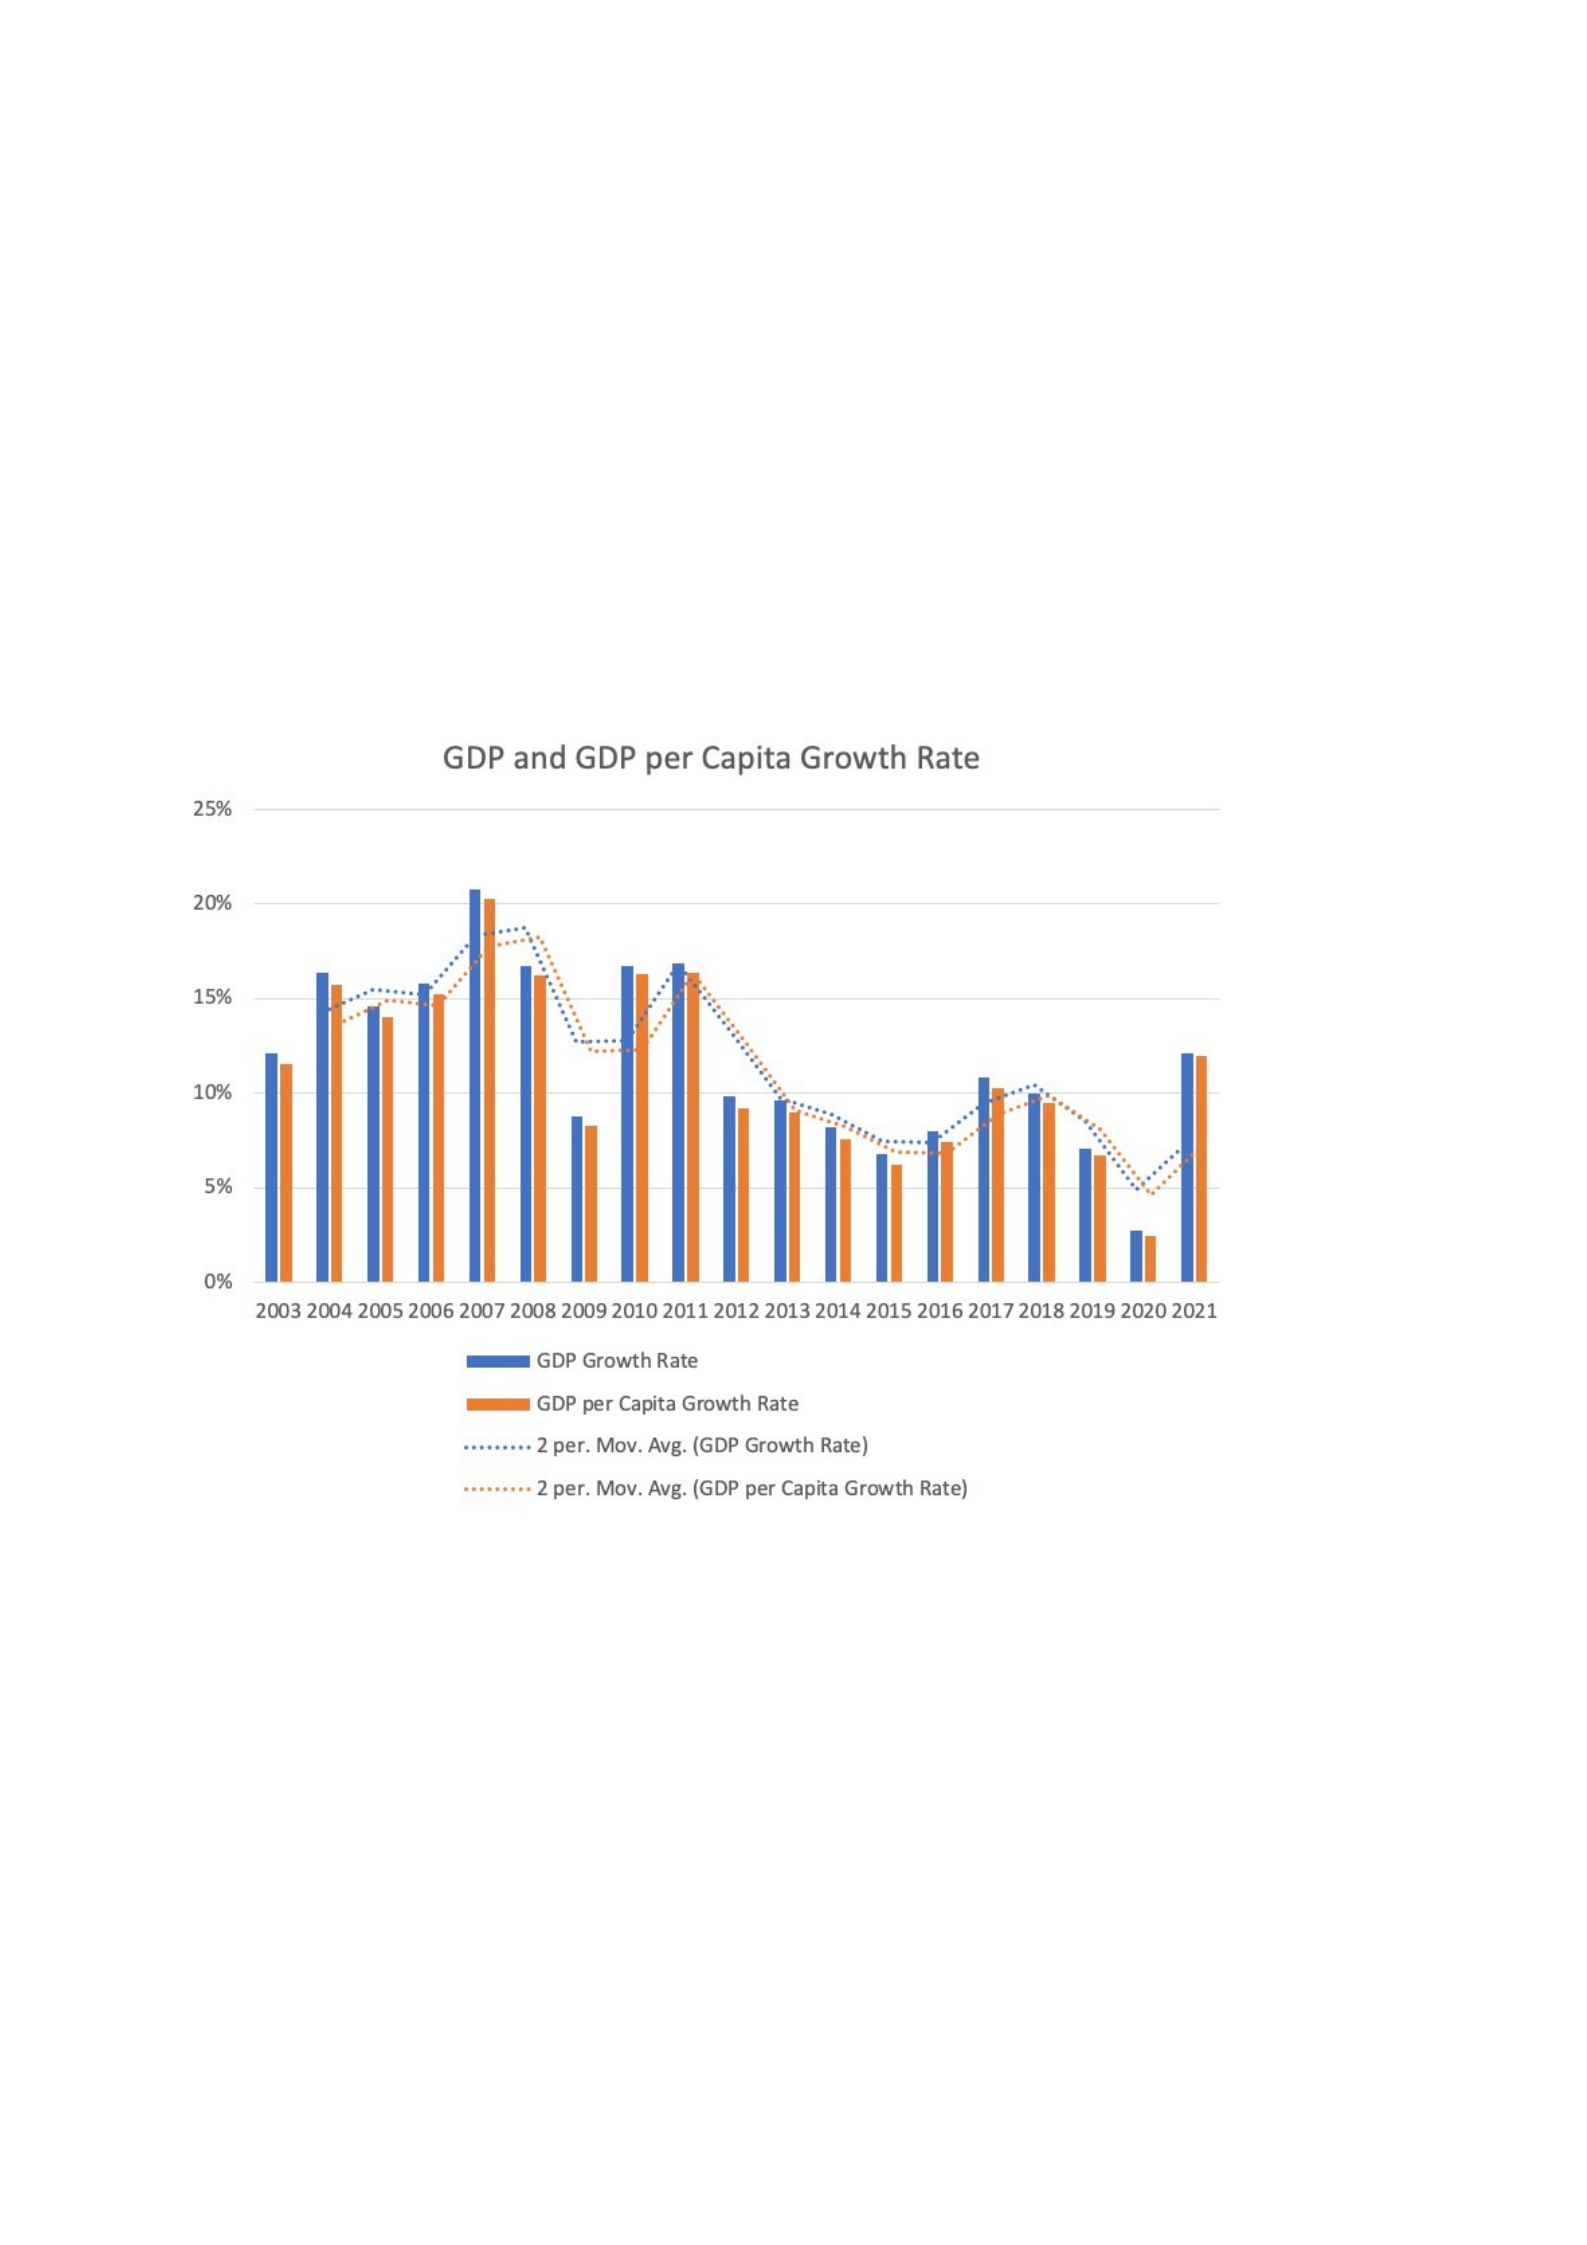
Then, the growth rate hit rock bottom (around 7%) in 2015 and climbed steadily for three
years before dropping again due to China-US trade war in 2019 and COVID19 in 2020,
tumbling down from 10% to around 3%. Obviously, the Chinese economy has moved into
a period of slow growth since 2013. As a result, the average GDP growth rate between
2012 and 2021 was around 8%, revealing a downshift in China's economic growth
compared to the rapid economic surge of the past after the Reform and Opening Up
policy.
Figure 1.1 GDP Growth Rate and GDP per capita Growth rate in China over period 2013-2021
Source: National Bureau of Statistics
It is officially called the "new normal", and the reasons for this "new normal" are
manifold (Lo, 2018). For example, the slowdown mentioned in his paper is mainly due to
China's "late-stage advantage" depletion. Years ago, after the reform and opening up,
Chinese companies improved or innovated their products or services by absorbing and
refining imported technology, increasing their competitiveness in the international market
and thus leading to rapid national productivity growth. Nevertheless, the rapid economic
growth that followed the reform and opening up has ended. With sluggish economic

growth, encouraging local innovation has become a priority (Lo et al., 2022). The
Chinese government has undertaken a number of initiatives to promote innovation and to
find new sources of economic growth in the face of slowing economic growth, such as
mixed ownership reforms.
1.5.1.1 Mixed-Ownership Reforms
Since the reform and opening up, a large number of SOEs have been restructured into
private or mixed ownership. Five stages of SOE reform are proposed by (Lin et al., 2020):
1. 1978 to 1984, at the beginning of the reform and opening up, when
decisionmaking rights were transferred from the government to Soviet-style
socialist firms
2. 1985 to 1992, when control of the company was transferred to SOE managers by
contract
3. 1992 to 2002, when the separation of ownership and control of the company
4. The reorganisation of the ownership of SOEs between 2002 and 2012
5. The reform of the mixed ownership system after 2012
At the end of 2017, that type of mixed ownership had become predominant in SOEs. Of
these, 69% of SOEs with direct links to the national government had converted to mixed
ownership, while provincial SOEs accounted for 56% (Shen and Yang, 2019). In addition,
25 of the 115 Chinese companies that entered the Fortune Global 500 in 2018 had
undertaken mixed-ownership reforms to varying degrees.
Zhang et al. (2020) point out that the mixed-ownership reforms have had a positive effect
on innovation, not only in terms of increased investment in R&D but also in terms of an
increased number of patents. The increased investment in R&D is due to SOEs obtaining
more funds from private enterprises after being turned into mixed ownership (Chen et al.,
2018).
Furthermore, the positive correlation between mixed ownership and innovation is
magnified within firms in monopolistic industries compared to highly competitive
industries. In addition, innovation in mixed ownership is influenced by region. The
eastern part of China has a greater impact on innovation capacity than other regions
(Zhang et al., 2020)
1.5.2 China’s R&D Expenditure
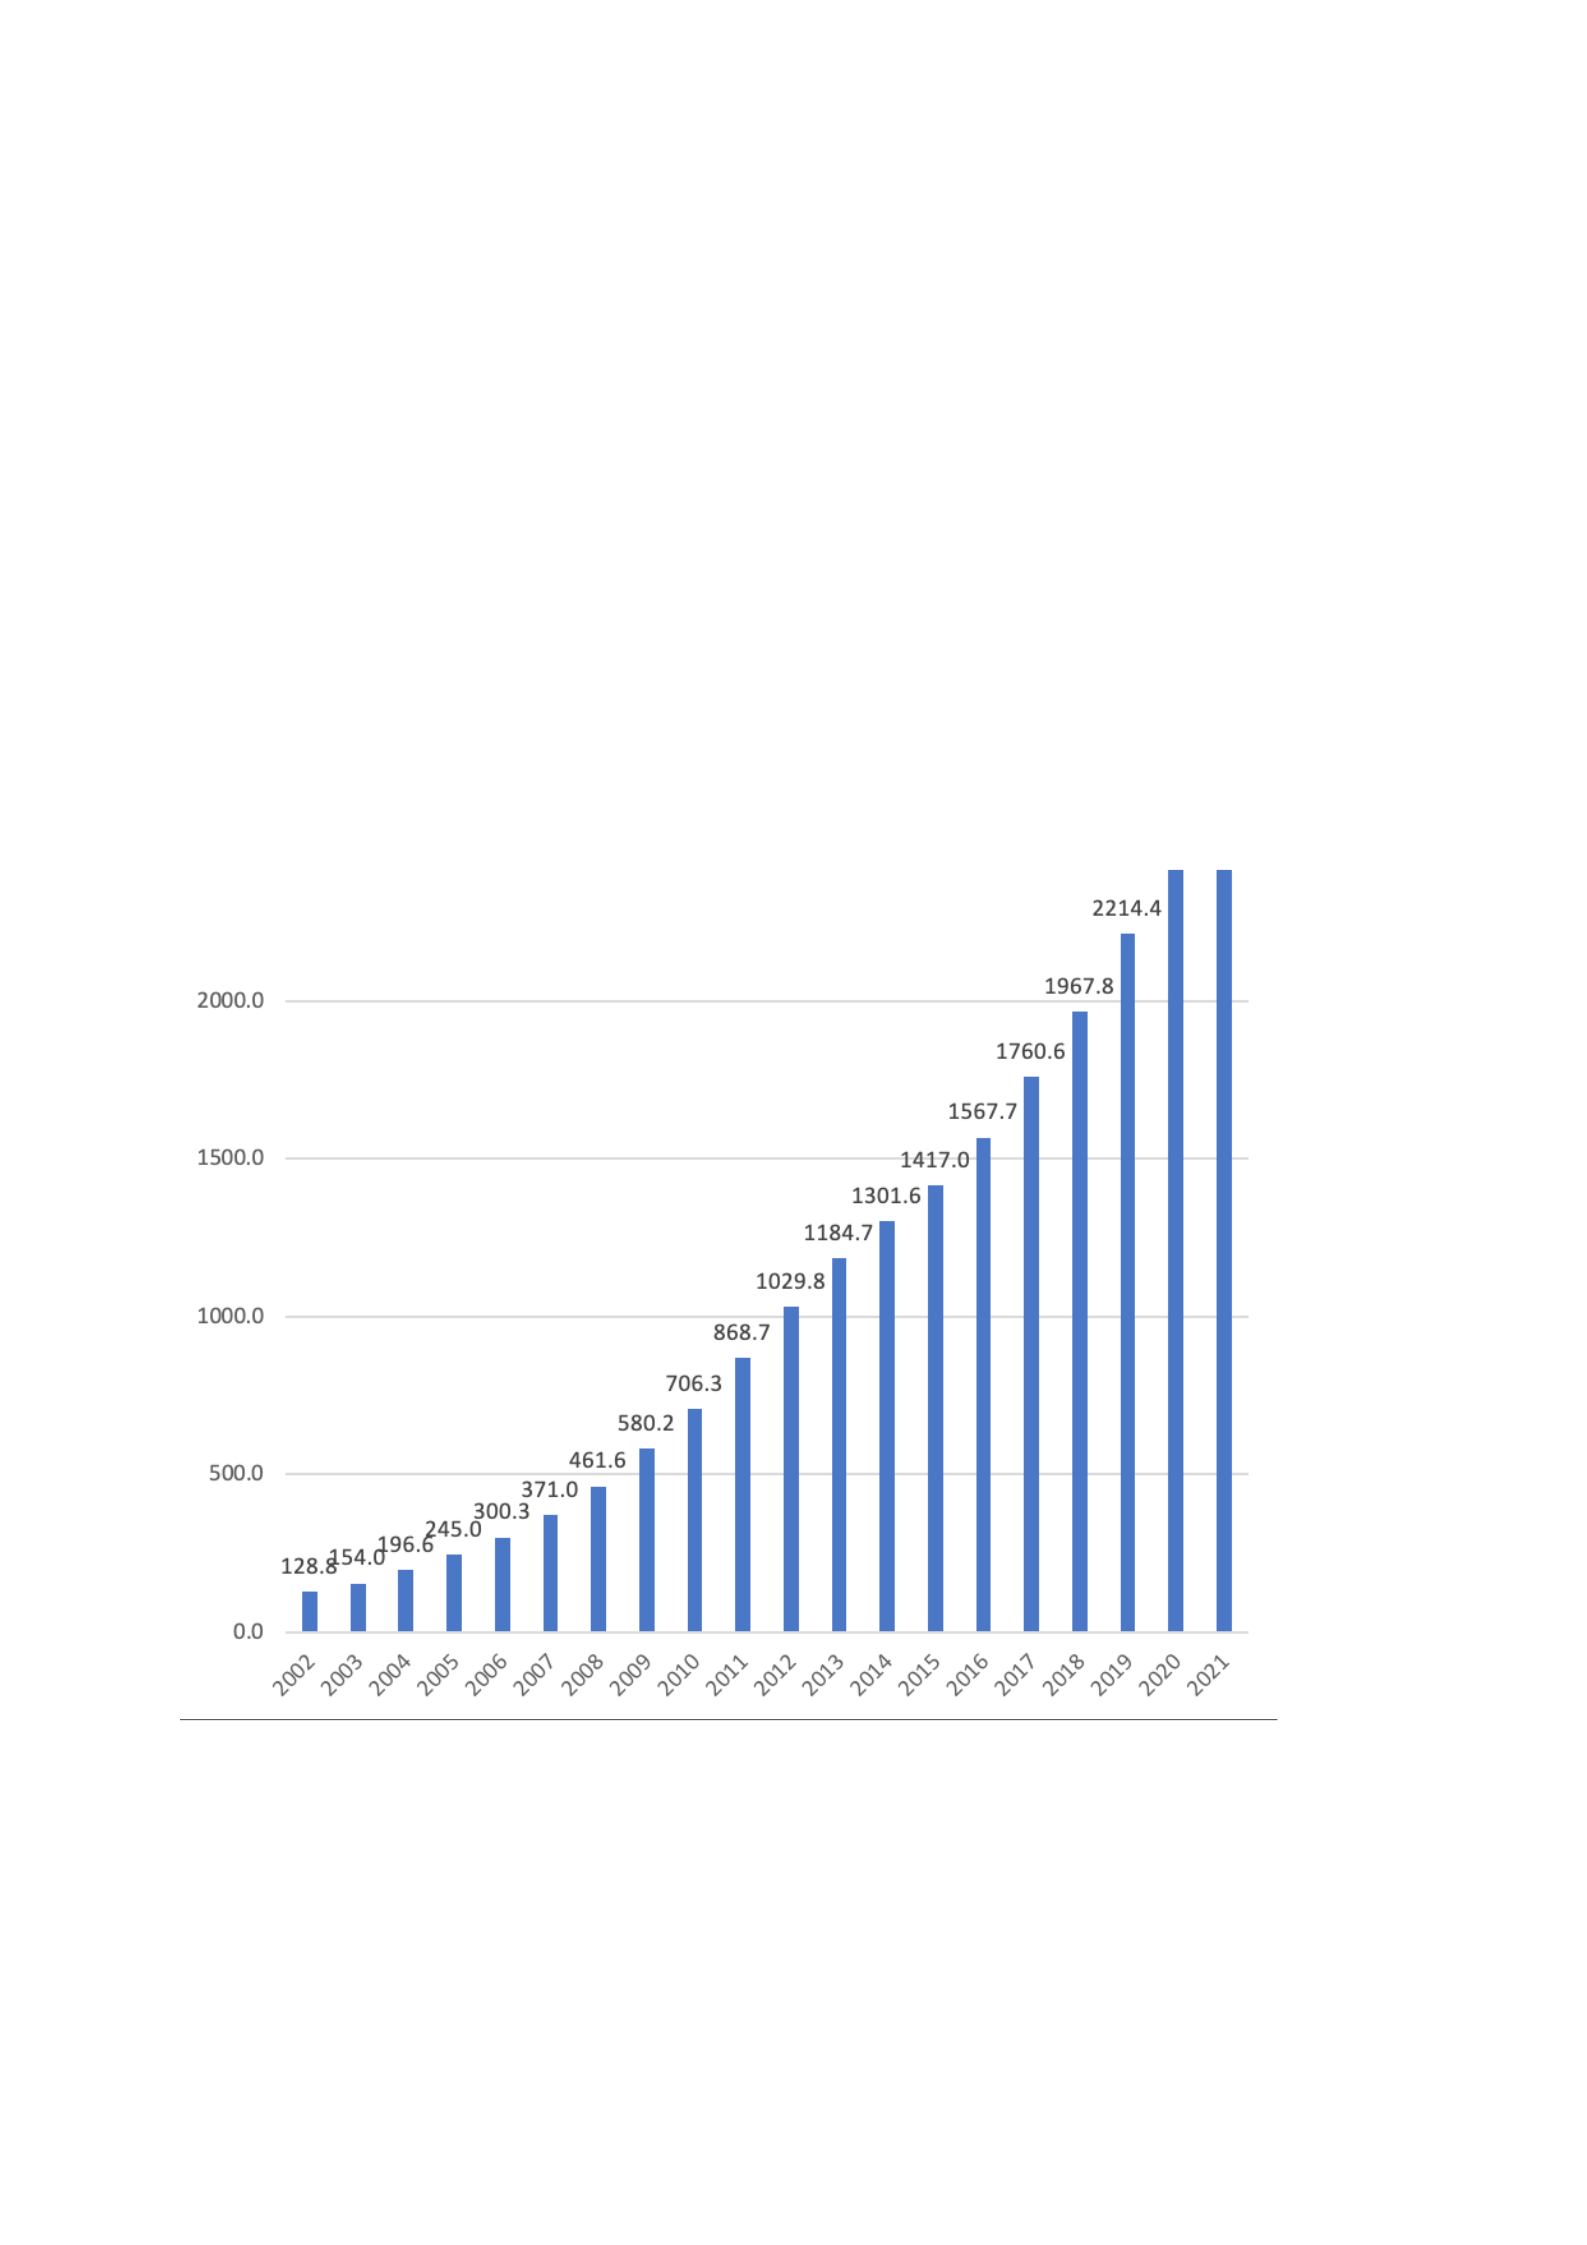
During the downturn in economic growth, Figure 1.3 exhibits that China has continued to
ramp up R&D investment, rising from 1184.7 billion yuan in 2013 to 2786.4 billion yuan
in 2020. In contrast to the annual growth rate in R&D expenditure of around 20% before
2013, the annual growth rate in R&D expenditure after 2013 shrinks to around
10%.
Figure 1.2 R&D Expenditure in China from 2002 to 2021
Source: National Bureau of Statistics
Generally, R&D expenditure is classified into three types - basic research, applied
research and experimental development. From Figure 1.4, experimental development
R&D ranks the top, applied research is second, followed by basic research. As China's
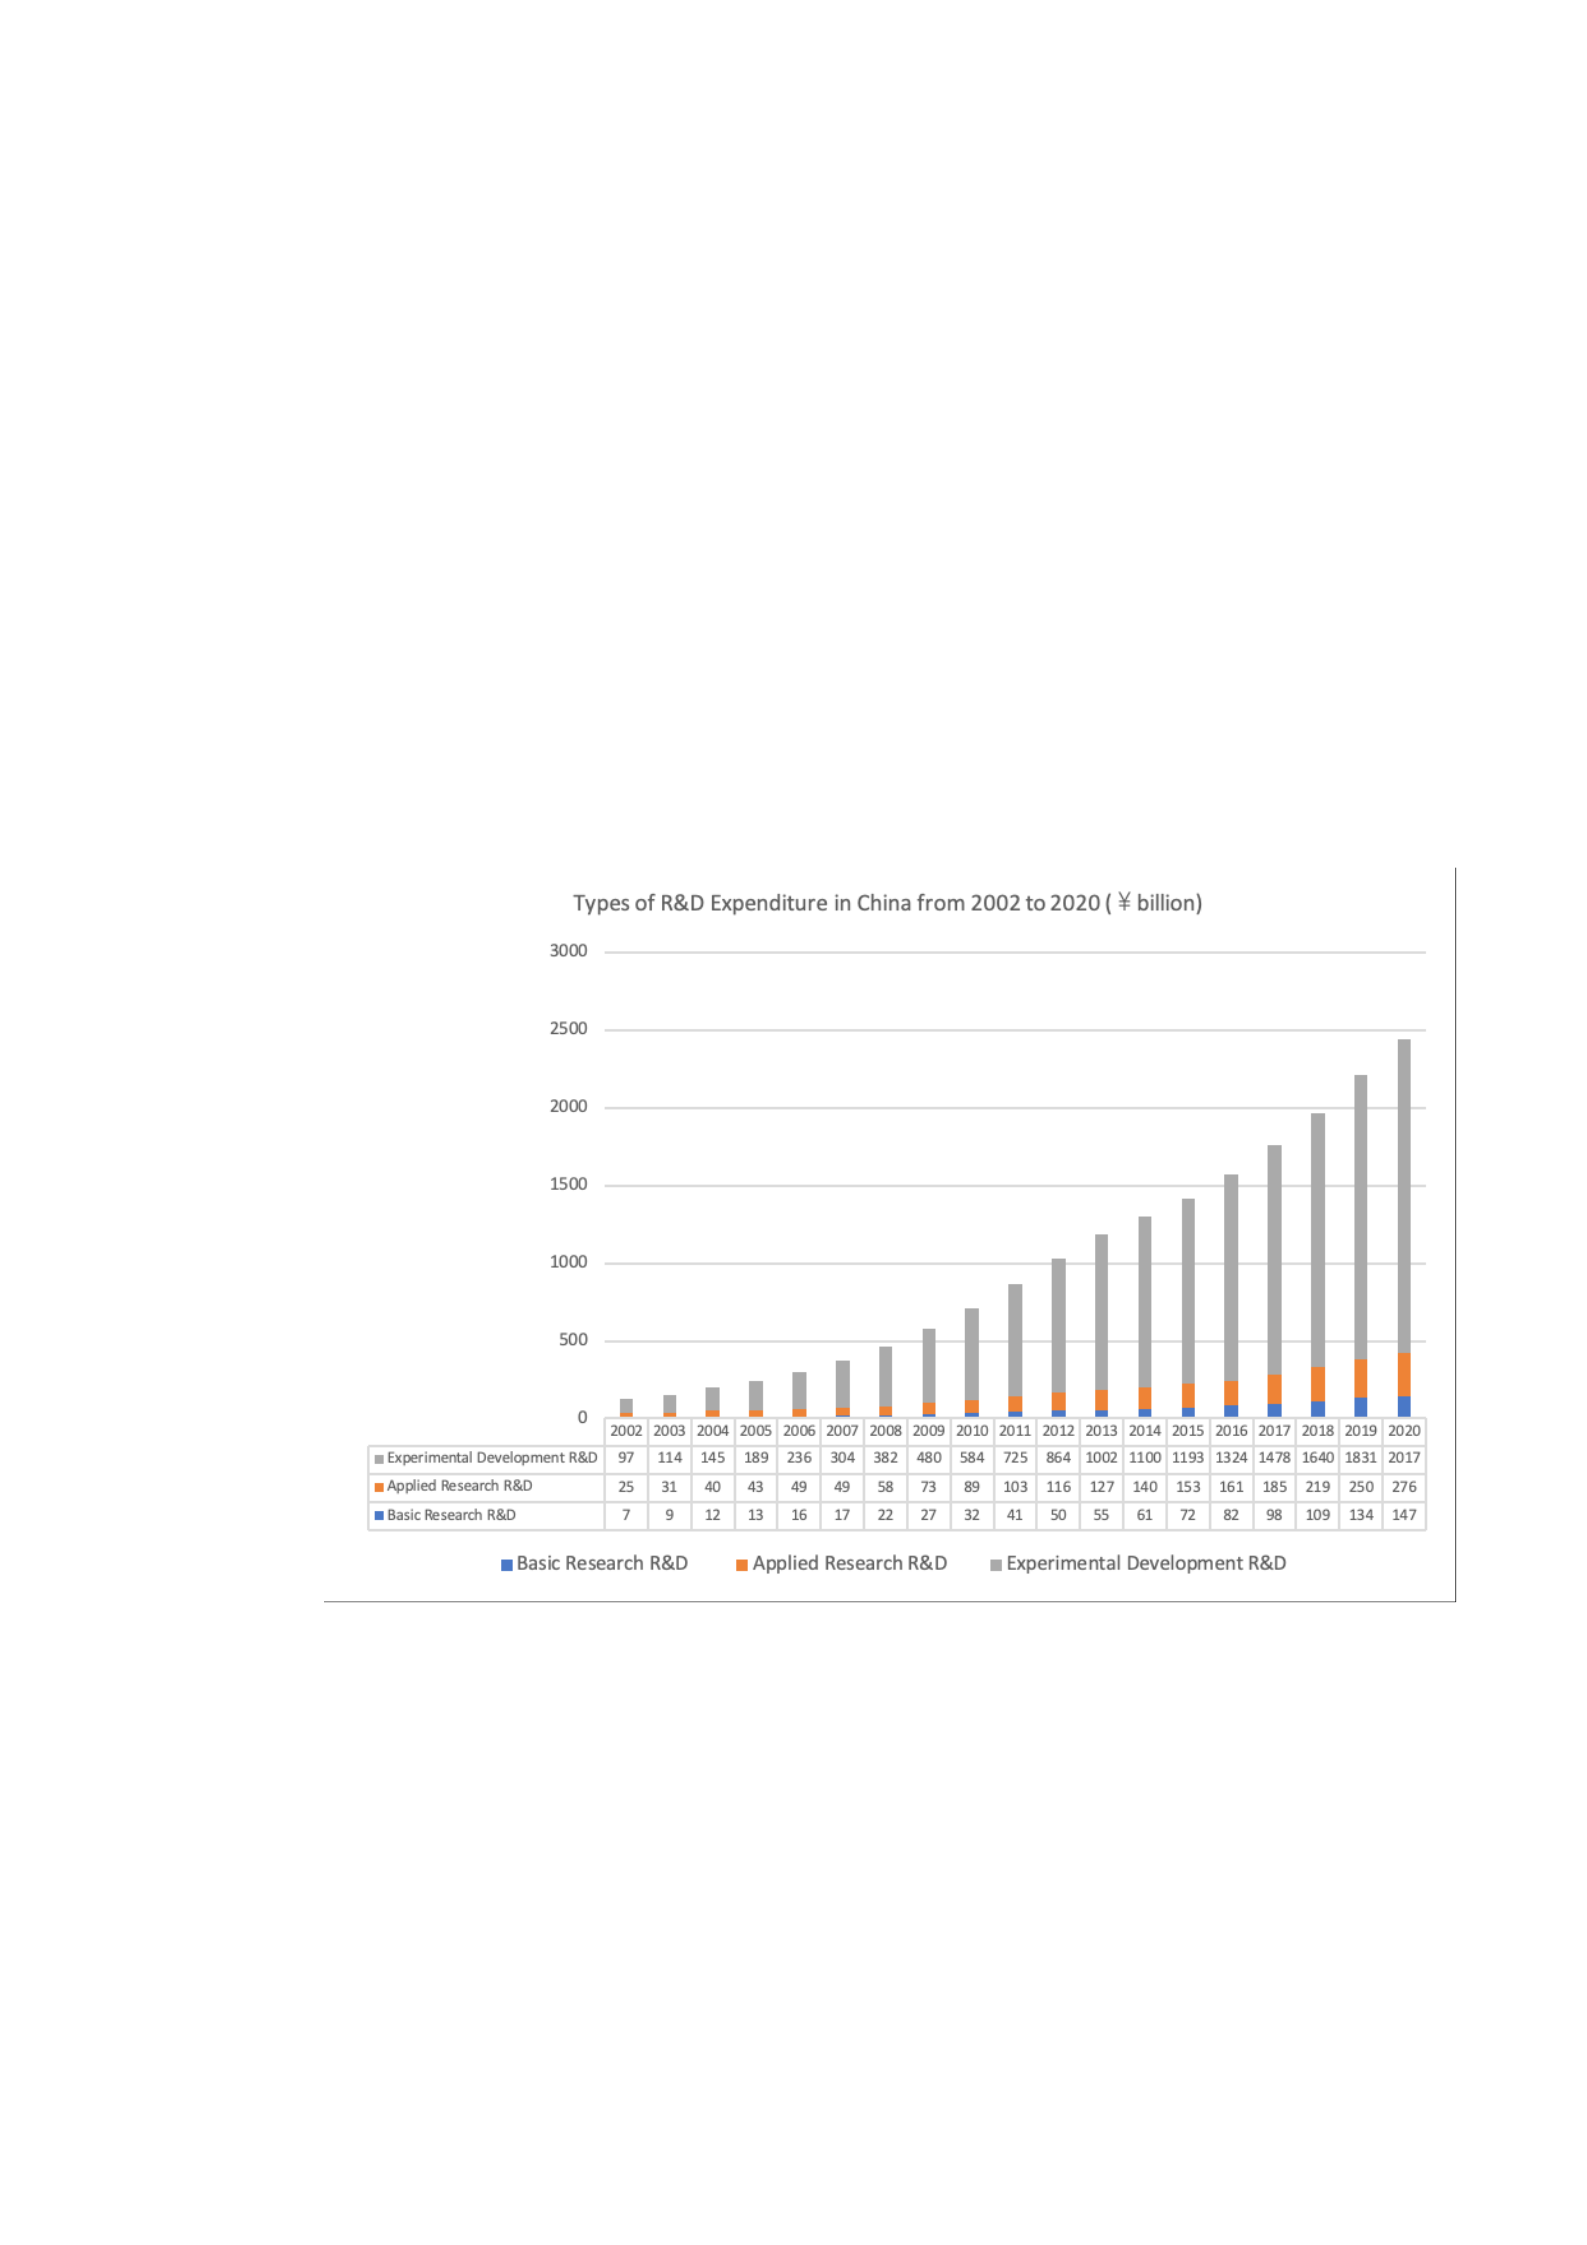
high-tech technologies have been repeatedly "strangled" by Western countries in recent
years, R&D expenditure in basic research in 2020 has nearly tripled compared to 2013.
Even so, R&D expenditure in basic research is still far below the other two R&D
categories.
Besides, R&D funding is mainly from the government and firms. Figure 1.5 demonstrates
that government funding for R&D is between 60% and 70% of total R&D funding
between 2002 and 2003. From 2004 to 2015, the state share hovers between 70% and
80%. After 2015, the state share of R&D funding is as high as 80%, while firm
R&D funding accounted for only 20%.
Figure 1.3 Types of R&D expenditure in China from 2002 to 2020 (¥ billion)
Source: National Bureau of Statistics
Figure 1.4 R&D expenditure in China
from 2002 to 2020 (%)

Source: National Bureau of Statistics
1.5.3 China’s Patent Data
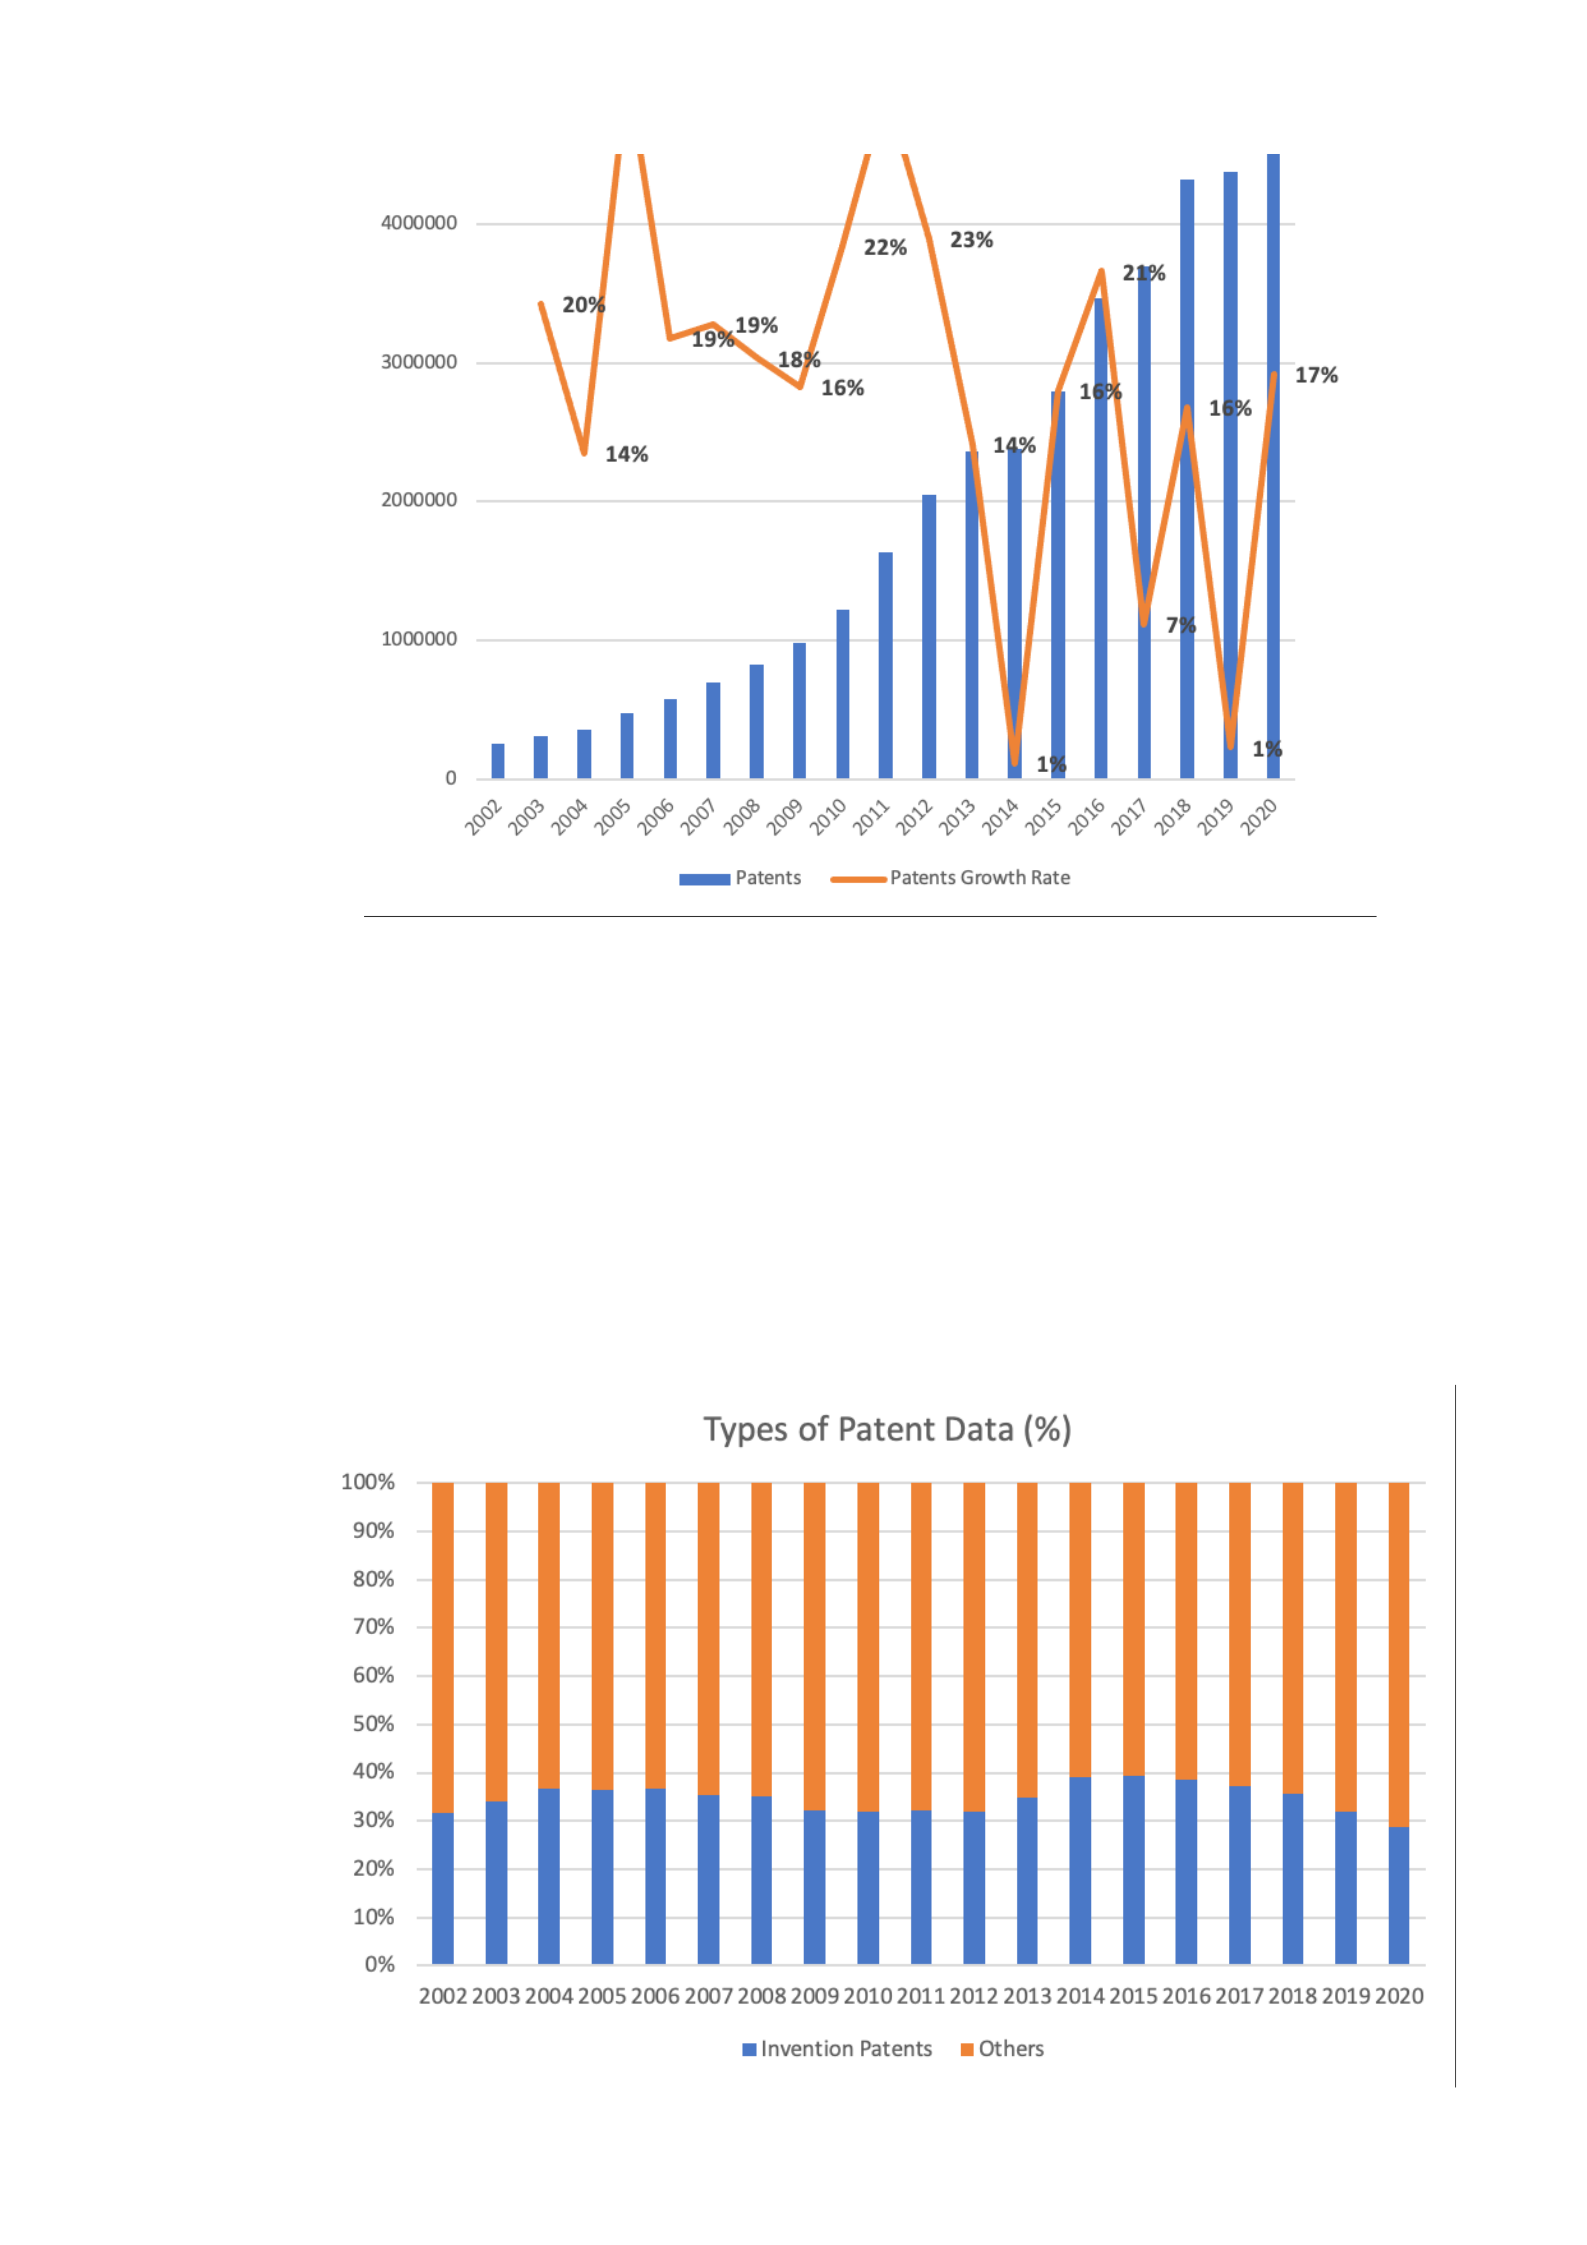
Figure 1.6 presents that the number of patent applications in 2020 has more than doubled
compared to 2013, during a period of slowing economic growth in China. However, the
post-2013 patent growth rate per year has decelerated markedly compared to the pre-2013
period. The total number of patents is perennially dominated by invention patents, which
fluctuate between 60% and 70%, as shown in Figure 1.7.
Figure 1.5 Patent Data in China from 2002 to 2020
Source:
National Bureau of Statistics
Figure 1.6 Types of Patent Data (%)
Source: National Bureau of Statistics

1.6 Contributions
This thesis confirms that, through economic theories and with the use of new data, firm
ownership remains an important consideration in constructing firms' innovation capabilities. It
clearly depicts the impact of firm ownership on innovation performance and finds that
different ownership structures have different effects on innovation performance. This is the
first contribution.
In particular, the use of two thresholds, 5% and 20%, further clarifies the different impacts of
ownership structures on innovation performance and helps to guide firms to establish a good
ownership structure and improve their innovation performance. In the fifth round of SOE
reform, the 5% and 20% thresholds can also give the government a reference for SOE reform,
so that SOE reform can lead to a better ownership structure and promote innovation
performance. This is the second contribution and fills the research gap.
In addition, this thesis also shows that there is no relationship between firm ownership and
innovation specialisation. Also, there is no relationship between firm ownership and
innovation diversification. It also fills the research gap focusing on innovation diversification
and specialisation. In China's unique economic environment dominated by state-owned
enterprises, firms' innovation specialisation and diversification are more likely to follow
policy support or the needs of the country.
Indeed, different countries have different corporate governance systems, mainly manifested in
ownership structures, board independence, CEO duality, the presence of an audit committee,
et cetera. The significant impacts of firm ownership on Chinese firms depend on the corporate
governance system in China, which is currently an ongoing mix-ownership reform.

1.7 Structure of Thesis
Chapter 1 is introduction. Chapter 2 is literature review. Chapter 3 is research design
containing hypotheses proposed. Chapter 4 is research methodology. Chapter 5 is data
analysis. Chapter 6 is conclusion.
Chapter 2 Literature Review
2.1 Introduction
This chapter reviews the concepts of innovation and firm ownership in the mainstream
literature and discusses the importance of knowledge for innovation. Section 2.2 is the
literature review about innovation, including the measurement of innovation used in the
research. Section 2.3 contains five different types of firm ownership in China and focuses
on the relevance of innovation and company ownership. Section 2.4 introduces the
importance of knowledge for innovation. The study treats the knowledge from two

perspectives – depth of knowledge and breadth of knowledge. Finally, section 2.5
explains fresh insights from past literature.
2.2 Innovation
2.2.1 Introduction
Innovation is referred to as a new method, idea, product, et cetera. Baregheh et al.
(2009) calculate the number of definitions of innovation in different scientific papers.
Amazingly, there are totally about 60 definitions. Therefore, they tried to merge and
summarise the definitions of innovation in multiple disciplines and made the following
conclusions: “Innovation is the multi-stage process whereby organisations transform ideas
into new/improved products, services or processes, in order to advance, compete and
differentiate themselves successfully in their marketplace. ” (Baregheh et al., 2009). As
people likely confuse innovation with creativity, Amabile and Pratt (2016) distinguish
creativity from innovation and give their respective definitions: (1)
creativity is a new and useful idea generated by an individual or teamwork; (2) innovation
is the successful implementation of creativity within the organisation.
2.2.2 Frameworks to Determine Types of Innovation
There are various frameworks to determine the types of innovation.
The first framework, which is created by HBS professor Clayton Christensen, contains
two types of innovation – sustaining innovation and disruptive innovation (Bower and
Christensen, 1995). Sustaining innovation is to innovate persistently existing products or
services based on the needs of current customers (Satell, 2017). For example, customers
prefer faster CPUs for electronic products or higher pixel sizes for mobile phones.
Disruptive innovation means new products, services, or business models disrupt the

market, eventually replacing other competitors as industry leaders (Christensen, 1997).
Amazon and Netflix are two examples of disruptive innovation. Disruptive innovation
plays a vital role in a successful business in the long term (Christensen and Overdorf,
2000).
The second framework is that Satell (2017) further subdivides the types of innovation
based on Christensen’s research (Bower and Christensen, 1995; Christensen, 1997) by
solving different types of problems. He believes that the core of innovation is to solve
problems and summarises four types of innovation:
a) sustaining innovation: it aims to refine capabilities in existing markets. In this
case, people have a clear understanding of what problems to solve and what skills
to use.
b) breakthrough innovation: the problem is well-defined, but is hard to resolve within
the area in which the problem arose. However, that problem may be solved
quickly within adjacent areas (Kuhn, 1970).
c) disruptive innovation: if the basic logic of market competition shifts, due to
technological changes or other changes in the market, firms’ products or services
will gradually be eliminated from the market, even if the products or services are
significantly refined. Product innovation will only worsen firm development when
it happens, and firms must innovate their business models instead (Christensen,
1997).
d) basic research: the definition of basic research is that it has the capability to form a
basis for the growth of global technology in the long term (Iansiti and Lakhani,
2017). In pathbreaking innovations, there is no boundary. People can always find
some new phenomena. Just as no one could know how the world would be shaped
by Einstein's discoveries, or no one could guess that Alan Turing's universal
computer would one day become a reality (Satell, 2017). From the perspective of
the history of science, a large number of basic research construct a scientific

knowledge system. It is not for immediate application, but will be found and
applied to benefit humanity after a long time period. Therefore, various countries
attach more and more importance to basic research, especially China. Facing the
technological blockade of western countries, China has swollen its investment in
basic research. Data from the National Bureau of Statistics in China show that the
investment in basic research reached 133.6 billion yuan in 2019, accounting for
6% of the total social R&D expenditure for the first time. This proportion hovered
around 5% for many years. In 2020, China's basic research funding was 146.7
billion yuan, an increase of 9.8% over the previous year. In 2021, China's basic
research investment reached 169.6 billion yuan, accounting for 6.09% of the total
social R&D investment. The third framework is McKinsey’s three horizons model
(Baghai et al., 2000). It helps firms think about their future, sort out their business
portfolio, and formulate their strategy for business coordination. Eventually, firms
achieve the goal of healthy firm growth. The model discloses how innovation
happens in those three-time horizons:
a) Horizon 1 is to maintain and strengthen the core business, thereby innovating
continuously within existing products, services, or business models. The delivery
time of Horizon 1 could be 3 to 12 months.
b) Horizon 2 is to explore and discover new expansion, extending the core business
to new markets, for example. The delivery time of Horizon 2 could be 24 to 36
months.
c) Horizon 3 is to create entirely new possibilities and competencies, thereby
responding to or utilising disruptive opportunities. The delivery time of Horizon 3
could be 36 to 72 months.
In modern society, Blank (2019) disagrees traditional delivery time of three horizons. In
the last century, some disruptive ideas required years of research, design and delivery.
Nonetheless, the delivery time of ideas for Horizon 3 can be as fast as the one for Horizon

1 today, so the delivery time of Horizon 3 products, strategies and capabilities has a
devastating impact on competitors. For example, Airbnb uses existing technologies (i.e.
mobile phone app and landlord) to create a new asset-light business model for tourist
accommodation, unlike hotels and deployed quickly in the short term. Bizarrely, the most
common user of rapid Horizon 3 disruption is not market leaders but challengers and new
entrants (e.g. China) (Blank, 2019).
2.2.3 Stages of Innovation
The early model comprehends three stages of innovation – idea generation,
problemsolving, and idea implementation (Utterback, 1971). Nevertheless, at that time,
the focus was on the manufacturing industry. Consequently, Utterback’s model for stages
of innovation is relatively inadequate.
Then, Mariello (2007) proposes a model with five stages of innovation. The first stage is
to generate the idea through free exploration or competition and hand it over to people
who can promote it. The second stage is to promote and screen the idea. The third stage is
to test the idea under specific conditions. The fourth stage is to commercialise the idea,
including cost and benefit evaluation. Finally, the fifth stage is to diffuse the idea in the
company, so the internal staff can accept it and spend resources to implement it
systematically.
2.2.4 Research and Development
Research and development (R&D) is a series of innovative activities by enterprises or
governments while innovating or introducing new products or services. Hence, R&D is
the first stage of developing potentially new products or services, whereas innovation is
the process of transforming ideas into new products or services. To put it differently, R&D
is a part of innovation in the definition, even though R&D and innovation are sometimes
interchangeable. As innovation is non-quantitative, R&D is applied instead to evaluate or
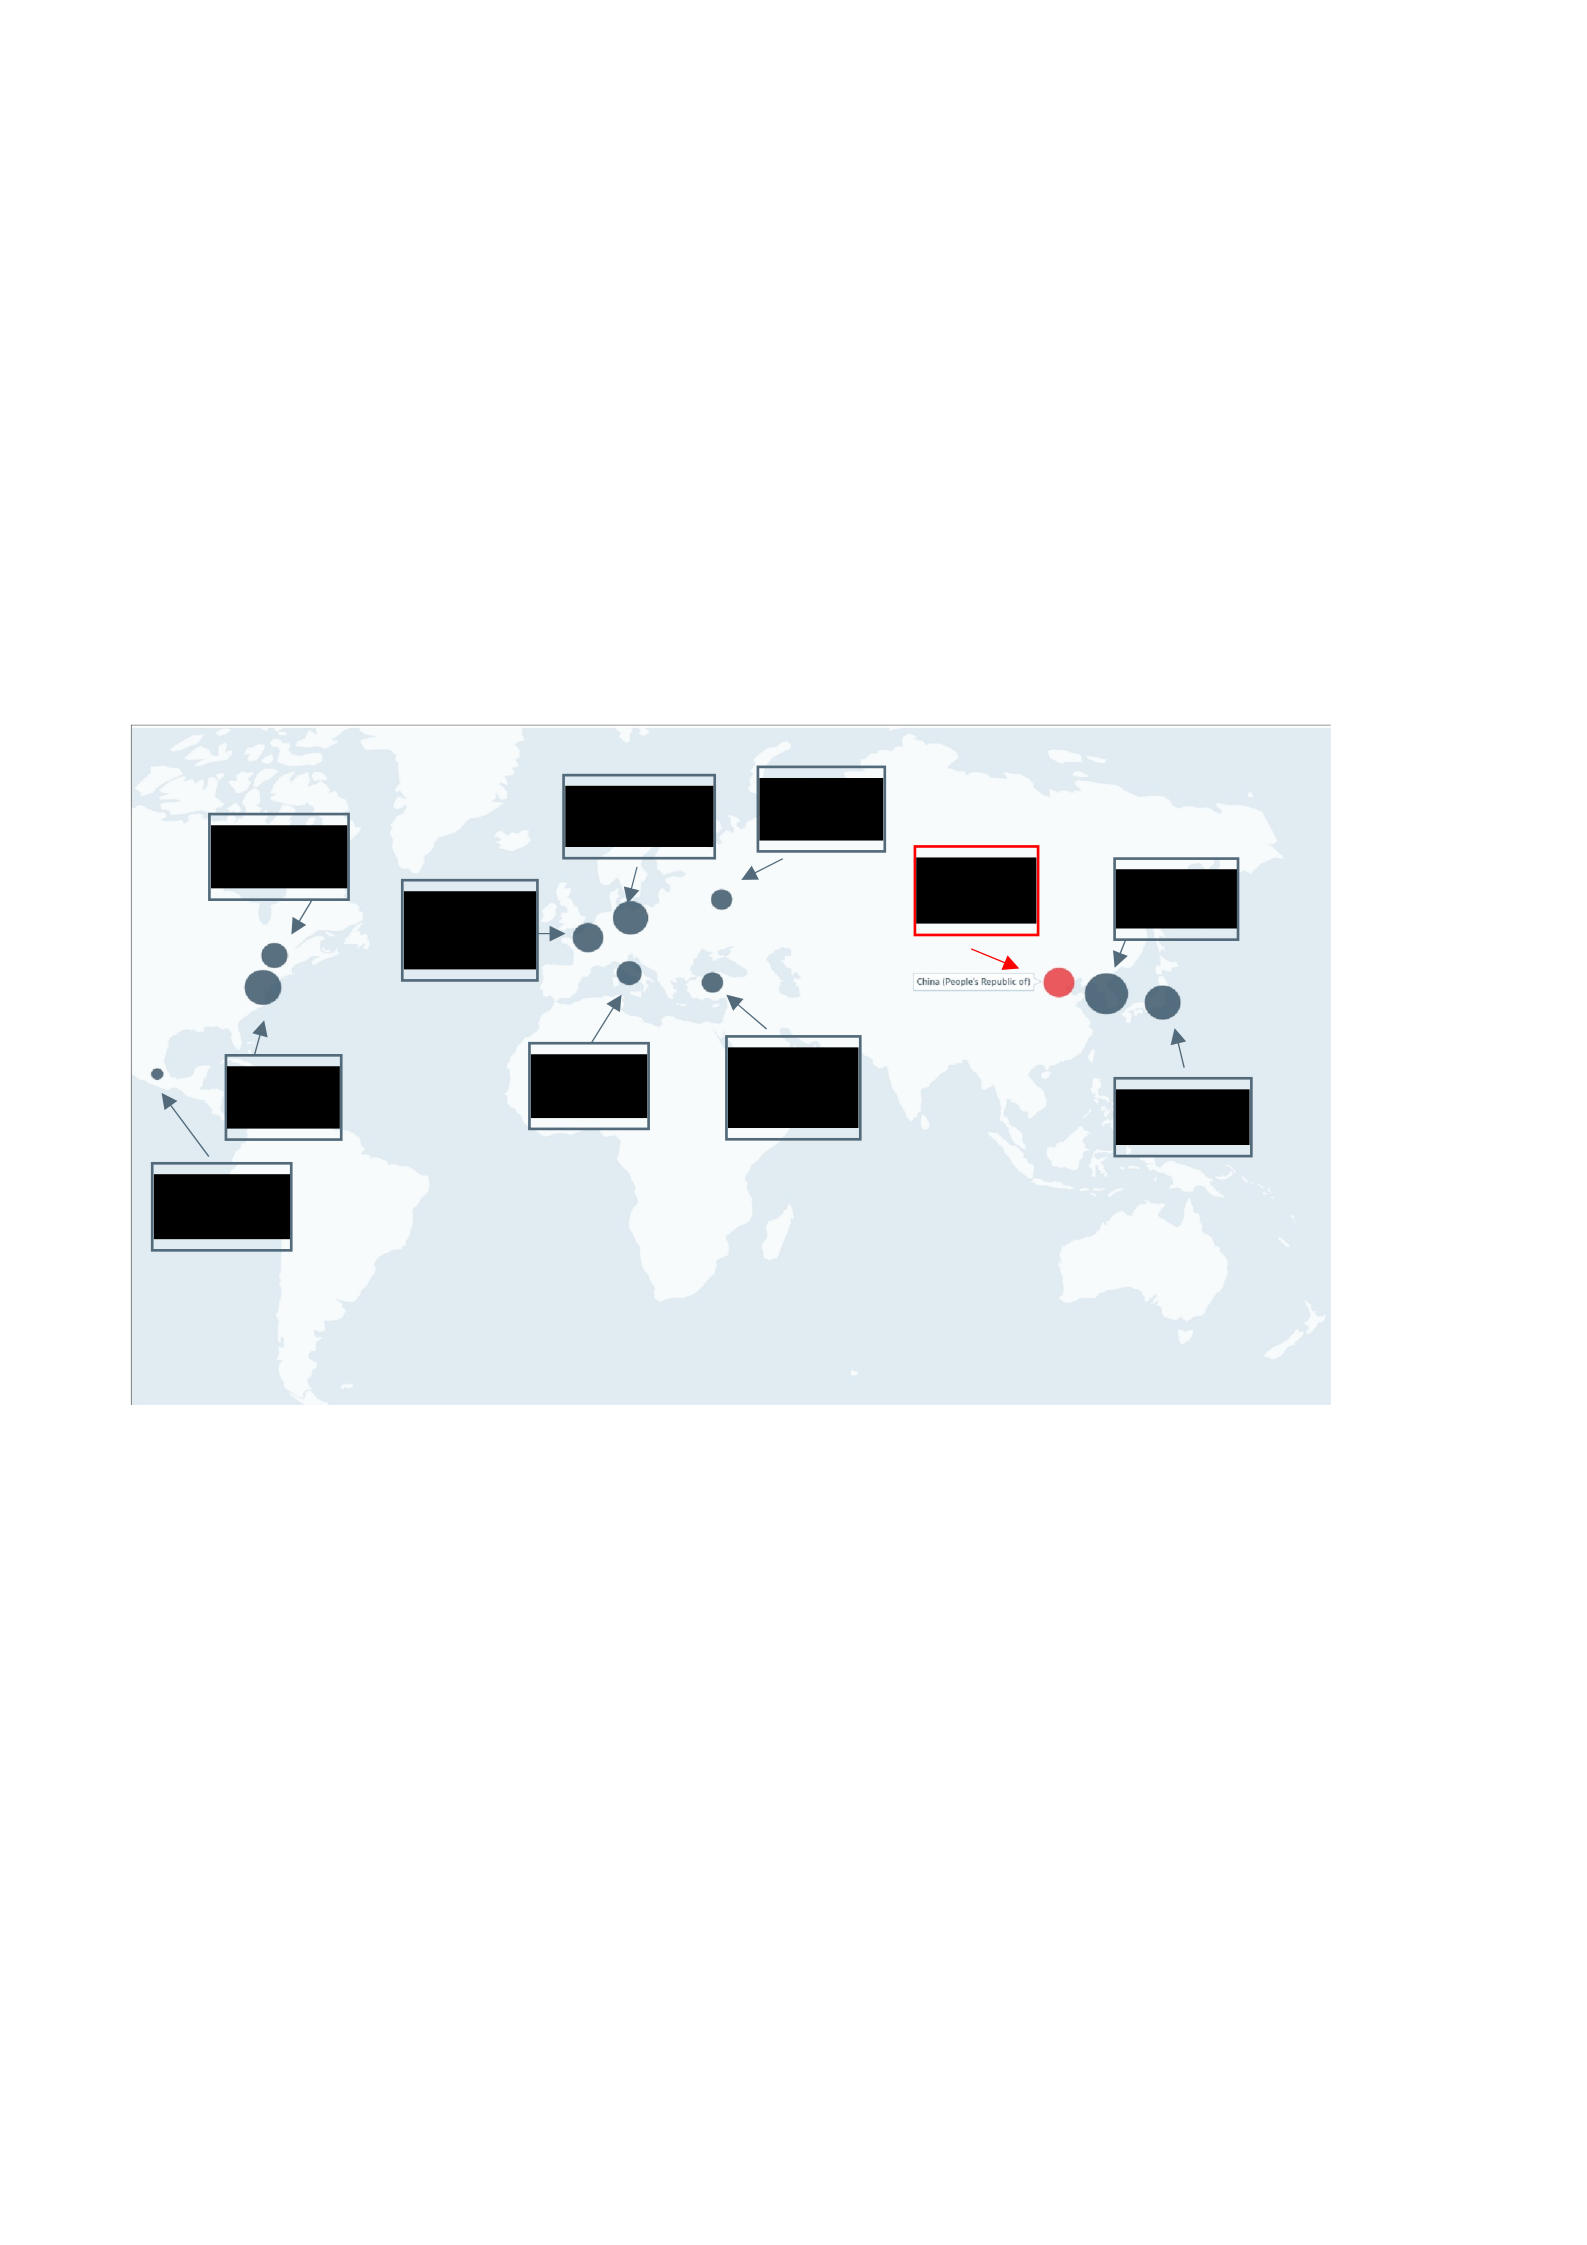
compare innovation. The proportion of R&D expenditure of gross domestic spending in
2020 for the G20 is displayed in Figure 2.1. Korea ranks first, with 4.8% of gross
domestic product (GDP). United States has the second highest percentage of R&D
expenditure over GDP (i.e. 3.5% of GDP). Japan follows it with 3.3% of GDP. R&D for
Germany is 3.1% of GDP, which are fourth. The fifth is China and France, with 2.4% of
GDP. Other countries are below 2% of GDP. Some G20 countries' data are not shown in
Figure 2.1 due to missing data.
Figure 2.1 The proportion of R&D Expenditure of Gross Domestic Spending
2.3 Firm Ownership
2.3.1 Introduction
Institutions change among countries (Vitols et al., 2001). Freeman (1995) stresses firm’s
R&D activities, ownership structures, and control are overwhelmingly dependent on the
domestic platform, and thus the country-specific institutional factors play a significant
role in determining the national innovation system. In other words, the crossnational
Japan 2020
3.3
% of GDP
Korea 2020
4.8
% of GDP
China 2020
2.4
% of GDP
Russia 2020
1.1
% of GDP
Turkey 2020
1.1
% of GDP
Italy 2020
1.5
% of GDP
Germany 2020
3.1
% of GDP
France 2020
2.4
% of GDP
Canada 2020
1.7
% of GDP
USA 2020
3.5
% of GDP
Mexico 2020
0.3
% of GDP

diversity of institutional settings can cause differences in national innovation systems
(Nelson ed., 1993). As a result, countries differ in terms of which innovation strategies
they apply and which innovation performance they produce. Also, the institutional
divergence explains how ownership constituents affect the firm’s innovation strategies
(Hoskisson et al.,2002). Anguilera and Jackson (2003) agree that this diversity is due to
institutional differences but also explain it through stakeholder interactions. The former
matters through their capacity to support the latter, and the latter generates different
demands on the national institutional configurations. In developed countries, there are
three models of corporate governance structure with respect to country-specific contexts:
(1) the Anglo-American model, which is featured by outside shareholders (which means
the separation of ownership and control), marketorientated corporate control, equity
finance, and state laws; (2) Japanese model, which is characterised by inside shareholders,
a long-term and strong relationship between companies and bank, corporation controlled
usually by insiders, and legal framework designed to stimulate groups affiliated by trading
relationships and cross-shareholdings; (3) German model, which highlights concentrated
ownership, the long-term linkage between bank and corporation, bank representatives as a
board of directors, and nonmarket orientated corporate control (Morck and Nakamura,
1999; Gibson 2000; Vitols et al., 2001; Aguilera and Jackson, 2003; Toms and Wright,
2005). Based on these models, scholars examine the causatives between corporate
governance and firm innovation performance (e.g. Francis and Smith, 1995; Guadalupe et
al., 2012; Aghion et al., 2013; Matzler et al., 2015).
However, many countries' contexts cannot simply be defined as those three models due to
institutional heterogeneity (Aguilera and Jackson, 2003). Especially, these established
models cannot describe corporate governance structures in developing countries. For
instance, because of reform and opening-up policy, Chinese firms' ownership constituents
have shifted from one dominant state ownership to five modern ownership - state
ownership (Lin et al., 2010; Cullinan et al., 2012; Song et al., 2015; Dong et al., 2022; Lo

et al., 2022), concentrated ownership (Ma et al., 2010; Zeng, 2010; Clò et al., 2020),
insider ownership (Su, 2004; Cheung and Wei, 2006; Cheng et al., 2021), institutional
ownership (Hadani, 2012; Schmidt and Fahlenbrach 2017; Lin et al., 2017; Li and Ji,
2021), and foreign ownership (Yoshikawa et al., 2010; Dachs and Peters, 2014; Kwon and
Park, 2018; Dong et al., 2022) - over last four decades. However, the diversity of Chinese
corporate ownership does not entirely deny the crucial role of state-owned firms in firm
performance and innovation. State ownership is still widely used in China and trusted by
ordinary people. Xie et al. (2022) observed that the corporate governance structure model
in China no longer converged with the AngloSaxon corporate governance structure
model. From 2015 to 2017, Chinese SOEs applied an alternative governance model that
legalises the governance authority of the CPC over the board of directors through a set of
regulatory attempts. The politicised governance model disrupted investor confidence in
firms and raised significant concerns about the state's power undermining other
shareholders' interests (Xie et al., 2022). Indeed, the politicisation of the governance
structure may be a genuine concern for foreign investors. Likewise, Cheng (2021) pointed
out that the US system is geared towards allowing businesses to affect the government,
while the Chinese system is geared towards aligning businesses with government
objectives.
In addition to the ordinary shareholders of listed companies, there is a special category of
shareholders in China known as legal persons, which is broadly similar to the status of
institutional shareholders recognised in the United States. Their shares are owned by
domestic institutions independent of, or partly owned by, the central or local government.
In other words, SOEs consist of state-owned and legal person shares. Indeed, a review of
the list of shareholders for all Chinese listed firms discloses that the majority of
shareholders classified as legal person is, in fact, owners with close ties to the state.

In short, this section deals with five ownership structures – concentrated ownership,
insider ownership, state ownership, institutional ownership and foreign ownership -
including the link between them and innovation.
2.3.2 Agency Theory for Ownership Structure
2.3.2.1 Introduction of Agency Theory
According to Jensen (2000)’s definition, agency theory assumes that a contractual
relationship exists between two conflicting parties: one party is the principal or supervisor
(i.e. the principal); the other one is the subordinate (i.e. the agent). The principal
delegates decision-making powers to the agent and expect the agent performs some action
in the principal’s favour. In contrast, the principal’s and the agent’s behaviours can be
motivated by their self-interest (i.e. preference, conviction and information) because they
are considered a rational economic person. Then, agency theory comprises the following
issues (Akerlof, 1970; Murthy and Jack, 2014):
1) Asymmetric information: principal-agent problem usually arises when the
interests of the two parties are divergent and information is asymmetric (the agent
has more information than the principle), so that the principal cannot directly
guarantee that the agent’s interests always align with the principal’s best interests.
2) Moral hazard: moral hazard is likely to happen under information asymmetry. One
example is that the agent may lack effort in performing the delegated task, but the
principal has difficulty in evaluating the level of effort actually spent by the agent.
3) Adverse selection: this is where an agent misrepresents their skills in performing a
task, and the principal is unable to thoroughly check this in advance of deciding to
recruit them. To avoid this, the principal may contact the person for whom the
agent previously provided services.
In the modern corporation, a firm owner or shareholder is the principal, and a firm
manager is the agent. The separation of ownership and corporate control generates agency

problems. Agency theory addresses this problem arising from the different objectives or
desires between the principal and agent (Berle and Means, 1932; Clark et al., 1985).
These differences generate agency cost such as residual loss
(Jensen and Meckling,1976). However, it can be mitigated or eliminated by monitoring
managers' behaviour or providing them with incentive schemes that reward them
financially for maximising shareholder benefits (Boučková, 2015; Feldman and
Montgomery, 2015). Typically, the schemes cover the incentive stock plan that managers
obtain shares, perhaps at a lower price. Accordingly, the objective of managers is in
alignment with one of the shareholders (Jensen and Meckling, 1976). The agency theory,
therefore, assumes that people are egoists and suggests that conflicts of interest between
principal and agent can be dissipated by providing appropriate incentives or monitoring
(Berle and Means, 1932; Jensen and Meckling, 1976).The agency theory therefore
assumes that people are egoists and suggests that conflicts of interest between principal
and agent can be dissipated by providing appropriate incentives or monitoring (Berle and
Means, 1932; Jensen and Meckling, 1976).
2.3.2.2 Problem of Agency Theory in Developing Countries
Traditional agency theory was established to build a foundation for the Anglo-American
model, so previous studies of agency theory have mainly focused on developed countries
(Young et al., 2008). The emphasis of corporate governance reforms has therefore been on
addressing the problems caused by the separation of ownership and control of companies.
Nevertheless, some argue that traditional agency models are not applicable to developing
countries (Yusuf et al., 2018). It is because firms in developing countries have a relatively
high level of concentrated ownership, high family control and mismanagement (Young et
al., 2008; Yusuf et al., 2018). Despite such shortcomings, corporate governance reforms
based on the agency theory have diffused in developing countries mainly due to the desire
of these firms for investments from foreign financial institutions. Accordingly, there is a
lack of widespread attention to the issue of inappropriateness arising from corporate

governance reforms based on agency theory in developing countries (Yusuf et al., 2018).
The inapplicability of agency theory leads to ineffective or inefficient corporate
governance reforms in developing countries (Reed, 2002; Uddin and Choudhury, 2008).
As an example, in Pakistan, agency theory is weakened by management's opportunism in
not being able to use financial incentive schemes to reconcile the interests of the principal
and the agent, and by the scarcity of independent directors (Yusuf et al., 2018). He,
therefore, recommends the use of rigorous external audits and the appointment of audit
firms by the regulator. The other method is to introduce legislation protecting the rights of
minority shareholders.
2.3.2.3 Agency Theory and Innovation
According to agency theory, shareholders (i.e. principals) hire managers (i.e. agents) to
operate the firm on behalf of the shareholders (Jensen and Meckling, 1976). The growth
of firm value is related to shareholders' control power over managers' behaviours and
strategies. It is because the agent shrinks his/her responsibilities to the principal whenever
the agent has the opportunity because of egoism (Eisenhardt, 1989a). The most capable
agent can mitigate a rise in agency risks owing to adverse selection and moral hazard
(Jensen, 1993).
Radical technological innovation (RI) may compound the agency risks of adverse
selection and moral hazard due to high uncertainty of the link between technology and
markets and ignorance of the relationship between technology and market outcome
(O'Connor and Rice, 2013). Furthermore, RI requires the pooling of multiple agents to
participate in R&D (Winter, 2013), further magnifying information asymmetries and
making it difficult to allocate decision-control rights, set appropriate rewards and screen
out R&D failures due to management egotism (Aghion and Tirole, 1994). As a result,
senior managers may be reluctant to carry out RI in their core business for the concern
about disrupting the core business, while creating apprehension among bottom-level
employees (Christensen, 1997). Indeed, technical management has always believed that

RI should be separated from existing operations and that it should offer risk-averse and
middle-level management the autonomy to explore the uncertain routes to growth.
(Burgelman, 1991).
In contrast to traditional studies, some studies consider the top manager the principal and
the middle manager the agent (Jones and Butler, 1992; Shaikh and O'Connor, 2020).
Contrary to agency theory, innovation research usually discourages the usage of financial
incentives. The reason is that it can lead to jealousy and enmity among team members,
which can ruin a good atmosphere of teamwork. Lazonick (2007) presents an opposite
view that most well-established R&D firms make reparation to top managers with options
and equity. Those compensation packages can be even higher than those of
Wall Street executives (Lazonick and Tulum, 2011). The two opposing views on which
Shaikh and O'Connor (2020) are based state that the senior management's use of financial
rewards can drive RI project teams to incremental innovation, although the optional non-
financial external rewards used can enhance the intrinsic motivation of individual agents
to engage in the pursuit of RI at the project level.
2.3.3 Resource-based Theory and Innovation
2.3.3.1 Introduction of Resource-based Theory
The idea of resource-based view was first emerged in Wernerfelt’s paper (1984) and
evolved into a matured theory about corporate governance in Barney et al.’s paper (2011).
The main prospective of resource-based theory is to explain why firms differ and how
they achieve sustainable completive advantage based on firm resources and capabilities
(Barney et al., 2001). The resources that the firms can apply for implementation of
business strategies can be tangible and intangible assets containing physical assets,
financial capital, human capital, organizational resources (Barney and Arikan, 2005). The
capabilities can be management skills and firms’ organisational processes for example
(Barney et al., 2011). Faced with rapid technological change, Teece et al. (1997) go
further to the idea of “dynamic capabilities” and confirm that firms’ specific

organisational processes, tangible and intangible assets (knowledge stock) and managerial
processes determine the firms’ profitability because those three factors significantly affect
firms’ competencies based on the level of difficulty of replicability (expanding internally)
and inimitability (barriers to imitation).
2.3.3.2 Resource-based Theory and Innovation
In developing counties, firms may face resource scarcities and obsolescence. A crucial
challenge is to comprehend what impedes firms to acquire resources and capabilities and
how they might resolve (Wright et al., 2005). Hence, resource-based theory can be
applied to investigate innovation activities in a firm that require valuable and specific
resources. Individual firms usually rely on external recourses for innovation as they do
not have all needed resources. According to this perspective, the assumption of outside
shareholders who have rich resources benefiting innovation activities and firm
performance is made. Consequently, firms with state ownership can be seen as boundary
spanner. Those firms in developing countries have political and financial privileges over
others (Vo, 2018) and provide policy and resource benefit which is crucial for firm
development (Zhou et al., 2017). Specifically, state-owned firms can obtain more
tradeable or non-tradeable resources - important infrastructure resources (Chang et al.,
2006; Siegel, 2007), land (Tan, 2006; Chen et al., 2014), policy support, natural link exists
among SOEs, universities and research institutes, or R&D resources
(Wang et al., 2017) - to invest in innovation activities.
2.3.4 Concentrated ownership
2.3.4.1 Introduction of Concentrated Ownership
Concentrated ownership means that majority of stock shares are owned by individuals,
non-institutional or institutional investors, who have voting rights and/or cash flow rights.
Traditionally, the only degree of equity concentration is considered an indicator of
concentrated ownership. Usually, investors hold at least 5% of shares. The higher the
shares owned by a few investors, the stronger the governance power. It is because larger-

block shareholders have strong monitoring power over incumbent managers. As argued
by agency theory, shareholders’ interests are alignment with managers’ interests (Ortega-
Argilés et al., 2005), alleviating agency conflicts and reducing agency costs (Jensen and
Meckling, 1976; Hill and Snell, 1988; Francis and Smith, 1995; Morck et al., 2005;
Belloc, 2012). Consequently, concentrated firms perform better financially than separated
ownership (Claessens and Djankov, 1999; Xu and Wang,
1999; Singal and Singal, 2011; Wang et al., 2012; Nguyen et al., 2015).
2.3.4.2 Concentrated Ownership and Innovation
Concentrated ownership has a positive impact on innovation as it lowers agency costs and
constrains the behaviour of managers (e.g., Di Vito et al., 2010; Hill and Snell, 1988;
Holmstrom,1989; Baysinger et al., 1991; Francis and Smith, 1995; Lacetera, 2001).
Specifically, Baysinger et al. (1991) study 176 Fortune 500 companies by using linear
regression with R&D spending per employee as a dependent variable and stock
concentration levels as an independent variable, meanwhile controlling for average
industry R&D intensity, diversification, and firm size. Lacetera (2001) focuses on 27
US pharmaceutical firms from 1994 to 1999 by using the cross-sectional time-series
FGLS method with R&D intensity as a dependent variable and ownership concentration,
insider shareholding, insider presence in the board of directors, the presence of scientists
in the board of directors as independent variables, controlling firm size and financial
stability. Di Vito et al. (2010) use panel regression to investigate 259 firms in Canada
from 1998 to 2007 with R&D intensity as a dependent variable, concentrated ownership –
the level of voting rights, the difference between voting and cash flow rights, heir-
controlled, founder-controlled, and family-controlled - as independent variable, and the
presence of institutional shareholding, firm age, firm size, firm growth, the long-term
debt, and industry dummies. Chang et al. (2006) compare innovation performance in
group-affiliated firms and independent firms by collecting the data from the top 500
Taiwanese and Korean manufacturing firms between 1991 and 1999 and performing the

Poisson regression and the negative binomial regression model with the number of patents
as a measurement of innovation performance. One reason is that controlled owners are
more willing to take innovation strategies with high risk even if the possibility of success
of an investment project is low, while managers within dispersed ownership prefer
imitation strategies with low risk as they undertake the cost of failure (Hill and Snell,
1988). In transition economies, a high degree of concentration provides an efficient
monitoring mechanism that is crucial to innovation activities in transition economies
(Nguyen et al., 2015). Moreover, shareholders pursue a high return by virtue of greater
investment in innovation even though a specific high risk is borne (Hill and Snell, 1988;
Baysinger et al., 1991).
In contrast, some studies argue that stock concentration has a negative influence on
innovation performance regardless of a country’s level of development (Ortega-Argilés et
al., 2005; Di Vito et al., 2010; Minetti et al., 2015; Shi and Xie, 2016; Steffen and Iuliia,
2016; Wan et al., 2021). In opposition to the R&D intensity as a measurement of
innovation performance (dependent variable), Di Vito et al. (2010) perform the number of
patents as the alternative measurement of innovation performance to get the negative
impact. Ortega-Argilés et al. (2005) apply the Tobit-type model and the Passion
regression model with R&D expenditure per employee and the number of patents as
dependent variables respectively to explore in Spanish industries during 2001. The
relevant main independent variable is the degree of separation of ownership and
management functions, and control variables contain the firm size, firm age, debt,
concentrated ownership, a dummy variable for a listed firm or not, technological
opportunity level, region in which the firms located, and the structure of the market in
which the firms operated. Steffen and Iuliia (2016) analyse 75214 firms from 24 emerging
market economies (e.g., Taiwan, Israel, Hungary, South Africa, Brazil, Thailand, Poland,
Chile, and Mexico) between 1998 and 2012 by using the fixed effects model with R&D
expense as a dependent variable, ownership concentration and the levels of shareholder

rights protection as independent variables, sensitivity of cash flow rights, inflation rate,
firm size, leverage, and a complementarity effect between the levels of capital and R&D
intensity as control variables. Minetti et al. (2015) investigate 20000 Italian manufacturers
by using OLS, Probit, two-stage least squares (2SLS) regressions with R&D expenditure,
R&D personnel, and the number of patents as main dependent variables, degrees of
ownership concentration as the main independent variable, firm age, firm size, number of
employees, credit rationing, credit relationship and the duration of the relationship with
the main lender (banks), region in which the firms located, number of branches,
provincial GDP growth, provincial Herfindahl, and local financial development. Wan et
al. (2021) study Chinese firms listed on the Shanghai and Shenzhen Stock Exchanges
from 2007 to 2018 by using the pooled crosssectional regression with R&D intensity as
the dependent variable, ownership concentration as the main independent variable, firm
size, leverage, firm performance, Tobin’s Q, CEO age, cash holdings, operating cash flow,
and the nature of the controlling shareholder as control variables. The reasons include
agency conflicts between large-block and minority stockholders, risk aversion caused by
an absence of diversification, increased risk undertaken by owners, liquidity constraints in
the market, and fewer opportunities for negotiation of firm value (Ortega-Argilés et al.,
2005; Choi et al., 2011; Minetti et al., 2015). Further, Wan et al. (2021) explain that the
tunnelling effect of controlling shareholders disincentives the investment in R&D. By
definition, the tunnelling effect is an immoral business behaviour in which large
shareholders transfer firm assets or profits to private-owned firms for their benefit at the
expense of minority shareholders. Accordingly, an improvement in the regional
governance environment can dampen the negative effect of concentrated ownership on
innovation performance caused by the tunnelling effect (Wan et al., 2021).
Besides, concentrated ownership and innovation performance are non-linearly related
(Abdullah et al., 2002; Gompers et al., 2004). Lee (2005) focuses on listed firms in the US
and Japan during 1995 across seven industries - automotive, chemicals, communication,

computers, electronics, pharmaceuticals, and power – by using the country-specific and
pooled regressions and proposes that the concentration-innovation relationship is not only
nonlinear but also nonmonotonic: in the US, ownership concentration is negatively
related to innovation outcomes when R&D investment is low, but positively related to
innovation when R&D investment is high; in Japan, ownership concentration is positively
related to innovation when R&D investment is low, but negatively related to innovation
when R&D investment is high. The relevant dependent variable is the number of patents,
the independent variable is stock concentration, and control variables consist of
contemporaneous R&D expenditures, firm size, market-to-book, leverage, and industry
dummies. Li et al. (2010) and Chen et al. (2014) also reveal an inverse U-shape
relationship between ownership concentration and innovation in emerging economies
such as China by using one-factor, two-factor, and correlated uniqueness models with a
seven-point differential scale for product innovation as the dependent variable,
concentrated ownership as the independent variable, firm size, region, a industry dummy
variable to identify a high-tech industry, sales growth and return on equity, a dummy
variable to identify a state-owned firm, firm development stage, and effective production
process as control variables. The relevant sample period is from 2002 to 2004. The other
reason of non-linear relationship is that the effect of board independence on firm
performance rises as the degree of concentration decreases (Li et al., 2015).
2.3.4.3 Concentrated Ownership and Hypothesis
Firms with concentrated ownership have agency costs created from principal-agent
objective conflict. The majority shareholders are likely to advance their interests by
expropriating from minority shareholders in developing countries (Su et al., 2008). It is
not feasible in developed countries where the concentration of ownership may lead to
more effective monitoring mechanisms (Fama, 1980; Zajac and Westphal, 1994), but it
may not be the case in developing countries. Aside from this, risk aversion due to lack of
diversification, increased risk to be borne by owners, liquidity constraints in the market,

and reduced opportunities to negotiate the value of the firm can all negatively affect
innovation performance for ownership concentration (Ortega-Argilés et al. 2005; Choi et
al. 2011; Minetti et al. 2015). In recent research, Wan et al. (2021) raise the issue of the
tunnelling effect in Chinese firms, which hurts minority shareholders’ interests and
undercuts R&D investments. Hence, the following hypothesis is proposed: H1.
Concentrated ownership and the firm’s innovation performance will be negatively related.
2.3.5 Insider Ownership
2.3.5.1 Introduction of Insider Ownership
Insider ownership is defined as shareholding by individuals closely related to the firm's
management and/or individuals with exclusive voting rights. It includes the firm's
founders and their descendants, subsidiaries, managers, executive directors and
employees (Chang et al., 2006). It then can be grouped into three types of insider
ownership – managerial ownership (e.g. Vijayakumaran, 2021), family ownership (e.g.
Delgado-García et al., 2022), and employee ownership (e.g. Hennig et al., 2022. ).
Firms with insider ownership demonstrate that managers' objectives are aligned with
insiders' interests rather than those of dispersed outsider ownership shareholders. Insiders
are more aware of the reality of the company than outsiders, especially individual
investors (Choi et al., 2012). As a result, a higher firm performance can be achieved for
firms with insider ownership (e.g. Drakos and Bekiris, 2010). In other words, insider
ownership – managerial ownership (e.g. Jensen and Mecking, 1976; Florackis et al.,
2009), family ownership (Chang, 2003; Morck et al., 1988), and employee ownership
(e.g. Nickel, 1990; Kim and Patel, 2017) – has a positive impact on company performance
owing to the lower agency costs.
Conversely, some studies propose that managerial ownership (e.g. Gomes, 2000; Acharya
and Bisin, 2009) and family ownership (e.g. Thomsen and Pedersen, 2000) are negatively

correlated to firm performance. Thomsen and Pedersen (2000) provide evidence of firm
performance with family ownership destroyed by firm owners who are risk averse.
2.3.5.2 Insider Ownership and Innovation
Those two opposite effects of insider ownership on firm performance also result in reverse
views of firm innovation performance.
On the one hand, there is a positive relationship between insider ownership and
innovation performance (e.g., Chang et al., 2006; Choi et al., 2011; Chen et al., 2013;
Lodh et al., 2014; Minetti, 2015). For example, Lodh et al. (2014) apply an unbalanced
panel regression to investigate 395 listed Indian firms on the Bombay Stock Exchange
from 2001 and 2008 with number of patents and innovation productivity as the dependent
variables, family ownership as the main independent variable, firm size, firm age,
knowledge stock, a dummy variable to determine whether the CEO is a member of a
founding family, foreign ownership, government ownership, wage intensity, employee
compensation, industry dummies, and business risk as control variables. Chen et al.
(2013) investigate Taiwanese listed firms from 1996 to 2007 by using the Tobit regression
with R&D expenditure and the number of patents as the dependent variables, a continuous
family ownership and a dummy variable to identify the presence of the members of the
founding family as the independent variables, firm growth, operating cash flow, the
volatility of cash flow, leverage, capital intensity, CEO overconfidence, past firm
performance, firm size, firm age, year dummies, and industry dummies as control
variables. Song et al. (2015) study 242 listed firms in China during 2009, by using the
OLS and Tobit regressions with the ratio of the revenue generated by new products to the
total revenue generated by all products as the dependent variable, market orientation,
identity of the dominant shareholder, management ownership, and ownership
concentration as the independent variable, firm size, firm age, marketing expenditure
intensity, R&D expenditure intensity, and industry dummies as control variables. One
reason of the positive impact is that the firm owner can have a long-term horizon that

increases investment in innovation, because the firm will be passed on to descendants
(Caselli and Gennaioli, 2013). Due to the greater concern about the longterm presence of
the firm, family ownership has a positive effect on firm innovation (Chen et al., 2013;
Lodh et al., 2014; Minetti, 2015). Regarding employee ownership, employees prefer
stable jobs by maximising long-term value, thereby seeking technological innovation to
increase firm value. Thus, it results in a positive firm innovation performance (Chang et
al., 2006). Also, talented human resources are required for innovation activities that
employees can participate. Consequently, knowledge diffusion occurs between those
employees and others in the firm (Choi, 2012). Finally, managerial ownership magnifies
the positive correlation between market orientation and firm innovation, as top managers
can change their preferences – time and risk preferences - to be the same as the
shareholders' preferences (Song et al.,
2015). In this context, the managers can invest in an R&D project that may ensure
future performance (Chang, 2003). Hence, managerial ownership benefits firm innovation
performance. Kurt et al. (2015) concentrate on 340 large German listed firms between
2000 and 2009 by using the 2SLS regression with the forward citations of patents
(innovation output) as the dependent variable, family ownership, family management, and
family governance as the independent variables, firm performance, firm size, firm age,
firm risk, firm leverage, firm capital intensity, firm intangible assets intensity, industry
R&D intensity, and industry investment share as control variables. On the other hand,
Decker and Günther (2017), Liu et al. (2017) and Chi (2023) suggest that family
ownership and firm innovation are negatively correlated. In contrast to innovation output
as the dependent variable used in Kurt et al. (2015)’s paper, the innovation input measured
by R&D intensity generates the negative impact of family ownership on innovation input.
Decker and Günther (2017) focus on German machine tool industry during 2000 and 2010
by using the Poisson regression and the negative binomial models with the number of
patents as the dependent variable, family ownership, family generation, personal family

ownership, institutionalised family ownership as the independent variables, firm age, firm
size, knowledge stock, population density, the number of potential cooperation partners,
the average number of universities and universities of applied sciences in the region
where the firm located, and the number of year that firms observed in the buyer’s guide as
control variables. Chi (2023) investigates 1391 listed firms which are non-financial and
non-statecontrolled in Taiwan from 2000-2017 by using the fixed effects model with
patent counts and citation counts as the dependent variables, family ownership and family
control as the independent variables, firm size, investment opportunity, leverage, capital
investments, R&D investments, and firm age as control variables. One interpretation of
the negative impact is that a family-owned firm's limitation of management capabilities
may diminish the company's R&D activities (Graves and Thomas, 2006; Bloom and Van
Reenen, 2010). The other one is that the behaviour of family managers is influenced by
informal institutional mechanisms when the goal of the family owner is socio-emotional
wealth (Gómez-Mejía et al., 2007; Berrone et al., 2012). As a result, it restricts R&D
investment in order to lower business risk (Liu et al., 2017). Thirdly, agency costs, which
causes the negative relationship between family ownership and insider ownership, rise
from excess control rights, and can alleviate by external shareholders who are also large
shareholders and highly expected financing costs (Chi,
2023).
2.3.5.3 Insider Ownership and Hypothesis
Agency theory suggests that insider ownership can lower managerial pressures to
maximise short-term values, thereby leading to enhance R&D investment (Choi et al.,
2012). In recent years, however, equity pledges have become an increasingly common
source of financing for company insiders. Andersonand Puleo (2015) report that between
2006 and 2011, at least one insider pledged their shares in US firms, accounting for 26%
of the total sample, with the average insider pledging 33.3% of total equity. Insiders
usually pledge equity for two reasons (Dou et al., 2019): (1) insiders obtain funds through

equity pledges for personal consumption or investment; and (2) insiders use the funds
from equity pledges to purchase shares in their own companies, increasing their control in
the firm. According to data from Wang et al. (2020)’s research, most insiders pledge
equity for personal investments in China. They find that pledging of equity has made
insiders more conservative towards innovative R&D and more reluctant to undertake the
cost of R&D failure. Then, the following hypothesis is suggested:
H2. Insider ownership and the firm’s innovation performance will be negatively
related.
2.3.6 State Ownership
2.3.6.1 Introduction of State Ownership
The definition of state ownership is the percentage of shares in a firm held by central or
regional governments and various entities connected with the government. The existence
of state ownership is imperative to maintain customers’ benefits with lower prices, adjust
anti-inflation or expansion (Marrelli et al., 1998; Willner, 2003), and substitute for
markets that lack private-owned firm capital (Marrelli et al., 1998).
Most studies reveal that state ownership is positively related to firm performance (Vernon-
Wortzel and Wortzel, 1989; Xu and Wang, 1999; Sun and Tong, 2003; Jiang et al., 2008;
Song et al., 2016). Hence, one interpretation is that market competitiveness is insufficient
in developing countries, which can be cured by the public intervention (Willner, 2003).
Further, multiple research argues for a less positive view of government-owned firms
during the privatisation process because of the divergence of objectives (e.g. Dewenter
and Malatesta, 2001; Cornett et al., 2010).
Boycko et al. (1996) refute that state ownership benefits firm performance. They point out
that state-owned firms seek social and political goals rather than profit maximisation.
Excess employment, for example, is one of the results if the managers comply with
politicians’ objectives. Additionally, jobs sourced from state-owned firms are given

priority to candidates who have a political connection (Krueger, 1990). Thus, problems
arising from the state-owned firm’s inefficiency (Ikenberry, 1990) and political failure
(Boycko et al., 1996) lower firm performance, which is supported by empirical studies
with regard to the negative (e.g. Lin et al., 2009) or non-linear relationship (e.g. Yu, 2013;
Hess et al., 2010) between state ownership and firm performance. Nonetheless, state-
owned firms do not always mean inefficiency (Kay and
Thompson, 1986; Vernon-Wortzel and Wortzel, 1989; Willner, 2003).
2.3.6.2 State ownership and Innovation
A critical role is played by the government in facilitating innovation capacity (Schaaper,
2009; Fan, 2011; Franco and Leoncini, 2013; Lo et al., 2022l; Wang and Jiang, 2021) and
developing a firm's innovation activities (Johnson, 1982; Amsden, 1989; Haggard, 1994).
Distinct institutional settings can generate different technological capabilities among
countries (Mahmood and Singh, 2003) and affect firm strategy and innovation process
(Hobday, 2005). For instance, a firm performs better in Korea as technology innovation is
specialised, while diversified technological innovation produces a better firm performance
in China (Bong Choi and Williams, 2013).
In developing countries such as China, governments develop innovation capabilities
indirectly via direct intervention (i.e. direct funding and tax incentives) and by facilitating
the interaction of key implementers (i.e. government research institutions, higher
education and the business sector) in science and technology activities (Schaaper,
2009).
At the firm level, the government is not only portrayed as an investor but also as a
resource allocation coordinator (Xu and Zhang, 2008). Some studies suggest a positive
relationship between state ownership and firm innovation (e.g., Chen et al., 2022. Choi et
al., 2011; Choi et al., 2012; Yi et al., 2017; Li and Xia, 2008; Lo et al., 2022; Xu and
Zhang, 2008). For example, Choi et al. (2011) focus on 548 Chinese listed firms across
eight industries - automotive, chemicals, communication, electronics, machinery,

pharmaceuticals, textiles, and power industries – from 2001 to 2004 by using the Poisson
and negative binomial models with the number of patents as the dependent variable, state
ownership as the main independent variable, firm size, firm profitability, sales growth,
firm age, leverage, long-term investment, knowledge stock, public Ashares, and sectoral
context as control variables. Choi et al. (2012) investigate 301
Korean listed firms from 2000 to 2003 by performing the negative binomial model with
patent data as the dependent variable, state ownership as the independent variable, firm
size, firm profitability, sales growth, firm age, leverage, R&D intensity, business groups,
and technology sector as control variables. Chen et al. (2022) take a sample of all Chinese
listed firms during a period of 2009-2017 by using the chain multiple of mediating effects
models with patent counts as the dependent variable, a continuous state ownership, a
dummy variable for state-owned firms, and the ratio of state ownership to non-state
ownership as the independent variables, government subsidies as mediating varaible, firm
characteristics and external environmental factors -firm size, firm age, profitability,
leverage, cash holding, tangible assets, executive shareholding ratio, board size, board
independence, cultural diversity of the board social trust and environmental regulations -
as control variables. Lo et al. (2022) concentrate on Chinese listed firms between 2007
and 2018 by using OLS, Tobit, PSM regression models with patent data as the dependent
variable, percentage of state ownership in the top three shareholders and a dummy
variable for state-owned enterprises (SOEs) as the independent variables, firm size,
political connection, firm age, leverage, firm profitability, the mode of assets utilisation,
the growth prospects, financing constraints, a dummy variable for the chairman of the
board as well as the top manager, management ownership, concentrated ownership,
institutional ownership, the intensity of research and development in the industry, and
industry dummies as control variables. The first advantages of SOEs in firms' innovation
activities are political, financial and resource-related privileges (Chen et al., 2023).
Specifically, the government offers exclusive endorsements and treatment to SOEs in the

context of weak intellectual property right (IPR) protection (Sheng et al., 2011), which
means SOEs obtain better IPR protection than other types of firms (Wang et al., 2012).
Secondly, SOEs are given priority over non-SOEs in allocating government R&D
expenditure toward developing China's national innovation, which plays an important
institutional role (Sun and Liu, 2014). Thirdly, innovation is full of uncertainty and high
risks. Long-term capital is necessary because innovation has a long payback period and a
high failure rate (Choi et al., 2011, 2012). SOEs can get support from government
subsidies or put administrative restrictions on rivals. It then encourages SOEs to take
more risks (Kornai et al., 2003; Chen et al., 2023). Fourthly, SOEs have access to
important infrastructure resources if policies encourage or discourage certain types of
development. SOEs then benefit from priority rights as well as being used to promote
government-initiated innovation (Chang et al., 2006; Siegel, 2007). Fifthly, the limited
availability of land and high real estate prices indicate significant constraints on
innovation activities that require large R&D centres, but this is not a problem for state-
owned enterprises (e.g. Tan, 2006). Sixthly, in China, tax incentives for product
innovation (i.e. 50%) and intangible asset inventions (i.e. 150%) can be obtained through
approval by the tax authorities. Due to political connections, SOEs are more likely to
receive tax incentives than other enterprises, and so that the former spend less on R&D
than the latter. It allows for higher profits. At the same time, the ample resources and
preferential treatment that SOEs receive from the government can lessen the risk aversion
of top management in their R&D investments and provide an incentive for them to invest
more in creating new knowledge. Most national and provincial research projects in China
are carried out by SOEs, universities or a combination of both. The government can easily
supervise the process of these research projects and assess innovation outputs and
economic benefits, which helps SOEs achieve higher performance (Ruiqi et al., 2017).
Seventhly, a majority of Chinese universities and research institutions are state-controlled
and governed, and so they have some natural links with SOEs. Motohashi and Yun (2007)

's research indicate that over 30% of surveyed SOEs actively outsource science and
technology activities to universities and public research institutions. SOEs can benefit
from university-industry collaboration to obtain complementary capabilities that can
diminish R&D risks, thereby enhancing innovation performance and firm performance
(Eom and Lee, 2010; George, Zahra and Wood, 2002). Eighthly, SOEs rely on their close
ties with the government to gain access to advanced technology and management
experience, as well as the scientific talent they need, as a way to increase the efficiency of
the use of R&D resources performance (Wang et al., 2015; Ruiqi et al., 2017). Ninthly,
SOEs are also more likely to receive purchase orders from the government, which greatly
assists in the commercialisation of R&D product performance (Ruiqi et al., 2017).
Conversely, some researchers find state ownership is negatively related to firm innovation
(e.g., Ayyagari et al., 2011; Vo, 2018). Vo (2018) study Vietnam-listed and non-financial
firms from 2007 to 2015 by using the linear regression with risk taking behaviour as the
dependent variable, sate ownership as the independent variable, firm size, firm fixed
assets, firm cash holdings, and firm age as control variables. Ayyagari et al. (2011)
investigate 19,000 firms across 47 developing economies between 2002 and
2004 by applying the logit probability model with the aggregate Innovation Index, Core
Innovation, or eight individual indicators of firm innovation as the dependent variable,
state ownership as the main independent variable, firm size dummies, firm age, legal
status, number of establishments, industry dummies, country dummies, and capacity
utilization as control variables. One reason is that while government subsidies enhance
firms' innovation, excessive government subsidies diminish the positive or even negative
impact on firms' R&D, implying a waste of resources (Yi et al., 2021). This is mainly due
to the fact that, in the interest of continued government resource support, firms with large
government subsidies prioritize their R&D strategies and resource allocation, including
specific technological and production goals, to meet governmental concerns rather than to
build up and improve their own innovative capabilities (Rhee and Leonardi, 2018).

2.3.6.3 State ownership and Hypothesis
In the latest research on SOEs, Lo et al. (2022) reaffirm the importance of state ownership
for firm innovation. At the firm level, the advantages of state ownership contain political,
financial and resource-related privileges (Zhou et al., 2017). Drawn on the literature
review in chapter 2, the following hypothesis is recommended: H3. State ownership and
the firm’s innovation performance will be positively related.
2.3.7 Institutional Ownership
2.3.7.1 Introduction of Institutional Ownership
Institutional ownership is defined as the proportion of ownership owned by financial
institutions. There are various types of institutional owners -mutual funds, hedge funds,
pension funds, investment advisers, bank trusts, insurance companies and venture capital
(Chen et al., 2007).
In general, institutional investors are mainly sophisticated professional investors whose
primary purpose is to earn long-term profits for their clients (Connelly et al., 2018).
Institutional owners often work directly or indirectly with their companies due to the size
of their holdings, their investment strategies, their influence on financial markets, and
their failure to sell underperforming firms (Edmans and Holderness, 2017). Direct
engagement refers to the direct involvement of the institution in the discussion of the
firm’s direction and strategy by the firm’s senior management, and such direct
engagement serves as a core competitive advantage for institutional investment services
(Healey and Mintz, 2021). Indirect engagement means that the ability of institutions to
motivate firms and enforce discipline is critical to stimulating and promoting strategic
actions and processes that they believe are beneficial to the company (Brav et al., 2008).
Healey and Mintz (2021, p.840) list five ways in which institutions are typically utilised
to indirectly influence firms: “the appointment of board members, (ii) risk oversight, (iii)
adjustment of executive compensation, (iv) implementation of corporate governance

structures, and (v) public criticism of the firm either via announcements in the media or
support of shareholder proposals”. In sum, institutional investors are enabled to leverage
decision-making in the business. Furthermore, institutional investors (as majority
shareholders) can monitor effectively at a lower agency cost than minority shareholders,
thus positively impacting firm performance (Pound, 1988; McConnell and Servaes, 1990;
Lin and Fu, 2017). As argued by the active monitoring view, managers have greater
pressure from institutional investors to maximise shareholder value (Shleifer and Vishny,
1986). Financial institutions have an incentive of large equity stakes to monitor for the
sake of remitting agency problems and lowering information asymmetries that hinder
innovation (Minetti et al., 2015). Accordingly, empirical studies demonstrate that
institutional ownership is positively correlated to firm value (McConnell and Servaes,
1990; Lin and Fu, 2017; Healey and
Mintz, 2021).
2.3.7.2 Institutional Ownership and Innovation
Likewise, the positive impact of institutional ownership on firm performance, institutional
ownership is also positively correlated to innovation performance (Berger et al., 2014;
Choi et al., 2011; Eng and Shackell, 2001; Fan et al., 2023; Miller et al.,
2022; Mishra, 2022; Opler and Sokobin, 1997; Rong et al., 2017). For example, Choi et
al. (2011) focus on 548 Chinese listed firms during 2001 and 2004 by using the Poisson
and negative binomial models with the number of patents as the dependent variable,
institutional ownership as the main independent variable, firm size, firm profitability,
sales growth, firm age, leverage, long-term investment, knowledge stock, public Ashares,
and sectoral context as control variables. Rong et al. (2017) study Chinese listed firms
from 2002 to 2011 by using the OLS, fixed effects, 2SLS, and Gaussian mixture models
with patent and citation counts as the dependent variables, institutional ownership as the
independent variable, Tobin’s Q, return on asset, leverage, year dummies, industry
dummies, and firm dummies as control variables. Miller et al. (2022) study the listed

firms in the US from 1991 to 2008 by applying the linear regression with patent counts
and citation counts as the dependent variables, monitoring institutional ownership as the
independent variables, firm size, firm age, capacity intensity, labour productivity and
quality, profitability, stock performance, growth opportunities, cash holdings, capital
structure (leverage), stock volatility, institutional block ownership, four-digit SIC
Herfindahl Index and its squared term as control
variables.
Chi et al. (2019) find that only mutual funds as one type of institutional investors
positively affect firm innovation, other types of institutional investors consisting of
insurance company, pension fund and Qualified Foreign Institutional Investor have less
positive or no impact on firm innovation. This paper contains a sample of non-financial
listed firms in China during a period of 2001-2004. It uses fixed effects models with
patent data as the dependent variables, a categorical variable for three types of
institutional ownership (i.e., mutual funds, insurance company and pension fund, and
foreign institutions) as the independent variables, ownership concentration, state control, a
dummy variable for the CEO position holding by the board of chair, board dependence,
the number of board meetings, profitability, sales growth rate, cash holding, leverage, firm
size, a dummy variable for a firm listed on the ChiNext board, and region as control
variables.
Mishra (2022) concludes a positive impact of institutional ownership on firm innovation if
the institutional ownership is below the threshold and turns into a negative impact if the
institutional ownership is above the threshold. The research scope is the number of firms
to the non-financial and non-utility firms listed in the Standard & Poor's (S&P) 1500 in
2005, and the sample period is from 2000 to 2018. It applies Tobit and crosslagged
structural models with R&D intensity and knowledge capital as the dependent variables,
institutional ownership as the independent variable, firm size, financial slack, financial

leverage, firm-specific risk, Tobin's q, CEO tenure, firm diversification, and market
concentration as control variables.
That kind of a positive effect of institutional ownership on firm innovation can be
attributed both to effective agency oversight (by agency theory) and to the role of the
agency in protecting managers from the risk of dismissal (by management career
considerations) (Bushee, 1998; Minetti et al., 2015; Miller et al., 2022). In addition to
measures such as monitoring mechanism, institutional investors in emerging markets can
even threaten invested firms to exit the firms to further minimise agency conflicts
compared to developed markets (Chi et al., 2019). In this case, managers are unlikely to
reduce R&D so as to turn around declining earnings, when the level of institutional
ownership is high (Bushee, 1998). Furthermore, institutional investor networks contribute
firm innovation and gain more patents compared to their counterparts (Fan et al., 2023).
Mishra (2022) disagrees with this view, arguing that managers scale back R&D
investment when institutions retain a high level of ownership. This behaviour of a
reduction in R&D investment depends on the proportion of institutional ownership. When
institutional ownership is below the threshold, R&D investment and institutional
ownership are positively correlated, but the opposite is true when it is above the threshold.
To elaborate, when institutional shareholding exceeds a certain threshold, managers will
succumb to pressure from institutions, resulting in management shortsightedness. Short-
sightedness refers to maximising the short-term value for managers rather than the long-
term value (Bushee, 1998). The cause may be that institutional investors only hold shares
for a short period, resulting in a short-term horizon (Minetti et al., 2015). In contrast,
long-term institutional ownership signals a shift from financial investment to an
investment in the firm's future, helping reassure managers. Directly, there is a positive
influence of the stability of institutional investors' shareholdings on the relationship
between institutional ownership and innovation (Sakaki and Jory, 2019). Moreover, active
or passive monitoring depends on the types of institutional investors, the shareholdings of

institutional investors, stress sensitivity and institutional investors from national or
international firms (Lin and Fu, 2017; Sakaki and Jory, 2019;
Mishra, 2022).
2.3.7.3 Institutional Ownership and Hypothesis
Institutional investors monitor the behaviour of managers either explicitly or implicitly
through governance activities or by gathering information on the quality of R&D
investments respectively (Bushee, 1998). Active monitors may help managers get rid of
concerns about R&D failure, motivate innovation and pursue long-term value (Monks and
Minow 1995). That kind of a monitoring role becomes even more critical as the
incumbent management is weakened (Fung, 2012). Even though financial institutions are
under-developed in emerging countries compared to those well-developed and dispersed
institutional ownership in US listed firms, Rong et al. (2017) state that institutional
investors have a positive impact on innovation performance, which comes mainly from
mutual funds. Thus, the following hypothesis is proposed:
H4. Institutional ownership and the firm’s innovation performance will be positively
related.
2.3.8 Foreign Ownership
2.3.8.1 Introduction of Foreign Ownership
Foreign ownership is defined as a firm owned or controlled by an individual who is not a
citizen of that country or by a firm not headquartered in that country. There are six types
of foreign investments in China: (1) Chinese-Foreign Equity Joint Ventures; (2) Chinese-
Foreign Contractual Joint Ventures; (3) Wholly Foreign-Owned Enterprise; (4)
Share Company With Foreign Investment; (5) Foreign Invested Holding Company; (6)
Joint Exploitation.
Most studies note that foreign ownership is positively correlated to firm performance and
productivity(e.g. Srholec, 2009; Yang and Tsou, 2020; Xu et al., 2022). It is primarily due

to foreign firms having larger equity stakes, higher commitment, and long-term
engagement (Douma et al., 2006). Furthermore, foreign direct investment (FDI)
contributes to domestic firms' productivity and indirectly affects local firms' productivity
in vertically related industries. It is facilitated by technological knowledge, management
practices and governance influences being transferred among foreign and domestic firms,
thereby creating new business linkages. This phenomenon is so-called the spillover
effects of FDI (Singhania et al., 2015).
2.3.8.2 Foreign Ownership and Innovation
Most papers discover a positive relationship between foreign ownership and innovation
performance (Srholec, M., 2009; Choi et al., 2012; Gu et al., 2020). For example, Choi et
al. (2012) investigate 301 Korean listed firms between 2000 and 2003 by using the
negative binomial model with patent data as the dependent variable, foreign ownership as
the independent variable, firm size, firm profitability, sales growth, firm age, leverage,
R&D intensity, business groups, and technology sector as control variables. Srholec
(2009) focuses on 46000 firms in industry and market services from 12
European Union members – Belgium, Bulgaria, Czech Republic, Estonia, Germany,
Latvia, Lithuania, Norway, Portugal, Romania, Slovakia and Spain – between 1998 and
2000 by using the probit regression model with a dummy variable for whether the firm
has innovation activity (e.g., new product innovation, process innovation) and dummy
variables for the firm cooperated with national, foreign partners or both as the dependent
variables, foreign ownership as the independent variable, firm size, a dummy variable for
whether a firm exports to the foreign market, a dummy variable for whether a firm was
established during the sample period, and industry dummies as control variables. The
main reason of the positive impact is the spillover effects of FDI. As previously discussed,
domestic firms can enhance their R&D capabilities by acquiring advanced foreign
knowledge through foreign investment (Singhania et al., 2015). In emerging economies,
knowledge transfer from multinational companies is a vital strategic resource for domestic

firms to improve their performance in technological innovation (Choi et al., 2012). Even
if foreign firms prevent the diffusion of knowledge in order to maintain their competitive
advantage (Jiang et al., 2013), it does not help (Srholec, M., 2009). Moreover, global
resources are another benefit of foreign investment. Many multinational companies often
attempt to strengthen their competitiveness in the global market by finding low-cost or
technologically complementary resources in foreign markets. Resources in markets are
equally important to local firms (Choi et al., 2012). Furthermore, Gu et al. (2020) argue
that foreign banks can enhance information environments and diminish agency problems
for firms, thereby stimulating firm innovation (e.g. increased quantity and quality of
patent applications) within an economy where government intervention is intense, and
investor protection is insufficient.
Dong et al. (2022) show that foreign ownership negative affects the relationship between
innovation and export by considering the sample of Chinese manufacturing firms with a
sample period of 2000-2007. They employ the linear regression with export performance
as the dependent variable, patent counts, patents adjusted by firm size, and the share of
new product sales in total sales as the independent variables, state ownership and foreign
ownership as moderators, firm size, firm age, total factor productivity, leverage,
marketing capability, tangible resources, international openness, marketization, regional
dummies, industry dummies, and time dummies as control variables. This negative
moderating effect is mainly because innovation in multinational companies strongly rely
on parent companies or research centres located in other country. In other words, those
foreign investments from multinational companies to the domestic country are principally
for production not innovation (Dong et al., 2022). 2.3.8.3 Foreign Ownership and
Hypothesis
Spillover effects contribute to domestic firms improving R&D capabilities through
foreign investment (Singhania et al., 2015). Knowledge transfer from multinational
companies is a vital strategic resource for domestic enterprises to improve their

technological innovation performance in emerging economies (Choi et al., 2012). The
diffusion of that kind of knowledge is difficult to restrict, even if foreign companies are
intent on obstructing it (Srholec, M., 2009). In particular, foreign investors can mitigate
agency problems for firms in markets where government intervention is intense and
investor protection is insufficient (Gu et al., 2020). Consequently, the following
hypothesis is proposed:
H5. Foreign ownership and the firm’s innovation performance will be positively
related.
2.4 Depth and Breadth of Knowledge
2.4.1 Introduction
Knowledge is crucial to the survival, growth and innovation of a business (Healey and
Mintz, 2021; Yu and 2021). On the basis of knowledge being scarce, non-tradable and
non-imitable, with no equivalent substitutes, a firm’s knowledge base becomes the
foundation for maintaining its competitive advantage (Grant, 1996). Firm performance
differences depend primarily on their knowledge base (Grant, 1996). In order to maintain
a competitive advantage in a knowledge-rich industry, firms must constantly increase
their knowledge base through substantial investments (Xu and Cavusgil, 2019). The
accumulation of a knowledge base depends on the evaluation of new alternative
knowledge and the assimilation of new knowledge with known knowledge, which
ultimately facilitates the successful creation of new products (Cohen and Levinthal, 1990;
Arora and Gambardella, 1994). So the quality of innovation depends on a firm’s
absorptive capacity (that is, its ability to assess, absorb and use new knowledge)
(Abecassis-Moedas and Mahmoud-Jouini 2008; Tortoriello 2015). Hence, a firm’s
knowledge base is the most valuable asset.

To build up the knowledge base, a firm can accumulate knowledge by exploring new
areas of knowledge (i.e. breadth of knowledge) or deepen understanding and enrich
knowledge by intensifying knowledge in known fields (i.e. depth of knowledge). By
definition, breadth is the wider range of innovation knowledge, and depth is the more
specialised innovation knowledge. The breadth of knowledge is related to innovation
diversity, while the depth of knowledge is related to innovation quality (Lodh and
Battaggion, 2015). Apart from internal R&D, firms can obtain knowledge from strategic
alliances and acquisitions. (Lin and Wu, 2010).
Research on innovation in recent years has placed an in-depth emphasis on the importance
of developing the technical breadth and depth of knowledge (e.g. Lin and
Wu, 2010; Lodh and Battaggion, 2015; Yu and Yan, 2021).
2.4.2 Depth of Knowledge
Conceptually, depth of knowledge encompasses two meanings that possess
complementary characteristics. One is the knowledge base owned by the firm itself, and
the other is the relative competitiveness of the firm's knowledge base against that of its
competitors (Lin and Wu, 2010). With regard to the three ways of acquiring knowledge,
Lin and Wu's (2010) research suggest a focus on internal R&D to build up knowledge in
the company's core areas when the depth of knowledge is low. Conversely, knowledge
acquisition should be shifted to cross-firm alliances and acquisitions when the firm's
depth of knowledge is high.
2.4.2.1 Advantages of Depth of Knowledge
Firstly, the exploration of the depth of knowledge helps firms to effectively identify the
value of new knowledge and improve their absorptive capacity (Yang et al., 2017). As a
result, it is easier to find paths to new product success (Caner and Tyler 2015;
FerrerasMéndez et al. 2015) to identify gaps between its own technology and the latest
technology in the industry (Zahra and George, 2002), and to be more aware of current

market trends (Roberts and Adams 2010; Tsai et al. 2013) than a firm with a weak
knowledge base, for example.
Secondly, if a company focuses on exploring the depth of knowledge, it can assimilate
and integrate external knowledge with a deep knowledge base (Yang et al., 2017). It is
because knowledge from external sources can be substantially different from the firm's
own knowledge, making it difficult to understand and assimilate external knowledge
(Jimenez-Castillo and Sanchez-Perez, 2013).
Thirdly, only those with a deep understanding and know-how can effectively use newly
acquired knowledge, as knowledge is intangible and difficult to document explicitly. A
deep knowledge base contributes to the commercialisation and exploitation of knowledge
(Zhou et al., 2009) and lays the foundation for product and process optimisation and
improvements (Healey and Mintz, 2021).
Fourthly, the depth of knowledge base can be a sustainable competitive advantage for the
firm because of the moat created by asset mass efficiency and time compression
diseconomies (Dierickx and Cool, 1989). Lin and Wu (2010, p.583) define asset mass
efficiency and time compression diseconomies: "Asset mass efficiencies come from the
effect that the more assets a firm has, the lower the marginal cost of producing further
additions to the asset stock. Time compression diseconomies come from the effect that
asset accumulation cannot be rushed." Although a company's knowledge base is an
intangible asset that is not documented on the balance sheet, it is known as a strategic
asset for successful companies.
2.4.2.2 Disadvantages of Depth of Knowledge
Firstly, the marginal benefit of exploring the depth of knowledge is diminishing (Katila
and Ahuja, 2002). If improvements along the technology trajectory reach their limits, the
benefits gained from subsequent product development will increase at a diminishing rate.
Further development based on the same knowledge gets more expensive, and the solution

becomes more complex, finally resulting in the costs of exploring the depth of knowledge
outweighing the benefits.
Secondly, too much focus on the depth of knowledge exploration may not only enable a
firm to be an unbeatable industry leader but also irreparably damage it (Katila and Ahuja,
2002). Knowledge gained from over-exploration of existing knowledge can become
obsolete when disruptive or radical technological breakthroughs emerge in the industry.
Technologies or strategies that once gave a company a competitive lead can become
problems that need to be solved (Leonard, 1995). Argyris and Schon (1978) point out that
companies may try to hide or hinder disruptive or radical innovation in order to maintain
the status quo.
2.4.3 Breadth of Knowledge
The exploration of the breadth of knowledge allows firms to acquire and assimilate
technical information from a variety of sources. In detail, a firm with a wide knowledge
domain is more aware of a diverse customer base and multiple market segments than a
firm with a narrow knowledge domain (De Luca and Atuahene-Gima 2007). In a highly
competitive industry, companies are used to learning and imitating the knowledge of other
companies for their R&D activities. The more complex the knowledge domain becomes,
the more product innovation relies on acquiring external knowledge
(Carayannopoulos and Auster, 2010).
2.4.3.1 Advantages of Breadth of Knowledge
Firstly, the exploration of the breadth of knowledge adds new elements to the firm’s
knowledge domain, and thus brings new inspiration for innovation (Katila and Ahuja,
2002) and enabling the firm to integrate relevant technologies in a more sophisticated way
(Bierly and Chakrabarti, 2009; Srivastava and Gnyawali, 2011).
Secondly, an increase in the knowledge domain increases a firm’s ability to adapt to
technological changes in relevant areas and enhances its flexibility to change its strategy

(Volberda, 1996; Srivastava and Gnyawali, 2011). It addresses the core rigidity problem
posed by knowledge over-exploration (i.e. the second disadvantage of knowledge
exploration discussed in sub-section 2.4.2.2).
2.4.3.2 Disadvantages of Breadth of Knowledge
Firstly, the limited resources of a firm constrain the exploration of the breadth of
knowledge. Excessive pursuit of knowledge breadth may suppress a firm's knowledge
accumulation and development in specific areas (Lausen and Salter, 2006; Zhou and Li,
2012). An increase in knowledge breadth may divert too many firm resources to different
areas, with only a tiny piece of resources allocated to each area. It results in inferior
innovation outcomes (Xu, 2015). Yang et al. (2017) suggest that the impact of the breadth
of knowledge on new product performance depends on the depth of knowledge. If the
depth of knowledge is high, the breadth of knowledge will have a positive impact on the
new product and vice versa.
Secondly, the cost and complexity of integrating new knowledge become higher as the
breadth of knowledge expands (Grant,1996).
2.4.4 Hypotheses for Innovation Specialisation and Innovation Diversification
2.4.4.1 Concentrated Ownership
If the level of concentrated ownership is high, the majority shareholder pursues a
diversification strategy to reduce the risk taken and to achieve personal goals rather than
value maximisation. When shareholder rights are not adequately protected, concentrated
ownership and diversification exhibit a quadratic U-shape, unlike the linear correlation
observed in legally sound markets (Del Brio et al., 2011). However, Parigi and Pelizzon
(2008) argue that when large shareholders are able to transfer profits, they will not be
interested in diversifying their investments and instead focus back on repurchasing firm
shares, and the firm's ownership structure becomes concentrated. However, a less
diversified investment also means less potential for innovative diversification. In China,

listed firms are characterised by a concentration of shareholdings, insufficient protection
of minority shareholders' rights, and tunnelling accordingly (Wang et al., 2020).
Therefore, the following hypothesis is proposed:
H6a: The higher the level of concentrated ownership, the higher the level of
innovation specialisation.
H6b: The higher the level of concentrated ownership, the lower the level of innovation
diversification.
2.4.4.2 Insider Ownership
Chen and Ho (2000) point out that a low level of insider ownership gives rise to agency
problems, which means that the interests of managers are not aligned with those of
insiders. It causes significant value loss due to diversity, whereas it is not found at a high
level of insider ownership.
Nonetheless, insider ownership contributes to diversification due to 1) agents seeking to
increase their reputation and value in the company (Shleifer and Vishny, 1989) and 2) the
second generation of family-owned firms having more resources to diversify than the
founders of the first generation of firms (Weng and Chi, 2019).
H7a: The higher the level of insider ownership, the lower the level of innovation
specialisation.
H7b: The higher the level of insider ownership, the higher the level of diversity of
innovation diversification.
2.4.4.3 State Ownership
In general, SOEs are more likely to favour diversification than non-SOEs (Guthrie, 1997;
Li et al., 1998). The first reason is that SOEs are more likely to have access to political
resources and financial support, which can contribute to the successful implementation of
a diversification strategy (Lu and Yao, 2006). The second point is that diversification
weakens the negative impact of the external market environment on the company (Lee
and Hooy, 2018) or helps the firm establish the resources and capabilities that are the

firm's core competencies (Keister, 1998). The third point is that the government generally
appoints the managers of SOEs with a high level of state ownership, and the political
connections of the managers also positively influence diversification to a large extent (Li
et al., 2012). Fourthly, managers appointed by the government do not have enough
incentives and professional knowledge to effectively supervise firm development or
pursue profit maximisation. In this situation, the diversification strategy allows that kind
of manager to pursue personal interests or other non-profit objectives (such as seeking a
large firm size) (Delios et al., 2008). Thus, the following hypothesis is proposed:
H8a: The higher the level of state ownership, the lower the level of innovation
specialisation.
H8b: The higher the level of state ownership, the higher the level of innovation
diversification.
2.4.4.4 Institutional Ownership
Institutional ownership has a positive impact on diversification for the following reasons:
1) long-term stable institutional investors (Jafarinejad et al., 2015); and 2) effective
monitoring mechanisms, especially active monitors, can mitigate diversification discounts
(Singh et al., 2004; Hartzell et al., 2014). Moreover, the lower the diversification discount,
the more willing institutional investors are to have extensive research, increase profits,
and remain competitive in an increasingly globalised market. Thus, the following
hypothesis is proposed:
H9a: The higher the level of institutional ownership, the lower the level of innovation
specialisation.
H9b: The higher the level of institutional ownership, the higher the level of innovation
diversification.
2.4.4.5 Foreign Ownership
On the one hand, foreign ownership plays a positive role in innovation specialisation. In
particular, the foreign parent company, through the rational deployment of resources,

allows different subsidiaries to innovate and specialise in a particular area, and ultimately
the subsidiary takes a firm foothold in the industry's value chain (Collinson and Wang,
2012).
One the other hand, firms face localisation issues when growing their business in other
countries (Hitt et al., 2000). Foreign firms are at a disadvantage compared to local firms
in terms of local resources, suppliers and end sellers (Gaur and Kumar, 2009).
Especially in the service sector, business operations rely heavily on social networks Yang
et al. (2017). As an example, they point out that foreign hotels in China are not as familiar
with Chinese business practices and their social networks are not as strong as local hotels,
resulting in higher transaction or operational costs associated with diversification. As a
result, firms are reluctant to undertake diversification when the level of foreign ownership
is high. The lower the level of foreign ownership, the more willing the company is to
diversify (Yang et al., 2017). This is primarily due to the local advantage. Hence, the
following hypothesis is suggested:
H10a: The higher the level of foreign ownership, the higher the level of innovation
specialisation.
H10b: The higher the level of foreign ownership, the lower the level of innovation
diversification.
2.5 Fresh Insights from Previous Literature
The previous sub-sectors have reviewed relevant theories and empirical literature about
the impact of firm ownership on innovation performance. First, this thesis examines the
relationship between firm ownership and innovation performance based on previous
literature (e.g., Chi, 2023), but with an updated sample period of 2013 – 2019. This
sample period is mainly because the year 2013 is the beginning of the fifth round of SOE
reform (Lin et al., 2020). Second, Mishra (2022) focuses on the threshold of institutional

ownership and concludes that intuitional ownership below or above the threshold is
positively or negatively related to firm innovation, respectively. This thesis then extends
the idea of threshold to all five ownerships. Compared to many previous literature
measures ownership structures (independent variable) as a continuous variable or a binary
variable for whether the firm belongs to a particular firm ownership (e.g., Chen et al.,
2013; Lo et al., 2022), firm ownership is a categorical variable with different levels of
percentage of firm ownership. Thus, it will show the different impacts of firm ownership
on innovation performance based on different levels of firm ownership. Third, Bong Choi
and Williams (2013) propose that a firm performs better in Korea as technology
innovation is specialised, while diversified technological innovation produces better firm
performance in China. Based on the concepts of innovation specialisation and innovation
diversification, this thesis concentrates on how firm ownership affects firm innovation
specialisation or innovation diversification.
2.6 Summary
This chapter reviews the literature with regard to the concepts of innovation and firm
ownership and considers the importance of knowledge for innovation. The impact of firm
ownership on innovation performance varies with political contexts, market
environments, corporate environments, internal and external resources, et cetera. The role
of knowledge in the innovative growth of firms comes from two aspects – depth of
knowledge and breadth of knowledge. Also, this section presents hypotheses related to the
relationship between firm ownership and innovation performance, firm ownership and
innovation specialisation, and firm ownership and innovation diversification, based
primarily on the literature review.

In sum, hypotheses on firm ownership and innovation performance will be tested first
with continuous and categorical ownership structures (i.e., first and the second
contribution) as follows:
(1) H1. Concentrated ownership and the firm’s innovation performance will be
negatively related.
(2) H2. Insider ownership and the firm’s innovation performance will be negatively
related.
(3) H3. State ownership and the firm’s innovation performance will be positively
related.
(4) H4. Institutional ownership and the firm’s innovation performance will be
positively related.
(5) H5. Foreign ownership and the firm’s innovation performance will be positively
related.
Then, five ownership structures will be tested against the depth of innovation and
diversity of innovation (i.e., the third contribution), respectively, as follows: H6a:
The higher the level of concentrated ownership, the higher the level of innovation
specialisation.
H6b: The higher the level of concentrated ownership, the lower the level of innovation
diversification.
H7a: The higher the level of insider ownership, the lower the level of innovation
specialisation.
H7b: The higher the level of insider ownership, the higher the level of diversity of
innovation diversification.
H8a: The higher the level of state ownership, the lower the level of innovation
specialisation.
H8b: The higher the level of state ownership, the higher the level of innovation
diversification.

H9a: The higher the level of institutional ownership, the lower the level of innovation
specialisation.
H9b: The higher the level of institutional ownership, the higher the level of innovation
diversification.
H10a: The higher the level of foreign ownership, the higher the level of innovation
specialisation.
H10b: The higher the level of foreign ownership, the lower the level of innovation
diversification.
Chapter 3 Data and Methodology
3.1 Introduction
Section 3.2 is about the sample and data. Sector 3.3 discusses all variables used in the
models. Section 3.4 contains the research models, methods for mitigating endogeneity,
and robustness tests.
3.2 Sample and Data
To practically evaluate the relationship between firm ownership and innovation
performance in China, this thesis collects data from all Chinese firms listed on the
Shanghai Stock Exchange between 2013 and 2019. This sample period is mainly because
the year 2013 is the beginning of the mixed ownership reform. Financial data and the data
on ownership structures are collected from firm annual reports and China Securities
Market. Patent data are obtained from China's State Intellectual Property Office.

However, some firms which do not have R&D expenditures or patent data are removed.
Besides, this thesis is interested in the non-financial firms only. Hence, it leaves 1409
firms and 8518 firm-year observations.
3.3 Variables
3.3.1 Dependent Variables
Dependent variable is innovation performance, which is difficult to quantify and compare,
yet it is crucial to choose appropriate measurement since reliable information about
innovation activities and outcomes is required for data analysis (Michie, 1998).
The conclusion might not be the same if different measures of innovation had been used.
Unfortunately, there are no widely accepted measures because of the various
dimensionality of innovation (Kline and Rosenberg, 1986; Smith, 2005). Kuznets (1962)
classifies the measurement of innovation into two groups: (1) measures of input;
(2) measures of output.
3.3.1.1 Measures of Input
For the investigation of the relationship between firm ownership and innovation, R&D
intensity is a widely acceptable indicator of innovation input (e.g., Abbas et al., 2022; Di
Vito et al., 2010; Kurt et al., 2015; Lacetera, 2001), as input measurement measures the
amount of innovation drive business invests in. In this thesis, R&D intensity is defined as
the ratio of R&D expenditure to the firm’s total sales. Since R&D investment is crucial
for firms to pile up greater technological and market capabilities and subsequently
increase innovation performance, R&D expenditure is a reasonable indicator of
innovation investment (Matzler et al., 2015). Moreover, R&D intensity is not only able to
control size effects and heteroscedasticity, but also easy to compare different firms’
innovation performance (Barker and Mueller, 2002; Chen and Hsu,
2009). Other popular R&D measurements contain R&D expenditure (Chen et al., 2013;

Minetti et al., 2015; Steffen and Iuliia, 2016), R&D expenditure per employee
(Baysinger et al., 1991), and R&D personnel (Minetti et al., 2015).
3.3.1.1.1 Advantages of R&D measurement
R&D data is publicly available and is regularly collected by the State. In addition to
sector-specific data, time series are also available. National researchers usually use the
data for cross-national, cross-sector and cross-firm comparisons (Kleinknecht et al.,
2002).
3.3.1.1.2 Disadvantages of R&D measurement
Aghion and Tirole (1994) argue that assessment of R&D activities may give a too limited
view of innovation, since the R&D has been represented as different actors with conflict
purposes in existing economic literature. Secondly, R&D is an innovation input that may
not be an essential factor for producing innovative products or processes, thereby
overestimating innovation intensity (Flor and Oltra, 2004; Becheikh et al., 2006). Thirdly,
not all innovations are generated from research laboratories, which means they can be
solutions to a specific challenge or ideas innovators suddenly got. As a result, R&D data
underestimates innovation activities, which excludes those that emerged from non-R&D
investments (Michie, 1998; Kleinknecht et al., 2002; Edquist and Zabala, 2015). Fourthly,
large firms have an advantage over small and medium enterprises (SMEs), because SMEs
tend to have informal and occasional R&D efforts compared to large companies, thereby
underestimating innovation intensity
(Kleinknecht, 1987; Kleinknecht et al., 2002).
3.3.1.2 Measures of Output
For the investigation of the relationship between firm ownership and innovation, patent
data measured by ln (1 + 'ℎ) *+,-). /0 12')*'3), due to the possibility of
highly skewed patent counts (e.g., Chen et al., 2022; Chi et al., 2019; Wan et al., 2021).
Output measurement measures the effectiveness of innovative investments in achieving
the desired results. Patent is a document issued by a sovereign state and granted to an

inventor if the invented product or process is a novelty and has potential utility. It
excludes rights for others except the inventor to use this product or process for a limited
period (Comanor, 1964). Patent data is usually applied to measure innovation output
(Griliches, 1990) since it is a proper proxy for innovation outcomes (Kamien and
Schwartz, 1982).
For the investigation of the relationship between firm ownership and innovation
specialisation, the depth of innovation (Depth) is measured by Herfindahl-Hirschman
Index (HHI). HHI is usually to measure the market concentration. The higher the HHI, the
higher the market concentration (Kvålseth, 2018). In this thesis, the depth of innovation
measured by HHI is to find out the concentration rate of patent in one category for a firm.
In this case, State Intellectual Property Office (SIPO) in China typically classifies patents
into eight groups (i.e. A – H), as shown in the following table.
Table 3.1 International Patent Classification (IPC)
As a result, the depth of innovation is calculated by HHI based on patent data:
5)1' :!!;#
(3.1) "
where
*% is the number of patents in the ith section of IPC for a firm; N is
the total number of patents for a firm.
The higher the HHI, the more concentrated the types of patents.

For the investigation of the relationship between firm ownership and innovation
diversification, the diversity of innovation (Diversity) is measured by the entropy. The
lower the entropy coefficient, the greater the diversified innovation. As we can see,
entropy is the other measurement of concentration. The reason for not using 1 minus HHI
to measure the diversity of innovation is that HHI has already been applied to measure the
depth of innovation, and hence, the statistical inferences of the diversity of innovation are
converse to the ones of the depth of innovation.
The Shannon entropy coefficient as an alternative measurement of concentration is
(Shannon, 1948):
(=*A1(B (3.2)
where 1( is the percentage of type j.
The properties of entropy coefficient are as follows (Hart, 1971; Bandt, 2020):
•<5 ≥ 0: ED is 0 when 1( = 1 (i.e., all products are concentrated in one type),
because 1 × log(1) = 0. It means entropy coefficient is 0 when there is high
concentration. Also, ED is 0 when 1( = 0 , becuase 0 × log(0) = 0 .
Consequently, ED is non-negative.
•: ED is ln (I) when 1( = "' for all j, which means the number of
products is equal in all types.
In order to avoid the ED of 0 if all products are in one type and use it for measuring
diversification, the entropy coefficient based on patent data is modified by exponential
function (Jost, 2006):
$
*(S
5JK).3J'L = M<5 = exp QR=* T UV
(3.3)
(&' S *(

where
*( is the number of patents in the jth section of IPC in Table 3.1 for a firm;
S is the total number of patents for a firm.
The higher the value of MED, the higher the diversification.
3.3.1.2.1 Advantages of Patent Data
Firstly, the patent database is rich in data and time-honoured. Secondly, the patent
database is open to the public and electronically categorised by field of technology,
allowing easy access to detailed information on patents and citation analysis to assess
their relative importance (Kleinknecht et al., 2002).
3.3.1.2.2 Disadvantages of Patent Data
The first shortcoming is that the patent system is not the same across countries. Second,
some innovations may not be patentable, especially for software (Griliches, 1990;
Michie, 1998). Third, the tendency to patent differs among sectors (Griliches, 1990;
Archibugi and Sirilli, 2001). The reasons can be high patenting expenses, complicated
patenting procedures, or the quick diffusion process of new technology (Mansfield, 1985;
Michie, 1998). Hence, some enterprises apply other proper approaches to protect their
innovation outcomes, for example, industrial secrecy (Archibugi and Pianta, 1996;
Michie, 1998; Kleinknecht et al., 2002). Fourth, patent quality varies significantly
(Kamien and Schwartz, 1982; Griliches, 1990; Griffith et al., 2006). Fifth, patent data is
more like a measure of invention instead of innovation (Coombs et al., 1996; OECD,
1997; Flor and Oltra, 2004). Becheikh et al. (2006) explain that innovation is the
transformation of an invention into a merchantable new or improved product or process.
Hence, measuring the number of patents granted may lead to an overestimation of
innovation outcome, if invented products or processes which have not been marketable
are included in patent data.

3.3.1.3 R&D Intensity vs Patent Data
Both R&D intensity and patent data are used as the dependent variable in the models. It is
because innovation covers, but is not limited to, research and development. R&D is only
the first step in the innovation process. Since innovation is hard to quantify, R&D and
patent data are used to measure and compare the innovation, giving investors and
researchers an intuitive sense of innovation performance. In other words, R&D intensity
is innovation input and patent data is innovation output. Nevertheless, Acharya and Xu
(2017) argue that the patent data can be more effectively reflect the actual innovation
output for a firm than R&D measurements. One reason is that the patents are listed on
China's State Intellectual Property Office when the firms have applied for them, and thus,
the number of patents for a firm each year is calculated based on the patent application
year. It is because the year of application is closer to when the innovation was made
(Griliches, 1990). Furthermore, innovation input has a higher likelihood of endogenous
problem than innovation output (Leten et al., 2007; Van de Vrande et al., 2011).
Additionally, innovation inputs (e.g., R&D intensity) do not always generate innovation
outputs (e.g., patents) (Dong et al., 2022; Tavassoli, 2018).
3.3.2 Independent Variables
To test Hypotheses 1 - 10, this thesis portrays the specific features of the firm's ownership
structure. The shares of Chinese listed firms are differentiated into A-shares, B-shares, H-
shares, N-shares and S-shares, due to where the shares are listed and the investors they are
exposed to. A-shares are issued by companies registered in China for subscription and
trading in RMB by domestic institutions, organizations or individuals (excluding Taiwan,
Hong Kong and Macau investors). B-shares are also issued in China by companies
registered in China, but unlike A-shares, they are issued with a nominal value in RMB but
subscribed and traded in foreign currencies, and listed and traded on Chinese stock
exchanges. H-shares, N-shares and S-shares refer to foreign stocks registered in mainland

China, but listed in Hong Kong, New York and Singapore respectively (Li et al., 2006;
Arslan-Ayaydin et al., 2022.).
By the specific characteristics of the firm's ownership structure in China, ownership
structures are measured in the following table. The reason to contain all types of shares
(i.e., A-shares, B-shares, H-shares, N-shares and S-shares) is to take individual investors
and organisations from foreign countries (Choi et al., 2011).
Table 3.2 Independent Variables
Independent
Variables
Description Literature Hypothesis
Concentrated
Ownership
Sum of squared of firm
shares owned by top 5 large
shareholders
Kvålseth (2018) H1, H6a and H6b
State Ownership Proportion of firm shares
owned by all levels of
government, its related
agencies and solely
stateowned enterprise in
top 10 largest shareholders
Chen et al. (2022);
Chi et al. (2019)
H3, H8a and H8b
Insider
Ownership
Proportion of firm shares
owned by managers,
directors, supervisory board
members and workers in
top 10 largest
shareholders
Chang et al. (2006);
Choi et al. (2011)
H2, H7a and H7b
Institutional
Ownership
Proportion of firm shares
owned by financial
institutions in top 10 largest
shareholders
Choi et al. (2011);
David et al. (2006)
H4, H9a and H9b
Foreign
Ownership
Proportion of firm shares
owned by foreign
corporation and
institutional investors (from
different types of shares
except A Share) in top 10
largest shareholders
Choi et al. (2011) H5, H10a and
H10b

3.3.3 Control Variables
There are several variables controlled in the thesis. Firm size is measured by total assets
of the firm to proxy for how firm size affects its innovation (e.g., Miller et al., 2022;
Minetti et al., 2015; Wan et al., 2021). Firm age is measured by the number of years that a
firm was established to account for the effect of a firm’s life cycle on firm innovation
(e.g., Chen et al., 2023; Miller et al., 2022; Decker and Günther, 2017). Knowledge stock
is measured by the total number of accumulated patents during the period from the year of
establishment to year 1 to capture how the number of patents accumulated affects
innovation ability for a firm (e.g., Choi et al., 2011; Decker and Günther, 2017; Lodh et
al., 2014). Leverage is estimated by the ratio of total debt to total assets (debt ratio) to
take the impact of capital structure on innovation into account (e.g., Steffen and Iuliia,
2016; Wan et al., 2021). Profitability is measured by the ratio of net income and total
assets (named as return on assets) to account for operating profitability (e.g., Choi et al.,
2011; Lo et al., 2022). R&D intensity is measured by ratio of R&D expenditure to the
firm’s total sales to take innovation input into account for innovation output (e.g., Steffen
and Iuliia, 2016), and hence, this control variable is only available for the patent data as
the dependent variable. Industry dummy variables in the following table distinguish
different sectors that firms belong to (e.g., Di Vito et al.,
2010; Lee, 2005; Lodh et al., 2014; Wan et al., 2021).
Table 3.3 Dummy Variables
Dummy Variable
Code
Dummy Variable Description Number of
Firms
1 Agriculture, forestry, animal husbandry and fishery 14
2 Mining industry 53
3 Manufacturing industry 1440
4 Electricity, heat, gas and water production and supply
industry
83
5 construction industry 55

6 Wholesale and retail trade 103
7 Transportation, warehousing and postal industry 80
8 Accommodation and catering industry 5
9 Information transmission, software and information
technology services
148
10 Real estate 61
11 Leasing and business services 21
Continued
12 Scientific research and technical service industry 40
13 Water conservancy, environment and public facilities
management industry
35
14 Education industry 5
15 Health and social work 2
16 Culture, sports and entertainment industry 31
17 Comprehensive industry 7
3.4 Research Model
3.4.1 Firm ownership and Innovation performance
If Y%* is the R&D intensity of firm i at time t and Z+%* is the kth explanatory variable of
firm i at time t, the model can be described as the following equation to test Hypotheses
H1-H5:
[&5 J*')*3J'L%* = ] + ^'/_*).3ℎJ1%,*-' + ^#ln (3J`))%,*-' + ^.2a)%,*-' +
^/b*/_c)da)%,*-' + ^0c)K).2a)%,*-' + ^1J*d+3'.L%,*-' + ^2e./0J'2-JcJ'L%,*-'
+
^$c*(J*K)3')%,*-' + f%* (3.4)
e2')*'%* = ] + ^'/_*).3ℎJ1%,*-' + ^#ln(3J`))%,*-' + ^.2a)%,*-' +

^/b*/_c)da)%,*-' + ^0c)K).2a)%,*-' + ^1J*d+3'.L%,*-' + ^2e./0J'2-JcJ'L%,*-'
+
^$c*(J*K)3')%,*-' + [&5 J*')*3J'L%,*-' + f%* (3.5)
where
•/_*).3ℎJ1%* is firm ownership for firm i at time t.
•ln (3J`))%* is log of firm size for firm i at time t. Since the value of firm size
is too large compared to other values of variables. For example, firm size of
Dongfeng Motor Corporation in 2013 was too big (i.e. ¥ 20191845033.17), but
the relatively concentrated ownership was too small (i.e. 61% in 2013). Then, the
estimated parameters ] and ^ from the model looks inharmonious. The estimated
parameters for firm size can be too small compared to others.
Consequently, the logarithm is used, that is ln (gJ`)).
•2a)%* is firm age for firm i at time t.
•b*/_c)da)%* is knowledge stock for firm i at time t.
•c)K).2a)%* is the total debt and firm size ratio for firm i at time t.
•J*d+3'.L%* is dummy variables for firm i at time t.
•e./0J'2-JcJ'L%* is profitability for firm i at time t.
•c*(J*K)3')%* is log of long-term investment. The reason of taking natural
logarithm is discussed above in ln (3J`))%*.
Since innovation input (i.e., R&D intensity) and innovation output (i.e., patent) are
applied in this thesis to examine the relationship between firm ownership and innovation,
equations (3.4) and (3.5) are both for the research question (1) in Chapter 1. For research
questions 1 and 2 in Chapter 1, both continuous and categorical variables for firm
ownership are used in equations (3.4) and (3.5). Most studies employ continuous variable
for firm ownership (e.g., Chen et al., 2022), but it may generate a problem if the
relationship between firm ownership and innovation is actually nonlinear or only has a
significant influence when the percentage of firm ownership is above or below the

threshold (e.g., Mishra, 2022). Hence, for the second contribution in this thesis, a
categorical variable of firm ownership is used to find out the threshold.
Firm ownership is grouped by:
•Zero Level: the percentage of firm ownership = 0%
•Low Level: 0% < the percentage of firm ownership < 5%
•Medium Level: 5% < the percentage of firm ownership < 20%
•High Level: 20% < the percentage of firm ownership < 100%
Two reasons for choosing 5% and 20% to be thresholds are as follows:
1) Appendix A displays histograms of five ownership structures. All five histograms
indicate a positive skewness, because the data is more often piled up below 20%.
Hence, 20% is taken as a threshold.
2) Listed Company Takeover Measures announced by the China Securities
Regulatory Commission (CSRC) mention that once an investor's shares reach 5%
of the issued shares of a listed company, each increase or decrease in shareholding
needs to be reported and announced to the CSRC. Therefore, 5% is taken as a
threshold.
In particular, concentrated ownership is measured by HHI, so that it is a non-zero
variable. Hence, only three levels of concentrated ownership exist – low level, medium
level, and high level. As opposed to other ownership structures, there are only three levels
of concentrated ownership.
3.4.2 Firm Ownership and Innovation Specialisation
The third research question is to investigate the relationship between the depth of
innovation and firm ownership at time t. The regression model is as follows to test
Hypotheses H6a – H6a:
5)1'ℎ%* = ] + ^'/_*).3ℎJ1%,*-' + ^#[&5 J*')*3J'L%,*-' + ^.ln (3J`))%,*-' +
^/2a)%,*-' + ^0b*/_c)da)%,*-' + ^1c)K).2a)%,*-' + ^2e./0J'2-JcJ'L%,*-' +

^$ln (J*K)3')%,*-' + [&5 J*')*3J'L%,*-' + f%* (3.6)
One thing that needs to be confirmed is that firm ownership (ownership) is a categorical
variable in this case, and the levels of firm ownership for this categorical variable are
shown in sub-sector 3.4.1. Apart from the concentrated ownership, there are four levels of
firm ownership – zero level, low level, medium level, and high level. The categorical
variable of concentrated ownership only has three levels – low, medium, and high. Also,
HHI measures the depth of innovation as discussed in sub-sector 3.3.1.2. Innovation is
more specialised as the level of firm ownership is higher than the baseline.
3.4.3 Firm ownership and Innovation Diversity
The fourth research question in Chapter 1 is to investigate the relationship between the
diversity of innovation and firm ownership at time t. The regression model is as follows to
test Hypotheses H6b - H10b:
5JK).3J'L%* = ] + ^'/_*).3ℎJ1%,*-' + ^#[&5 J*')*3J'L%,*-' + ^.ln (3J`))%,*-' +
^/2a)%,*-' + ^0b*/_c)da)%,*-' + ^1c)K).2a)%,*-' + ^2e./0J'2-JcJ'L%,*-' +
^$ln (J*K)3')%,*-' + [&5 J*')*3J'L%,*-' + f%* (3.7)
Again, ownership is a categorical variable as discussed in sub-sector 3.4.1. The diversity
of innovation is calculated by entropy coefficient as discussed in subsector 3.3.1.2.
Based on the equation 3.4, the higher the value of diversity is, the higher degree of
diversification is.
3.4.4 Controlling for Endogeneity
Since panel regression is used in this thesis, Hausman Specification (HS) test is applied to
determine fixed effects model or random effects model is preferred (Hausman, 1978). In
practice, endogeneity is a common problem for researchers (e.g., De Silva, 2023, Gao et
al., 2019; Tang et al., 2022), and may be caused by omitted variables, such as government
policies that facilitate firm innovation, R&D investment persistence and reverse

causality (Chi et al., 2019; Kang et al., 2017; Gao et al., 2019; Mishra, 2022). Lack of
recognition and treatment of endogeneity can lead to inconsistent and biased estimated
coefficients, incorrect interpretations, or even erroneous findings (Bascle, 2008). To
eliminate endogeneity in the regression models, this thesis lags firm ownership and
control variable by one period, referring to Chen et al. (2022), Gao and
Zheng (2020), Li et al. (2021) and Mishra (2022).
3.4.5 Robustness Tests
Robustness tests are performed to confirm the stability of the estimated coefficients in the
regression models, which would have changed if this had not been done. There are four
regression models (i.e., equations (3.4) – (3.7)) to test all hypotheses, and hence, there are
four robustness tests. First, the change in R&D intensity, using the difference in R&D
intensity between the current year and last year divided by R&D intensity in the last year
as the dependent variable, can be employed to test the relationship between firm
ownership and innovation performance (equation (3.4)). Second, the change in the
number of patents for a firm, which is estimated by the ratio of the difference in patent
counts between the current and last year to patent counts in the last year as the dependent
variable, can be used to test the relationship between firm ownership and innovation
performance (equation (3.5)) (Chi et al., 2019). Third, Shannon entropy shown in sub-
sector 3.3.1.2 is one of the measurements for concentration (Shannon, 1948), and hence,
can proxy for HHI to measure innovation specialisation so as to check the robustness of
the estimated coefficients in the equation (3.6). Fourth, 1h667 can be an alternative
measurement for the innovation diversification (Jost, 2006), as
HHI is a measurement for innovation specialisation as discussed in sub-sector 3.3.1.2.

3.5 Summary of Research Methodology
This chapter discusses sample and data, all variables, and research models. Endogeneity
may arise from empirical work and can be solved by lagged ownership and lagged control
variables. Besides, robustness tests make sure the robustly estimated coefficients in the
regression models.
Chapter 4 Empirical Investigation into Ownership -
Innovation Relationships
4.1 Introduction
This chapter performs empirical inquiries into the relationships between ownership
structure and innovation performance. It reports the empirical results from modelling the
relationships by testing the hypotheses developed in chapter 3. Specifically, it investigates
the effects of firm ownership on innovation performance. It goes further to examine the
impacts of firm performance on the depth of innovation and the diversification of
innovation. Empirical findings are summarised and discussed with implications for
management and research. In the following, section 4.2 reports descriptive statistics,
offering a general outlook of the sample companies in ownership structure and innovation
activities. Whereas section 4.3 present, analyse and discuss the modelling results.
4.2 Descriptive Statistics and Summary Data
4.2.1 Introduction of Descriptive Statistics and Summary Data
This thesis analyses data from firms listed on the Shanghai Stock Exchange between 2013
and 2019. The data were obtained from firm annual reports and Patent Search and
Analysis of State Intellectual Property Office. There are totally 1409 firms.

4.2.2 Descriptive Statistics and Summary Data of Variables
Table 4.1 expresses Descriptive Statistics and Summary Data for independent variables
and dependent variables. Independent variables contain five ownership structures.
The mean of state ownership is 24.58%, and the median is 16.28%. 75% of total
observations is about 47%, which is a substantially high percentage compared to other
firm ownership. It is almost twice as high as the second-highest third quartile (i.e.
concentrated ownership). Besides, state ownership has the highest mean and median
among the five ownership structures, which discloses the ongoing dominance of SOEs in
China.
The mean of insider ownership is 7.38%, and the median is 0.01%. The third quartile is
2.12%, which reveals a large number of firms in China without insider ownership or only
with a small piece of insider ownership.
The mean of foreign ownership is 4.70%, and the median is 0%. The upper quartile of
foreign ownership (1.06%) is even less than insider ownership. The fewest firms with
foreign ownership as opposed to other corporate ownership.
The mean of institutional ownership is 13.53%, and the median is 6.87%. 75% of data
points have a level less than 20%.
The mean of concentrated ownership is 18.10%, and the median is 15.26%. The upper
quartile is 25.29%, which exhibits that Chinese firms are highly concentrated to some
extent.
There are three dependent variables - R&D intensity, depth of innovation and diversity of
innovation.
The mean of R&D intensity is just 2.55%, and the median is 1.31%. The third quartile is
as small as 3.71%. The third quartile is as small as 3.71%, which signifies a low degree of
investment in R&D by listed companies.

The mean of the depth of innovation is 0.61, and the median is 0.54. The degree of
innovation specialisation ranges from 0 to 1, with the third quartile at 0.81 - a
considerable proportion of firms focus on a single area of R&D.
The mean of the diversity of innovation is 1.79, and the median is 1.69. The upper quartile
is 2.05.
Table 4.1 Descriptive Statistics and Summary Data for Independent and Dependent Variables
Mean Standard
Deviation
Minimum Maximum 25% 50% 75%
State Ownership 24.58% 25.72% 0% 95.26% 0% 16.28% 47.42%
Insider
Ownership
7.38% 16.48% 0% 89.99% 0% 0.01% 2.12%
Foreign
Ownership
4.70% 12.05% 0% 88.55% 0% 0% 1.06%
Institutional
Ownership
13.53% 16.89% 0% 90.99% 2.05% 6.87% 17.76%
Concentrated
Ownership
18.10% 12.93% 0.002% 79.42% 8.24% 15.26% 25.29%
R&D Intensity 2.55% 4.37% 0 169.43% 0.0004% 1.31% 3.71%
Depth of
Innovation
0.61 0.24 0.19 1 0.41 0.54 0.81
Diversity of
Innovation
1.70 0.46 1 2.76 1.37 1.69 2.05
4.2.3 Comparison of Means
As explained in sub-section 4.4.8, the firm ownership is assigned to four levels:
•Zero Level: the percentage of firm ownership = 0%
•Low Level: 0% < the percentage of firm ownership ≤ 5%
•Medium Level: 5% < the percentage of firm ownership ≤ 20%

•High Level: 20% < the percentage of firm ownership ≤ 100%
Table 4.2 indicates the means of R&D intensity, depth of innovation, and diversity of
innovation for each level of firm ownership.
Table 4.2 Means of Independent and Dependent Variables with Different Levels of Ownerships Structure
R&D
Intensity
Depth of
Innovation
Diversity of
Innovation
State
Ownership
Zero (0%) 0.0344 0.6472 1.6202
Low
(0% <
Own
ership
0.0317 0.6191 1.6724
(5% <
Ownership
≤20%)
0.0254 0.6294 1.6517
High
(≥20%) 0.0180 0.5643
1.7890
1.6972
Insider
Ownership
Zero (0%) 0.0170 0.6081
Low
(0% <
Ownership
0.0224 0.5830 1.7544
(5% <
Ownership
≤20%)
0.0418 0.6269 1.6571
High
(≥20%) 0.0468 0.6437
1.6224
1.6785
Foreign
Ownership
Zero (0%) 0.0257 0.6168
Low
(0% <
Own
ership
0.0266 0.5771 1.7662
(5% <
Ownership
≤20%)
0.0241 0.5965 1.7334
High
(≥20%)
0.0236 0.5964
1.7257
1.6672
Institutional
Ownership
Zero (0%) 0.0304 0.6204
Low
(0% <
0.0246 0.5822 1.7545

Own
ership
(5% <
Ownership
≤20%)
0.0272 0.6111 1.6907
High
(≥20%)
0.0222 0.6341 1.6494
Continued
Concentrated
Ownership
Zero (0%) - - -
Low
(0% <
Ownership
≤5%))
0.0292 0.6432 1.6249
Medium
(5% <
Ownership
≤20%)
0.0276 0.6203 1.6727
High
(≥20%)
0.0213 0.5784 1.7626
a) Comparison of Means for State Ownership
The mean of R&D intensity in Table 4.2 decreases as the level of state ownership
increases.
Non-state ownership has the highest value of innovation specialisation (i.e.
0.6472). The medium level comes next (i.e. 0.6294), followed by the low level
(i.e. 0.6191). The high level produces the least value for innovation specialisation
(i.e. 0.5643)
Conversely, the high level ranks first in innovation diversification (i.e. 1.7890).
The low level has the second largest value of innovation diversification (i.e.
1.6724), followed by the medium level (i.e. 1.6517). The lowest value of
innovation diversification is zero level (i.e. 1.6202). In terms of the mean value of
innovation diversification alone, SOEs are more diversely innovative than non-
SOEs.
b) Comparison of Means for Insider Ownership

Regarding insider ownership, the mean of R&D intensity increases as the level of
insider ownership increases in Table 4.2.
Apart from the zero-level, the higher the insider ownership, the more
specialisation in innovation. However, insiders at a low level are reluctant to
specialise in innovation, as opposed to non-insider ownership.
In turn, except for the zero level, the higher the insider ownership, the less innovative
diversification.
c) Comparison of Means for Foreign Ownership
The highest mean value of R&D intensity in Table 4.2 is the low-level foreign
ownership (i.e. 0.0266), followed by the zero-level (i.e. 0.0257). The third is the
medium-level (i.e. 0.0241), and the fourth is the high-level (i.e. 0.0236). At low
levels, foreign ownership recorded the highest mean in terms of innovation
diversification (i.e. 1.7662). The next highest is the medium level (i.e. 1.7334),
followed by the high level (i.e. 1.7257). Finally, the fourth is the zero level (i.e.
1.6785).
It suggests that firms prefer innovation diversification with foreign ownership rather
than those without foreign ownership.
d) Comparison of Means for Institutional Ownership
Non-institutional ownership ranks first in R&D intensity (i.e. 0.0304) in Table 4.2.
The medium level of institutional ownership has the second highest R&D intensity
(i.e. 0.0272). The next is the low level (i.e. 0.0246). The last one is the high-level (i.e.
0.0222). Interestingly, non-institutional investors are more willing to innovate than
institutional investors.
Excluding the zero-level, the higher the institutional ownership, the more the
innovation specialisation is preferred. Unless institutional ownership is above 20%,
non-institutional investors are more active in innovation than institutional investors.

Except for the zero-level, the higher the institutional ownership is, the lower the
innovation diversification is. A high-level institutional ownership is less devoted to
innovative diversity than non-institutional ownership
e) Comparison of Means for Concentrated Ownership
Since the HHI index measures concentrated ownership, it is a non-zero
measurement. Therefore, there is no value for R&D intensity, innovation
specialisation, and innovation diversification at zero level of concentrated
ownership in Table 4.2. Only three levels of concentrated ownership are available,
unlike other firm ownership.
The higher the level of concentrated ownership, the lower the R&D intensity, on
average.
The depth of innovation increases as the level of concentrated ownership
decreases.
In contrast, the greater the concentration of ownership, the greater the willingness
of firms to diversify in innovation.
4.2.4 Comparison of Means by ANOVA
Table 4.3 shows that all p-values from the ANOVA tests are less than 5%, thus rejecting
the null hypothesis at the 5% level. Hence, the means for all four levels of R&D intensity,
depth of innovation and diversity of innovation are significantly different, excluding
concentrated ownership. Moreover, three levels of concentrated ownership have also
significantly different means for R&D intensity, depth of innovation and diversity of
innovation.
Table 4.3 P-values from ANOVA
R&D Intensity Depth of Innovation Diversity of Innovation
State Ownership 0.0000 0.0000 0.0000
Insider Ownership 0.0000 0.0000 0.0000
Foreign Ownership 0.0000 0.0015 0.0001
Institutional Ownership 0.0000 0.0000 0.0000
Concentrated Ownership 0.0000 0.0000 0.0000

4.2.5 Comparison of Means by Post-Hoc Analysis
In order to know how three/four levels of ownership structures differ in means of three
variables (i.e. R&D intensity, the depth of innovation, and the diversity of innovation),
Post-Hoc analysis was applied with Tukey-Kramer because sample sizes for each level of
five ownership structures are wildly different as shown in Appendix B. In addition to
concentrated ownership, there are six pairwise comparisons for the other four firm
ownership (i.e. Low vs Zero, Medium vs Zero, High vs Zero, Medium vs Low, High vs
Low and High vs Medium). However, due to non-zero values of concentrated ownership,
it only has three pairwise comparisons (i.e. Medium vs Low, High vs Low and High vs
Medium).
The p-values of pairwise comparisons are indicated in Appendix C. Table 4.4 exposes
which pairwise comparison has significantly different means of three variables at the
5% level. 'Yes' indicates a significant difference, whereas 'No' is the opposite.
Table 4.4 Pairwise Comparisons (Significantly Different Means or Not)
R&D
Intensity
Depth of
Innovation
Diversity of
Innovation
State Ownership Low - Zero No No No
Medium -
Zero
Yes No No
High - Zero Yes Yes Yes
Medium –
Low
No No No
High – Low Yes Yes Yes
High -
Medium
Yes Yes Yes
Insider Ownership Low - Zero Yes Yes Yes
Medium -
Zero
Yes No No
High - Zero Yes Yes Yes
Medium –
Low
Yes Yes Yes
High – Low Yes Yes Yes
High -
Medium
No No No
Foreign Ownership Low - Zero No Yes Yes
Medium -
Zero
No No No
High - Zero No No No
Medium – No No No

Low
High – Low No No No
High -
Medium
No No No
Institutional
Ownership
Low - Zero Yes No Yes
Medium -
Zero
No No No
High - Zero Yes No No
Continued
Medium –
Low
No Yes Yes
High – Low No Yes Yes
High -
Medium
Yes No No
Concentrated
Ownership
Medium -
Low
No No No
High - Low No Yes Yes
High -
Medium
No Yes Yes
a) Post-Hoc Analysis for State Ownership
Table 4.4 demonstrates a significant difference in the mean R&D intensity of those
four pairwise comparisons: medium and zero, high and zero, high and low, and
high and medium. In addition, other variables have significantly different means
in those three pairwise comparisons: high and zero, high and low, and high and
medium. It discloses that the means of all variables for the high-level state
ownership are significantly different from the other levels.
The pairwise comparisons ' Low vs Zero' and 'Medium vs Low' do not exhibit any
significant difference in R&D intensity, innovation specialisation and
diversification.
b) Post-Hoc Analysis for Insider Ownership
For R&D intensity, only the comparison between the high-level and the medium-
level insider ownership says 'No' in Table 4.4, while all other pairwise
comparisons say 'Yes'. Accordingly, the means of R&D intensity for insider
ownership are significantly different from non-insider ownership, regardless of the
level of insider ownership.

The other two variables - the depth of innovation and the diversity of innovation
- have significantly different means in the following comparisons: (1) 'Low and
Zero'; (2) 'High and Zero'; and (3) 'Medium and Low'.
c) Post-Hoc Analysis for Foreign Ownership
None of the pairwise comparisons in Table 4.4 displays any difference in the mean
of R&D intensity for foreign ownership. Of the six pairwise comparisons, only the
low-level and the zero-level differed significantly in the mean values of
innovation specialisation and diversification.
d) Post-Hoc Analysis for Institutional Ownership
For institutional ownership, there is a significant difference in the mean R&D
intensity of those three pairwise comparisons in Table 4.4: low and zero, high and
zero, and high and medium. Moreover, both innovation specialisation and
diversification significantly differ in the means between medium and low levels as
well as high and low levels.
e) Post-Hoc Analysis for Concentrated Ownership
A significant difference in the means of all variables, except R&D intensity, was
found in comparing the high level of concentrated ownership to the other two
levels. On the other hand, R&D intensity does not differ significantly for the three
levels of concentrated ownership in Table 4.4.
4.2.6 Summary of Descriptive Statistics and Summary Data
This section compares the various levels of firm ownership across the three variables
involving R&D intensity, innovation specialisation and innovation diversification.
4.3 Empirical Results and Analysis
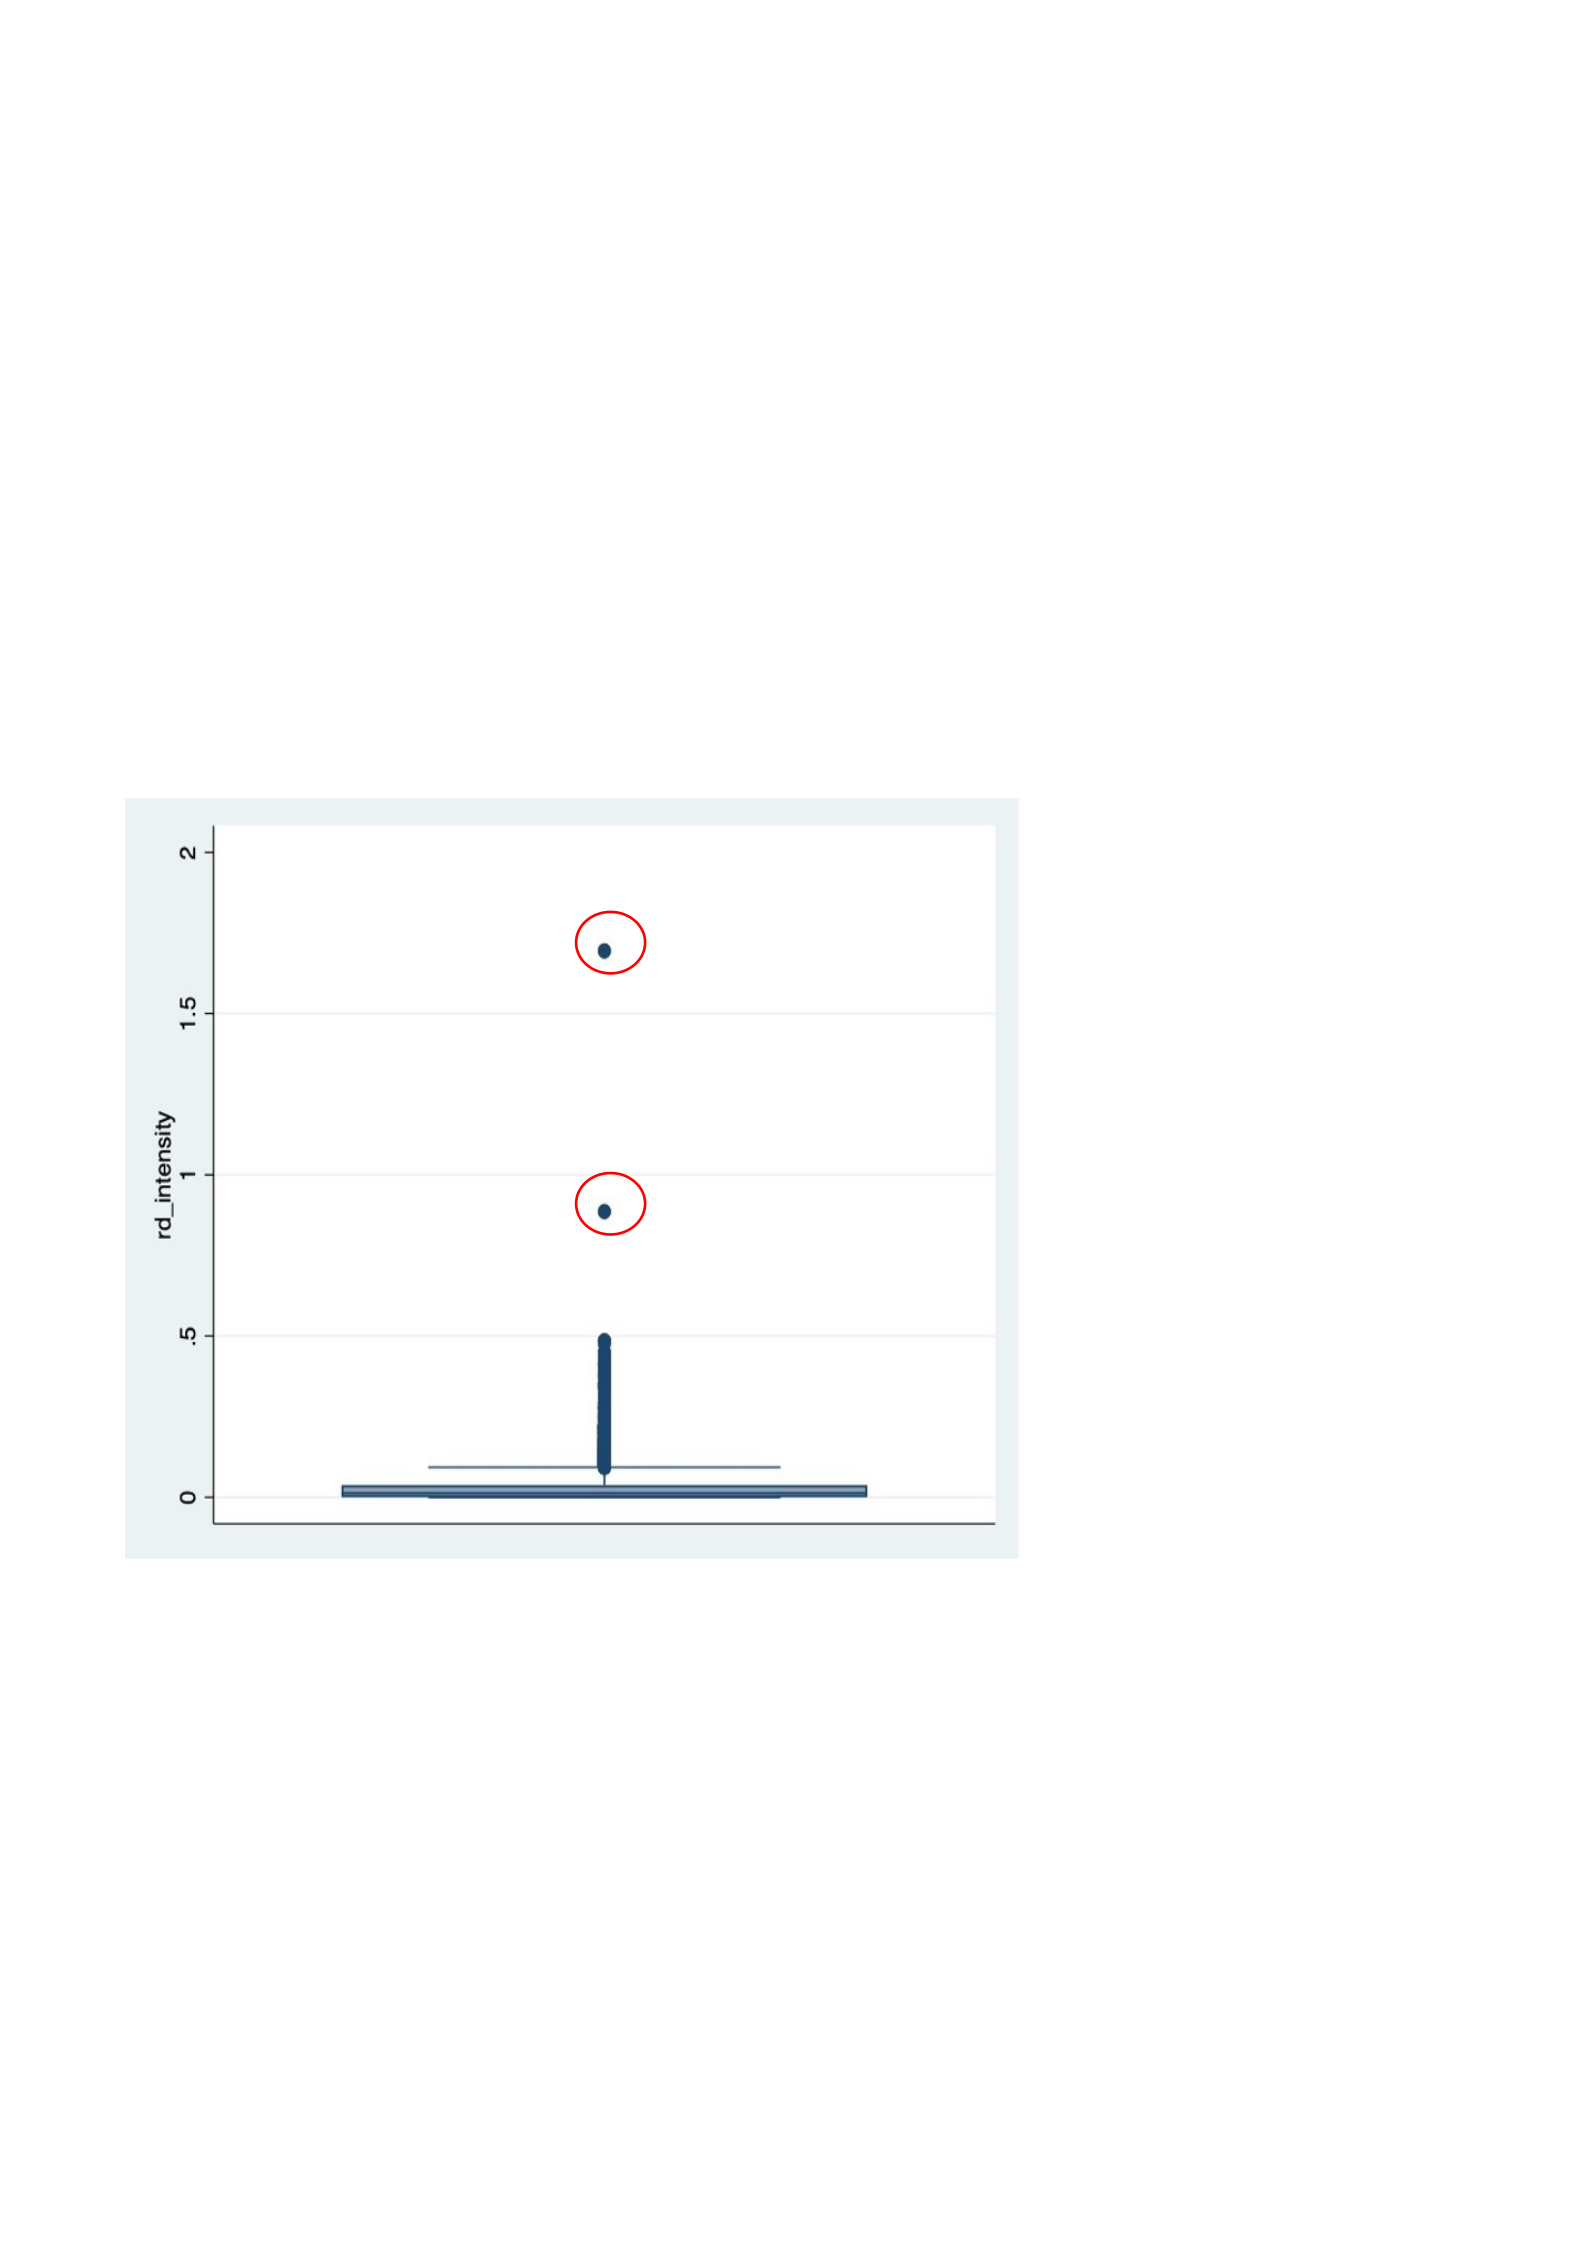
4.3.1 Introduction
This section focuses on testing the hypothesis tests presented in Chapter 4.
Before proceeding with the regression analysis, a boxplot for R&D intensity is drawn.
Figure 4.1 illustrates two influential outliers of interest in particular, which have been
circled in red. Upon searching the data, both outliers are from a firm called Caihong
Display Devices (hereinafter referred to as Caihong), caused by a spike in R&D intensity
between 2014 and 2015. So as not to let two outliers affect the regression model, the data
from Caihong will be first wiped out.
4.3.2 R&D Intensity
4.3.2.1 Concentrated Ownership
4.3.2.1.1 Model 1: Continuous Concentrated Ownership
i. Tests for Assumptions of Panel Data Regression
Figure 4.1 Boxplot for R&D Intensity

The LM test was applied to determine which type of regression to use. As the p-value for
the LM test was p <0.01, the null hypothesis of no panel effect was rejected by it at the
5% level. Accordingly, the panel data regression was better than the pooled regression.
Given that the p-value for the HS test was p <0.01, it rejected the null hypothesis of a
random effect at the 5% level. A panel data regression with fixed effects was, therefore, an
appropriate model.
Then, tests of the regression assumptions were then carried out to ensure that the
coefficients were inconsistent or biased.
First, the mean of residuals was 0, which meant that the assumption of linearity did not
violate (Assumption 1). Second, the assumption of homoscedasticity violated as the
modified Wald test had a p-value of p < 0.01 (Assumption 2). Third, the p-value for the
run test of randomness was p <0.01, which rejected the null hypothesis (Assumption 3).
In other words, residuals were autocorrelated. Fourth, the p-value of the Ramsey
RESET Test was p <0.01, which rejected the null hypothesis (Assumption 4).
Accordingly, misspecification was not a concern in this case. Fifth, the total sample size
was large enough to suggest that residual distribution was asymptotically normal
(Assumption 5). Sixth, the pairwise correlation matrix in Appendix D reveals that
multicollinearity is not a problem as the correlation is still low. Hence, the assumption of
no perfect multicollinearity held (Assumption 6).
In order to correct the violations of the assumptions, the fixed effects model was
reregressed by the robust standard error.
ii. Results
Table 4.5 Regression with Continuous Concentrated Ownership
(1)
H1
Fixed Effects
VARIABLES Robust t-statistics p-values
Concentrated 0.0127* 1.7700 0.0770

(0.0072)
Firm Size -0.0024** -2.3700 0.0180
(0.0010)
Firm Age 0.0016*** 7.6600 0.0000
(0.0002)
Knowledge Stock 0.0000 1.1400 0.2530
(0.0000)
Leverage 0.0005 0.5100 0.6070
(0.0009)
Continued
Public A-shares -0.0069 0.2620 -0.0190
(0.0062)
Long-term Investment 0.0006** 0.0200 0.0001
(0.0003)
Industry 2 0.0059 0.6490 -0.0194
(0.0129)
Industry 3 0.0168** 0.0410 0.0007
(0.0082)
Industry 4 0.0021 0.8080 -0.0147
(0.0085)
Industry 5 -0.0016 0.9110 -0.0294
(0.0142)
Industry 6 -0.0047*** 0.0000 -0.0057
(0.0005)
Industry 7 0.0112 0.2810 -0.0092
(0.0104)
Industry 8 0.0119 0.3130 -0.0113
(0.0118)
Industry 9 0.0442** 0.0240 0.0059
(0.0196)
Industry 10 0.0126 0.1140 -0.0030
(0.0080)
Industry 11 0.0041 0.6390 -0.0131
(0.0088)
Industry 12 0.0112 0.3370 -0.0117
(0.0117)
3 0.0332* 0.0550 -0.0007
(0.0173)
Industry 14 0.0009 0.9400 -0.0214
(0.0113)
Industry 15 0.1320*** 0.0000 0.1179
(0.0072)
Industry 16 0.0588*** 0.0000 0.0394
(0.0099)
Industry 17 0.0082 0.5690 -0.0200
(0.0144)
Industry 18 0.0179 0.1560 -0.0069
(0.0126)
Constant 0.0249 0.2390 -0.0166
(0.0212)

Observations 8,286
Number of Firms 1,409
Adjusted R-squared 0.0806
FIRM FE YES
Log-likelihood 23946
INDUSTRY FE YES
Robust standard errors in parentheses
*** p<0.01, ** p<0.05, * p<0.1
The table above signifies the panel data regression outputs.
For the independent variables, the p-value of concentrated ownership is p < 0.1, which
rejects the null hypothesis at the 10% level. Concentrated ownership and R&D intensity
are significantly and positively related at the 10% level. In other words, R&D intensity is
expected to increase by 0.0127 as the level of concentrated ownership increases by one
unit, while holding other things equal. It then is at odds with the hypothesis (i.e. H1).
For control variables, the p-value of ln(firm size) is p < 0.05, which rejects the null
hypothesis at the 5% level. Ln(firm size) and R&D intensity are significantly and
negatively related at the 5% level. If firm size increases by 1%, the mean of R&D
intensity decreases by 2.4e-5, ceteris paribus. The p-value of firm age is p < 0.01, which
rejects the null hypothesis. Firm age is significantly and positively related to R&D
intensity. The expected change in R&D intensity is 0.0016 for an additional one year
increase in firm age, while holding other variables constant. The p-value of ln(long-term
investment) is p < 0.05, rejecting the null hypothesis at the 5% level. If long-term
investment increases by 1%, the mean of R&D intensity increases by 6.322e-6, ceteris
paribus.
The baseline for industry dummy is ‘agriculture, forestry, animal husbandry and fishery’,
which is denoted as industry code 1. The category of all dummy variables’ codes and
descriptions are in Table 4.5. The p-value of industry code 3 is p < 0.05, which rejects the
null hypothesis at the 5% level. On average, the R&D intensity of the manufacturing
industry is 0.0168 higher than the baseline, ceteris paribus. The p-value of industry code 6
is p < 0.01, which rejects the null hypothesis at the 1% level. The mean R&D intensity of

wholesale and retail trade is 0.0047 lower than the baseline, ceteris paribus. The p-value
of industry code 9 is p < 0.05, rejecting the null hypothesis at the 5% level. The mean
R&D intensity of information transmission, software and information technology services
is 0.0442 higher than the baseline, ceteris paribus. The p-value of industry code 13 is p <
0.1, which rejects the null hypothesis at the 10% level. The mean R&D intensity of
scientific research and technical service industry is 0.0332 higher than the baseline,
ceteris paribus. Both industry codes 15 and 16 have pvalues of p < 0.01, which rejects the
null hypothesis. On average, the education industry and health and social work have an
R&D intensity of 0.1320 and 0.0588 higher than the baseline, respectively, ceteris
paribus.
In addition, the log-likelihood value is 23946.
4.3.2.1.2 Model 2: Categorical Concentrated Ownership
i. Tests for Assumptions of Panel Data Regression
Applying the LM test was to determine which type of regression to use. Due to the pvalue
of p < 0.01 for the LM test, it rejected the null hypothesis of no panel effect at the 5%
level. Panel data regression was, therefore, better than pooled regression. Due to the p-
value of the HS test being p < 0.01, the null hypothesis of a random effect was rejected at
the 5% level. Consequently, a panel data regression with fixed effects was an appropriate
model.
The regression assumptions were then tested to ensure that the coefficients were not
inconsistent or biased.
First, the mean of residuals was 0, implying the parameters' linearity (Assumption 1).
Second, the assumption of homoscedasticity violated by the modified Wald test as the p-
value was p < 0.01 (Assumption 2). Third, the p-value of the run test of randomness was p
< 0.01, which rejected the null hypothesis (Assumption 3). It meant that there was a serial
correlation. Fourth, the p-value of the Ramsey RESET Test was p < 0.01, which rejected
the null hypothesis of no omitted variable at the 1% level (Assumption 4). As a

consequence, there was no misspecification error. Fifth, residual distribution was
asymptotically normal because of a large sample size (Assumption 5). Sixth, Appendix D
indicates the pairwise correlation matrix, showing that correlations keep low. Then, the
assumption of no perfect multicollinearity held.
To sum up, the fixed effects model with the robust standard error was applied thereafter
because of the violations of assumptions.
ii. Results
Table 4.6 Regression with Categorical Concentrated Ownership
(2)
H1
Fixed Effects
VARIABLES Robust t-statistics p-values
Medium -0.0015 -0.7700 0.4400
(0.0019)
High -0.0004 -0.2000 0.8430
(0.0021)
Firm Size -0.0025** -2.5100 0.0120
(0.0010)
Firm Age 0.0015*** 7.7400 0.0000
(0.0002)
Knowledge Stock 0.0000 1.0600 0.2900
(0.0000)
Leverage 0.0005 0.5200 0.6000
(0.0009)
Public A-shares -0.0024 -0.4500 0.6560
(0.0053)
Long-term Investment 0.0006** 2.3200 0.0210
(0.0003)
Industry 2 0.0066 0.5100 0.6130
(0.0131)
Industry 3 0.0173** 2.1200 0.0340
(0.0082)
Industry 4 0.0030 0.3600 0.7220
(0.0085)
Industry 5 -0.0007 -0.0500 0.9600
(0.0141)
Industry 6 -0.0045*** -8.4600 0.0000
(0.0005)
Industry 7 0.0114 1.0900 0.2760
(0.0105)
Industry 8 0.0113 0.9600 0.3390

(0.0118)
Industry 9 0.0448** 2.2900 0.0220
(0.0196)
Industry 10 0.0124 1.5200 0.1280
(0.0081)
Industry 11 0.0045 0.5100 0.6080
(0.0088)
Continued
Industry 12 0.0115 0.9800 0.3270
(0.0118)
Industry 13 0.0325* 1.8200 0.0690
(0.0179)
Industry 14 0.0018 0.1600 0.8720
(0.0113)
Industry 15 0.1320*** 17.7200 0.0000
(0.0074)
Industry 16 0.0593*** 5.9400 0.0000
(0.0100)
Industry 17 0.0084 0.5900 0.5570
(0.0143)
Industry 18 0.0185 1.4700 0.1420
(0.0126)
Constant 0.0281 1.3200 0.1860
(0.0212)
Observations 8,286
Number of Firms 1,409
Adjusted R-squared 0.0802
FIRM FE YES
INDUSTRY FE YES
Log-likelihood 23944
Robust standard errors in parentheses
*** p<0.01, ** p<0.05, * p<0.1
The baseline is the firm with low level of concentrated ownership.
From the table above, the p-values of medium and high levels are both greater than 0.1,
respectively, so null hypotheses cannot be rejected. R&D intensity is not significantly
different among the three levels of concentrated ownership on average while holding
other variables constant.
For control variables, the p-value of ln(firm size) is p < 0.05, which rejects the null
hypothesis at the 5% level. Ln(firm size) and R&D intensity are significantly and
negatively related. The mean of R&D intensity decreases by 2.5e-5 if firm size increases

by 1%, ceteris paribus. The p-value of firm age is p < 0.01 which rejects the null
hypothesis at the 1% level. Firm age and R&D intensity are positively and significantly
related. The expected change in R&D intensity is p < 0.01 for an additional one year
increase in firm age, ceteris paribus. The p-value of ln(long-term investment)
is p < 0.05, which rejects the null hypothesis at the 5% level. If long-term investment
increases by 1%, the mean of R&D intensity increases by 6e-6, ceteris paribus. For
industry dummies, the p-value of industry code 3 is p < 0.05, which rejects the null
hypothesis at the 5% level. On average, the R&D intensity of the manufacturing industry
is 0.0173 higher than the one of agriculture, forestry, animal husbandry and fishery,
ceteris paribus. The p-value of industry code 6 is p < 0.01, which rejects the null
hypothesis. The mean R&D intensity of wholesale and retail trade is 0.0045 lower than
the baseline, ceteris paribus. The p-value of industry code 9 is p < 0.05, which rejects the
null hypothesis at the 5% level. The mean R&D intensity of information transmission,
software and information technology services is 0.0448 higher than the baseline, ceteris
paribus. The p-value of industry code 13 is less than 0.1, which rejects the null hypothesis
at the 10% level. The mean R&D intensity of scientific research and technical service
industry is 0.0325 higher than the baseline, ceteris paribus. The pvalues of industry codes
15 and 16 are both p < 0.01, so those two null hypotheses can be rejected. The means of
R&D intensity in the education industry and health and social work are 0.1320 and 0.0593
higher than the base level, respectively, ceteris paribus. Except variables mentioned
above, all other variables’ p-values are greater than 0.1, which cannot reject the null
hypotheses.
The log-likelihood value is 23944.
4.3.2.1.3 Discussions for Concentrated Ownership with R&D Intensity
i. Likelihood Ratio Test
Log-likelihood in model (1) with continuous concentred ownership (i.e. 23946) is
marginally higher than the one in model (2) with categorical concentred ownership (i.e.

23944). The p-value of the likelihood ratio test is greater than 0.1, which fails to reject the
null hypothesis. Accordingly, model (2) is not better than model (1).
ii. Continuous Concentrated Ownership
In Table 4.5, concentrated ownership has a significantly positive impact on R&D
intensity. As a consequence, concentrated ownership and a firm's innovation performance
are positively related, yet it is not consistent with the hypothesis in Chapter 3 suggesting
the negative correlation (H1).
The reason for that kind of positive impact could be that a high degree of concentration
generates an efficient monitoring mechanism that lowers agency costs and disciplines
managers' behaviour (Baysinger et al., 1991; Cho, 1992; Francis and Smith, 1995;
Holmstrom, 1989; Nguyen et al., 2015). Specifically, large shareholders may prefer
innovation strategies with high risk, even if the probability of success is low. Conversely,
managers from firms with a low degree of concentration may be more willing to take
imitation strategies with low risk, because they do not want to undertake the cost of
failure (Hill and Snell, 1988).
Another advantage of concentrated ownership is that large shareholders can optimise and
integrate all resources internally or externally to increase the probability of a successful
R&D project (Lacetera, 2001). In other words, larger shareholders enhance R&D
investment.
Furthermore, firms with concentrated ownership may be more interested in long-term
development in a business field rather than short-term profit maximisation (Mayer, 1997;
Miozzo and Dewick, 2002). On the one hand, those firms are willing to occupy a leading
position or even monopolise the market. Apart from political reasons, innovative
technologies beyond the times may help those firms to achieve their goals. Accordingly,
R&D investment plays a crucial role in this case. On the other hand, a few large
shareholders are more willing to invest in a long-term R&D project than to maximise the
firm profit in the short term, because they believe innovation's success may improve the
firm's survival in the market (Chang et al., 2006; Chang and Hong, 2000; Mahmood and

Mitchell, 2004; Rowley and Bae, 2004; Shleifer and Vishny, 1996). In the manager's
view, those few large shareholders' aims may relieve their managerial pressures to
maximise short-term profits, thereby boosting R&D investment
(Baysinger et al., 1991).
iii. Categorical Concentrated Ownership
R&D intensity in concentrated ownership does not vary across the three levels, in line
with the findings in Table 4.4. Thus, it also does not agree with hypothesis H1.
iv. Control Variables
It is not surprisingly that firm age has a significantly positive effect on innovation
performance, even if that impact is trivial. In view of the fact that old firms can benefit
from their business experience and foresight (Arrow, 1962; Sorensen and Stuart, 2000;
Chang et al., 2002), and enhancing R&D investment to improve the degree of firm growth
persistence and let firms survive in an increasingly competitive market.
In addition, the negative impact of firm size on innovation performance is too small to be
negligible. However, firms with concentrated ownership may be satisfied with firm scale
and are not willing to undertake the cost of R&D failure, if firm size upswings
dramatically.
Similarly, the positive impact of long-term investment on innovation performance is also
negligibly small. The performance of firm with concentrated ownership to increase their
R&D intensity is more evident if there is substantial long-term investment.
Regarding industry dummies, the baseline is agriculture, forestry, animal husbandry and
fishery. On average, firms with concentrated ownership within those five industries – (1)
manufacturing industry; (2) information transmission, software and information
technology services; (3) scientific research and technical service industry; (4) education
industry; and (5) health and social work - have a significantly higher R&D intensity

than the baseline. It may be that technological innovation in each of these sectors requires
considerable time, effort, capital, etc.
4.3.2.2 Insider Concentration
4.3.2.2.1 Model 1: Continuous Insider Ownership
i. Tests for Assumptions of Panel Data Regression
To begin with, the LM test was applied to define the type of regression to be utilised. The
LM test had a p-value of p < 0.01, given that it rejected the null hypothesis of no panel
effects at the 1% level. Panel data regression was, therefore, superior to pooled regression.
The HS test had a p-value of p < 0.01 as it rejected the null hypothesis of random effects
at the 1% level. Therefore, the panel data regression with fixed effects was an appropriate
model.
The regression assumptions were tested afterwards for consistent and unbiased
coefficients.
First, the mean of residuals was 0, which indicated that the assumption of linearity in
parameters holds (Assumption 1). Second, the assumption of homoscedasticity violated
due to the p-value of p < 0.01 by the modified Wald test (Assumption 2). Third, the pvalue
of the run test of randomness was p < 0.01, which rejected the null hypothesis
(Assumption 3). To put it differently, there was autocorrelation. Fourth, the p-value of the
Ramsey RESET Test was p < 0.01, which rejected the null hypothesis of no omitted
variable (Assumption 4). As a consequence, there was a misspecification error. Fifth,
residual distribution was asymptotically normal because of a large sample size
(Assumption 5). Sixth, the pairwise correlation matrix in Appendix D reveals that
multicollinearity is not a problem as the correlation is still low. Hence, the assumption of
no perfect multicollinearity held (Assumption 6).
To sum up, the fixed effects model with the robust standard error was applied thereafter to
fix the problems of violations of assumptions.
ii. Results

Table 4.7 Regression with Continuous Insider Ownership
(3)
H2
Fixed Effects
VARIABLES Robust t-statistics p-values
insider 0.0133 0.9600 0.3380
(0.0138)
Firm Size -0.0025** -2.3900 0.0170
(0.0011)
Firm Age 0.0015*** 7.6800 0.0000
(0.0002)
Knowledge Stock 0.0000 1.0200 0.3070
(0.0000)
Leverage 0.0007 0.5700 0.5670
(0.0012)
Public A-shares -0.0037 -0.6400 0.5220
(0.0057)
Long-term Investment 0.0006** 2.0800 0.0370
(0.0003)
Industry 2 0.0071 0.5500 0.5840
(0.0129)
Industry 3 0.0169** 2.1200 0.0340
(0.0080)
Industry 4 0.0028 0.3400 0.7310
(0.0083)
Industry 5 -0.0011 -0.0700 0.9410
(0.0141)
Industry 6 -0.0044*** -8.1300 0.0000
(0.0005)
Industry 7 0.0109 1.0800 0.2790
(0.0101)
Industry 8 0.0105 0.9100 0.3630
(0.0116)
Industry 9 0.0441** 2.3300 0.0200
(0.0189)
Industry 10 0.0127 1.6200 0.1040
(0.0078)
Industry 11 0.0044 0.5200 0.6060
(0.0085)
Industry 12 0.0113 0.9900 0.3220
(0.0115)
Industry 13 0.0302* 1.8200 0.0690
(0.0166)
Industry 14 0.0013 0.1200 0.9070
(0.0110)
Industry 15 0.1322*** 19.1700 0.0000
(0.0069)

Industry 16 0.0586*** 6.0400 0.0000
(0.0097)
Continued
Industry 17 0.0080 0.5600 0.5770
(0.0143)
Industry 18 0.0182 1.4800 0.1380
(0.0123)
Constant 0.0287 1.2800 0.1990
(0.0224)
Observations 8,284
Number of Firms 1,409
Adjusted R-squared 0.0823
FIRM FE YES
Log-likelihood 23959
INDUSTRY FE YES
For the independent variables, the p-value of insider ownership in Table 4.9 is greater than
0.1, which fails to reject the null hypothesis at the 10% level. Insider ownership and R&D
intensity are insignificantly and positively related. It is in disagreement with the
hypothesis (i.e. H2).
For control variables, the p-value of ln(firm size) is p < 0.05, which rejects the null
hypothesis at the 5% level. Ln(firm size) and R&D intensity are significantly and
negatively related at the 5% level. If firm size increases by 1%, the mean of R&D
intensity decreases by 2.5e-5, ceteris paribus. It is a really minor impact. The p-value of
firm age is p < 0.01, which rejects the null hypothesis. Firm age is significantly and
positively related to R&D intensity. The expected change in R&D intensity is 0.0015 for
an additional one unit increased in firm age, while holding other variables constant. The
p-value of ln(long-term investment) is p < 0.05, which rejects the null hypothesis at the
5% level. If long-term investment increases by 1%, the mean of R&D intensity increases
by 6e-6, ceteris paribus.
For industry dummies, the p-value of industry code 3 is p < 0.05, which rejects the null
hypothesis at the 5% level. On average, the R&D intensity of the manufacturing industry
is 0.0169 higher than the one of agriculture, forestry, animal husbandry and fishery,

ceteris paribus. The p-value of industry code 6 is p < 0.01, which rejects the null
hypothesis. The mean R&D intensity of wholesale and retail trade is 0.0044 lower than
the baseline, ceteris paribus. The p-value of industry code 9 is 0.020, which rejects the
null hypothesis at the 5% level. The mean R&D intensity of information transmission,
software and information technology services is 0.0441 higher than the baseline, ceteris
paribus. The p-value of industry code 13 is p < 0.1, which rejects the null hypothesis at
the 10% level. The mean R&D intensity of scientific research and technical service
industry is 0.0302 higher than the baseline, ceteris paribus. The pvalues of industry codes
15 and 16 are both p < 0.01, so those two null hypotheses can be rejected. The means of
R&D intensity in the education industry and health and social work are 0.1322 and 0.0586
higher than the base level, respectively, ceteris paribus. Except variables mentioned
above, all other variables’ p-values are greater than 0.1, which cannot reject the null
hypotheses.
The log-likelihood value is 23959.
4.3.2.2.2 Model 2: Categorical Insider Ownership
i. Tests for Assumptions of Panel Data Regression
The LM test was applied to see the type of regression to be used. As the p-value for the
LM test is p < 0.01, it rejected the null hypothesis of no panel effect at the 1% level. Panel
data regression was, therefore, better than pooled regression. Given that the pvalue for the
HS test is p < 0.01, it rejected the null hypothesis of a random effect at the
1% level. Consequently, a panel data regression with fixed effects was a suitable model.
Regression assumptions were tested afterwards to ensure coefficients were consistent and
not biased.
First, the mean of residuals is 0, which implied the linearity in parameters (Assumption 1).
Second, the assumption of homoscedasticity violated by modified Wald test as the pvalue
was p < 0.01 (Assumption 2). Third, the p-value of run test of randomness was p < 0.01,

which rejected the null hypothesis (Assumption 3). It meant that there was serial
correlation. Fourth, the p-value of Ramsey RESET Test was p < 0.01, which rejected
the null hypothesis of no omit variable at the 5% level (Assumption 4). As a
consequence, there was a misspecification error. Fifth, residual distribution was
asymptotically normal because of large sample size (Assumption 5). Sixth, the
correlation matrix is display in Appendix E, which suggests that there is no violation of
the assumption of no perfect multicollinearity, due to low correlations (Assumption 6).
To sum up, the fixed effects with robust standard error was applied thereafter, because of
the violations of assumptions.
ii. Results
Table 4.8 Regression with Categorical Insider Ownership
(4)
H2
Fixed Effects
VARIABLES Robust t-statistics p-values
Low 0.0025*** 2.8200 0.0050
(0.0009)
Medium 0.0017 0.6900 0.4900
(0.0022)
High 0.0103* 1.8100 0.0710
(0.0053)
Firm Size -0.0025** -2.4500 0.0140
(0.0010)
Firm Age 0.0015*** 7.5400 0.0000
(0.0002)
Knowledge Stock 0.0000 1.0600 0.2880
(0.0000)
Leverage 0.0005 0.5700 0.5670
(0.0010)
Public A-shares -0.0030 -0.5000 0.6170
(0.0056)
Long-term Investment 0.0006** 1.9800 0.0480
(0.0003)
Industry 2 0.0081 0.6500 0.5140
(0.0126)
Industry 3 0.0187** 2.3400 0.0200
(0.0080)

Industry 4 0.0048 0.6000 0.5490
(0.0082)
Industry 5 0.0012 0.0800 0.9380
(0.0139)
Industry 6 -0.0021* -2.0700 0.0380
(0.0011)
Industry 7 0.0129 1.2500 0.2100
Continued
(0.0102)
Industry 8 0.0108 0.9500 0.3400
(0.0114)
Industry 9 0.0456** 2.4400 0.0150
(0.0186)
Industry 10 0.0147* 1.8500 0.0650
(0.0079)
Industry 11 0.0065 0.7500 0.4540
(0.0086)
Industry 12 0.0135 1.1700 0.2420
(0.0115)
Industry 13 0.0335* 1.8500 0.0640
(0.0180)
Industry 14 0.0028 0.2600 0.7940
(0.0108)
Industry 15 0.1328*** 19.4900 0.0000
(0.0068)
Industry 16 0.0605*** 6.1500 0.0000
(0.0098)
Industry 17 0.0096 0.6900 0.4880
(0.0141)
Industry 18 0.0200 1.6200 0.1060
(0.0124)
Constant 0.0253 1.2500 0.2110
(0.0213)
Observations 8,286
Number of Firms 1,409
Adjusted R-squared 0.0846
FIRM FE YES
INDUSTRY FE YES
Log-likelihood 23965
The baseline for the independent variable is the firm without any insider ownership (i.e.
zero-level).

From the table above, the p-value of the low level is p < 0.01, which rejects the null
hypothesis at the 1% level. On average, R&D intensity is 0.0025 higher for lower levels
of insider ownership than for non-insider ownership, ceteris paribus. The p-value of the
medium level is greater than 0.1, which fails to reject the null hypothesis. The expected
R&D intensity between the medium-level and the zero-level is indifferent. The p-value of
the high level is p < 0.1, which rejects the null hypothesis at the 10% level. Highlevel
insider ownership benefits 0.0103 more on R&D intensity than non-insider ownership,
ceteris paribus.
For control variables, the p-value of ln(firm size) is p < 0.05, which rejects the null
hypothesis at the 5% level. Ln(firm size) and R&D intensity are significantly and
negatively related. The mean of R&D intensity decreases by 2.5e-5 if firm size increases
by 1%, ceteris paribus. The p-value of firm age is 0 p < 0.01, which rejects the null
hypothesis. Firm age and R&D intensity are positively and significantly related. The
expected change in R&D intensity is 0.0015 for an additional one year increase in firm
age, ceteris paribus. The p-value for long-term investment is p < 0.05, rejecting the null
hypothesis. Long-term investment and R&D intensity are positively and significantly
correlated. Other things being equal, a one-unit increase in long-term investment results in
an expected change in R&D intensity of 6e-5.
For industry dummies, the p-value for industry code 3 is p < 0.05, rejecting the null
hypothesis at the 5% level. On average, R&D intensity in manufacturing is 0.0187 higher
than that in agriculture, forestry, animal husbandry and fishing, ceteris paribus. A p-value
of p < 0.05 for industry code 6 rejects the null hypothesis. While holding other variables
constant, the average R&D intensity in wholesale and retail trade is 0.0021 below the
baseline. Industry code 9 has a p-value of p < 0.05, rejecting the null hypothesis at the 5%
level. The average R&D intensity for information transmission, software and information
technology services is 0.0456 above the baseline, ceteris paribus. The p-value for industry
code 13 is p < 0.1, rejecting the null hypothesis at the 10% level. Scientific research and

technology services have an average R&D intensity of 0.0335 above the baseline, ceteris
paribus. Industry 15 and 16 have a p-value of p < 0.01, so the null hypothesis is rejected
for these two. The mean values for R&D intensity regarding the education sector and
health and social work are 0.1328 and 0.0605 above the baseline level, respectively,
ceteris paribus. The null hypothesis
cannot be rejected with p-values greater than 0.1 for all variables except those mentioned
above.
The log-likelihood value was 23975.
4.3.2.2.3 Discussions for Insider Ownership with R&D Intensity
i. Likelihood Ratio Test
The log-likelihood value in Table 4.7 is 23959, which is smaller than the one in Table 4.8
(i.e. 23975). The p-value of the likelihood ratio test is close to 0, which rejects the null
hypothesis. Accordingly, the model with categorical insider ownership is better than the
model with continuous insider ownership.
ii. Continuous Insider Ownership
Table 4.9 demonstrates no relationship between insider ownership and R&D intensity, and
this finding does not agree with the previous hypothesis (H2).
The non-relationship between R&D intensity and insider ownership may be because that
insider ownership usually accounts for a small part of the total share capital in China.
Approximately 33% of firms have no insider ownership, 45% have less than 5%, and
7.5% have insider ownership between 5% and 20% (i.e. Appendix B). The mean insider
ownership in Table 4.1 is as small as 7.38%. In short, insider ownership is less developed
in China.
Secondly, in order to ensure that future position is secure, managers are more likely to put
more effort into improving public relations than enhancing the firm performance (Bisot
and Child, 1996; Xin and Pearce, 1996; Peng, 2000).

Thirdly, equity compensation for managers and boards of directors is less common in
China (Choi et al., 2011).
Table 4.10 indicate that insider ownership is more beneficial to R&D intensity than non-
insider ownership at all levels except the medium level. Insider ownership is more
beneficial to innovation performance when it is greater than 20% or less than 5%,
compared to firms without insider ownership. Further, firms with more than 20% insider
ownership have an advantage over firms with a proportion of less than 5% when it comes
to R&D intensity. Again, it disagrees the hypothesis H2.
The results partly agree with the agency theory that a rise in insider ownership causes
managers' interests to align with the shareholders' interests, owing to the efficient
monitoring scheme. It then favours innovation, as effective monitoring mechanisms allow
managers to mitigate concerns about the consequences of R&D failure on their careers.
Insiders with small shareholdings may be employees who have been rewarded with
shares. So, equity incentives also have a positive effect on corporate innovation in China.
Moreover, employees are more willing to innovate in order to achieve self-worth and have
stable employment (Chang et al., 2006).
Another reason is that the firm owner may focus on innovation in order to find longterm
competitiveness of products or services for a successful continuation of the firm in the
hands of future generations (Caselli and Gennaioli, 2013).
The fourth reason is that agency theory is not appropriate, as it advocates that insider
ownership can lower managerial pressures to maximise short-term values, thereby
enhancing R&D investment (Choi et al., 2012). Alternatively, the transaction cost of
economy (TCE) examines the relationship between insider ownership and innovation
performance more precisely than agency theory (Suk et al., 2012). TCE offers an
explanation of why companies exist, scale up or farm out activities to an external

environment. Firms aim to optimise the unnecessary transition costs incurred in the
exchange of resources within the business environment. A variety of factors -
opportunism, limited rationality, environmental uncertainty, limited information and asset
specificity - are noted by the theory as affecting the extent of transaction costs
(Williamson, 1965). These factors are all expected to worsen the firms' innovation
performance potentially. Compared to developed countries, emerging countries can be
seen as underdeveloped markets with uncertain business environments and a lack of or
expensive resources for innovation (Suk et al., 2012). In an uncertain business
environment, firms can safeguard themselves through political connections. It also brings
more policy-related information to firms, lowering transaction costs and promoting
technological innovation. In a family business, insider ownership may be beneficial for
communication between top management as a way of consolidating decision-making
power and thus saving transaction costs. Such situations allow firms to be sensitive to
changes in the external business environment and to allocate firm resources efficiently to
achieve innovative performance (Poza et al.,1997; Tagiuri and Davis, 1996).
In short, even though agency theory suggests that insider ownership contributes to firms’
innovation performance, the fact is that only 14.1% of observations have insider
ownership over 20%. A side reflection of the high-level insider ownership in Chinese
listed firms is relatively rare.
iii. Categorical Insider Ownership
Table 4.10 indicate that insider ownership is more beneficial to R&D intensity than non-
insider ownership at all levels except the medium level. Insider ownership is more
beneficial to innovation performance when it is greater than 20% or less than 5%,
compared to firms without insider ownership. Further, firms with more than 20% insider
ownership have an advantage over firms with a proportion of less than 5% when it comes
to R&D intensity. Again, it disagrees the hypothesis H2.

The results partly agree with the agency theory that a rise in insider ownership causes
managers' interests to align with the shareholders' interests, owing to the efficient
monitoring scheme. It then favours innovation, as effective monitoring mechanisms allow
managers to mitigate concerns about the consequences of R&D failure on their careers.
Insiders with small shareholdings may be employees who have been rewarded with
shares. So, equity incentives also have a positive effect on corporate innovation in China.
Moreover, employees are more willing to innovate in order to achieve self-worth and have
stable employment (Chang et al., 2006).
Another reason is that the firm owner may focus on innovation in order to find longterm
competitiveness of products or services for a successful continuation of the firm in the
hands of future generations (Caselli and Gennaioli, 2013).
iv. Control Variables
Firm age has a statistically and significantly positive impact on R&D intensity for firms
with insider ownership in Table 4.10, yet the impact is minimal. The learning-by-doing
model tells that the older the firm, the more business experience and foresight it has
(Arrow, 1962; Sorensen and Stuart, 2000; Chang et al., 2002). Accordingly, older firms
with insider ownership may encourage R&D activities to survive in an increasingly
competitive market.
Firm size significantly and negatively affect R&D intensity for firms with insider
ownership, but this impact is trivial in Table 4.10. If firm size upswings dramatically,
firms with insider ownership may be satisfied with firm scale and unwilling to undertake
the cost of R&D failure.
Regarding industry dummies, the baseline is agriculture, forestry, animal husbandry and
fishery. On average, firms with insider ownership within those six industries – (1)
manufacturing industry; (2) information transmission, software and information
technology services; (3) scientific research and technical service industry; (4) education

industry; and (5) health and social work - have a significantly higher R&D intensity than
the baseline as shown in Table 4.10. One interpretation is that an equitycompensation
scheme is prevalent in those industries to promote innovative performance. As with
concentrated ownership, insider ownership has a lower innovation performance in the
wholesale and retail trade than the baseline.
4.3.2.3 State Ownership
4.3.2.3.1 Model 1: Continuous State Ownership
i. Tests for Assumptions of Panel Data Regression
First, the LM test was employed to identify the type of regression to be used. Given that
the LM test has a p-value of p < 0.01, it rejects the null hypothesis of no panel effect at
the 5% level. Hence, the panel data regression is superior to the pooled regression. The p-
value of the HS test is p < 0.01 as it rejects the null hypothesis of random effects at the
1% level. As a result, the panel data regression with fixed effects is an appropriate model.
Then, the tests were applied for defining whether the regression assumptions violated.
First, the mean of residuals is 0, which indicates that the assumption of linearity in
parameters holds (Assumption 1). Second, the assumption of homoscedasticity violates by
modified Wald test, because the p-value of the test is p < 0.01 (Assumption 2). Third, the
p-value of run test of randomness is p < 0.01, which rejects the null hypothesis
(Assumption 3). To rephrase it, residuals are serially correlated. Fourth, the p-value of
Ramsey RESET Test is p < 0.01, which rejects the null hypothesis of no omit variable
(Assumption 4). As a result, there is a problem of model misspecification. Fifth, the total
sample size is large enough to say that residual distribution is asymptotically normal
(Assumption 5). Sixth, the pairwise correlation in Appendix D displays that assumption of
no perfect multicollinearity holds (Assumption 6), because correlations are pretty low.
In order to correct the violations of the assumptions, the fixed effects model was
reregressed by robust standard error.
ii. Results

Table 4.9 Regression with Continues State Ownership
(5)
H3
Fixed Effects
VARIABLES Robust t-statistics p-value
state 0.0012 0.3700 0.7100
(0.0033)
Firm Size -0.0025** -2.4200 0.0160
(0.0010)
Firm Age 0.0015*** 7.6500 0.0000
(0.0002)
Knowledge Stock 0.0000 1.0700 0.2850
(0.0000)
Leverage 0.0005 0.5200 0.6010
(0.0009)
Public A-shares -0.0028 -0.5000 0.6170
(0.0057)
Long-term Investment 0.0006** 2.3300 0.0200
(0.0003)
Industry 2 0.0068 0.5300 0.5990
(0.0129)
Industry 3 0.0171** 2.0800 0.0370
(0.0082)
Industry 4 0.0029 0.3400 0.7360
(0.0085)
Industry 5 -0.0011 -0.0800 0.9390
(0.0142)
Industry 6 -0.0046*** -8.0100 0.0000
(0.0006)
Industry 7 0.0115 1.1100 0.2690
(0.0104)
Industry 8 0.0110 0.9300 0.3540
(0.0118)
Industry 9 0.0447** 2.2900 0.0220
(0.0195)
Industry 10 0.0127 1.5900 0.1120
(0.0080)
Industry 11 0.0046 0.5200 0.6010
(0.0088)
Industry 12 0.0115 0.9800 0.3250
(0.0117)
Industry 13 0.0322* 1.8100 0.0700
Continued
(0.0178)
Industry 14 0.0014 0.1300 0.9000
(0.0113)
Industry 15 0.1326*** 18.5000 0.0000

(0.0072)
Industry 16 0.0593*** 5.9600 0.0000
(0.0099)
Industry 17 0.0084 0.5900 0.5560
(0.0143)
Industry 18 0.0183 1.4500 0.1470
(0.0126)
Constant 0.0271 1.2600 0.2070
(0.0215)
Observations 8,286
Number of Firms 1,409
Adjusted R-squared 0.0799
FIRM FE YES
Log-likelihood 23942
INDUSTRY FE YES
Table 4.9 signifies the panel data regression outputs for state ownership. The p-value of
state ownership is greater than 0.1, which fails to reject the null hypothesis. Hence, state
ownership is insignificantly and negatively related to R&D intensity. The result is
different from the previous hypothesis (i.e. H3).
For control variables, the p-value of ln(firm size) is p < 0.05, which rejects the null
hypothesis at the 5% level. Ln(firm size) and R&D intensity are significantly and
negatively related at the 5% level. If firm size increases by 1%, the mean of R&D
intensity decreases by 2.5e-5, ceteris paribus. It is a really minor impact. The p-value of
firm age is p < 0.01, which rejects the null hypothesis. Firm age is significantly and
positively related to R&D intensity. The expected change in R&D intensity is 0.0015 for
an additional one year increase in firm age, while holding other variables constant. The p-
value of ln(long-term investment) is p < 0.05, which rejects the null hypothesis at the 5%
level. If long-term investment increases by 1%, the mean of R&D intensity increases by
6e-6, ceteris paribus.
For industry dummies, the p-value for industry code 3 is p < 0.05, rejecting the null
hypothesis at the 5% level. On average, the R&D intensity of the manufacturing industry
is 0.0171 higher than the one of agriculture, forestry, animal husbandry and fishery,

ceteris paribus. Industry code 6 has a p-value of p < 0.01, rejecting the null hypothesis.
The average R&D intensity in wholesale and retail trade is 0.0046 lower than the
baseline, all else equal. Industry code 9 has a p-value of p < 0.05, rejecting the null
hypothesis at the 5% level. The average R&D intensity for information transmission,
software and information technology services is 0.0447 above the baseline, all else equal.
The p-value of industry code 13 is p < 0.1, which rejects the null hypothesis at the 10%
level. The mean R&D intensity of scientific research and technical service industry is
0.0322 higher than the baseline, ceteris paribus. The pvalues of industry codes 15 and 16
are p < 0.01, so those two null hypotheses are rejected. The mean R&D intensity
regarding the education industry and health and social work is 0.1326 and 0.0593 above
the baseline level, respectively, all else equal. The p-values for all variables except those
mentioned above are greater than 0.1, and the null hypothesis cannot be rejected.
The log-likelihood value is 23942.
4.3.2.3.2 Model 2: Categorical State Ownership
i. Tests for Assumptions of Panel Data Regression
First, an LM test was applied to observe the type of regression to be used. As the LM test
has a p-value of p < 0.01, it rejects the null hypothesis of no panel effect at the 1% level.
Thus, the panel data regression is better than the pooled regression. Since the pvalue of
the HS test is p < 0.01, it rejects the null hypothesis of a random effect at the 1% level.
The panel data regression with fixed effects is, therefore, an appropriate model.
Afterwards, regression assumptions were tested to ensure the coefficients were unbiased
and consistent.
First, the mean of residuals is 0, which means that the assumption of linearity does not
violate (Assumption 1). Second, the assumption of homoscedasticity violates as the
modified Wald test has a p-value of p < 0.01 (Assumption 2). Third, the p-value of the
run test of randomness is p < 0.01, which rejects the null hypothesis (Assumption 3). In
other words, residuals are autocorrelated. Fourth, the p-value of the Ramsey RESET

Test is greater than 0.1, which fails to reject the null hypothesis (Assumption 4).
Accordingly, misspecification is not a concern in this case. Fifth, the total sample size is
large enough to suggest that residual distribution is asymptotically normal (Assumption
5). Sixth, the pairwise correlation matrix in Appendix D suggests no perfect
multicollinearity because of low correlations (Assumption 6).
In order to correct the violations of the assumptions, the fixed effects model was
reregressed by the robust standard error.
ii. Results
Table 4.10 Regression with Categorical State Ownership
(6)
H3
Fixed Effects
VARIABLES Robust t-statistics p-values
Low 0.0031* 1.8300 0.0670
(0.0017)
Medium -0.0018 -0.6500 0.5150
(0.0028)
High -0.0008 -0.3800 0.7040
(0.0021)
Firm Size -0.0025** -2.4200 0.0160
(0.0010)
Firm Age 0.0015*** 7.8400 0.0000
(0.0002)
Knowledge Stock 0.0000 1.0800 0.2790
(0.0000)
Leverage 0.0005 0.5200 0.6020
(0.0009)
Public A-shares -0.0021 -0.3600 0.7170
(0.0057)
Continued
Long-term Investment 0.0006** 2.2900 0.0220
(0.0003)
Industry 2 0.0069 0.5300 0.5930
(0.0128)
Industry 3 0.0173** 2.1200 0.0340
(0.0081)
Industry 4 0.0024 0.2900 0.7720
(0.0084)
Industry 5 -0.0005 -0.0400 0.9700
(0.0142)

Industry 6 -0.0047*** -9.1200 0.0000
(0.0005)
Industry 7 0.0105 1.0000 0.3160
(0.0105)
Industry 8 0.0105 0.8900 0.3760
(0.0118)
Industry 9 0.0448** 2.2900 0.0220
(0.0195)
Industry 10 0.0124 1.5600 0.1200
(0.0079)
Industry 11 0.0040 0.4600 0.6440
(0.0087)
Industry 12 0.0114 0.9700 0.3310
(0.0117)
Industry 13 0.0323* 1.8300 0.0680
(0.0177)
Industry 14 0.0012 0.1100 0.9140
(0.0113)
Industry 15 0.1322*** 18.5200 0.0000
(0.0071)
Industry 16 0.0586*** 5.8500 0.0000
(0.0100)
Industry 17 0.0084 0.5900 0.5570
(0.0142)
Industry 18 0.0177 1.4200 0.1540
(0.0124)
Constant 0.0281 1.3000 0.1930
(0.0216)
Observations 8,286
Number of Firms 1,409
Adjusted R-squared 0.0820
FIRM FE YES
INDUSTRY FE YES
Log-likelihood 23953
The baseline is the zero level of state ownership.
The low level has a p-value of p < 0.1 in Table 4.10, rejecting the null hypothesis at the
10% level. On average, R&D intensity for the low-level is 0.0031 higher than the
zerolevel. The other two levels of state ownership do not differ significantly from non-
state ownership in R&D intensity since they have p-values greater than 0.1.
For control variables, the p-value of ln(firm size) is p < 0.05, which rejects the null
hypothesis at the 5% level. Ln(firm size) and R&D intensity are significantly and

negatively related. The mean of R&D intensity decreases by 2.5e-5 if firm size increases
by 1%, ceteris paribus. The p-value of firm age is p < 0.01, which rejects the null
hypothesis. Firm age and R&D intensity are positively and significantly related. The
expected change in R&D intensity is 0.0015 for an additional one year increase in firm
age, ceteris paribus. The p-value of ln(long-term investment) is p < 0.05, which rejects the
null hypothesis at the 5% level. If long-term investment increases by 1%, the mean of
R&D intensity increases by 6e-6, ceteris paribus.
The baseline for industry dummy is 'agriculture, forestry, animal husbandry and fishery',
which is denoted as industry code 1. The p-value of industry code 3 is p < 0.05, which
rejects the null hypothesis at the 5% level. On average, the R&D intensity of the
manufacturing industry is 0.0173 higher than the one of the baseline, ceteris paribus.
The p-value of industry code 6 is p < 0.01, which rejects the null hypothesis. The mean
R&D intensity of wholesale and retail trade is 0.0047 lower than the baseline, ceteris
paribus. The p-value of industry code 9 is p < 0.05, which rejects the null hypothesis at
the 5% level. The mean R&D intensity of information transmission, software and
information technology services is 0.0448 higher than the baseline, ceteris paribus. The p-
value of industry code 13 is p < 0.1, which rejects the null hypothesis at the 10% level.
The mean R&D intensity of scientific research and technical service industry is 0.0323
higher than the baseline, ceteris paribus. Both industry codes 15 and 16 have pvalues of p
< 0.01, and both hypotheses can be rejected. On average, the education industry and
health and social work have an R&D intensity of 0.1320 and 0.0586 higher than the
baseline, respectively, ceteris paribus. Other control variables' p-values are relatively
large, which fail to reject the null hypotheses at the 10% level.
The log-likelihood value is 23953.
4.3.2.3.3 Discussions for State Ownership with R&D Intensity
i. Likelihood Ratio Test

The log-likelihood value in Table 4.11 is 23942, which is lower than the one in Table 4.12
(i.e. 23953). Nonetheless, the p-value of the likelihood ratio test is p < 0.01, rejecting the
null hypothesis at the 1% level. The model with categorical state ownership (i.e. model 6)
performs better than the model with continuous categorical state ownership (i.e. model 5).
ii. Continuous State Ownership
There is no relationship between state ownership and innovation performance found in
Table 4.13, which rejects the hypothesis made in Chapter 3 (i.e. H3).
Though firms with state ownership have resource benefits, the importance of resource
allocation from the government drops when firms are listed in the exchange. Except for
financial support from the government, listed firms are more likely to raise funds in the
market (Zhou et al., 2017).
Another reason may be that highly sophisticated SOEs that have invested heavily in
innovation are not listed for technical confidentiality as well as political and commercial
reasons.
iii. Categorical State Ownership
Results such as those in Table 4.10 refute the conclusion that state ownership and
innovation performance are non-correlated, concluding that low-level state ownership has
a greater impact on R&D intensity than the zero-level. Innovation is facilitated when state
ownership is below 5% rather than for non-state ownership. The result is consistent with
hypothesis H3 only when state ownership is low.
One reason could be that the low-level state ownership takes advantage of state resources
without the fear of the state seizing the firm's control rights. In 2015, the CPC
promulgated regulations on the work of the party committees in the firm with the clear
intention of the firm's control rights (Xie et al., 2022). It may cause other investors
concerns about the firm's future and increase great pressure on managers. Accordingly,
Managers in a firm with a high level of state ownership may abate R&D investment, as

they are reluctant to bear the cost of R&D failure for the sake of their future careers. iv.
Control Variables
In spite of the fact that firm age positively affects R&D intensity in Table 4.14, such
influence is minor. Due to the learning-by-doing model, older firms take advantage of
business experience and foresight (Arrow, 1962; Sorensen and Stuart, 2000; Chang et al.,
2002). As a result, firms with state ownership favour R&D investment to let firms be alive
in an increasingly competitive market.
The negative impact of firm size on R&D intensity is paltry in Table 4.14. Nevertheless,
firms with state ownership may no longer be interested in R&D investment if the firm size
becomes extremely large.
The positive and slight effect of long-term investment on R&D intensity in Table 4.14
shows that state-owned firms’ interests in R&D rise as there is a surge in long-term
investment.
Regarding industry dummies, the baseline is agriculture, forestry, animal husbandry and
fishery. On average, firms with insider ownership within those five industries – (1)
manufacturing industry; (2) information transmission, software and information
technology services; (3) scientific research and technical service industry; (4) education
industry; and (5) health and social work - have a significantly higher R&D intensity than
the baseline. It includes highly sophisticated industries, such as manufacturing, where the
government invests enormously in scientific research in order to break through the
technological blockade from western countries as soon as possible. So, in contrast to
agriculture, forestry, animal husbandry and fishery, it is understandable for the
government to have a relatively high R&D intensity in these sectors.
4.3.2.4 Institutional Ownership
4.3.2.4.1 Model 1: Continuous Institutional Ownership
i. Tests for Assumptions of Panel Data Regression

Initially, the LM test was employed to decide the type of regression to be applied. As the
LM test had a p-value of p < 0.01, it rejected the null hypothesis of no panel effect at the
1% level. Consequently, the panel data regression was better than the pooled regression.
Since the p-value of the HS test was p < 0.01, it rejected the null hypothesis of a random
effect at the 1% level. A panel data regression with fixed effects was, therefore, an
appropriate model.
After choosing an appropriate model, assumptions should be tested to confirm the
regression estimates were meaningful (i.e. consistent and unbiased).
First, the mean of residuals was 0, which suggested that the assumption of linearity in
parameters held (Assumption 1). Second, the p-value of the modified Wald test was p <
0.01, rejecting the null hypothesis of homoscedastic errors (Assumption 2). Third, the
pvalue of the run test of randomness was p < 0.01, which rejected the null hypothesis
(Assumption 3). To put it in another way, residuals were serially correlated. Fourth, the p-
value of the Ramsey RESET Test was p < 0.01, which rejected the null hypothesis of no
omitted variable (Assumption 4). As a result, there was a problem with model
misspecification. Fifth, residuals were asymptotically normal due to a large sample size
(Assumption 5). Sixth, the assumption of no perfect multicollinearity held due to
correlations in Appendix D being pretty low (Assumption 6).
Then, the robust standard error was applied to correct the violations of the assumptions.
ii. Results
Table 4.11 Regression with Continuous Institutional Ownership
(7)
H4
Fixed Effects
VARIABLES Robust t-statistics p-values
institutional 0.0001 0.0200 0.9840
(0.0042)
Firm Size -0.0025** -2.4200 0.0160
(0.0010)
Firm Age 0.0015*** 7.6400 0.0000

(0.0002)
Knowledge Stock 0.0000 1.0600 0.2890
(0.0000)
Leverage 0.0005 0.5200 0.6000
(0.0009)
Public A-shares -0.0026 -0.4000 0.6860
(0.0065)
Long-term Investment 0.0006** 2.3300 0.0200
(0.0003)
Industry 2 0.0069 0.5300 0.5930
(0.0129)
Industry 3 0.0171** 2.1100 0.0350
(0.0081)
Industry 4 0.0029 0.3500 0.7270
(0.0084)
Industry 5 -0.0010 -0.0700 0.9440
(0.0141)
Industry 6 -0.0045*** -8.5400 0.0000
(0.0005)
Industry 7 0.0115 1.0900 0.2770
(0.0105)
Industry 8 0.0107 0.9100 0.3660
(0.0118)
Industry 9 0.0447** 2.2900 0.0220
(0.0195)
Industry 10 0.0127 1.6100 0.1080
(0.0079)
Industry 11 0.0046 0.5300 0.5960
(0.0087)
Industry 12 0.0116 0.9900 0.3220
(0.0117)
Industry 13 0.0319* 1.8000 0.0720
(0.0177)
Industry 14 0.0014 0.1300 0.8960
(0.0111)
Industry 15 0.1326*** 18.5400 0.0000
(0.0072)
Industry 16 0.0590*** 5.6900 0.0000
(0.0104)
Industry 17 0.0085 0.5900 0.5530
(0.0143)
Continued
Industry 18 0.0183 1.4600 0.1440
(0.0125)
Constant 0.0270 1.2400 0.2140
(0.0217)
Observations 8,286
Number of Firms 1,409
Adjusted R-squared 0.0798

FIRM FE YES
Log-likelihood 23942
INDUSTRY FE YES
Robust standard errors in parentheses
*** p<0.01, ** p<0.05, * p<0.1
The p-value of institutional ownership in the Table 4.11 is greater than 0.1, which fails to
reject the null hypothesis. Hence, institutional ownership is insignificantly and positively
related to R&D intensity.
For control variables, the p-value of ln(firm size) is p < 0.05, which rejects the null
hypothesis at the 5% level. Ln(firm size) and R&D intensity are significantly and
negatively related at the 5% level. If firm size increases by 1%, the mean of R&D
intensity decreases by 2.5e-5, ceteris paribus. The p-value of firm age is p < 0.01, which
rejects the null hypothesis. Firm age is significantly and positively related to R&D
intensity. The expected change in R&D intensity is 0.0015 for an additional one year
increase in firm age, while holding other variables constant. The p-value of ln(long-term
investment) is p < 0.01, which rejects the null hypothesis at the 1% level. If long-term
investment increases by 1%, the mean of R&D intensity increases by 6e-6, ceteris
paribus.
The baseline for industry dummy is ‘agriculture, forestry, animal husbandry and fishery’.
The p-value of industry code 3 is p < 0.05, which rejects the null hypothesis at the 5%
level. On average, the R&D intensity of the manufacturing industry is 0.0171 higher than
the one of the baseline, ceteris paribus. The p-value of industry code 6 is p < 0.01, which
rejects the null hypothesis. The mean R&D intensity of wholesale and retail trade is
0.0045 lower than the baseline, ceteris paribus. The p-value of industry code 9
is p < 0.05, which rejects the null hypothesis at the 5% level. The mean R&D intensity of
information transmission, software and information technology services is 0.0447 higher
than the baseline, ceteris paribus. The p-value of industry code 13 is p < 0.1, which rejects
the null hypothesis at the 10% level. The mean R&D intensity of scientific research and

technical service industry is 0.0319 higher than the baseline, ceteris paribus. Both industry
codes 15 and 16 have p-values of p < 0.01, so null hypotheses are rejected. On average,
the education industry and health and social work have an R&D intensity of 0.1326 and
0.0590 higher than the baseline, respectively, ceteris paribus. Other control variables and
dummy variables’ p-values are relatively large, which fail to reject the null hypotheses at
the 10% level.
In addition, the log-likelihood value is 23942.
4.3.2.4.2 Model 2: Categorical Institutional Ownership
i. Tests for Assumptions of Panel Data Regression
To start with, the LM test was employed to determine the type of regression to be used.
Due to the fact that the LM test had a p-value of p < 0.01, it rejected the null hypothesis of
no panel effect at the 1% level. Panel data regression was, therefore, better than pooled
regression. As the p-value of the HS test was p < 0.01, it rejected the null hypothesis of
random effects at the 1% level. Consequently, the panel data regression with fixed effects
was an appropriate model.
After that, regression assumptions should be tested due to consistent and unbiased
coefficients needed.
First, the mean of residuals was 0, which means that the assumption of linearity did not
violate (Assumption 1). Second, the assumption of homoscedasticity violated by the
modified Wald test with the p-value of p < 0.01 (Assumption 2). Third, the p-value of the
run test of randomness was p < 0.01, which rejected the null hypothesis (Assumption 3).
In other words, residuals were autocorrelated. Fourth, the p-value of the Ramsey RESET
Test was p < 0.01, which rejected the null hypothesis at the 1% level (Assumption 4).
Accordingly, misspecification was a concern in this case. Fifth, the total sample size was
large enough to suggest that residual distribution was asymptotically normal (Assumption
5). Sixth, the pairwise correlation was displayed in Appendix D and suggested that there
is no perfect multicollinearity due to relatively low values of correlations (Assumption 6).

The fixed effects model with robust standard error was then utilised to correct the
violations of the assumptions.
ii. Results
Table 4.12 Regression with Categorical Institutional Ownership
(8)
H4
Fixed Effects t-statistics p-values
VARIABLES Robust
Low 0.0005 0.3700 0.7140
(0.0012)
Medium 0.0008 0.5400 0.5880
(0.0014)
High 0.0007 0.3900 0.6940
(0.0019)
Firm Size -0.0025** -2.4500 0.0140
(0.0010)
Firm Age 0.0015*** 7.6900 0.0000
(0.0002)
Knowledge Stock 0.0000 1.0500 0.2950
(0.0000)
Leverage 0.0005 0.5200 0.6010
(0.0009)
Public A-shares -0.0031 -0.4800 0.6310
(0.0065)
Long-term Investment 0.0006** 2.3100 0.0210
(0.0003)
Industry 2 0.0068 0.5200 0.6020
(0.0130)
Industry 3 0.0171** 2.1000 0.0360
(0.0082)
Industry 4 0.0030 0.3600 0.7180
(0.0084)
Industry 5 -0.0009 -0.0700 0.9480
(0.0141)
Industry 6 -0.0046*** -8.6300 0.0000
(0.0005)
Continued
Industry 7 0.0116 1.1200 0.2640
(0.0104)
Industry 8 0.0107 0.9100 0.3650
(0.0118)
Industry 9 0.0447** 2.2900 0.0220
(0.0195)
Industry 10 0.0128 1.6100 0.1070
(0.0079)

Industry 11 0.0046 0.5300 0.5950
(0.0087)
Industry 12 0.0117 1.0100 0.3130
(0.0116)
Industry 13 0.0318* 1.7800 0.0750
(0.0178)
Industry 14 0.0015 0.1400 0.8920
(0.0112)
Industry 15 0.1328*** 19.1100 0.0000
(0.0070)
Industry 16 0.0590*** 5.8200 0.0000
(0.0101)
Industry 17 0.0084 0.5800 0.5610
(0.0144)
Industry 18 0.0184 1.4700 0.1430
(0.0125)
Constant 0.0270 1.2500 0.2110
(0.0216)
Observations 8,286
Number of Firms 1,409
Adjusted R-squared 0.0797
FIRM FE YES
INDUSTRY FE YES
Log-likelihood 23942
Robust standard errors in parentheses
*** p<0.01, ** p<0.05, * p<0.1
The baseline is zero-level institutional ownership.
All p-values for three levels of institutional ownership are greater than 0.1 in the table
above. No significant difference in institutional ownership compared to noninstitutional
ownership for all three levels of R&D intensity, on average, ceteris paribus. For control
variables, the p-value of ln(firm size) is p < 0.05, which rejects the null hypothesis at the
5% level. Ln(firm size) and R&D intensity are significantly and negatively related. The
mean of R&D intensity decreases by 2.5e-5 if firm size increases by 1%, ceteris paribus.
The p-value of firm age is p < 0.01, which rejects the null hypothesis. Firm age and R&D
intensity are positively and significantly related. The expected change in R&D intensity is
0.0015 for an additional one year increase in firm age, ceteris paribus. The p-value of
ln(long-term investment) is p < 0.05, which rejects the null hypothesis at the 5% level. If

long-term investment increases by 1%, the mean of R&D intensity increases by 6e-6,
ceteris paribus.
The baseline for industry dummy is ‘agriculture, forestry, animal husbandry and fishery’.
The p-value of industry code 3 is p < 0.05, which rejects the null hypothesis at the 5%
level. On average, the R&D intensity of the manufacturing industry is 0.0171 higher than
the one of the baseline, ceteris paribus. The p-value of industry code 6 is p < 0.01, which
rejects the null hypothesis. The mean R&D intensity of wholesale and retail trade is
0.0046 lower than the baseline, ceteris paribus. The p-value of industry code 9 is p < 0.05,
which rejects the null hypothesis at the 5% level. The mean R&D intensity of information
transmission, software and information technology services is 0.0447 higher than the
baseline, ceteris paribus. The p-value of industry code 13 is p < 0.1, which rejects the null
hypothesis at the 10% level. The mean R&D intensity of scientific research and technical
service industry is 0.0318 higher than the baseline, ceteris paribus. Both industry codes 15
and 16 have p-values of p < 0.01, which rejects the null hypothesis. On average, the
education industry and health and social work have an R&D intensity of 0.1328 and
0.0590 higher than the baseline, respectively, ceteris paribus. Other control variables’ p-
values are relatively large, which fail to reject the null hypotheses at the 10% level.
In addition, the log-likelihood value is 23942.
4.3.2.4.3 Discussions for Institutional Ownership with R&D Intensity
i. Likelihood Ratio Test
The log-likelihood value in Table 4.11 is 23942, which is same as the log-likelihood value
in Table 4.12 (i.e. 23942). Likelihood ratio test generates the p-value above 0.1, which
fails to reject the null hypothesis. The model with continuous institutional ownership is
better than the model with the categorical institutional ownership.
ii. Continuous Institutional Ownership
Table 4.17 reveals no relationship between institutional ownership and R&D intensity,
whereas this conclusion is inconsistent with the hypothesis made in Chapter 3 (i.e. H4).

Despite firms with institutional ownership favour efficient monitoring mechanisms,
particularly with weak incumbent management (Fung, 2012), it is underdeveloped in
developing countries compared to developed countries. Of the data, approximately 8% of
the sample have no institutional ownership, 34% have less than 5% (but higher than 0%),
and 36% have levels between 5% and 20%. Institutional investors usually regulate and
monitor managers via governance activities or gathering information about the quality of
R&D investments (Bushee, 1998). If the level of institutional ownership is low, active
monitoring by institutional ownership cannot eliminate managers’ concerns about R&D
failure and cannot relieve managers’ pressure to maximise short-term profits.
Additionally, the holding period of institutional investors may be too short for gaining
long-term benefits of R&D investment.
iii. Categorical Institutional Ownership
On average, institutional ownership is not significantly different across all three levels of
R&D intensity compared to non-institutional ownership. It is then in disagreement with
hypothesis H4.
iv. Control Variables
Firm age has a statistically and significantly positive impact on R&D intensity for firms
with institutional ownership in Table 4.17, yet the impact is paltry. A rise in firm age
accumulates business experience and business foresight, owing to the learning-by-doing
model foresight (Arrow, 1962; Sorensen and Stuart, 2000; Chang et al., 2002). Firms with
institutional ownership boost R&D investment to survive in an increasingly competitive
market.
Firm size significantly and negatively affect R&D intensity for firms with institutional
ownership, yet this impact is trivial. If firm size upswings dramatically, firms' interest in
R&D investment reduces as they are unwilling to undertake the cost of R&D failure.
The little and positive impact of long-term investment on R&D intensity discloses that

R&D intensity grows extensively only if there is a bulk investment in long-term assets.
With regard to industry data, the baseline is agriculture, forestry, animal husbandry and
fisheries. For those firms with concentrated ownership in those five sectors - (1)
manufacturing; (2) information transmission, software and information technology; (3)
scientific research and technical services; (4) education; and (5) health and social work -
the R&D intensity is, on average, significantly higher than the baseline. In contrast, the
R&D intensity of the wholesale and retail sector in institutional ownership is below the
baseline.
4.3.2.5 Foreign Ownership
4.3.2.5.1 Model 1: Continuous Foreign Ownership
i. Tests for Assumptions of Panel Data Regression
First of all, the LM test was applied to see which type of regression to be used. Since the
p-value of the LM test was p < 0.01, it rejected the null hypothesis of no panel effect at
the 1% level. Hence, panel data regression was better than pooled regression. As the p-
value of the HS test was p < 0.01, it rejected the null hypothesis of random effect at the
1% level. Therefore, panel data regression with fixed effects model was a proper model.
Then, regression assumptions should be tested to confirm coefficients that were consistent
and unbiased.
First, the mean of residuals was 0, which meant the parameters are linear (Assumption
1). Second, the variance of error terms was heteroscedastic because the p-value of the
modified Wald test was p < 0.01. The null hypothesis was then rejected (Assumption 2).
Third, the p-value of the run test of randomness was p < 0.01, which rejected the null
hypothesis (Assumption 3). To put it in another way, residuals were serially correlated.
Fourth, the p-value of the Ramsey RESET Test was p < 0.01, which rejected the null
hypothesis of no omitted variable (Assumption 3). As a result, there was a problem with
model misspecification. Fifth, residuals were asymptotically normal due to a large

sample size (Assumption 5). Sixth, Appendix D indicates multicollinearity is not an issue
as the correlation is quite low (Assumption 6).
In order to correct the violations of the assumptions, the model was re-regressed by the
robust standard error.
ii. Results
Table 4.13 Regression with Continuous Foreign Ownership
(9)
H5
Fixed Effects t-statistics p-values
VARIABLES Robust
foreign -0.0246** -2.5000 0.0120
(0.0098)
Firm Size -0.0024** -2.3800 0.0170
(0.0010)
Firm Age 0.0015*** 7.6800 0.0000
(0.0002)
Knowledge Stock 0.0000 1.0900 0.2740
(0.0000)
Leverage 0.0005 0.5300 0.5940
(0.0009)
Public A-shares -0.0007 -0.1300 0.8960
(0.0057)
Long-term Investment 0.0006** 2.3700 0.0180
(0.0003)
Industry 2 0.0065 0.5000 0.6170
(0.0129)
Industry 3 0.0172** 2.1000 0.0360
(0.0082)
Industry 4 0.0028 0.3400 0.7360
(0.0084)
Industry 5 -0.0007 -0.0500 0.9590
Continued
(0.0141)
Industry 6 -0.0045*** -8.4100 0.0000
(0.0005)
Industry 7 0.0115 1.1000 0.2710
(0.0104)
Industry 8 0.0122 1.0300 0.3040
(0.0119)
Industry 9 0.0447** 2.3000 0.0220
(0.0195)
Industry 10 0.0120 1.5100 0.1300
(0.0079)
Industry 11 0.0046 0.5200 0.6010

(0.0087)
Industry 12 0.0116 0.9900 0.3200
(0.0117)
Industry 13 0.0321* 1.8000 0.0720
(0.0178)
Industry 14 0.0015 0.1300 0.8960
(0.0113)
Industry 15 0.1327*** 18.5600 0.0000
(0.0071)
Industry 16 0.0587*** 5.9200 0.0000
(0.0099)
Industry 17 0.0082 0.5700 0.5670
(0.0142)
Industry 18 0.0183 1.4500 0.1460
(0.0126)
Constant 0.0256 1.2000 0.2320
(0.0214)
Observations 8,286
Number of Firms 1,409
Adjusted R-squared 0.0815
FIRM FE YES
Log-likelihood 23949
INDUSTRY FE YES
Robust standard errors in parentheses
*** p<0.01, ** p<0.05, * p<0.1
The p-value of foreign ownership in the table above is p < 0.05, rejecting the null
hypothesis at the 5% level. R&D intensity is expected to decrease by 0.0246 for an
additional one unit increase in foreign ownership, all other things being equal. For control
variables, the p-value of ln(firm size) is p < 0.05, which rejects the null hypothesis at the
5% level. Ln(firm size) and R&D intensity are significantly and negatively related at the
5% level. If firm size increases by 1%, the mean of R&D intensity decreases by 2.4e-5,
ceteris paribus. The p-value of firm age is p < 0.01, which rejects the null hypothesis.
Firm age is significantly and positively related to R&D intensity. The expected change in
R&D intensity is 0.0015 for an additional one year increase in firm age, while holding
other variables constant. The p-value of ln(long-term investment) is p < 0.05, which

rejects the null hypothesis at the 5% level. If long-term investment increases by 1%, the
mean value of R&D intensity increases by 6e-6, ceteris paribus.
The baseline for industry dummy is 'agriculture, forestry, animal husbandry and fishery'.
The p-value of industry code 3 is p < 0.05, which rejects the null hypothesis at the 5%
level. On average, the R&D intensity of the manufacturing industry is 0.0172 higher than
the one of the baseline, ceteris paribus. The p-value of industry code 6 is p < 0.01, which
rejects the null hypothesis. The mean R&D intensity of wholesale and retail trade is
0.0045 lower than the baseline, ceteris paribus. The p-value of industry code 9 is p < 0.05,
which rejects the null hypothesis at the 5% level. The mean R&D intensity of information
transmission, software and information technology services is 0.0447 higher than the
baseline, ceteris paribus. The p-value of industry code 13 is p < 0.1, which rejects the null
hypothesis at the 10% level. The mean R&D intensity of scientific research and technical
service industry is 0.0321 higher than the baseline, ceteris paribus. Both industry codes 15
and 16 have p-values of p < 0.01, which rejects the null hypothesis. On average, the
education industry and health and social work have an R&D intensity of 0.1327 and
0.0587 higher than the baseline, respectively, ceteris paribus. Other variables' p-values are
relatively large, which fail to reject the null hypotheses at the 10% level.
In addition, the log-likelihood value is 23949.
4.3.2.5.2 Model 2: Categorical Foreign Ownership
i. Tests for Assumptions of Panel Data Regression
An LM test was first applied to identify the type of regression to be used. Since the
pvalue of the LM test was p < 0.01, it rejected the null hypothesis of no panel effect at
the 1% level. The panel data regression was, therefore, better than the pooled regression.
Since the HS test had a p-value of p < 0.01, it rejected the null hypothesis of a random
effect at the 1% level. Then, A panel data regression with fixed effects was a suitable
model.

Then, all regression assumptions should be tested to get consistent and unbiased
estimators.
First, the mean of residuals was 0, which meant that the assumption of linearity did not
violate (Assumption 1). Second, the assumption of homoscedasticity violated due to the
p-value of p < 0.01 in the Wald test (Assumption 2). Third, the p-value of the run test of
randomness was p < 0.01, which rejected the null hypothesis (Assumption 3). It meant
that residuals were serially correlated. Fourth, the p-value of the Ramsey RESET Test
was p < 0.01, which rejected the null hypothesis at the 1% level (Assumption 4).
Accordingly, misspecification was a concern. Fifth, the total sample size was large
enough to suggest that residual distribution was asymptotically normal (Assumption 5).
Sixth, Appendix D demonstrates relatively low correlations, which means
multicollinearity is not a problem (Assumption 6).
The fixed effects model was then applied to correct the violations of the assumptions.
ii. Results
Table 4.14 Regression with Categorical Foreign Ownership
iii. (10)
H5
Fixed Effects t-statistics p-values
VARIABLES Robust
Low -0.0006 -0.8300 0.4090
(0.0007)
Medium -0.0026 -1.3100 0.1900
(0.0020)
High -0.0080*** -2.8700 0.0040
(0.0028)
Continued
0.0170
0.0000
0.2970
0.5950
0.8320

2.4000 0.0170
0.5100 0.6120
2.1100 0.0350
0.3400 0.7310
-0.0500 0.9620
-7.9700 0.0000
1.1100 0.2670
1.0300 0.3050
2.3000 0.0220
1.5300 0.1260
0.5300 0.5940
1.0000 0.3180
1.8000 0.0720
0.1400 0.8910
18.5400 0.0000
5.9300 0.0000
0.5700 0.5670
1.4600 0.1450
1.1800 0.2390
Continued
FIRM FE YES
INDUSTRY FE YES
Log-likelihood 23950
Robust standard errors in parentheses
*** p<0.01, ** p<0.05, * p<0.1

The baseline is non-foreign ownership.
From the table above, the p-value of the high-level foreign ownership is p < 0.01,
rejecting the null hypothesis at the 1% level. On average, R&D intensity for the highlevel
is 0.0080 lower than the zero-level while holding other variables constant. The other two
levels of R&D intensity are not significantly different compared to nonforeign ownership,
as their p-values are greater than 0.1.
For control variables, the p-value of ln(firm size) is p < 0.05, which rejects the null
hypothesis at the 5% level. Ln(firm size) and R&D intensity are significantly and
negatively related. The mean of R&D intensity decreases by 2.4e-5 if firm size increases
by 1%, ceteris paribus. The p-value of firm age is p < 0.01, which rejects the null
hypothesis. Firm age and R&D intensity are positively and significantly related. The
expected change in R&D intensity is 0.0015 for an additional one year increase in firm
age, ceteris paribus. The p-value of ln(long-term investment) is p < 0.05, which rejects the
null hypothesis at the 5% level. If long-term investment increases by 1%, the mean of
R&D intensity increases by 7e-6, ceteris paribus.
The baseline for industry dummy is ‘agriculture, forestry, animal husbandry and fishery’.
The p-value of industry code 3 is p < 0.05, which rejects the null hypothesis at the 5%
level. On average, the R&D intensity of the manufacturing industry is 0.0172 higher than
the one of the baseline, ceteris paribus. The p-value of industry code 6 is p < 0.01, which
rejects the null hypothesis. The mean R&D intensity of wholesale and retail trade is
0.0044 lower than the baseline, ceteris paribus. The p-value of industry code 9 is p < 0.05,
which rejects the null hypothesis at the 5% level. The mean R&D intensity of information
transmission, software and information technology services is 0.0448 higher than the
baseline, ceteris paribus. The p-value of industry code 13 is p < 0.1, which rejects the null
hypothesis at the 10% level. The mean R&D intensity of scientific research and technical
service industry is 0.0321 higher than the baseline, ceteris paribus. Both industry codes 15

and 16 have p-values of p < 0.01, which rejects the null hypothesis. On average, the
education industry and health and social work have an R&D intensity of 0.1327 and
0.0588 higher than the baseline, respectively, ceteris paribus. Other variables’ p-values are
relatively large, which fail to reject the null hypotheses at the 10% level.
In addition, the log-likelihood value is 23950.
4.3.2.5.3 Discussions for Foreign Ownership with R&D Intensity
i. Likelihood Ratio Test
The log-likelihood value in Table 4.13 is 23949, and the log-likelihood value in Table 4.14
is 23950. Then, the likelihood ratio test generates a p-value above 0.1, which fails to
reject the null hypothesis. Then, the model with continuous foreign ownership is better
than the model with categorical foreign ownership.
ii. Continuous Foreign Ownership
Table 4.13 discloses that foreign ownership and R&D intensity are negatively related,
which is not in line with the previous hypothesis (i.e. H5).
One interpretation is that many foreign firms have set up subsidiaries in China. In such
cases, foreign firms prefer to import R&D from the parent firms than to innovate locally
in the subsidiaries. It has the advantage of being more cost-effective for foreign firms by
cutting down on using a range of resources, including money, required for R&D
(Globerman and Meredith, 1984). High foreign ownership inhibits the incentive and the
ability to innovate in subsidiaries to some extent. However, indigenous innovation is
essential to China's new source of inclusive growth.
Furthermore, approximately 67% of the data does not contain foreign ownership.
Moreover, within the remaining 33%, financial investments in Chinese firms through the
Hong Kong Securities Clearing Company (HKSC) are also included. HKSC is the sole
subsidiary of the Hong Kong stock exchange. It is an authorised clearing institution that
operates the central clearing and settlement system in Hong Kong. Some Chinese firms
may be listed not only in Shanghai Stock Exchange, but also in Hong Kong stock

exchange. If firms are registered in mainland China, firm shares listed in Hong Kong are
called H shares. Foreign investors cannot directly buy shares in the stock exchange
located in mainland China, but they can indirectly buy H shares of Chinese listed firms on
the Hong Kong Stock Exchange. The firm's annual report does not show each investor's
name, but only HKSC and hence many foreign investors via H shares are interested in a
financial investment rather than supervision. Hence, it may result in a negative impact of
foreign ownership on innovation performance, as foreign investors pursue short-term
maximisation rather than long-term value.
iii. Categorical Foreign Ownership
Table 4.14 confirms the negative relationship between foreign ownership and R&D
intensity for the proportion of foreign ownership over 20%. Again, the result is not in line
with hypothesis H5.
High foreign ownership adds to the fact that the company is a subsidiary of a foreign
company. Due to the cost of innovation, foreign firms are more willing to take advanced
technology from the parent company to China, leaving the Chinese subsidiary to become
an original equipment manufacturer (OEM) and inhibiting its willingness to develop its
R&D capabilities (Globerman and Meredith, 1984). The parent company prefers the
subsidiary to exploit its advantages - a large pool of trained workers, relatively low
resource costs, and a vast Chinese market - to extract more benefits for the parent
company.
iv. Control Variables
The effect of firm age on R&D intensity is statistically positive but minor, as shown in
Table 4.13. Older firms benefit from business experience and foresight, according to the
learning-by-doing model (Arrow, 1962; Sorensen and Stuart, 2000; Chang et al., 2002).
I

The small and negative effect of firm size on R&D intensity exposes that the willingness
of firms with foreign ownership to invest in R&D reduces as firm size upswings
dramatically.
The long-term investment has a slight and positive influence on R&D intensity. It shows
that a growth of R&D intensity is obvious only when a huge sum of investment in long-
term assets.
Regarding industry dummies, the baseline is agriculture, forestry, animal husbandry and
fishery. On average, firms with foreign ownership within those five industries – (1)
manufacturing industry; (2) information transmission, software and information
technology services; (3) scientific research and technical service industry; (4) education
industry; and (5) health and social work - have a significantly higher R&D intensity than
the baseline.
4.3.3 Depth of Innovation and Diversity of Innovation
4.3.3.1 Concentrated Ownership
4.3.3.1.1 Depth of Innovation and Concentrated Ownerships
i. Tests for Assumptions of Panel Data Regression
The first step still is to define which model to be used. LM test was applied, resulting in a
p-value of p < 0.01 which rejected the null hypothesis of no panel effect at the 1% level.
Hence, panel data regression was better than pooled regression. As the p-value of the HS
test was p < 0.01, it rejected the null hypothesis of random effect at the 1% level.
Therefore, panel data regression with a fixed effects was a proper model. Then,
regression assumptions should be tested to obtain consistent and unbiased
estimators.

First, the zero mean residual implied that the assumption of linearity holds (Assumption
1). Second, the p-value of the modified Wald test was p < 0.01, which illustrated the
heteroscedastic residuals. Assumption 2 did not hold. Third, the p-value of the run test of
randomness was p < 0.01, which rejected the null hypothesis (Assumption 3). To rephrase
it, there was a serial correlation in residuals. Fourth, the p-value of the Ramsey
RESET Test was greater than 0.1, which failed to reject the null hypothesis (Assumption
4). It meant that there is no misspecification error. Fifth, the total sample size was large
enough to say that residual distribution is asymptotically normal (Assumption 5). Sixth,
the pairwise correlation matrix is in Appendix E. It exhibits low correlations except for
the correlation between depth and diversity. It was understandable that depth and diversity
are highly correlated, as they were two-sided of a mirror. It was good news that we could
know the other side's story if we know one side. Hence, the high correlation would not
bother the regression analysis since those two variables would not be used in one
regression. In other words, multicollinearity was not an issue in this situation, and
Assumption 6 held.
Due to heteroscedastic and non-independent residuals, the robust standard error was
applied to fix those problems.
ii. Results
Table 4.15 Depth of Innovation for Concentrated Ownership
(11)
H6a
Depth of Innovation t-statistics p-values
VARIABLES Robust
Continued
Medium -0.0048 -0.1800 0.8580
(0.0270)
High -0.0117 -0.3400 0.7360
(0.0348)
R&D Intensity 0.1254 0.6000 0.5460
(0.2075)
Firm Size -0.0008 -0.0500 0.9630
(0.0164)

Firm Age -0.0106*** -4.1500 0.0000
(0.0026)
Knowledge Stock -0.0001* -1.8600 0.0630
(0.0000)
Leverage -0.0071 -0.6700 0.5020
(0.0106)
Public A-shares -0.0930 -1.2100 0.2280
(0.0771)
Long-term Investment -0.0154*** -2.9800 0.0030
(0.0052)
Constant 1.1882*** 3.7700 0.0000
(0.3153)
Observations 4,074
Number of Firms 958
Adjusted R-squared 0.0192
FIRM FE YES
Log-likelihood 1977
Robust standard errors in parentheses
*** p<0.01, ** p<0.05, * p<0.1
The baseline is low-level concentrated ownership. The p-value of the medium-level is
greater than 0.1, which fails to reject the null hypothesis. It has the same situation for the
high level, which contains a p-value above 0.1. The experimental results disagree with the
previous hypothesis (i.e. H6a).
For control variables, the p-value of firm age is p < 0.01, which rejects the null
hypothesis. There is a significantly negative relationship between firm age and the depth
of innovation. The depth of innovation is expected to decrease by 0.0106 for one
additional year increased in firm age, ceteris paribus. The p-value of knowledge stock is p
< 0.1, which rejects the null hypothesis at the 10% level. The depth of innovation is
expected to decrease by 0.0001 as the total number of patents increases by 1 unit while
holding other variables constant.
The p-value of long-term investment is p < 0.01, which rejects the null hypothesis at the
1% level—long-term investment and the depth of innovation in significantly and
negatively related. Expected change in depth of innovation is -0.000154, if long-term

investment increases by 1%, ceteris paribus. The p-values of other variables are all greater
than 0.1, which fails to reject the null hypothesis.
The log-likelihood value, in this case, is 1977.
4.3.3.1.2 Diversity of Innovation and Concentrated Ownerships
i. Tests for Assumptions of Panel Data Regression
The p-value from the LM test is p < 0.01, which rejects the null hypothesis of pooled
regression. The HS test was applied afterwards and showed a p-value of p < 0.01,
rejecting the null hypothesis of random effects. Consequently, the fixed effects model was
applied.
After that, regression assumptions should be tested for consistent and unbiased estimators.
First, the zero mean residual implied that the assumption of linearity held (Assumption 1).
Second, the p-value of the modified Wald test was p < 0.01, which showed the
heteroscedastic residuals. Assumption 2 was violated. Third, the p-value of the run test of
randomness was p < 0.01, which rejected the null hypothesis (Assumption 3). To rephrase
it, there was a serial correlation in residuals. Fourth, the p-value of the Ramsey RESET
Test was p < 0.05, which failed to reject the null hypothesis at the 5% level (Assumption
4). It meant there was not a problem of misspecification. Fifth, residuals were
asymptotically normal due to a large sample size (Assumption 5). Finally, Assumption 6
does not violate because most correlations matrix in Appendix E remains at a low level
apart from the correlation between diversity and depth. However, it did not raise a
concern for multicollinearity, as those two were dependent variables.
Since residuals were heteroscedastic and serially correlated, the robust standard error was
applied.
ii. Results
Table 4.16 Diversity of Innovation for Concentrated Ownership
(12)
H6b
Diversity of Innovation
t-statistics
p-values
VARIABLES Robust

Medium
-0.0006
(0.0480)
-0.0100 0.9900
High
0.0075
(0.0617)
0.1200 0.9040
R&D Intensity
-0.1640
(0.3483)
-0.4700 0.6380
Firm Size
0.0274
(0.0304)
0.9000 0.3670
Firm Age
0.0197***
(0.0047)
4.1700 0.0000
Knowledge Stock
0.0002**
(0.0001)
2.4500 0.0150
Leverage
0.0039
(0.0183)
0.2100 0.8330
Public A-shares
0.1794
(0.1359)
1.3200 0.1870
Long-term Investment
0.0266***
(0.0091)
2.9200 0.0040
Constant
0.0719
(0.5896)
0.1200
0.9030
Observations 4,074
Number of Firms 958
Adjusted R-squared 0.0286
FIRM FE YES
Log-likelihood -328.6
The p-values of the medium-level and the high-level are both greater than 0.1. Both
hypotheses cannot be rejected. There is not a significant difference in the diversity of
R&D for the three levels of concentrated ownership, on average, when other variables are
held constant. The experimental results are inconsistent with the previous hypothesis
(i.e. H6b).
For control variables, the p-value of firm age is p < 0.01, which rejects the null
hypothesis. There is a significantly positive relationship between firm age and the
diversity of innovation. The expected change in the diversity of innovation is 0.0197 for
one additional year increase in firm age, ceteris paribus. The p-value of knowledge stock
is p < 0.05, which rejects the null hypothesis at the 5% level. Knowledge stock and the
diversity of innovation are positively related. Excepted change in the diversity of
innovation is 0.0002 for an additional one unit increased in knowledge stock while

holding other variables constant. The p-value of ln(long-term investment) is p < 0.01,
which rejects the null hypothesis at the 5% level. Ln(long-term investment) and the
diversity of innovation are significantly and positively related. If long-term investment
increases by 1%, the diversity of innovation is expected to increase by 0.000266, ceteris
paribus.
The log-likelihood value is -328.5954.
4.3.3.2 Insider Ownership
4.3.3.2.1 Depth of Innovation and Insider Ownerships
i. Tests for Assumptions of Panel Data Regression
A p-value of p < 0.01 for the LM test rejects the null hypothesis of pooled regression. The
HS test was then applied, showing a p-value of p < 0.01, rejecting the null hypothesis of a
random effect. Therefore, the fixed effects model was applied.
First, the zero mean residual implied that the assumption of linearity held (Assumption 1).
Second, the p-value of the modified Wald test was p < 0.01, which suggested
heteroscedastic residuals. Assumption 2 violated due to non-constant variance. Third, the
p-value of the run test of randomness was p < 0.01, which rejected the null hypothesis
(Assumption 3). In other words, residuals were autocorrelated. Fourth, the pvalue of the
Ramsey RESET Test was greater than 0.1, which failed to reject the null hypothesis
(Assumption 4). It meant that there is no misspecification error. Fifth, the total sample size
was large enough to say that residual distribution was asymptotically normal (Assumption
5). Finally, Assumption 6 holds due to a low level of correlations in Appendix E.
Due to the violations of assumptions, the robust standard error was applied to fix these
problems.
ii. Results
Table 4.17 Depth of Innovation for Insider Ownership
(13)
H7a
Depth of Innovation
t-statistics
p-values
VARIABLES Robust

Low
0.0118
(0.0155)
0.7500
0.4510
Medium
-0.0239
(0.0299)
-0.8300
0.4070
High
0.0159
(0.0394)
0.3700
0.7100
R&D Intensity
0.1169
(0.2066)
0.3600
0.7190
Firm Size
0.0008
(0.0166)
0.2800
0.7760
Firm Age
-0.0107***
(0.0026)
-4.4700
0.0000
Knowledge Stock
-0.0001*
(0.0000)
-1.8000
0.0720
Leverage
-0.0061
(0.0111)
0.0300
0.9750
Public A-shares
-0.1019
(0.0727)
-1.2400
0.2150
Long-term Investment
-0.0156***
(0.0052)
-3.2100
0.0010
Constant
1.1506***
(0.3172)
3.6700
0.0000
Observations
4,074
Number of Firms 958
Adjusted R-squared 0.0200
FIRM FE YES
Log-likelihood 1980
Robust standard errors in parentheses
*** p<0.01, ** p<0.05, * p<0.1
The baseline is zero-level insider ownership.
The p-values for all three levels in the table above are greater than 0.1, indicating that
there is no significant difference between the R&D intensity of insider ownership and
non-insider ownership for the three levels, on average, all else being equal. The
conclusions show inconsistency with hypothesis H7a.
For control variables, the p-value of firm age is p < 0.01, which rejects the null
hypothesis. There is a significantly negative relationship between firm age and the depth
of innovation. The depth of innovation is expected to decrease by 0.0107 for one
additional year increased in firm age, ceteris paribus. The p-value of knowledge stock is p

< 0.1, which rejects the null hypothesis at the 10% level. The mean depth of innovation
decreases by 0.0001, as knowledge increases by one unit, ceteris paribus.
The p-value of long-term investment is p < 0.01, which rejects the null hypothesis at the
1% level—long-term investment and the depth of innovation in significantly and
negatively related. Expected change in depth of innovation is -0.000156, if long-term
investment increases by 1%, ceteris paribus. The p-values of other variables are all greater
than 0.1, which fails to reject the null hypothesis.
The log-likelihood value is 1980.
4.3.3.2.2 Diversity of Innovation and Insider Ownerships
i. Tests for Assumptions of Panel Data Regression
The LM test showed a p-value of p < 0.01, rejecting the null hypothesis of pooled
regression. The HS test was then applied, showing a p-value of p < 0.01, rejecting the null
hypothesis of a random effect. Therefore, a fixed effects model was applied.
The regression assumptions were tested, and the results were as follows.
First, the zero mean residual implied that the assumption of linearity held (Assumption 1).
Second, the p-value of the modified Wald test was p < 0.01, which showed the
heteroscedastic residuals. It then violated Assumption 2. Third, the p-value of the run test
of randomness was p < 0.01, which rejected the null hypothesis (Assumption 3). To put it
differently, residuals were serially correlated. Fourth, the p-value of the Ramsey RESET
Test was greater than 0.05, which failed to reject the null hypothesis at the 5% level
(Assumption 4). It meant there was not a problem of misspecification. Fifth, residuals
were asymptotically normal due to a large sample size (Assumption 5). There was no
perfect multicollinearity due to pretty low correlations in Appendix E
(Assumption 6).
Then, the robust standard error was utilised for the fixed effects model.
ii. Results
Table 4.18 Diversity of Innovation for Insider Ownership
(14)

H7b
Diversity of Innovation
t-statistics
p-values
VARIABLES Robust
Low
-0.0206
(0.0281)
-0.7200
0.4690
Medium
0.0517
(0.0522)
1.0300
0.3050
High
-0.0145
(0.0668)
-0.1800
0.8550
R&D Intensity
-0.1400
(0.3484)
-0.1800
0.8540
Firm Size
0.0245
(0.0307)
0.6400
0.5220
Firm Age
0.0199***
(0.0047)
4.5300
0.0000
Knowledge Stock
0.0002**
(0.0001)
2.4100
0.0160
Leverage
0.0028
(0.0192)
-0.3700
0.7090
Public A-shares
0.1831
(0.1284)
1.2700
0.2040
Long-term Investment 0.0270*** 3.1500 0.0020
(0.0092) -0.7200 0.4690
Constant
0.1346
(0.5930)
Observations
4,074
Number of Firms 958
Adjusted R-squared 0.0296
FIRM FE YES
Log-likelihood -326.0
Robust standard errors in parentheses
*** p<0.01, ** p<0.05, * p<0.1
The baseline is zero level of insider ownership.
The p-values for all three levels in the table above are all greater than 0.1, denoting that
the R&D intensity between insider ownership and non-insider ownership is not
significantly different at the three levels, on average, ceteris paribus. The conclusions are
not in agreement with hypothesis H7b.
For control variables, the p-value of firm age is p < 0.01, which rejects the null
hypothesis. There is a significantly positive relationship between firm age and the

diversity of innovation. The expected change in the diversity of innovation is 0.0199 for
one additional year increase in firm age, ceteris paribus. The p-value of knowledge stock
is p < 0.05, which rejects the null hypothesis at the 5% level. Knowledge stock and the
diversity of innovation are positively related. Excepted change in the diversity of
innovation is 0.0002 for an additional one unit increased in knowledge stock. The pvalue
of ln(long-term investment) is p < 0.01, which rejects the null hypothesis at the 1% level.
Ln(long-term investment) and the diversity of innovation are significantly and positively
related. If long-term investment increases by 1%, the diversity of innovation is expected
to increase by 0.000270, ceteris paribus.
The log-likelihood value is -326.
4.3.3.3 State Ownership
4.3.3.3.1 Depth of Innovation and State Ownerships
i. Tests for Assumptions of Panel Data Regression
The p-value of the LM test is p < 0.01, rejecting the null hypothesis of pooled regression.
The HS test is then applied, showing a p-value of p < 0.01, rejecting the null hypothesis of
a random effect. Therefore, a fixed effects model is applied.
After that, the tests of regression assumptions were applied.
First, the zero mean residual implied that the assumption of linearity held (Assumption 1).
Second, the p-value of the modified Wald test was p < 0.01, which suggested
heteroscedastic residuals. It then violates Assumption 2. Third, the p-value of the run test
of randomness was p < 0.01, rejecting the null hypothesis (Assumption 3). To rephrase it,
there was no serial correlation in residuals. Fourth, the p-value of the
Ramsey RESET Test was greater than 0.1, which failed to reject the null hypothesis
(Assumption 4). It meant that there was no misspecification error. Fifth, the total sample
size was large enough to say that residual distribution was asymptotically normal

(Assumption 5). Consequently, the assumption of normality held. Sixth, Appendix E
indicates no multicollinearity due to low correlations (Assumption 6).
Due to heteroscedastic and serially correlated residuals, the fixed effects model was
modified by robust standard error.
ii. Results
Table 4.19 Depth of Innovation for State Ownership
(15)
H8a
Depth of Innovation t-statistics p-values
VARIABLES Robust
Low -0.0135 -0.7800 0.4340
(0.0173)
Medium -0.0081 -0.2900 0.7740
(0.0281)
High -0.0242 -1.0300 0.3040
(0.0235)
R&D Intensity 0.1256 0.6000 0.5500
(0.2100)
Firm Size 0.0009 0.0500 0.9560
(0.0166)
Firm Age -0.0106*** -4.1800 0.0000
(0.0025)
Knowledge Stock -0.0001* -1.8700 0.0620
(0.0000)
Leverage -0.0059 -0.5600 0.5750
(0.0105)
Public A-shares -0.1043 -1.4300 0.1530
(0.0728)
Long-term Investment -0.0155*** -2.9900 0.0030
(0.0052)
Continued
Constant 1.1625*** 3.6900 0.0000
(0.3153)
Observations 4,074
Number of Firms 958
Adjusted R-squared 0.0193
FIRM FE YES
Log-likelihood 1978
Robust standard errors in parentheses
*** p<0.01, ** p<0.05, * p<0.1

The baseline is zero-level state ownership.
All p-values for three levels of state ownership are greater than 0.1 in the table above. No
significant difference in state ownership compared to non-state ownership for all three
levels of innovation specialisation, on average, all else being equal. Thus, the findings are
not consistent with hypothesis H8a.
For control variables, the p-value of firm age is p < 0.01, which rejects the null
hypothesis. There is a significantly negative relationship between firm age and the depth
of innovation. The depth of innovation is expected to decrease by 0.0106 for one
additional year increased in firm age, ceteris paribus. The p-value of knowledge stock is p
< 0.1, which rejects the null hypothesis at the 10% level. The mean depth of innovation
decreases by 0.0001 as knowledge increases by one unit, ceteris paribus. The p-value of
long-term investment is p < 0.01, which rejects the null hypothesis at the 1% level. Long-
term investment and the depth of innovation in significantly and negatively related.
Expected change in depth of innovation is -0.000155 if long-term investment increases by
1%, ceteris paribus. The p-values of other variables are all greater than 0.1, which fails to
reject the null hypothesis.
The log-likelihood value is 1978.
4.3.3.3.2 Diversity of Innovation and State Ownerships
i. Tests for Assumptions of Panel Data Regression
The p-value for the LM test was p < 0.01, rejecting the null hypothesis of pooled
regression. The HS test was then applied, showing a p-value of p < 0.01, rejecting the null
hypothesis of a random effect. Therefore, a fixed effects model was applied.
Following this, a test of the regression hypothesis was applied.
First, the zero mean residual implied that the assumption of linearity holed (Assumption
1). Second, the p-value of the modified Wald test was p < 0.01, which suggested
heteroscedastic residuals. It violated Assumption 2. Third, the p-value of the run test of
randomness was p < 0.01, rejecting the null hypothesis (Assumption 3). There was a serial

correlation in residuals. Fourth, the p-value of the Ramsey RESET Test was greater than
0.01, which failed to reject the null hypothesis at the 1% level (Assumption
4). It meant there is not a problem of misspecification. Fifth, residuals were
asymptotically normal due to a large sample size (Assumption 5). Sixth, Assumption 6
holds due to low correlations in Appendix E.
Because of heteroscedastic residuals, the fixed effects model was re-regressed by the
robust standard error.
ii. Results
Table 4.20 Diversity of Innovation for State Ownership
(16)
H8b
Diversity of Innovation t-statistics p-values
VARIABLES Robust
Low 0.0224 0.7200 0.4700
(0.0309)
Medium 0.0316 0.6200 0.5320
(0.0506)
High 0.0466 1.1600 0.2480
(0.0403)
R&D Intensity -0.1480 -0.4200 0.6750
(0.3531)
Firm Size 0.0249 0.8100 0.4160
(0.0307)
Firm Age 0.0196*** 4.2000 0.0000
(0.0047)
Knowledge Stock 0.0002** 2.4500 0.0150
(0.0001)
Continued
Leverage 0.0012 0.0700 0.9460
(0.0183)
Public A-shares 0.1866 1.4500 0.1480
(0.1287)
Long-term Investment 0.0268*** 2.9100 0.0040
(0.0092)
Constant 0.1014 0.1700 0.8630
(0.5894)
Observations 4,074
Number of Firms 958
Adjusted R-squared 0.0288

FIRM FE YES
Log-likelihood -327.7
Robust standard errors in parentheses
*** p<0.01, ** p<0.05, * p<0.1
The baseline is zero level of state ownership.
The p-values for three levels of state ownership are greater than 0.1, so null hypotheses
cannot be rejected. All three levels of state ownership show no significant difference in
R&D intensity from non-state ownership when comparing state and non-state ownership,
on average, ceteris paribus. The results are not in line with hypothesis H8b. For control
variables, the p-value of firm age is p < 0.01, which rejects the null hypothesis. There is a
significantly positive relationship between firm age and the diversity of innovation. The
expected change in the diversity of innovation is 0.0196 for one additional year increase
in firm age, ceteris paribus. The p-value of knowledge stock is p < 0.05, which rejects the
null hypothesis at the 5% level. Knowledge stock and the diversity of innovation are
positively related. Excepted change in the diversity of innovation is 0.0002 for an
additional one unit increased in knowledge stock. The pvalue of ln(long-term investment)
is p < 0.01, which rejects the null hypothesis at the 1% level. Ln(long-term investment)
and the diversity of innovation are significantly and positively related. If long-term
investment increases by 1%, the diversity of innovation is expected to increase by
0.000268, ceteris paribus.
The log-likelihood value is -327.7.
4.3.3.4 Institutional Ownership
4.3.3.4.1 Depth of Innovation and Institutional Ownerships
i. Tests for Assumptions of Panel Data Regression
A p-value of p < 0.01 for the LM test rejected the null hypothesis of pooled regression.
The HS test was then applied, showing a p-value of p < 0.01, rejecting the null hypothesis
of a random effect. Therefore, a fixed effects model was applied.
Afterwards, a test of the regression hypothesis was applied.

First, the zero mean residual implied that the assumption of linearity held (Assumption 1).
Second, the p-value of the modified Wald test was p < 0.01, which meant heteroscedastic
residuals(Assumption 2). Third, the p-value of the run test of randomness was p < 0.01,
which rejected the null hypothesis (Assumption 3). To rephrase it, there was
autocorrelation in residuals. Fourth, the p-value of the Ramsey
RESET Test was greater than 0.1, which failed to reject the null hypothesis (Assumption
4). Hence, there was no misspecification error. Fifth, the total sample size was large
enough to say that residual distribution was asymptotically normal (Assumption 5).
Finally, multicollinearity was not a concern due to relatively low correlations in Appendix
E.
Since some assumptions of panel data regression were violated, the robust standard error
modified the fixed effects model.
ii. Results
Table 4.21 Depth of Innovation for Institutional Ownership
(17)
H9a
Depth of Innovation t-statistics p-values
VARIABLES Robust
Low 0.0083 0.5400 0.5920
(0.0154)
Medium 0.0012 0.0700 0.9450
(0.0172)
High -0.0098 -0.4000 0.6860
(0.0242)
Continued
R&D Intensity 0.1211 0.5800 0.5590
(0.2073)
Firm Size -0.0010 -0.0600 0.9540
(0.0166)
Firm Age -0.0104*** -4.0700 0.0000
(0.0026)
Knowledge Stock -0.0001* -1.8500 0.0650
(0.0000)
Leverage -0.0073 -0.7100 0.4790
(0.0103)

Public A-shares -0.0849 -1.1800 0.2360
(0.0716)
Long-term Investment -0.0154*** -2.9800 0.0030
(0.0052)
Constant 1.1750*** 3.7400 0.0000
(0.3145)
Observations 4,074
Number of Firms 958
Adjusted R-squared 0.0193
FIRM FE YES
Log-likelihood 1978
Robust standard errors in parentheses
*** p<0.01, ** p<0.05, * p<0.1
The baseline is zero-level institutional ownership.
The p-values for all three levels in the table above are greater than 0.1, indicating no
significant difference between the R&D intensity of institutional ownership and
noninstitutional ownership for the three levels, on average, all else equal. The conclusions
show inconsistency with hypothesis H9a.
For control variables, the p-value of firm age is p < 0.01, which rejects the null
hypothesis. There is a significantly negative relationship between firm age and the depth
of innovation. The depth of innovation is expected to decrease by 0.0104 for one
additional year increased in firm age, ceteris paribus. The p-value of knowledge stock is p
< 0.1, which rejects the null hypothesis at the 10% level. The mean depth of innovation
decreases by 0.0001 as knowledge increases by one unit, ceteris paribus. The p-value of
long-term investment is p < 0.01, which rejects the null hypothesis at the 1% level—long-
term investment and the depth of innovation in significantly and negatively related.
Expected change in depth of innovation -0.000154, if long-term investment increases by
1%, ceteris paribus. The p-values of other variables are all greater than 0.1, which fails to
reject the null hypothesis.
The log-likelihood value is 1978.1874.

4.3.3.4.2 Diversity of Innovation and Institutional Ownerships
i. Tests for Assumptions of Panel Data Regression
LM tests showed a p-value of p < 0.01, rejecting the null hypothesis of pooled regression.
Then an HS test was applied, showing a p-value of p < 0.01, rejecting the null hypothesis
of a random effect. Thus, a fixed effects model was applied.
Subsequently, a test of the regression hypothesis was applied.
First, the zero mean residual implied that the assumption of linearity held (Assumption 1).
Second, the p-value of the modified Wald test was p < 0.01, which showed the
heteroscedastic residuals (Assumption 2). Third, the p-value of the run test of randomness
was p < 0.01, which rejected the null hypothesis (Assumption 3). There was a serial
correlation in residuals. Fourth, the p-value of the Ramsey RESET Test was greater than
0.01, which failed to reject the null hypothesis at the 1% level (Assumption 4). It meant
there was not a problem of misspecification. Fifth, residuals were asymptotically normal
due to the large sample size (Assumption 5). Sixth, Appendix E displayed correlations at a
low level, and hence there was no concern about perfect multicollinearity (Assumption 6).
The fixed effects model was then modified by the robust standard error.
ii. Results
Table 4.22 Diversity of Innovation for Institutional Ownership
(18)
H9b
Diversity of Innovation t-statistics p-values
VARIABLES Robust
Continued
Low -0.0161 -0.6000 0.5470
(0.0267)
Medium -0.0054 -0.1800 0.8590
(0.0302)
High 0.0164 0.3800 0.7030
(0.0430)
R&D Intensity -0.1527 -0.4400 0.6610
(0.3478)
Firm Size 0.0279 0.9100 0.3620
(0.0306)

Firm Age 0.0194*** 4.1100 0.0000
(0.0047)
Knowledge Stock 0.0002** 2.4500 0.0140
(0.0001)
Leverage 0.0038 0.2100 0.8320
(0.0180)
Public A-shares 0.1559 1.2300 0.2210
(0.1273)
Long-term Investment 0.0267*** 2.9200 0.0040
(0.0091)
Constant 0.0868 0.1500 0.8820
(0.5851)
Observations 4,074
Number of Firms 958
Adjusted R-squared 0.0287
FIRM FE YES
Log-likelihood -327.8
Robust standard errors in parentheses
*** p<0.01, ** p<0.05, * p<0.1
The baseline is the zero level of institutional ownership.
All three levels in the table above have p-values greater than 0.1, indicating that, other
things being equal, there is no significant difference between the R&D intensity of
institutional and non-institutional ownership at the three levels, on average. The
conclusions are shown to be inconsistent with Hypothesis H9b.
For control variables, the p-value of firm age is p < 0.01, which rejects the null
hypothesis. There is a significantly positive relationship between firm age and the
diversity of innovation. The expected change in the diversity of innovation is 0.0194 for
one additional year increase in firm age, ceteris paribus. The p-value of knowledge stock
is p < 0.05, which rejects the null hypothesis at the 5% level. Knowledge stock and the
diversity of innovation are positively related. Excepted change in the diversity of
innovation is 0.0004 for an additional one unit increased in knowledge stock. The pvalue
of ln(long-term investment) is p < 0.01, which rejects the null hypothesis at the 1% level.
Ln(long-term investment) and the diversity of innovation are significantly and positively

related. If long-term investment increases by 1%, the diversity of innovation is expected
to increase by 0.000267, ceteris paribus.
The log-likelihood value is -327.78.
4.3.3.5 Foreign Ownership
4.3.3.5.1 Depth of Innovation and Foreign Ownerships
i. Tests for Assumptions of Panel Data Regression
The p-value for the LM test was p < 0.01, rejecting the null hypothesis of pooled
regression. This was followed by the application of the HS test, which showed a p-value
of p < 0.01, rejecting the null hypothesis of a random effect. Thus, a fixed effects model
was applied.
After that, a test of the regression hypothesis was applied.
First, the zero mean residual implied that the assumption of linearity held (Assumption 1).
Second, the p-value of the modified Wald test was p < 0.01, rejecting the null hypothesis
of homoscedasticity (Assumption 2). Third, the p-value of the run test of randomness was
p < 0.01, which rejected the null hypothesis (Assumption 3). To rephrase it, there was a
serial correlation in residuals. Fourth, the p-value of the Ramsey
RESET Test was greater than 0.1, which failed to reject the null hypothesis (Assumption
4). It meant that there was no misspecification error. Fifth, the total sample size was large
enough to say that residual distribution was asymptotically normal (Assumption
5). Sixth, the assumption of no perfect multicollinearity holds since correlations in
Appendix E remain low (Assumption 6).
Due to the violation of assumptions, the robust standard error was applied to fix these
problems.
ii. Results
Table 4.23 Depth of Innovation for Foreign Ownership
(1)
H10a
Depth of Innovation
t-statistics
p-values

VARIABLES Robust
Low
-0.0145
(0.0107)
-1.3500
0.1770
Medium
0.0139
(0.0251)
0.5500 0.5800
High
-0.0179
(0.0500)
-0.3600 0.7210
R&D Intensity
0.1077
(0.2109)
0.5100 0.6100
Firm Size
-0.0015
(0.0164)
-0.0900 0.9270
Firm Age
-0.0101***
(0.0026)
-3.9200 0.0000
Knowledge Stock
-0.0001*
(0.0000)
-1.8800 0.0610
Leverage
-0.0077
(0.0104)
-0.7300 0.4630
Public A-shares
-0.1097
(0.0755)
-1.4500 0.1470
Long-term Investment
-0.0152***
(0.0051)
-2.9600 0.0030
Constant
1.1986***
(0.3122)
3.8400
0.0000
Observations
4,074
Number of Firms 958
Adjusted R-squared 0.0200
FIRM FE YES
Log-likelihood 1980
Robust standard errors in parentheses
*** p<0.01, ** p<0.05, * p<0.1
The baseline is zero-level foreign ownership. All p-values for three levels of foreign
ownership are greater than 0.1 in the table above. On average, there is no significant
difference in foreign ownership compared to non-foreign ownership for all three
innovation specialisation levels. Thus, the findings are not consistent with hypothesis
H10a.
For control variables, the p-value of firm age is p < 0.01, which rejects the null
hypothesis. There is a significantly negative relationship between firm age and the depth
of innovation. The depth of innovation is expected to decrease by 0.0101 for one
additional year increased in firm age, ceteris paribus. The p-value of knowledge stock is p

< 0.1, which rejects the null hypothesis at the 10% level. The mean depth of innovation
decreases by 0.0001, as knowledge increases by one unit, ceteris paribus.
The p-value of long-term investment is p < 0.01, which rejects the null hypothesis at the
1% level—long-term investment and the depth of innovation in significantly and
negatively related. The expected change in depth of innovation is -0.000152, if longterm
investment increases by 1%, ceteris paribus. The p-values of other variables are all greater
than 0.1, which fails to reject the null hypothesis.
The log-likelihood value is 1980.
4.3.3.5.2 Diversity of Innovation and Foreign Ownerships
i. Tests for Assumptions of Panel Data Regression
The LM test showed a p-value of p < 0.01, and the null hypothesis of pooled regression
was rejected. The HS test was then applied, showing a p-value of p < 0.01, rejecting the
null hypothesis of a random effect. Hence, a fixed effects model was applied.
This was followed by the application of a test of the regression hypothesis.
First, the zero mean residual implied that the assumption of linearity held (Assumption 1).
Second, the p-value of the modified Wald test was p < 0.01, rejecting the null hypothesis.
In other words, residuals were not constant (Assumption 2). Third, the pvalue of the run
test of randomness was p < 0.01, which rejected the null hypothesis
(Assumption 3). There was a serial correlation in residuals. Fourth, the p-value of the
Ramsey RESET Test was greater than 0.1, which failed to reject the null hypothesis at the
1% level (Assumption 4). It meant there was not a problem of misspecification.
Fifth, residuals were asymptotically normal due to the large sample size (Assumption 5).
Sixth, the pairwise correlation matrix in Appendix E indicates no perfect multicollinearity
(Assumption 6).
Since some assumptions of panel data regression were violated, the fixed effects model
was modified by the robust standard error.

ii. Results
Table 4.24 Diversity of Innovation for Foreign Ownership
(2)
H10b
Diversity of Innovation
t-statistics
p-values
VARIABLES Robust
Low
0.0287
(0.0194)
1.4800
0.1400
Medium
-0.0272
(0.0441)
-0.6200 0.5380
High
0.0024
(0.0889)
0.0300 0.9780
R&D Intensity
-0.1425
(0.3539)
-0.4000 0.6870
Firm Size
0.0279
(0.0301)
0.9300 0.3540
Firm Age
0.0187***
(0.0047)
3.9600 0.0000
Knowledge Stock
0.0002**
(0.0001)
2.4600 0.0140
Leverage
0.0048
(0.0180)
0.2700 0.7890
Public A-shares
0.2066
(0.1325)
1.5600 0.1190
Long-term Investment
0.0265***
(0.0091)
2.9200 0.0040
Constant
0.0627
(0.5789)
0.1100
0.9140
Observations 4,074
Number of Firms 958
Adjusted R-squared 0.0295
FIRM FE YES
Log-likelihood -326.2
Robust standard errors in parentheses
*** p<0.01, ** p<0.05, * p<0.1
The baseline is non-foreign ownership.
The p-values for three levels of foreign ownership are higher than 0.1, so null hypotheses
cannot be rejected. All three levels of foreign ownership show no significant difference in
R&D intensity from non-foreign ownership when comparing foreign and non-foreign
ownership, on average, all other variables are equal. The results are not in line with
hypothesis H10b.

For control variables, the p-value of firm age is p < 0.01, which rejects the null
hypothesis. There is a significantly positive relationship between firm age and the
diversity of innovation. The expected change in the diversity of innovation is 0.0187 for
one additional year increased in firm age, ceteris paribus. The p-value of knowledge stock
is p < 0.05, which rejects the null hypothesis at the 5% level. Knowledge stock and the
diversity of innovation are positively related. Excepted change in the diversity of
innovation is 0.0002 for an additional one unit increased in knowledge stock. The pvalue
of ln(long-term investment) is p < 0.01, which rejects the null hypothesis at the 1% level.
Ln(long-term investment) and the diversity of innovation are significantly and positively
related. If long-term investment increases by 1%, the diversity of innovation is expected
to increase by 0.000265, ceteris paribus.
The log-likelihood value is -326.33393
4.3.3.6 Discussion of Depth of Innovation and Diversity of Innovation
None of the firm ownership shows a significant effect on innovation specialisation or
diversification. The findings are inconsistent with Hypotheses H6a – H10b. It reveals that
innovative specialisation or diversification is not determined by firm ownership but other
factors.
One interpretation is a national demand. SOEs, as state-controlled enterprises, undertake
to accept the tasks assigned to them by the state. State-owned enterprises operate in a
wide range of markets, including those with profound barriers to private companies
(Marrelli et al., 1998). These include knowledge barriers, trade barriers, political barriers,
et cetera. Because of those barriers, SOEs' task is to promote commercial or technological
developments in those areas, such as the nuclear power industry or outer space
exploration. The decision to specify or diversify innovation in SOEs is, therefore, likely to
be determined by the government, rather than by individuals or firm management.
Second, innovation specialisation or diversification depends on the inventor. Boh et al.
(2014) divide inventors into three categories - generalists, specialists and polymaths - and

point out that different types of inventors contribute differently to organisations.
Specialists have a depth of knowledge that allows them to specialise in innovation and
obtain technological innovations that have a high impact. On the other hand, the breadth
of knowledge of the generalists and polymaths allows them to have many ideas and to
explore and innovate in different fields, obtaining patents in several areas. Third, the
direction of innovation may also be influenced by national policy. For example,
companies may prefer to conduct R&D in industries that are strongly supported by the
state as a way to access better resources.
Fourth, the thresholds used for classifying different levels of firm ownership may not
provide a good explanation of the impact of different levels of ownership on innovation
specialisation or diversification. The results might be improved by other thresholds. Fifth,
the measurement of a firm's innovation specialisation and innovation diversity is based on
the total number of patents, whereas some firms may choose not to patent their advanced
technologies in order to safeguard them, with industrial secrecy as an example (Archibugi
and Pianta, 1996; Michie, 1998; Kleinknecht et al., 2002). So using the number of patents
to measure innovation and the firm's knowledge base may be biased.
4.4 Summary of Data Analysis
The relationship between concentrated ownership and R&D intensity is positive. The
higher the level of concentrated ownership, the higher the R&D intensity. It disagrees
with the hypothesis suggested in Chapter 3 (i.e. H1). Moreover, different levels of
concentrated ownership do not behave differently in terms of innovation specialisation
and innovation diversification. Hence, the results are inconsistent with hypotheses H6a
and H6b.
Regressions from continuous and categorical insider ownership generate results
inconsistent with H2. Despite the fact that insider ownership is less developed in China,
insider ownership is more conducive to innovation performance than in firms without

insider ownership, when insider ownership is greater than 20% or less than 5%. In terms
of R&D intensity, firms with insider ownership over 20% are more advantageous than
those with a proportion below 5%.
All three levels of insider ownership are indistinguishable from non-insider ownership
in specialised or diversified innovation. That is not following the previous hypotheses
H7a and H7b.
The result with continuous state ownership is not in line with hypothesis. Nevertheless,
the result with categorical state ownership partly agrees with hypothesis H3. It reveals
that there is a positive impact of state ownership on innovation performance when the
level of state ownership is below 5%. In terms of R&D intensity, none of the other three
levels of ownership differs significantly from non-state ownership. Hence, that is at odds
with the previous hypotheses H8a and H8b.
Institutional ownership and R&D intensity are not related. Therefore, both regression
results, including continuous or categorical institutional ownership, are not in accordance
with hypothesis H4. Furthermore, The other three levels of ownership are not
significantly different from non-institutional ownership in terms of R&D intensity.
This is at odds with the previous hypotheses H9a and H9b.
Regressions with continuous and categorical foreign ownership show that foreign
ownership and R&D intensity are negatively related, which is inconsistent with
hypothesis H5.
Moreover, there is no significant difference between foreign and non-foreign ownership in
innovation specialisation or diversification. Neither of those conclusions is compatible
with the hypothesis (H10a and H10b).

Chapter 5 Conclusion
5.1 Introduction
This chapter concludes main findings (i.e. Section 6.2), and provide contributions (i.e.
Section 6.3), limitations (i.e. Section 6.4) and recommendations (i.e. Section 6.5).
5.2 Main Findings
5.2.1 Introduction of Main Findings
This sub-section comprehensively summarises how firm ownership affects firm
innovation based on the data from the Shanghai Stock Exchange between 2013 and 2019.
The sub-section 6.2.2 focuses on the R&D intensity of a firm. The sub-section

6.2.3 deals with specialised and diversified innovation for a firm.
5.2.2 Innovation Performance
5.2.2.1 Concentrated Ownership
Concentrated ownership has a significant positive effect on R&D intensity. The more
concentrated ownership, the higher the R&D intensity. It follows agency theory when
high concentrations of ownership favour innovative performance. Such positive effect
benefits from efficient monitoring or incentive schemes by diminishing the conflict
between agents' and principals' interests and regulating agents' (managers') behaviour (e.g.
Berle and Means, 1932; Jensen and Meckling, 1976; Boučková, 2015; Feldman and
Montgomery, 2015).
While Yusuf et al. (2018) point out that the prevalence of high concentrated ownership,
strong family control and mismanagement in developing country firms weakens the
foundation of agency theory, the data from the study (Appendix B) indicates that only
about one-third of the sample size contains concentrated ownership above 20% and only
less than one-fifth of the sample size contains insider ownership (including family
ownership) above 20%. Indeed, highly concentrated ownership does exist in Chinese
listed firms, but in terms of data, they only account for approximately one-third of firms.
Moreover, the proportion of family ownership involved in insider ownership is even
smaller. Thus, the high concentration of ownership and strong family control proposed by
Yusuf et al. (2018) is less common in Chinese listed firms and does not affect the
conclusions of agency theory on the concentration of ownership in terms of innovation.
Another interpretation is that a high degree of concentrated ownership assists in the
optimal allocation and integration of internal or external resources (Lacetera, 2001). Even
though a change in innovation performance is not based on different levels of
concentrated ownership, it does not mean concentrated ownership has an indifferent
innovation performance with non-concentrated ownership.

In sum, concentred ownership benefits innovation performance, and that is inconsistent
with hypothesis H1.
5.2.2.2 Insider Ownership
Insider ownership and R&D intensity are not related. Reasons include insider ownership
being less developed in China (Choi et al., 2011), managers focusing on public relations
rather than performance (Bisot and Child, 1996; Xin and Pearce, 1996; Peng, 2000), and
the imprecision of agency theory in explaining the relationship between insider ownership
and innovation (Suk et al., 2012). The data (Appendix B) supports Choi et al. (2011)’s
claim that over one-third of the companies are non-insider owned. About half of the
observed data hold less than 20% insider ownership (excluding non-insider ownership). It
highlights that underdeveloped insider ownership is still a common phenomenon among
listed firms in China.
In addition, high and low levels of insider ownership are more conducive to innovation
than non-insider ownership, and even the high-level is more predominant than the
lowlevel. It may be caused by the fact that firm owners have long-term aspirations for the
company, and employees actively seek innovation in order to achieve self-worth and
obtain stable employment.
Another reason is that the low level of shareholdings may be held by employees who have
contributed significantly to the firm. Equity incentives also motivate other employees in
the company to innovate actively, thus creating a positive correlation between a low level
of insider ownership and innovation.
On the other hand, insider ownership positively affects innovation performance due to the
efficient monitoring scheme at the high level of firm ownership.
In short, the low and high levels of insider ownership are beneficial to innovation
performance, although insider ownership is relatively uncommon among Chinese listed
companies. The thresholds for the positive impact of insider ownership on innovation

performance are the level of insider ownership below 5% and greater than 20%. Both
regression results deny hypothesis H2.
5.2.2.3 State Ownership
Unexpectedly, there is a non-relationship between state ownership and R&D intensity.
One interpretation is that listed state-owned companies may raise funds from the market
and be less reliant on state resources than unlisted state-owned companies (Zhou et al.,
2017). It may also be explained by an absence from the list of highly sophisticated
stateowned enterprises that have invested heavily in innovation owing to technological
secrecy as well as political and commercial reasons.
In terms of different levels of state ownership, it offers a different perspective with the
low-level state ownership promoting innovation, unlike the medium-level and the
highlevel. A low level of state ownership (i.e. < 5%) can exploit resource benefits without
concern about the state seizing control of the firm.
In summary, regression results partly agree with hypothesis H3. When state ownership is
less than 5%, there is a positive influence of state ownership on innovation performance.
5.2.2.4 Institutional Ownership
Institutional ownership and R&D intensity are not related, as regression analyses indicate
it in both continuous and categorical institutional ownership. While almost all listed firms
are held by institutions, only about a fifth of the total sample size has more than 20%
institutional ownership. If institutional ownership is low, institutional investors will not be
able to actively monitor the firm to alleviate managers' concerns about R&D failure
(Bushee, 1998). In addition, most institutional investors are shortterm financial investors.
If the holding period is too short, institutional investors are unable to reap the long-term
benefits of their R&D investments.
To sum up, there is no relationship between institutional ownership and innovation
performance. Results from the regressions with continuous institutional ownership and
categorical institutional ownership are not in accordance with the hypothesis H4.

5.2.2.5 Foreign Ownership
Both regression analyses of continuous and categorical foreign ownership illustrate a
negative impact of foreign ownership on R&D intensity. However, there is no association
between the low and medium levels of foreign ownership with innovation intensity, but
the high level of foreign ownership has a significant negative impact on innovation
intensity.
Owing to the costs and resources associated with research and development, subsidiaries
invested by foreign firms are more likely to acquire advanced technologies directly from
foreign parent firms than innovating locally. Furthermore, most foreign investors keep a
low level of firm shares. As a consequence, those foreign investors may not offer critical
technology or other resources for innovation activities, unlike multinational firms (Teece,
1986).
Briefly speaking, regression results of the negative relationship between foreign
ownership and innovation performance disagree with hypothesis H5.
5.2.3 Depth of Innovation and Diversity of Innovation
The empirical results suggest that firm ownership is not related to innovation
specialisation or diversification. Knowledge acquisition may be dependent on firm
ownership, for example spillover effect of foreign direct investment. The decision to
specialise or diversify innovation may, however, be more of an external one. It could be
national demand, national policy, the knowledge base of the inventor, or inappropriate
thresholds used in classifying firm ownership.
5.2.4 Control Variables
5.2.4.1 Firm Size
Firm size plays a vital role in R&D intensity. The larger the firm, the less willing it is to
innovate. It is possible that large firms have complex internal organisational structures

and heavy bureaucracy, and react slowly when the market environment changes. If the
market does not allow outsiders or makes it difficult for them to gain a foothold in the
market, then the vested interests of the large companies drive them to maintain the status
quo and to stop focusing on the actual and potential interests of their customers.
5.2.4.2 Firm Age
Firm age plays a vital role in R&D intensity, the depth of innovation and the diversity of
innovation. Nevertheless, such effects of firm age are trivial.
R&D intensity increases as firm age increases. According to the learning-by-doing model,
the older a firm is, the more business experience and foresight it has (Arrow, 1962;
Sorensen and Stuart, 2000; Chang et al., 2002).
Firm age harms the depth of innovation but benefits the diversity of innovation. The
primary goal of young firms is to survive in the market, and so that they only can R&D in
a single field with limited resources. Over time, they grow from a small firm to a large
firm with sufficient resources, capability and capacity to develop in multiple areas.
5.2.4.3 Long-term Investment
The minor and positive effect of long-term investment on R&D intensity suggests that
innovation performance increases as long-term investment increases. The long-term
investment could be an R&D investment if investing in patents, research institutions and
experimental equipment, for example.
Regardless of ownership, long-term investment has a positive effect on diversified
innovation but rather a negative effect on specialised innovation. Even if the effect is
paltry, it reiterates that firms are willing to research in different fields. As a result, it may
benefit the firm and innovation performance in the long term.
5.2.4.4 Knowledge Stock
Knowledge stock is the total number of patents firms hold. An increase in the total
number of patents may foster firms to widen the type of patents.

5.2.4.5 Industry Dummies
Full names of the industry codes are described in the Research methodology (i.e. Table
3.3). The baseline is agriculture, forestry, animal husbandry and fisheries. No matter what
the firm ownership is, firms in the following fields have a greater R&D intensity than the
baseline: (1) manufacturing industry; (2) information transmission, software and
information technology services; (3) scientific research and technical service industry; (4)
education industry; and (5) health and social work. One interpretation is that an equity-
compensation scheme is prevalent in those industries to promote innovative performance.
R&D intensity in the wholesale and retail sector are below the baseline in all five
ownerships.
5.3 Contributions
Firstly, this study presents a comprehensive analysis of the impact of firm ownership on
innovation performance in the context of One Belt and One Road, using the most recent
data available.
Secondly, firm ownership is divided into different levels, and innovation performance
differences between different groups are examined to derive thresholds of firm ownership.
Based on the above two points, the results show that concentrated ownership has a
significantly positive impact on innovation, which is different from the results of previous
studies (Wen et al., 2016). Insider ownership below 5% or above 20% has a positive
impact on innovation performance. In particular, insider ownership over 20% has a higher
impact on innovation performance than insider ownership below 5%. The outcome partly
agrees with Song et al. (2015)’s work. Furthermore, state ownership is positively
associated with innovation performance only when it is less than 5%, which is partially in
line with previous research findings (Choi et al., 2011). In addition, the results show that
institutional ownership and innovation performance are not related, which is inconsistent

with the view of Rong et al. (2017). Finally, foreign ownership is unexpectedly negatively
related to innovation performance. However, in the analysis using different levels of
foreign ownership, it is found that only firms with foreign ownership over 20% have a
negative impact on innovation performance. The result is not the same as Choi et al.
(2011)’s findings.
Thirdly, the report examines how firm ownership affects innovation specialisation and
diversification. The results indicate that firm ownership is unrelated to innovation
specialisation or diversification. Instead, innovation specialisation or diversification is
more associated with external factors.
5.4 Limitations
First, this thesis does not include the performance of listed companies on the One Belt and
One Road. It is still vague on how Belt and Road affects the relationship between firm
ownership and innovation performance.
Second, the ownership of companies used in this article is only broadly classified into five
categories - concentrated ownership, insider ownership, state ownership, institutional
ownership and foreign ownership. In fact, however, firm ownership can be subdivided
into various categories. For example, insider ownership can be subdivided into
management ownership, employee ownership and family ownership. The different types
of insider ownership also have a different impact on innovation, as reviewed in Chapter 2.
Therefore, mixing them together might have made the results unreliable to a certain
extent.
Third, due to the paucity of literature on the link between firm ownership and innovation
specialisation, hypothesis testing of the link between firm ownership and innovation
specialisation is based on the link between firm ownership and innovation diversification
in the opposite direction. It also poses some problems in proposing hypothesis tests.

Fourth, the thresholds used in the paper (i.e. 5% and 20%) are not very helpful in
examining the effects of firm ownership on innovation specialisation and innovation
diversification.
5.5 Recommendations and Future Research
First, due to the lack of information on Belt and Road among listed companies, future
research could collect such relevant information and identify more intuitively the impact
of Belt and Road on the relationship between firm ownership and innovation
performance.
Secondly, future research could provide a detailed classification of firm ownership in
order to identify precisely the association between firm ownership and innovation
performance.
Thirdly, only one set of thresholds (5% and 20%) is used in the paper. While thresholds of
5% and 20% had a significant effect on the relationship between firm ownership and
innovation performance, they did not significantly affect the relationship between firm
ownership and specialised or diversified innovation. Future research could focus on
thresholds based on 5% and 20% to see if changes in thresholds have a significant impact
on innovation specialisation or innovation diversification.
As the two thresholds of 5% and 20% have implications for insider ownership and state
ownership, future research could design mixed ownership stakes in SOEs based on these
two thresholds. This would not only benefit multiple parties but would also allow the
resources of each party to be fully utilised.

