


INTRODUCTION The issue of education is a very important
The issue of education is a very important thing and cannot be
separated from a person's life, both in the family, society and the nation. The
progress of a nation is determined by the level of educational success and the
success of education will be achieved by a nation if there is an effort to
improve the quality of education of the nation itself. Education is a conscious
effort to grow and develop the potential of human resources. The purpose of
national education according to Law No. 20 of 2003 concerning the national
education system is stated that: National education functions to develop
abilities and shape the character and civilization of a dignified nation in order
to educate the nation's life. It aims to develop the potential of students to
become human beings who believe in and fear God Almighty, have noble
character, are healthy, knowledgeable, capable, creative, independent and
responsible. And it is also written in a Hadith which reads: "Whoever goes to
seek knowledge, then he is included in the sabilillah group (one who upholds
the religion of Allah) until he returns" (HR. Tirmidhi).
The learning process that occurs in school is the most important thing
in the educational process, and as a measuring point for educational success is
the achievement of educational goals which can be seen from the learning
outcomes of students during the educational process can be observed based on
the high and low learning outcomes of students. Especially in the field of
religious education, which is becoming less and less popular day by day. In
the entire educational process in schools, learning activities are the most basic
activities. This is that the success of education depends on the learning
process that is carried out.
In the teaching and learning process in the classroom, the teacher's
task that mostly occurs in the classroom is to learn his students by providing
optimal learning conditions. Realize the duties of teachers who
1
It is required to strive for situations that can increase student attention, arouse
and maintain and encourage student activities, so one of the efforts that can be
made by a teacher to create this situation is to use more effective and creative

learning media. One of the learning methods that is considered effective and
creative is the Visme learning media.
In essence, the teaching and learning process is a communication
process between teachers and students, in practice it is not easy to transfer
knowledge, experience, and ideas (ideas) of teachers to students or from
students to other students. This activity is highly dependent on the smooth
communication interaction between teachers and students. Poor
communication has consequences for the messages given by teachers. Some
experts provide a definition of learning media.
Learning media is everything that can channel messages, can stimulate
students' thoughts, feelings, and willpower so that it can encourage the
creation of a learning process in students. With the development of the times,
the rapid emergence of technology today makes a great resolution to the
world, all work feels easy and cheap. Similarly, in education related to the
teaching and learning process (PBM) in schools, several variations of learning
media must be used to teach knowledge to students who are increasingly
advanced and sophisticated, which aims to improve learning outcomes,
learning is more interesting, and students can take longer to remember the
messages received, more deeply learning.
Visme in learning can be interpreted as a multimedia application used
in the learning process, in other words to channel messages (knowledge, skills
and attitudes) and can stimulate thoughts, feelings, attention and willingness
to learn so that the learning process is deliberately occurring, purposeful and
controlled. Media Visme is one way that can be done to explain something
abstract. In this case, a computer with multimedia support can present a
display in the form of text or video that is not monotonous and is more
interesting and more interactive. This display will make users more free to
choose, filter, and understand the knowledge they want to know.
In general, teachers only use conventional methods (lectures and
assignments), even the media used is predominantly textbooks, and white
boards so that students are lazy and late to enter class to participate in
learning, in the classroom they are also busy with their respective cellphones
and the impact of this is that students' test scores are low.
Based on observations and interviews with teachers at the Al-Qur'an
education park (TPQ) in Gunungjaya village, there is very little interest in
learning religion in children or students. Children prefer to play with mobile
media rather than reading books or the Quran. It is very difficult to teach a

social lesson, let alone a religious lesson, which is still considered by the
wider community as a wishful thinking that is useless or not learned.
Therefore, by taking advantage of technological developments through Visme
learning media that can display writing, pictures, or learning videos, students
will be more interested in learning religion.
Visme learning media can help with student boredom and can improve
students' memory and students' interest in learning. The use of technology and
multimedia is an effective and efficient way of conveying information.
Computers are an information technology that has great potential to improve
the quality of learning, especially in religious learning.
Visme learning media provides slide facilities to accommodate the
main points of conversation that will be delivered to students. With the
animation facility, a slide can be modified interestingly. Likewise, the front
picture facility, sound and effects can be used to make good slides and videos.
If this slide product is presented, then the listeners can be drawn to accept
what we are going to say.
The use of Visme learning media is expected to make learning media
that can make students more active and not bored in the teaching and learning
process, in order to achieve the expected learning goals, and to find out the
influence of the use of learning media in the teaching and learning process,
the researcher raised the title
"The Application of Visme Media to Increase Interest in Learning
Islam in Children at the Nurul Iman Al-Quran Education Park (TPQ),
Gunungjaya Village, Salem District, Brebes Regency".
B. Problem Formulation
Based on the background that has been described above, the following
problems can be identified:
1. How is the application of Visme learning media at TPQ?
2. How does child learning improve when using Visme learning media at
TPQ?
3. Is there an effect of the application of Visme learning media on increasing
children's interest in learning in TPQ?
C. Research Objectives
Based on the formulation of the problem above, the objectives of this
study are as follows:
1. Knowing the application of Visme learning media at TPQ

2. Knowing the improvement of children's learning when using Visme
learning media at TPQ
3. Knowing the effect of the application of Visme learning media on
increasing children's interest in learning at TPQ
D. Research Benefits
The benefits of research are the impact of achieving goals. By holding
this research, it is hoped that it can be beneficial both for social sciences and
for the general public. The benefits that the author wants to achieve in this
study include theoretical benefits, benefits in terms of policy and practical
benefits, which are as follows:
1. Theoretical Benefits
If this research can be accepted by teachers, principals, education
staff and other researchers, it is hoped that it can become one of the
sources of information, sources of knowledge, literature materials or
research materials in the world of education in the future and add to the
treasure of educational literature and provide an overview of learning
using Visme learning media and as a similar contribution to the
improvement of this research.
2. Practical Benefits
a. For students
With the existence of this Visme learning media, it can increase
students' interest in learning, especially in the field of religion. Visme
media makes students more active and not bored in attending lessons.
b. For teachers
For teachers, the application of Visme media in teaching makes
it very easy to convey material and attract students' interest in
learning.
c. For schools
As a study material for institutions (schools) to further increase
students' interest in learning, especially religious education in order to
produce a good learning process.
d. For researchers
For researchers, the benefits obtained in developing this
interactive media are that they can increase insight, creativity and
innovation in religious learning. This can increase the ability of

researchers as prospective educators to become professional and
religious educators.

CHAPTER II
LITERATURE REVIEW
A. Theoretical Studies
1. Definition of Media
The word learning media comes from the Latin word "medius"
which literally means "middle", intermediary or introduction. Gerlach and
Ely (1971) said that media, when understood broadly as people, materials,
or events that build conditions that enable students to acquire knowledge,
skills, or attitudes.
Definition of Media according to Purnamawati and Eldarni (2001:
4), Media is everything that can be used to channel messages from the
sender to the recipient so that it can stimulate students' thoughts, feelings,
attention and interest in such a way that the learning process occurs.
AECT (Association of Education and Communication Technology,
1977) limits the media as any form and channel used to convey messages
or information.
Also explained by Djamarah (1995: 136), Media is any tool that
can be used as a channel for messages to achieve learning goals. Media
according to the dictionary definition is a tool, means of communication,
liaison, or located between two parties. The media has various meanings,
because there are different points of view, intent, and purpose.
According to Leslie J. Briggs, media is a tool in the form of a
physical form that is usually used when conveying the content of material.
Leslie J. Briggs also said that the tools in question are tape recorders,
video recorders, images, cameras, televisions, graphics, and computers.
Punawati and Eldawi stated that media is everything that can be
used to provide messages that come from the sender of the message to the
recipient of the message, so that the recipient of the message
6
being accepted can affect students' feelings, thoughts, and attention and
create teaching and learning activities.

Sadiman stated that the media contains various things that are
usually used to send messages or information to message recipients, so that
the recipients of messages (students) their feelings, thoughts, attention, and
interest in teaching and learning activities can run effectively and
efficiently.
According to Heinich, (1993) the media is a means of
communication channels. Media comes from Latin and is a plural form of
the word "medium" which literally means "intermediary", i.e. an
intermediary between the source of the message (a source) and the
recipient of the message (a receiver). Heinich gave examples of this media
such as film, television, diagrams, printed materials, computers, and
instructors.
It can be concluded that the media functions to connect information
from one party to another by using tools such as video, images, cameras,
televisions, graphics and computers. Meanwhile, in the world of education,
the word media is called learning media. Learning media is everything that
can be used to convey messages or information in the teaching and
learning process so that it can stimulate students' attention and interest in
learning.
2. Definition of Learning
According to Syaiful Sagala (2009) Learning is a translation of the
word instruction which means self instruction (from internal) and external
instructions (from external). Learning that is external comes from teachers,
among others, called teaching. In external learning, learning principles will
by themselves become learning principles.
Meanwhile, learning according to Gagne (1977) is a set of external
events designed to support several learning processes that are internal.
Meanwhile, learning according to Sugandi et al. (2004) is a
translation of the word instruction which means self instruction (from
internal) and external instructions (from external). Learning that is
external comes from teachers, among others, called teaching. In external
learning, learning principles will by themselves become learning
principles.
Meanwhile, Hamalik (2011) stated that learning is a combination
that includes human, material, facilities, equipment, and procedures that
influence each other to achieve learning goals.
7

Aaker & Smith (2010) stated that learning is a process that changes
behavior as a result of the learning experience and a product of the
learning process.
It can be concluded that learning is the assistance provided by
educators so that the process of acquiring knowledge and knowledge,
mastering skills and habits, and forming attitudes and beliefs in students
can occur. In other words, learning is a process to help students learn well.
3. Definition of Learning Media
According to Muinnah (2019), learning media is a tool used by
educators in delivering learning materials in the classroom, so that it can
attract students' interest in learning. Meanwhile, Arsyad (2016: 3) said that
learning media is a person, material, or an event that builds conditions and
can make students able to acquire knowledge, skills or attitudes.
According to Fitriana (2018), learning media is a tool or supporting
means that can be used by a teacher in conveying information so that it is
well received.
According to Surayya (2012), it is a tool that is able to help the
process of teaching and learning media and functions to clarify the
meaning of the message or information conveyed, so that it can achieve
the planned learning goals.
Learning media according to Schramm (1977) is a messenger
technology that can be used for learning purposes.
Learning media according to Azhar (2011) is a tool in the learning
process both inside and outside the classroom, it is further explained that
learning media is a component of learning resources or physical vehicles
that contain instructional materials in the student environment that can
stimulate students to learn.
It can be concluded that learning media is a tool to facilitate the
learning process and one of the media that can be an innovative alternative
is Visme. Basically, Visme is a cloud-based presentation application that
not only offers the use of features to create attractive presentations, but
also to create infographics, data visualizations, reports, product demos, and
resumes. Unlike powerpoint, Visme offers several beautiful presentation
templates and each with its own slide layout connection.
Learning media is very important in the learning process because
teachers can convey material to students to be more meaningful. Teachers
not only deliver material in the form of words with lectures but can bring
students to understand in real terms the material presented.
8

According to Wina Sanjaya, there are several functions of the use
of learning media, namely:
a. Communicative functions
Learning media is used to facilitate communication between
the message bearer and the message recipient. So that there are no
difficulties in conveying verbal language and misperceptions in
conveying messages.
b. Motivational function
Learning media can motivate students in learning. With the
development of learning media, it not only contains artistic elements
but also makes it easier for students to learn subject matter so that it
can increase students' enthusiasm for learning.
c. Function of meaning
The use of learning media can be more meaningful, namely
learning not only increases the addition of information but can
increase students' ability to analyze and create.
d. Perception equalization function
It can equalize the perception of each student so that they have
the same view of the information conveyed
e. Function of individuality
With different student backgrounds, be it experiences, learning
styles, and student abilities, learning media can serve every need of
every individual who has different interests and learning styles.
Learning media also has other functions, namely the following:
a. Capturing a specific object or event.
It can be captured with photos, movies or recorded through
video or audio.
b. Manipulate a specific state or object
Through learning media, teachers can present abstract lesson
materials into concrete so that they are easy to understand.
c. Increase students' passion and motivation to learn
With the use of media, students' attention to learning materials
can be increased.
With the advancement of information and communication
technology, teachers in providing subject matter must follow these
advances. Teachers must be able to use learning media that is interesting,
fun and in accordance with the learning needs of students. So that students
9

can easily receive the lessons given by the teacher. According to Nasution,
the benefits of learning media as a tool in the learning process are as
follows:
a. Teaching attracts more attention to students so that it can foster
motivation to learn.
b. The teaching material will have a clearer meaning, so that students can
better understand it, and allow students to master the teaching
objectives well.
c. Learning methods vary, not solely verbal communication through the
teacher's oral words, students are not bored, and teachers do not run
out of energy.
d. Students do more learning activities, because they not only listen to
explanations from teachers, but also other activities such as observing,
doing, demonstrating and others.
Meanwhile, Azhar Arsyad gave the following conclusions from the
use of learning media in the teaching and learning process:
a. Learning media can clarify the presentation of messages and
information so as to facilitate and improve the learning process and
outcomes.
b. Learning media can increase and direct children's attention so that it
can cause learning motivation, more direct interaction between
students and the environment.
c. Learning media can overcome the limitations of senses, space and
time. Objects that are too large to display in the classroom can be
replaced with photos, slides, movies. While objects that are too small
can be presented with the help of microscopes, movies, slides, images.
Likewise, rare events that occurred in the past can be shown through
video recordings, movies, photos, slides.
d. Learning media can provide students with a common experience about
events in their environment.
Learning media has a positive effect on learning activities and
improves student learning outcomes. Learning media is everything that
makes it easier for teachers to convey messages or information in the
teaching and learning process. Learning media can also attract students'
attention and interest in learning, as well as help students understand the
material to be studied. Therefore, learning media can invite students to
actively express their curiosity and develop critical reasoning when
10

studying learning materials during the learning process, so that student
learning outcomes increase.
With the development of the increasingly advanced times, learning
media has also undergone development. Learning media that initially only
used paper in the form of images, can now use electronic devices such as
mobile phones, computers, laptops, etc. Learning media can also be done
through the use of the internet which is expected to create more interesting
media. It is very common that information in the form of science is
provided in a complete way in the world of education so that students gain
knowledge and gain an understanding of what is given.
With the existence of learning media in teaching and learning
activities, communication between teachers and students becomes more
harmonious, and students understand all information from teachers, so
that they can optimize the learning outcomes achieved. Therefore,
teachers should choose learning media that are in accordance with the
characteristics of students so that they can stimulate students' interests and
learning outcomes. The learning process carried out in this way can be
carried out as much as possible and satisfactory results can be obtained in
accordance with the goals to be achieved.
4. Definition of Visme
Visme is a web-based infographic application that allows you to
create interactive presentations, infographics and other engaging content.
There are thousands of ready-to-use templates and icons. Visme allows
users to edit everything from editing text, inserting images, and
publishing infographics.
The Visme app has many benefits. Here are some of the key
benefits of the Visme app:
a. It makes it easy to create engaging visual content quickly and easily.
b. Provides a variety of tools and features to increase creativity in the
learning process.
c. It is easy to use and has an intuitive interface.
d. Provides a wide range of ready-to-use templates.
e. Having an active community can help if there are difficulties in the
Visme application.
Here's how to use the Visme app:
a. First, create a Visme account on the official website of Visme.com
b. Second, choose an attractive template that is suitable for the learning
process or create your own design from scratch.
11
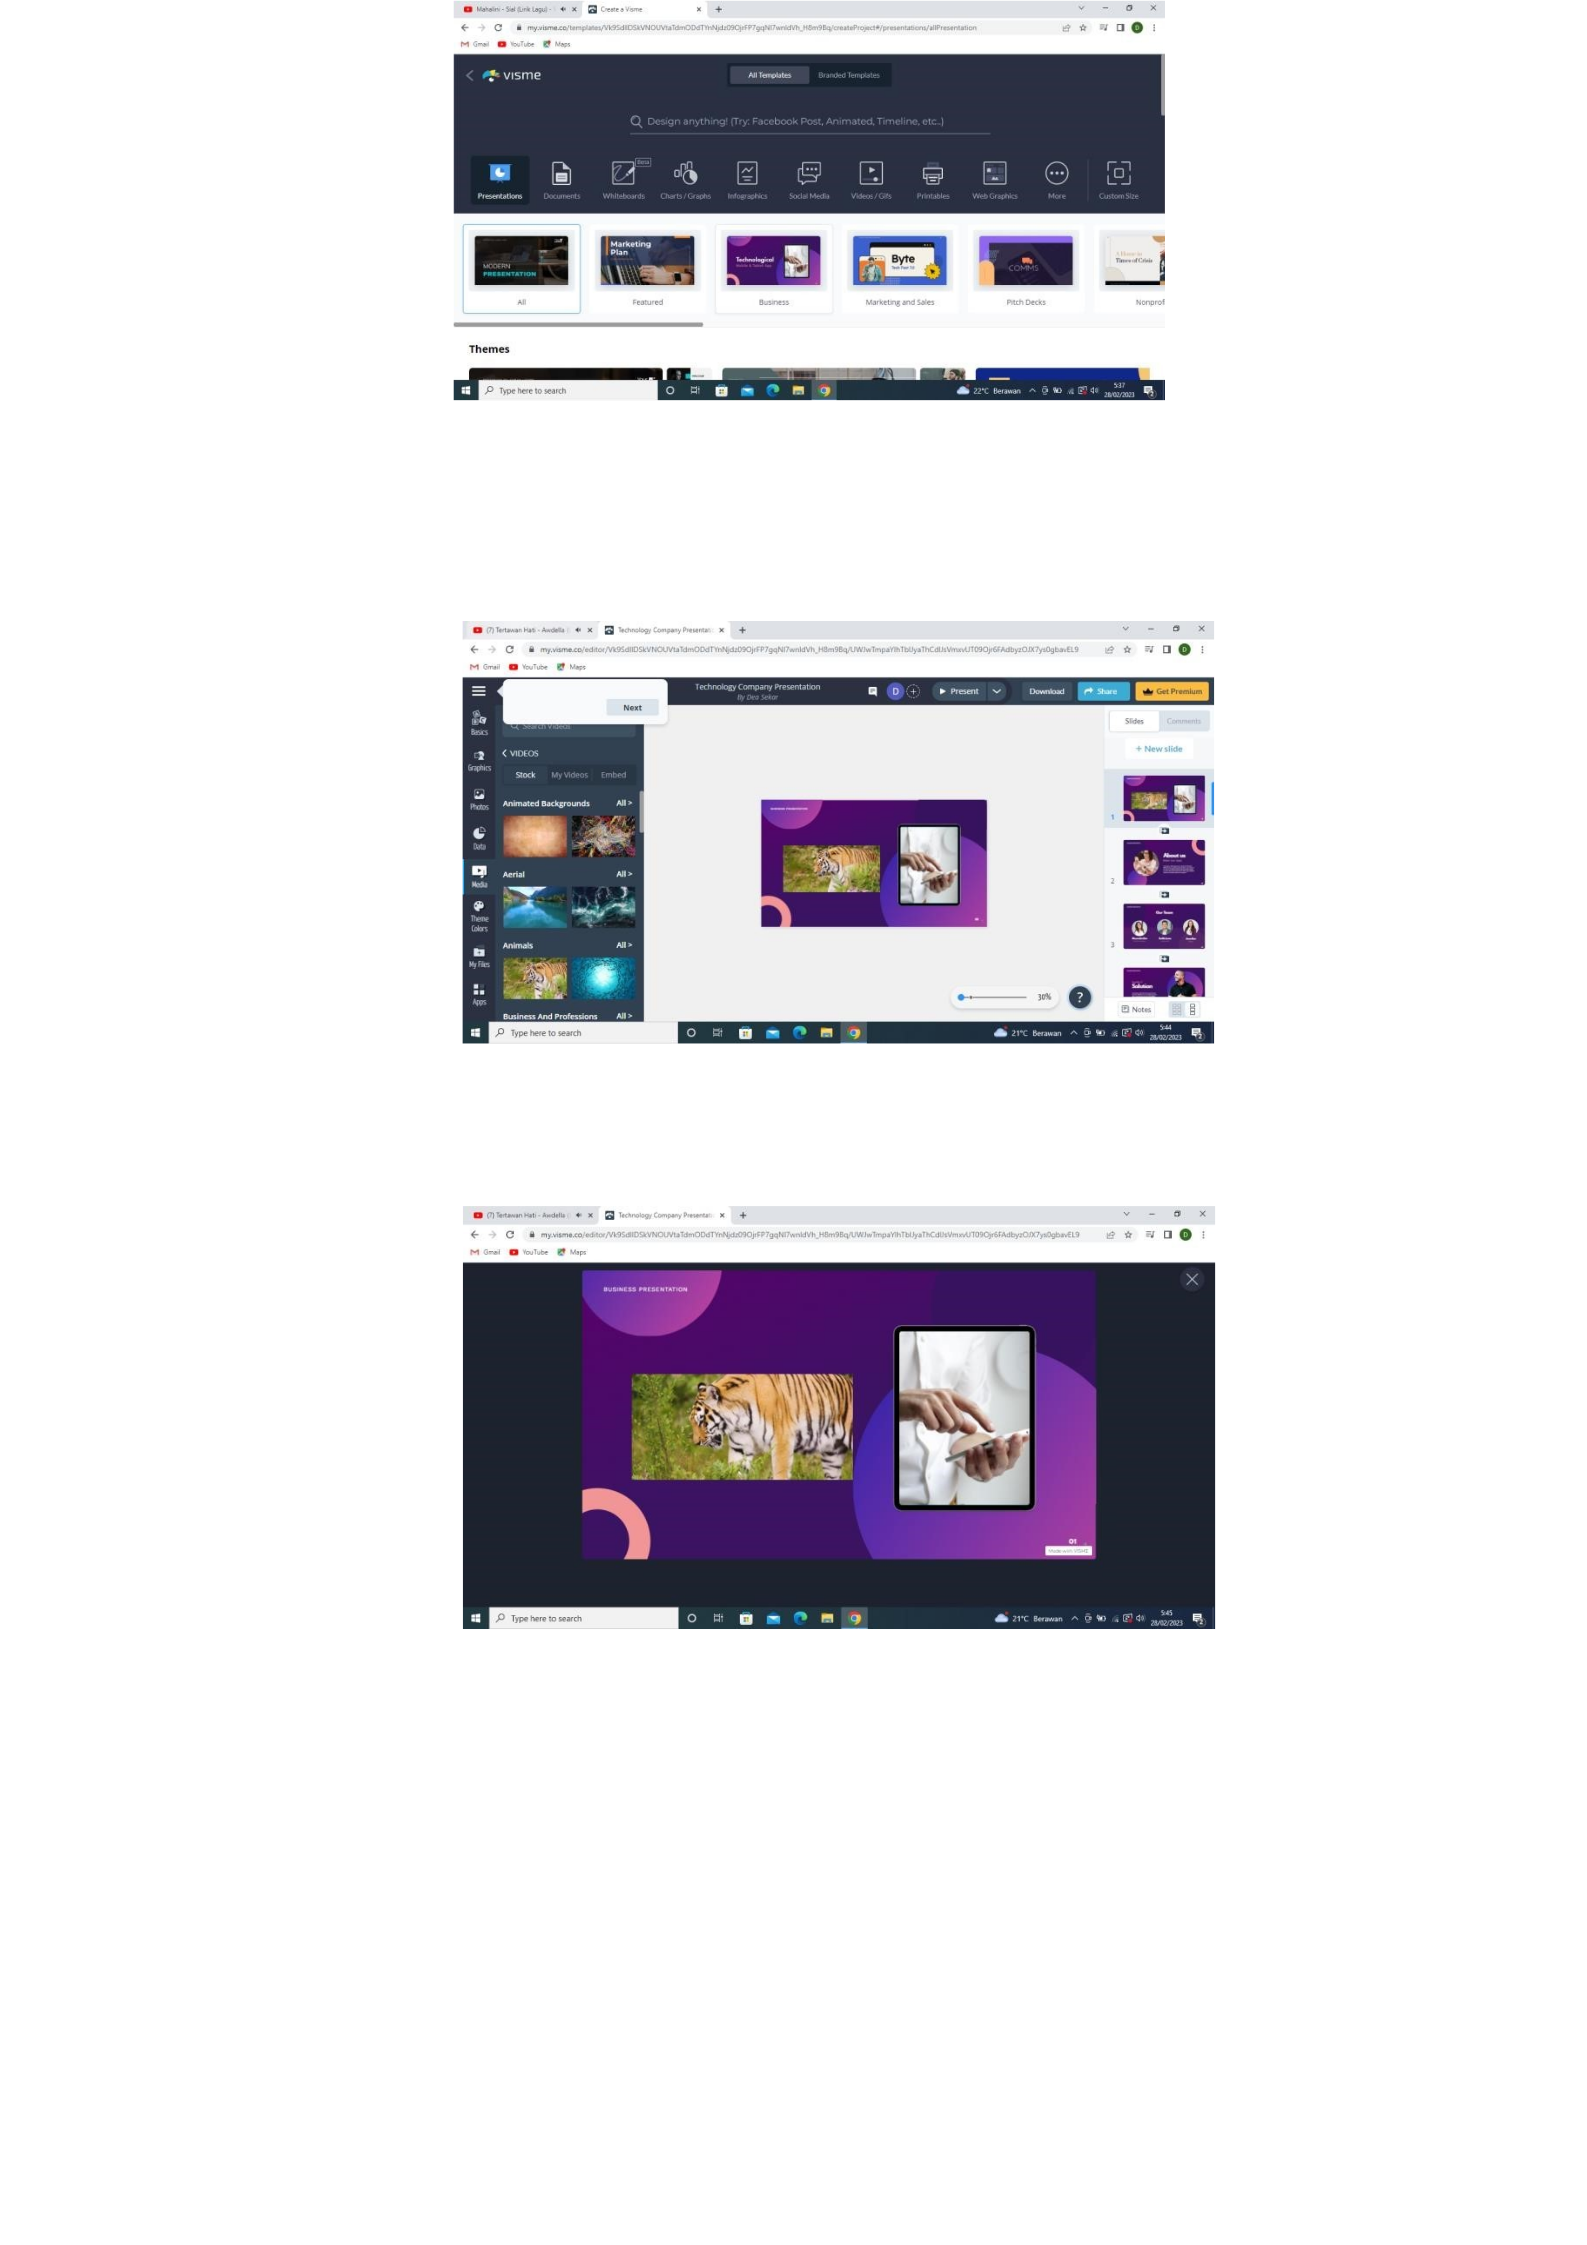
Figure 2.1 Initial Display of Visme Media
c. Third, add text, images, animations, videos, and so on to decorate the
design.
Figure 2.2 Display of Visme Media Template
d. Fourth, the design that has been made can be used.
Figure 2.3 Display of Visme Media Presentation
How teachers in the implementation of learning using the Visme
application:
a. First, teachers must have a personal computer (PC) or laptop to run
the Visme application.
b. Second, teachers must have a projector to display learning using the
Visme application.
12

c. Third, teachers must ensure that the PC or laptop is connected to the
internet to be able to run the Visme application.
d. Fourth, teachers must prepare teaching materials to be delivered to
students through the Visme application.
Like all other apps, the Visme app also has its advantages and
disadvantages. Here are some of the advantages and disadvantages of the
Visme app:
a. Excess:
1) It has a variety of tools that can help in creating visual content or
the learning process.
2) A wide variety of ready-to-use templates are available.
3) It has an intuitive and easy-to-use interface.
b. Deficiency:
1) The available features are still few.
2) Not available in Indonesian.
3) Expensive pricing for a paid plan.
The Visme app is a creative platform that allows one to create a
wide variety of visual content online. This app has a wide variety of
features and tools that help in creating visual content more easily. Despite
having some drawbacks, this app is still much better than other apps
available in the market.
5. Definition of Interest
The definition of interest according to the Great Dictionary of
Indonesian (KBBI) is a high tendency of the heart towards something.
Interest is also defined as passion or desire. Meanwhile, in English, interest
is referred to as interest, which is a feeling of enthusiasm or curiosity
about something. Quoted from Sardiman's 1990 book, he stated that
interest will be seen well if they can find the object they like on target and
directly related to the desire. Interest must also have a clear object to make
it easier for a person to behave and go to the right object.
According to Ahmad Susanto, "interest is an impulse from within a
person or a factor that causes interest or attention effectively, which causes
the choice of an object or activity that is profitable, fun and over time will
bring satisfaction in him".
According to Decroly, interest is a statement of unfulfilled
coincidence. The need arises from the urge to give satisfaction to an
instinct. Interest does not only come from one source, but children can get
13

interest from other sources. Examples are the habits that are carried out
and the education obtained, the existence of social and environmental
influences, and the instincts or desires of the child.
According to Syaiful Bahri himself, in his book entitled
"Learning Psychology" interest is an activity or activity that is sedentary
and carried out to pay attention and remember some favorite activities,
whether intentional or not.
Interest according to Crow & Crow is something that has a
relationship with the momentum that will support a person to be interested
in an object, to a certain person or activity. It can also be in the form of a
fairly effective experience that may start from the activity itself. Interest
can start from habits that are often done.
It can be concluded that the emergence of a person's interest is
caused by several important factors, namely factors that affect interest both
from the internal side which includes emotions and external factors that
surround impulses and also social.
6. Definition of Learning
S. Nasution MA defines learning as a change in behavior,
experience and practice. So learning brings a change to the individual who
learns. The change is not only about a number of experiences, knowledge,
but also forming skills, habits, attitudes, understandings, interests, and self-
adjustment. In this case, it includes all aspects of the organization or
personality of the individual who learns.
In his book entitled Psychology of Teaching, W.S. Winke revealed
that the definition of learning is a mental/psychic activity that takes place
in active interaction with the environment that results in changes in
knowledge, understanding, skills, and attitude values. The change is
relatively constant and has a trace.
In general, learning can be said to be a process of behavior change
as a result of an individual's interaction with his environment in meeting
his or her life needs. Reber (1988) in the book Educational Psychology
(2007: 72) defines learning in two senses. First, learning is a process of
acquiring knowledge and second, learning is a relatively lasting change in
the ability to react as a result of strengthened practice.
Kimble (1961: 31) defines learning as a relatively permanent
change in behavioral potential that occurs as a result of reinforced practice
. Kimble (1961: 33) delves deeper into learning, namely:
14

a. Learning is measured based on changes in behavior, in other words the
results of learning must always be translated into observable behaviors
or actions. So that after undergoing the learning process, learners will
be able to do something they could not do before learning.
b. These behavioral changes are relatively permanent, meaning they are
only temporary and not permanent.
c. The change in behavior acts differently, and this potential to act may
not translate into direct behavioral form.
d. Behavior changes come from experience or practice (practice).
e. Experience or practice must be strengthened, meaning that only the
responses that cause reinforcement will be learned. In reinforcement,
there are terms about reward and reinforcement which are often
considered to be the same thing. However, some scholars reject the
union of the two terms, including Skinner and Pavlov.
In the book "Children and Their Development", Sapartinah Pakasi
said her opinions include: 1) Learning is a communication between
children and their environment; 2) Learning means experiencing; 3)
Learning means doing; 4) Learning means a purposeful activity; 5)
Learning requires motivation; 6) Learning requires readiness on the part
of the child, 7) Learning is thinking and using thinking; and 8) Learning is
integrative."
According to Sardiman (2011: 26-28), in general there are three learning
objectives, namely:
a. To Acquire Knowledge
The results of learning activities can be characterized by an
increase in a person's thinking ability So, in addition to having new
knowledge, the learning process will also make a person's thinking
ability better.
In this case, knowledge will improve a person's thinking ability,
and vice versa the ability to think will develop through the knowledge
learned. In other words, knowledge and thinking ability are
inseparable.
b. Instilling Concepts and Skills
The skills that each individual possesses are through the
learning process. Instilling concepts requires skills, both physical and
spiritual skills. In this case, physical skills are an individual's ability in
observable appearance and movement. These skills are related to
technical matters or repetition. Meanwhile, spiritual skills tend to be
15

more complex, because they are abstract. These skills are related to
appreciation, way of thinking, and creativity in solving problems or
creating a concept.
c. Forming Attitudes
Learning activities can also shape a person's attitude. In this
case, the formation of students' mental attitudes will be very related to
the cultivation of values so as to foster awareness in them. In the
process of cultivating students' mental, behavioral, and personal
attitudes, a teacher must take a wise and careful approach. Teachers
must be able to be an example for students and have the ability to
motivate and direct thinking
The learning process can be recognized through several of its
characteristics. Referring to the definition of learning above, the following
are some things that describe the characteristics of learning:
a. There are behavioral changes (cognitive, affective, psychomotor, and
mixed) both observable and non-directly observable.
b. Changes in the behavior of learning outcomes will generally be
permanent or permanent.
c. The learning process generally takes a short time where the result is
individual behavior.
d. Some behavioral changes that are not included in learning are due to
hypnosis, growth processes, maturity, supernatural things, miracles,
diseases, physical damage.
e. The learning process can occur in social interaction in a community
environment where a person's behavior can change due to his
environment.
According to Slameto, the characteristics of behavior change as a
result of the learning process are:
a. Change occurs consciously
b. It is sedentary or continuous, and functional
c. Positive and active
d. Have a purpose and be directed
e. Covers all aspects of individual behavior
There are at least eight types of learning carried out by humans.
Some of the types of learning are as follows:
16

a. Rational learning, which is the learning process using the ability to
think in accordance with common sense (logical and rational) to solve
problems.
b. Abstract learning, which is the process of learning to use various ways
of thinking abstractly to solve unreal problems.
c. Learning skills, which is the learning process of using motor skills
with muscles and nerves to master certain physical skills.
d. Social learning, which is the process of learning to understand various
problems and how to solve these problems. For example, family
problems, friendships, organizations, and others related to society.
e. Learning habits, which is the process of forming or improving habits
in a better direction so that individuals have more positive attitudes
and habits according to needs (contextual).
f. Learning problem-solving, which is learning to think systematically,
orderly, and meticulously or using various scientific methods in
solving a problem.
g. Learning appreciation, which is learning the ability to consider the
meaning or value of an object so that individuals can appreciate
various specific objects.
h. Knowledge learning, which is the process of learning various new
knowledge in a planned manner to master subject matter through
experimental and investigative activities.
7. Definition of Learning Interest
Nasution (2008: 46) that this study diligence is related to attitude
and interest in lessons. If a lesson does not interest a person for some
reason, then he immediately sets him aside if he finds difficulties.
Conversely, if a task is interesting because it gives encouraging results, it
tends to devote more time to that task.
According to Slameto (2003: 57), interest has a great influence on
learning. Therefore, interest can be developed through learning, because
through learning one can analyze information about various characteristics
of life objects including information about education, positions, and about
various types of jobs. Through learning, a person will acquire abilities in
various things, such as the ability to speak, count, write, draw, and so on
that are useful to support their lives. The ability he has will encourage a
person to have an interest in something. The tendency to have better
17

abilities in one particular field will have an impact on interest in something
related to that ability.
According to Bernard (Sardiman. 2012: 76) interest arises not
suddenly/spontaneously but arises from participation, experience, habits
during study or work. So it is clear that interest will always be related to
needs or desires, therefore the important thing is how to create certain
conditions so that students always need and want to continue learning.
B. Previous Research
First, the effectiveness of the Team Game Tournament learning method
(TGT) with visme media to increase motivation and learning outcomes
Al-Qur'an and Hadith for students of grade III A MI Nurul Huda Bengkulu
compiled by Abdullah Agam, a student of the Bengkulu State Institute of
Religion 2021.
This study aims to determine the effectiveness of the application of
the Teams Game Tournament (TGT) type cooperative learning model on ICT
Guidance learning outcomes at UPT SMP Negeri 2 Painan. The type of
research used is experimental research. This study uses numerical research
procedures and uses statistical analysis and uses quantitative methods.
Second, the use of internet-based learning media by teachers of
Physical Education, Sports and Health in elementary schools in the city of
Yogyakarta school year compiled by Nur Lestianingrum Megarani
2018/2019.
This study aims to determine the Utilization of Internet-Based
Learning Media by Physical Education, Sports and Health Teachers of
Elementary Schools for the 2018/2019 Academic Year throughout Yogyakarta
City.
This research is a quantitative descriptive research. The method used
is the survey method. The instrument used was in the form of a questionnaire.
The population in this study is all teachers of physical education, sports and
health in elementary schools for the 2018/2019 school year in Yogyakarta
City with a validity value of 0.361 and a reliability value of 0.941. The
population in this study is 225 teachers. The sample used was all teachers of
Physical Education, Sports and Health which amounted to 225 teachers, but
in filling out the questionnaire that returned only 199 questionnaires. The
analysis technique used is descriptive by pouring frequency in the form of
percentages.
18

Third, according to Yan Guspriadi, and Neviyarni Suhaili (2021) The
implementation of information services with blended learning methods and
Visme presentation tools to improve students' understanding of digital literacy.
This research is quantitative using the quasi experiment method with
the non-equivalent control group approach. With a population of 324
respondents who are students of class XII IPA SMAN 02 Padang, using
purposive sampling, the selection of samples from this study is based on
several categories, (1) Active users of digital devices, (2) Lack of
understanding of how to use digital media effectively, (3) Need to improve
digital literacy, so that XII Science 6 was obtained as an experimental group,
and XII IPA 4 as a control group with a total of 72 respondents. The
instrument used in this study is a questionnaire on students' digital literacy
comprehension. The data was analyzed using the U Mann Whitney 2
Independent Sample Test.
The pretest results obtained in the experimental group and the control
group in the study showed the level of digital literacy understanding of
students who were at the stage of understanding digital literacy well, with an
average number of intervals of 153.4 in the experimental group, and an
average number of intervals in the control group of 153.6. Class XII MIPA 6
as the experimental group and class XII MIPA 4 as the control group, these
two classes were determined as research samples after passing the pretest by
distributing students' digital literacy comprehension instruments.
Understanding digital literacy is certainly a basic need that must be
met at this time, especially in the field of education, this is clarified by the
implementation of a learning system that is different from usual. There are
many factors that are the reasons why digital literacy is needed, including the
penetration of information and communication technology, data
commercialization, information development flows, and opportunities for
community empowerment in the digital world.
Fourth, according to R.A. Sholikhakh, Rismono, and S.B. Waliya, the
development of learning tools based on constructivism in class viii interactive
CD packaging, geometry and measurement materials.
The type of research is research on the development of mathematics
learning tools using mathematics learning with construction reference Visme
in interactive CD packaging. The devices developed include RPP, LKS, LTS,
and interactive CDs. The research instruments consisted of an observation
sheet on the implementation of learning, an observation sheet on student
activities, a questionnaire on student response, a questionnaire on teacher
19

response, an observation sheet on process skills and a validation sheet not
developed.
The development of learning tools for geometry and constructionism-
based measurement materials in interactive CD packaging includes several
stages, namely: the initial investigation stage, the design stage, the
realization/construction stage, the testing, evaluation, and revision stage. In
the testing, evaluation, and revision stages, the results of the assessment and
revision of learning tools were obtained as follows: a. RPP Validation
The RPP used was declared valid according to 4 expert validators.
This is based on the calculation of the average validation value for prism
surface area, prism volume, limas surface area and limas volume of 4.66,
4.68, 4.61, and 4.64 respectively.
b. Validation of LKS revision.
After the LKS is revised, then the LKS is revised. After the LKS is
revised, it is then given back to the validator. The results of the third (last)
validation have been obtained with valid LKS according to experts. The
average value of LKS validation for prism surface area matter, vo for
prism surface area matter, prism volume, limas surface area and limas
volume were 4.74, 4.69, 4.82, and 4.82 respectively.
c. LTS validation
After the LTS is revised, it is then given back to the validator. The
results of the third (last) validation have been obtained with a valid LTS
according to experts. The average LTS validation values for prism surface
area, prism volume, limas surface area and limas volume were 4.72, 4.64,
4.60, and 4.64, respectively.
d. Interactive CD validation
Once the interactive CD is revised, it is further awarded to the
validator. The results of the third (last) validation have been obtained an
interactive CD that is valid according to experts, because the average
expert validation score has been obtained 4.29 which means it is very
valid.
Fifth, according to Aisyah Anggraeni, the urgency of applying a
constructivism approach to elementary school PKn learning to increase
students' interest in learning. The method used for this paper is qualitative
descriptive and literature study. In essence, qualitative descriptive research is
a method of researching the status of a group of people, an object with the
20

aim of making a systematic, factual and accurate description, description or
painting of the facts being investigated. This qualitative descriptive research
aims to describe what is happening today. This means that this study
describes, records, analyzes and interprets the conditions that are currently
occurring. In other words, qualitative descriptive research aims to obtain
information on existing circumstances. While the literature method is a data
collection method that is carried out by taking the necessary data from related
literature.
From the five previous studies, there are differences with this study.
Here are the differences from previous research:
a. The difference with the first research is from the learning method and
learning motivation, which in this study there is no learning method and
only increasing learning interest.
b. The difference with the second study is from the media used, if the
previous study used internet media only, but if this study used Visme
media.
c. The difference with the third study is from the method and application, if
the previous study used a different method from this study which did not
use the method and in the application was also different when the
previous research was applied in high school where the majority of
children were familiar with the media, but this research was applied in
TPQ where the majority of children did not know much about the media.
d. The difference with the fourth study is from the media used and the
device used, if in the previous study the media and devices used CD
Rom, this study already used a computer device or laptop.
e. The difference with the fifth research is the purpose of using the Visme
media itself.
21
Media Visme
D. Research Hypothesis
A hypothesis is a provisional answer to the formulation of a research
problem, where the researcher's formulation has been stated in the form of a
question sentence (Sugiyono, 2013: 64).
Based on the background, problems and objectives of the research that
have been described above, the following hypotheses can be formulated:
H1 : The application of learning media using Visme media can increase
students' interest in learning, especially in the field of religion at TPQ
Nurul Iman.
H0 : The application of learning media using Visme media cannot increase
students' interest in learning, especially in the field of religion at TPQ
Nurul Iman.
22
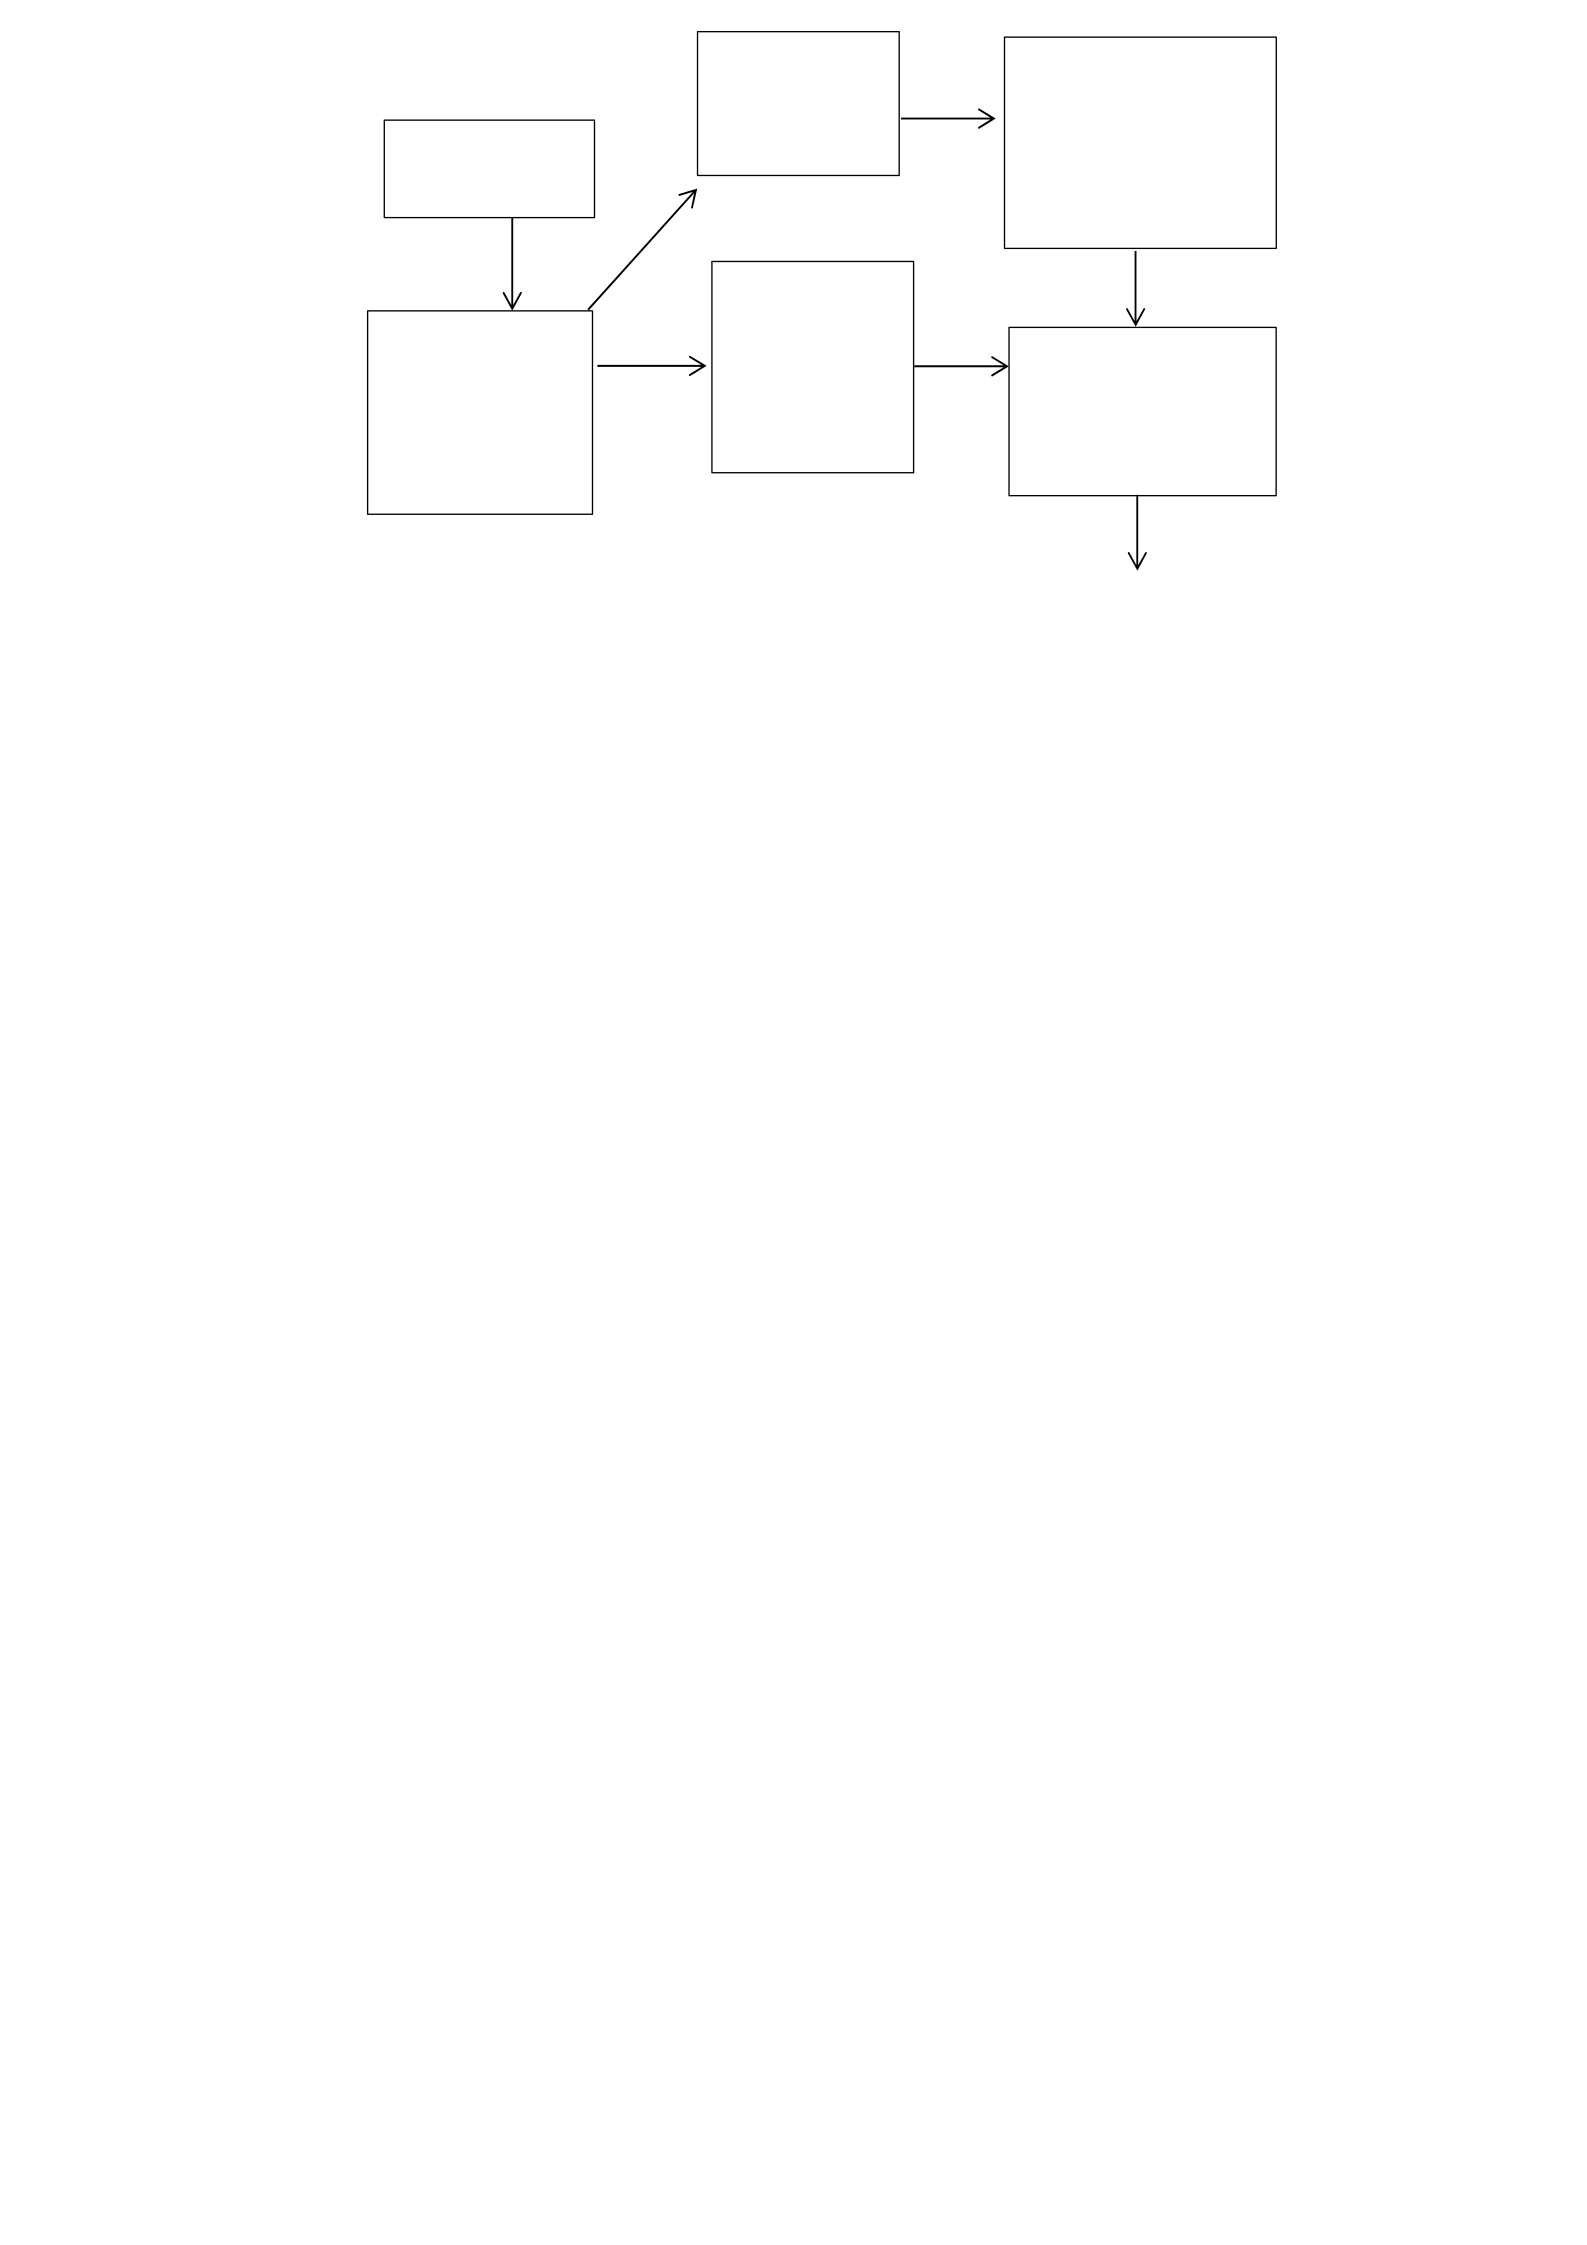
C. Berp Frame Thin
k
Analysis
Problems
Limitations
Utilization
media
Learning
Online
Introduction
media
Learning
Application
Visme
as
media
Learning
Preparation
Design media
Learning
use
media Visme
Media application
Learning
use
media Visme
Learning outcomes
use

CHAPTER III
RESEARCH METHODOLOGY
A. Research Methods
This study is a quasi-experimental research, using quantitative data
analysis. Sugiyono (2021) said that Research Methods are a scientific way to
obtain data with specific purposes and uses. Research Methods are also
theoretical analysis of a method or method.
According to Sugiyono, (2021) quantitative research is defined as a
research method based on the philosophy of positivism, used to research on a
specific population or sample, data collection using research instruments,
quantitative/statistical data analysis, with the aim of testing hypotheses that
have been determined.
B. Research Design
This research is a quantitative research. Quantitative research methods
can be interpreted as research methods based on the philosophy of positivism,
used to research certain populations or samples, data collection using research
instruments, quantitative/statistical data analysis, with the aim of testing
established hypotheses. (Sugiyono, 17:8).
The type of method used in this study is a pre-experimental research
using the "One Group Pretest-Posttest" design.
Design". According to (Sugiyono, 17:74) in this design there are two groups
that are randomly selected, then given a pretest to find out the initial state,
whether there is a difference between the experimental group and the control
group. Pretest research is given to groups that will be treated with learning
methods using Visme media, while posttest is used to find out the results after
the use of the learning method using Visme learning media as an experimental
group and compare the results of the pretest with the posttest.
28
This design can be described as follows:
Table 3. 1
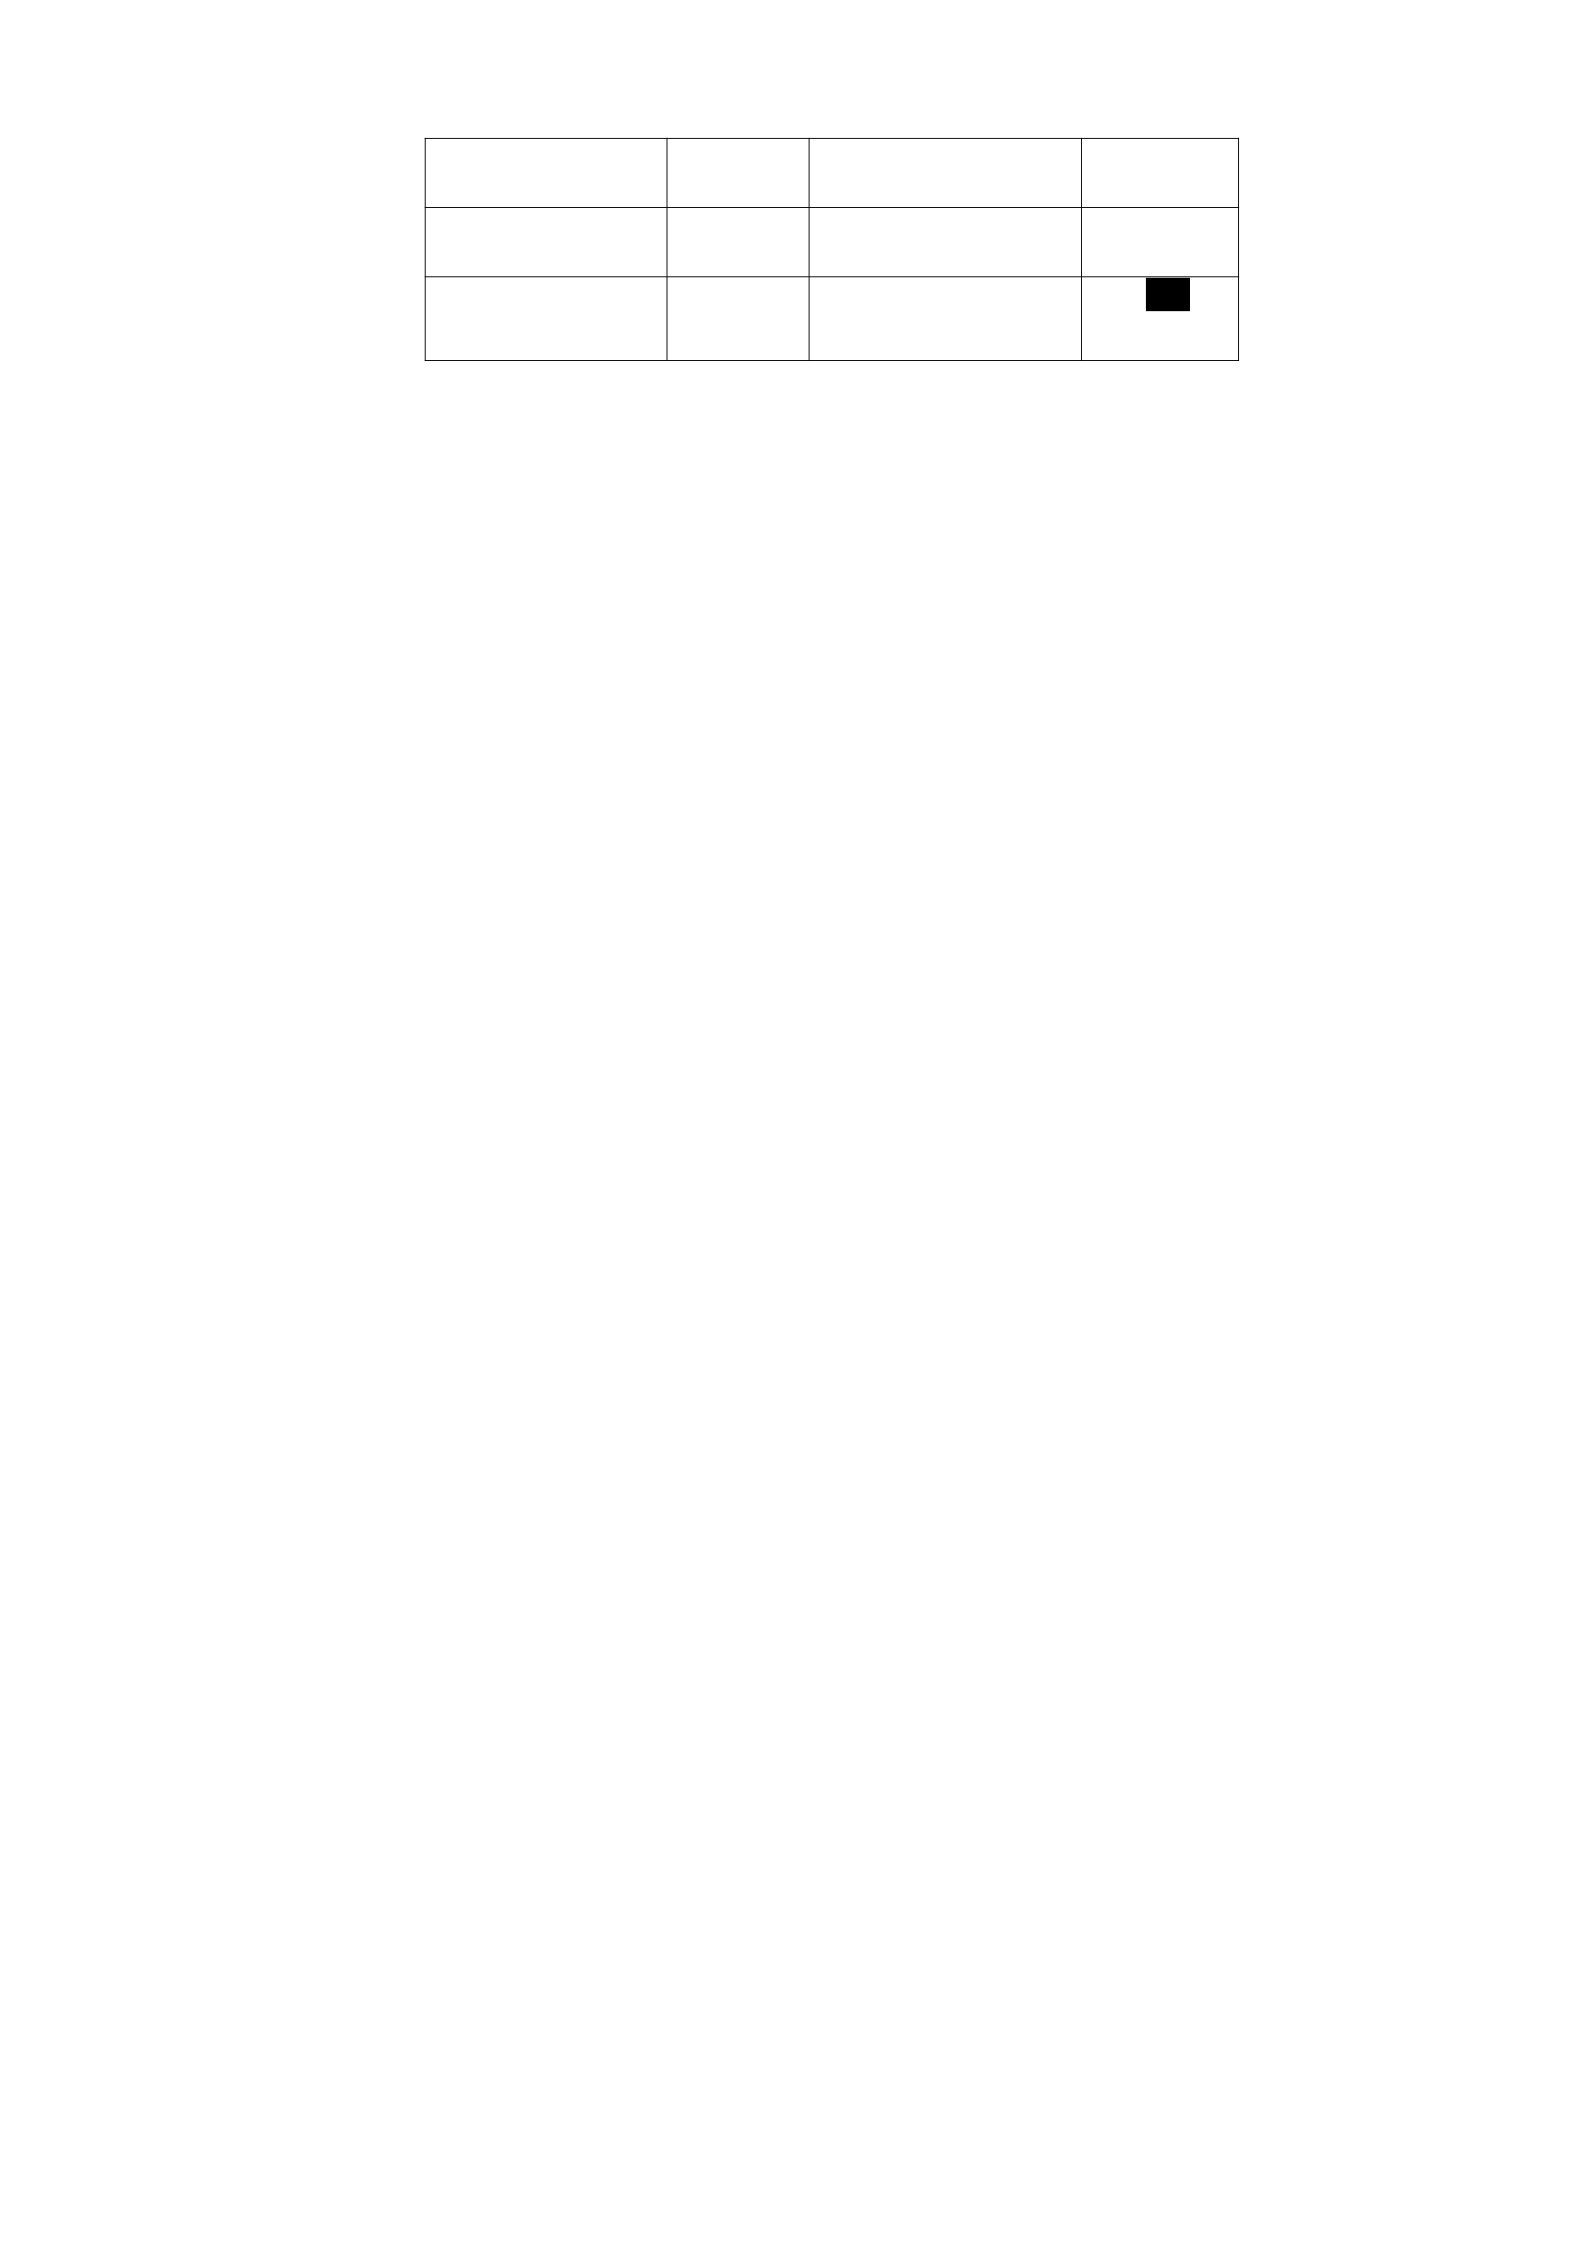
Desain One-Group Pretest-Posttest Design
Group Pretest Treatment Posttest
Experiment O1 TE O2
Control O11 KINDERGAR
TEN
Information:
O1 : Initial test in the experimental group
O11 : Initial test in the control group
O2 : Final test in the experimental group
O21 : Final test in the control group
TE : Treatment using Visme media
Kindergarten : Treatment not using Visme media
This design contains two groups, namely the experimental group and
the control group. This experimental group is a group whose learning uses
Visme media, while the control group is a group whose learning method does
not use Visme media.
Before the treatment, the two groups were given a pretest which was
followed by giving treatment to the experimental group using Visme media
and the control group did not use Visme media, namely by questionnaire or
questionnaire method. Then the two classes were given a posttest, the results
of which were then compared with the pretest scores, so that a gain was
obtained, namely the difference between the pretest and posttest scores.
C. Population and Research Sample
Population is a generalization area consisting of: objects/subjects that
have certain qualities and characteristics that are determined by the researcher
to be studied and then drawn conclusions. The population in this study is 30
students of TPQ Nurul Iman Gunungjaya. And the sample in this study is 20
students who will be divided into two groups, namely the experimental group
and the control group. The experimental group will be tested with learning
using Visme media, and the control group will be tested by learning without
Visme media. The sampling technique used is purposive sampling. Purposive
sampling is a technique for determining samples with certain considerations.
(Sugiyono, 2017).
24

D. Data Collection Techniques and Research Instruments 1. Data Collection
Techniques
The techniques carried out in data collection in this study are
using interview, observation and questionnaire techniques.
a. Interview
An interview is a conversation with a specific intent. The
conversation is carried out by two parties, namely the interviewer
who asks the question and the interviewee who gives the answer or
question (Lexy Moleong, 2005: 186).
The interview technique used in this study is an in-depth
interview. An in-depth interview is a way of collecting data or
information by directly meeting with an informant, with the intention
of getting a complete picture of the topic being researched. The
interviews in this study were conducted to obtain data and
information about students' learning interests with learning that does
not use media elements.
b. Observation
Observation is a process of observing and recording
systematically, logically, objectively, and rationally various
phenomena to achieve certain goals. Observation is carried out in a
non-systematic manner and does not use observation instruments,
observation is carried out by directly looking at the data of the
teacher's daily learning implementation record to analyze the
teaching system used by the teacher.
This method was used by the researcher to obtain data
through direct observation of the implementation of learning using
Visme media at TPQ Nurul Iman, Gunungjaya Village.
c. Questionnaire
A questionnaire or questionnaire is a tool to collect and record
data or information carried out by giving a set of questions to
respondents, namely teachers and students. The questionnaire
technique is carried out using written media where every question
answered by teachers and students is immediately recorded.
2. Research Instruments
The research instrument used in this study is in the form of a
questionnaire or questionnaire made by the researcher himself. Sugiyono
25

(2019) states that "A research instrument is a data collection tool used to
measure observed natural and social phenomena". Thus, the use of
research instruments is to find complete information about a problem,
natural or social phenomenon. The instrument used in this study is
intended to produce accurate data, namely by using the Likert scale.
Sugiyono (2019) states that "The Likert Scale is used to measure
an attitude, opinion and perception of a person or a group of people about
a social phenomenon". In this study, the researcher used a type of
questionnaire instrument with the following scores:
a. SS : Strongly agree to be given
a score of 5
b. S : Agree to be given a score
of 4
c. RG : Hesitant to be given a
score of 3
d. TS : Disagree is given a score
of 2
e. STS: Strongly disagree is given a score of 1
Table 3. 2
X Variable Questionnaire Research Instrument Grid
Variable Indicators Grain
Question
Media
Learning
Visme (X)
a. Starting learning with interesting
activities
b. Understanding the history of the Prophet
Muhammad (saw).
c. Heterogeneous group division (mixture
between male and female students)
d. Discussing the history of the Prophet
Muhammad (saw).
e. Rethinking what has been discussed
f. Making a summary of the history of the
Prophet Muhammad (saw).
g. Using the knowledge from the results of
group discussions, understanding the
history of the Prophet Muhammad (saw).
1
2
3
4
5
6
7
8
9
10
Table 3. 3
Variable Y Questionnaire Research Instrument Grid
26

Variable Indicators Grain
Question
Interest
Learn
Student (Y)
a. Students will have more interest in
learning by using Visme learning media
which is more interesting and will be
easy to understand for students.
1, 2, 3, 4
b. Students will get information related to the
lesson more clearly.
5, 6, 7, 8
c. Students are given a pleasant learning
atmosphere
9, 10
E. Data Analysis Techniques
The data analysis and processing techniques used in this study use the
IBM SPSS Statistics 26 for Windows software program. The data analysis
techniques used in this study are as follows:
1. Test Test Instrument
The creation of question items is carried out by the researcher
based on the planning that has been made, namely the subject matter and
the questions to be used. To maintain the possibility that the test
questions are inaccurate or damaged, the test of the question items used
in the form of a description is prepared with reference to students'
learning interests in learning Islam.
Before the Islamic Religion lesson test is used in research, the
questions are consulted first with the supervisor. In addition, to find out
the quality of the questions, the researcher conducted a test of the
instrument in a class that was not used as an experiment so that if a
defect was found in the test instrument, improvements would be made.
The analysis used in the testing of the test instrument includes:
validity test, reliability test, difficulty level test and discriminating
power test described in (Sugiyono, 2017).
a. Question Validity Test
The Validity Test is used to test whether the instrument can be
used to measure what to measure to find out the item of the
27
description question is used the product moment correlation formula,
the formula is as follows:
Information:
rxy = Correlation index number "r" product moment
N = Number of cases
∑ xy = Sum of the result of multiplication between the score X and
the score Y
∑ x = Sum of all X scores
∑ y = Sum of all Y scores
The results of the calculation are interpreted with the
following interpretation:
Table 3.4
Criteria for the Correlation Coefficient of Instrument Validity
Correlation Coefficient Correlation
0.90 ≤ RXY ≤ 1.0 Very High
Tall
Keep
0.20 ≤ RXY ≤ 0.40 Low
RXY ≤ 0.20 Very Low
b. Reliability Test
The reliability test is used to find out whether the test
question has high persistence or reliability or not. In general, a
formula called the Alpha Formula is used. The formula is as follows:
Information:
R11 = test reliability coefficient
n = number of items used in the test
1 = constant number
∑ st2 = number of score variants for each item
st2 = total variant
The results of the calculation are interpreted with the
following interpretation:
28

Table 3.5 Reliability Criteria
Correlation Coefficient Correlation
0.90 ≤ RXY ≤ 1.0 Very High
0.70 ≤ RXY ≤ 0.90 Tall
0.40 ≤ rxy ≤ 0.70 Keep
0.20 ≤ RXY ≤ 0.40 Low
RXY ≤ 0.20 Very Low
c. Test the Difficulty Level of Questions
The difficulty level of the question is the opportunity to
answer the question correctly at a certain level of ability which is
usually expressed in the form of an index. To test the level of
difficulty, it is calculated by the formula:
The criteria for difficulty level are as follows:
Table 3.6
Difficulty Level Criteria
Difficulty Level Criterion
0.00 < P ≤ 0.30 Difficult
0.30 < P ≤ 0.70 Keep
0.70 < P ≤ 1.00 Easy
d. Problem Differentiation
The ability to differentiate a question is the ability of a
question item to distinguish between students who have mastered the
material being tested and students who have not mastered the
material being tested.
The formula for the discriminating power of the question is:
Information:
DP = Question differentiation
K A = Upper group
K B = Lower group
The criteria for differentiation are as follows:
29

Table 3.7
Criteria for Differentiation
Differentiation Criterion
0.70 < DP ≤ 1.0 Excellent
0.40 < DP ≤ 0.70 Good
0.20 < DP ≤ 0.40 Enough
0.00 < DP ≤ 0.20 Bad
DP ≤ 0.00 Very Bad
2. Analysis of Students' Initial Ability in Islamic Religious Lessons (Test
Early)
The initial stage of data analysis uses pretest scores. This analysis
aims to prove and find out the average pretest score between Islamic
Religion lessons of TPQ Nurul Iman students.
a. Normality Test
The data normality test is used to find out whether the data
obtained is normally distributed or not. The normality test is carried
out with the Chi Squared test, the hypothesis used for the normality
test is:
H0 = Normally distributed data H1
= Normally distributed data
Hypothesis
testing:
Information:
x2 = Sample normality
Oi = Observation frequency
Ei = Expected frequency
K = Number of interval classes
In the calculation, the Chi squared is compared to the Chi
squared of the table with a significance level of 5% and then drawn
conclusion, that is, if X2 counts ≤ X2table , then the data can be
declared to be normally distributed
b. Homogeneity Test
30

The homogeneity test was carried out to find out that the
samples to be taken in this study started from the same or
homogeneous conditions. The homogeneity test was carried out by
providing whether the two samples had the same variance or not.
The hypotheses tested were:
(homogeneous variance)
(non-homogeneous variance)
Information:
= Variation of pretest values
= Variation of pretest values
The formula uses the F test, as follows:
Test criteria:
If Fcal > Ftabel = Non-homogeneous Variance
If Fcalculate < Ftabel = Homogeneous Variance
c. Two-Mean Similarity Test (t-test)
The mean similarity test in the early stages is used to test
whether there is an average similarity between the pretest group and
the posttest group. Test the average similarity of the initial stage
using the t-test. If the average of the two groups is not different, it
means that the group has the same conditions.
The hypothesis tested is:
H0 : μ1 = μ2
H1 : μ1 ≠ μ2
Description:
μ1 : Average posttest data μ2
: Average pretest data
The research hypothesis is as follows:
H0 = There is a similarity between the average initial score
of students before being given the usual learning method and after
being given the Visme learning method.
H1 = There is no similarity between the average initial score
of students before being given the usual learning method and after
being given the Visme learning method
31

To test the hypothesis above, the t-test is used as
next:
Information:
0X010 = average posttest
0X020= average pretest
S12 = posttest variance
= variance pretest
n1 = number of students in the posttest
n2 = number of students in the pretest
If the variance is not homogeneous, then the formula used is
as follows:
The test criteria are that H0 is accepted if −ttable <
tcount> ttable and dk = n1 + n1 − 2 with a significant degree of
5%.
3. Analysis of Learning Outcomes of Islamic Religious Lessons (Final
Test)
In the final stage of analysis, a score (posttest) was used, obtained
from the learning outcomes of students after being given Visme learning
media in Islamic religion lessons. The results of the score (posttest)
obtained are used as the basis for testing the research hypothesis.
a. Data Normality Test
The normality test was used to find out whether the learning
outcomes of TPQ Nurul Iman students after being given normal
distributed treatment or not. The steps of the normality test are the
same as in the early stage testing.
b. Homogeneity Test
The homogeneity test was carried out to find out whether the
two pretest and posttest tests had the same variance or not. If the two
tests have the same variance, then the test on TPQ Nurul Iman
32

students can be said to be homogeneous. The steps of testing the
similarity of two variances (homogeneity) are the same as the steps
of testing homogeneity similarity in the initial stage of data analysis.
c. Average Difference Test (T-Test)
The mean difference test aims to find out whether the
experimental group and the control group have the same or different
averages. The hypothesis is formulated as follows:
H0 = there was no significant increase between the use of
Visme-assisted Islamic learning and students' interest in learning.
H1 = exist Increased that Significant
between the use in learning Islamic religion assisted by Visme to
students' interest in learning.
Using a hypothesis:
H0 : μ1 ≤ μ2
H1 : μ1 > μ2
To test the above hypothesis, the t-test is used as follows:
Information:
0X010 = Average posttest
0X020 = Average pretest
= Posttest variance
= Pretest variance
n1 = Number of students in the posttest
n2 = Number of students in the pretest
If the variance is not homogeneous, then the formula used is
as follows:
The test criteria are that H0 is accepted if −ttable < tcount>
ttable and dk = n1 + n1 − 2 with a significant degree of 5%.
d. N-Gain Test
33
To find out the quality of the improvement of the initial test
and the final test of students' learning ability, you can search using N-
Gain. 1) N-Gain
The criteria for interpreting the N-Gain value are as follows:
Table 3.8
N-Gain Value Criteria
N-Gain Value Criterion
N-Gain ≥ 0.70 Tall
0.30 < N-Gain < 0.70 Keep
N-Gain ≤ 0.70 Low
2) N-Gain Normality Test
The normality test was used to determine whether the
results of the experimental group's N-Gain score after being given
the treatment were normally distributed or not. The steps of the
normality test are the same as in the early stage testing.
3) One-Variable Average Test
The one-variable average test was used to find out whether
the increase in the results of the initial test and the final test of the
mathematical problem-solving ability of the experimental group
students was in the high category. The formula used is the t
formula, namely:
Information:
= Average
= Lots of data
= Standard deviation/standard
deviation μ0 = Hypothetical
hypothesized value
If then 0 is accepted. Grades obtained
from the list of T tables with a significance level of 0.05 and
1.
34

If the data is not distributed normally, a non-parametric
test can be used, namely the wilcoxon test or the median test. The
statistical formula of the Wilcoxon Signed Rank Test (Djarwanto,
2003) used is as follows:
Decision making in the Wilcoxon test can be obtained
using the Z test. The basis for decision-making is the same as the
z test, namely: If h > then 0 is accepted.
4. Questionnaire
The questionnaire was used to measure students' responses to
Islamic learning conducted online using Visme. The questionnaire used
to measure students' response to learning Islamic Religion with the Visme
learning method is a questionnaire with a Likert scale model. This likert
scale is an attitude scale in the form of statements or questions that have a
choice of answers that strongly agree (SS), agree (S), disagree (TS),
strongly disagree (STS) (Sugiyono, 2017).
The scoring system can be seen in the following table:
Table 3.9
Student Response Questionnaire Scoring System
Criterion Positive Negative
Strongly Agree (SS) 5 1
Agree(s) 4 2
Hesitate (RG) 3 3
Disagree (TS) 2 4
Strongly disagree (STS) 1 5
The questionnaire data was first processed by classifying student
responses consisting of strongly agree (SS), agree (S), RaguRagu (RG),
disagree (TS) and strongly disagree (STS), then the percentage was
calculated with the following formula (Lestari & Yudhanegara, 2015):
Information:
Q : Answer percentage
35

F : Answer frequency
n : Many answers
After doing the percentage of each item. The next step is to
determine the average percentage. The determination of the average
percentage of students' answers per statement item, can be calculated
using the formula:
Information:
P0i = Average percentage of students' answers for the ith statement item
fi = Frequency of the student's answer choice for the ith statement item
Pi = Percentage of student answer choices for the ith statement item
n = Number of students
Meanwhile, to find out the average answer of the overall student
response using the overall average percentage formula.
The formula used is as follows:
Information:
Pr = Average percentage of students' overall answers (total)
0P00 0i = Percentage of students' answer choices for the ith statement item
k = Number of items
The percentages obtained on each statement item are then
interpreted based on the following criteria: Table 3.10
Student Answer Percentage Criteria
Criterion Interpretation
P = 0% No one
0% < P < 25% A small part
25% ≤ P < 50% Almost half
P = 50% Half
50% < P < 75% Most
75% ≤ P < 100% Almost Entirely
P = 100% Entirely
36
After the questionnaire is collected and processed using this
method, it is then interpreted whether the students are positive or
negative from the results obtained.
F. Research Schedule
This research will be carried out at TPQ Nurul Iman which is located
at Jl. Raya Dukuh Petey, Gunungjaya, Salem District, Brebes Regency,
Central Java Province 52275. The activities that will be carried out by the
researcher are detailed in the table below:
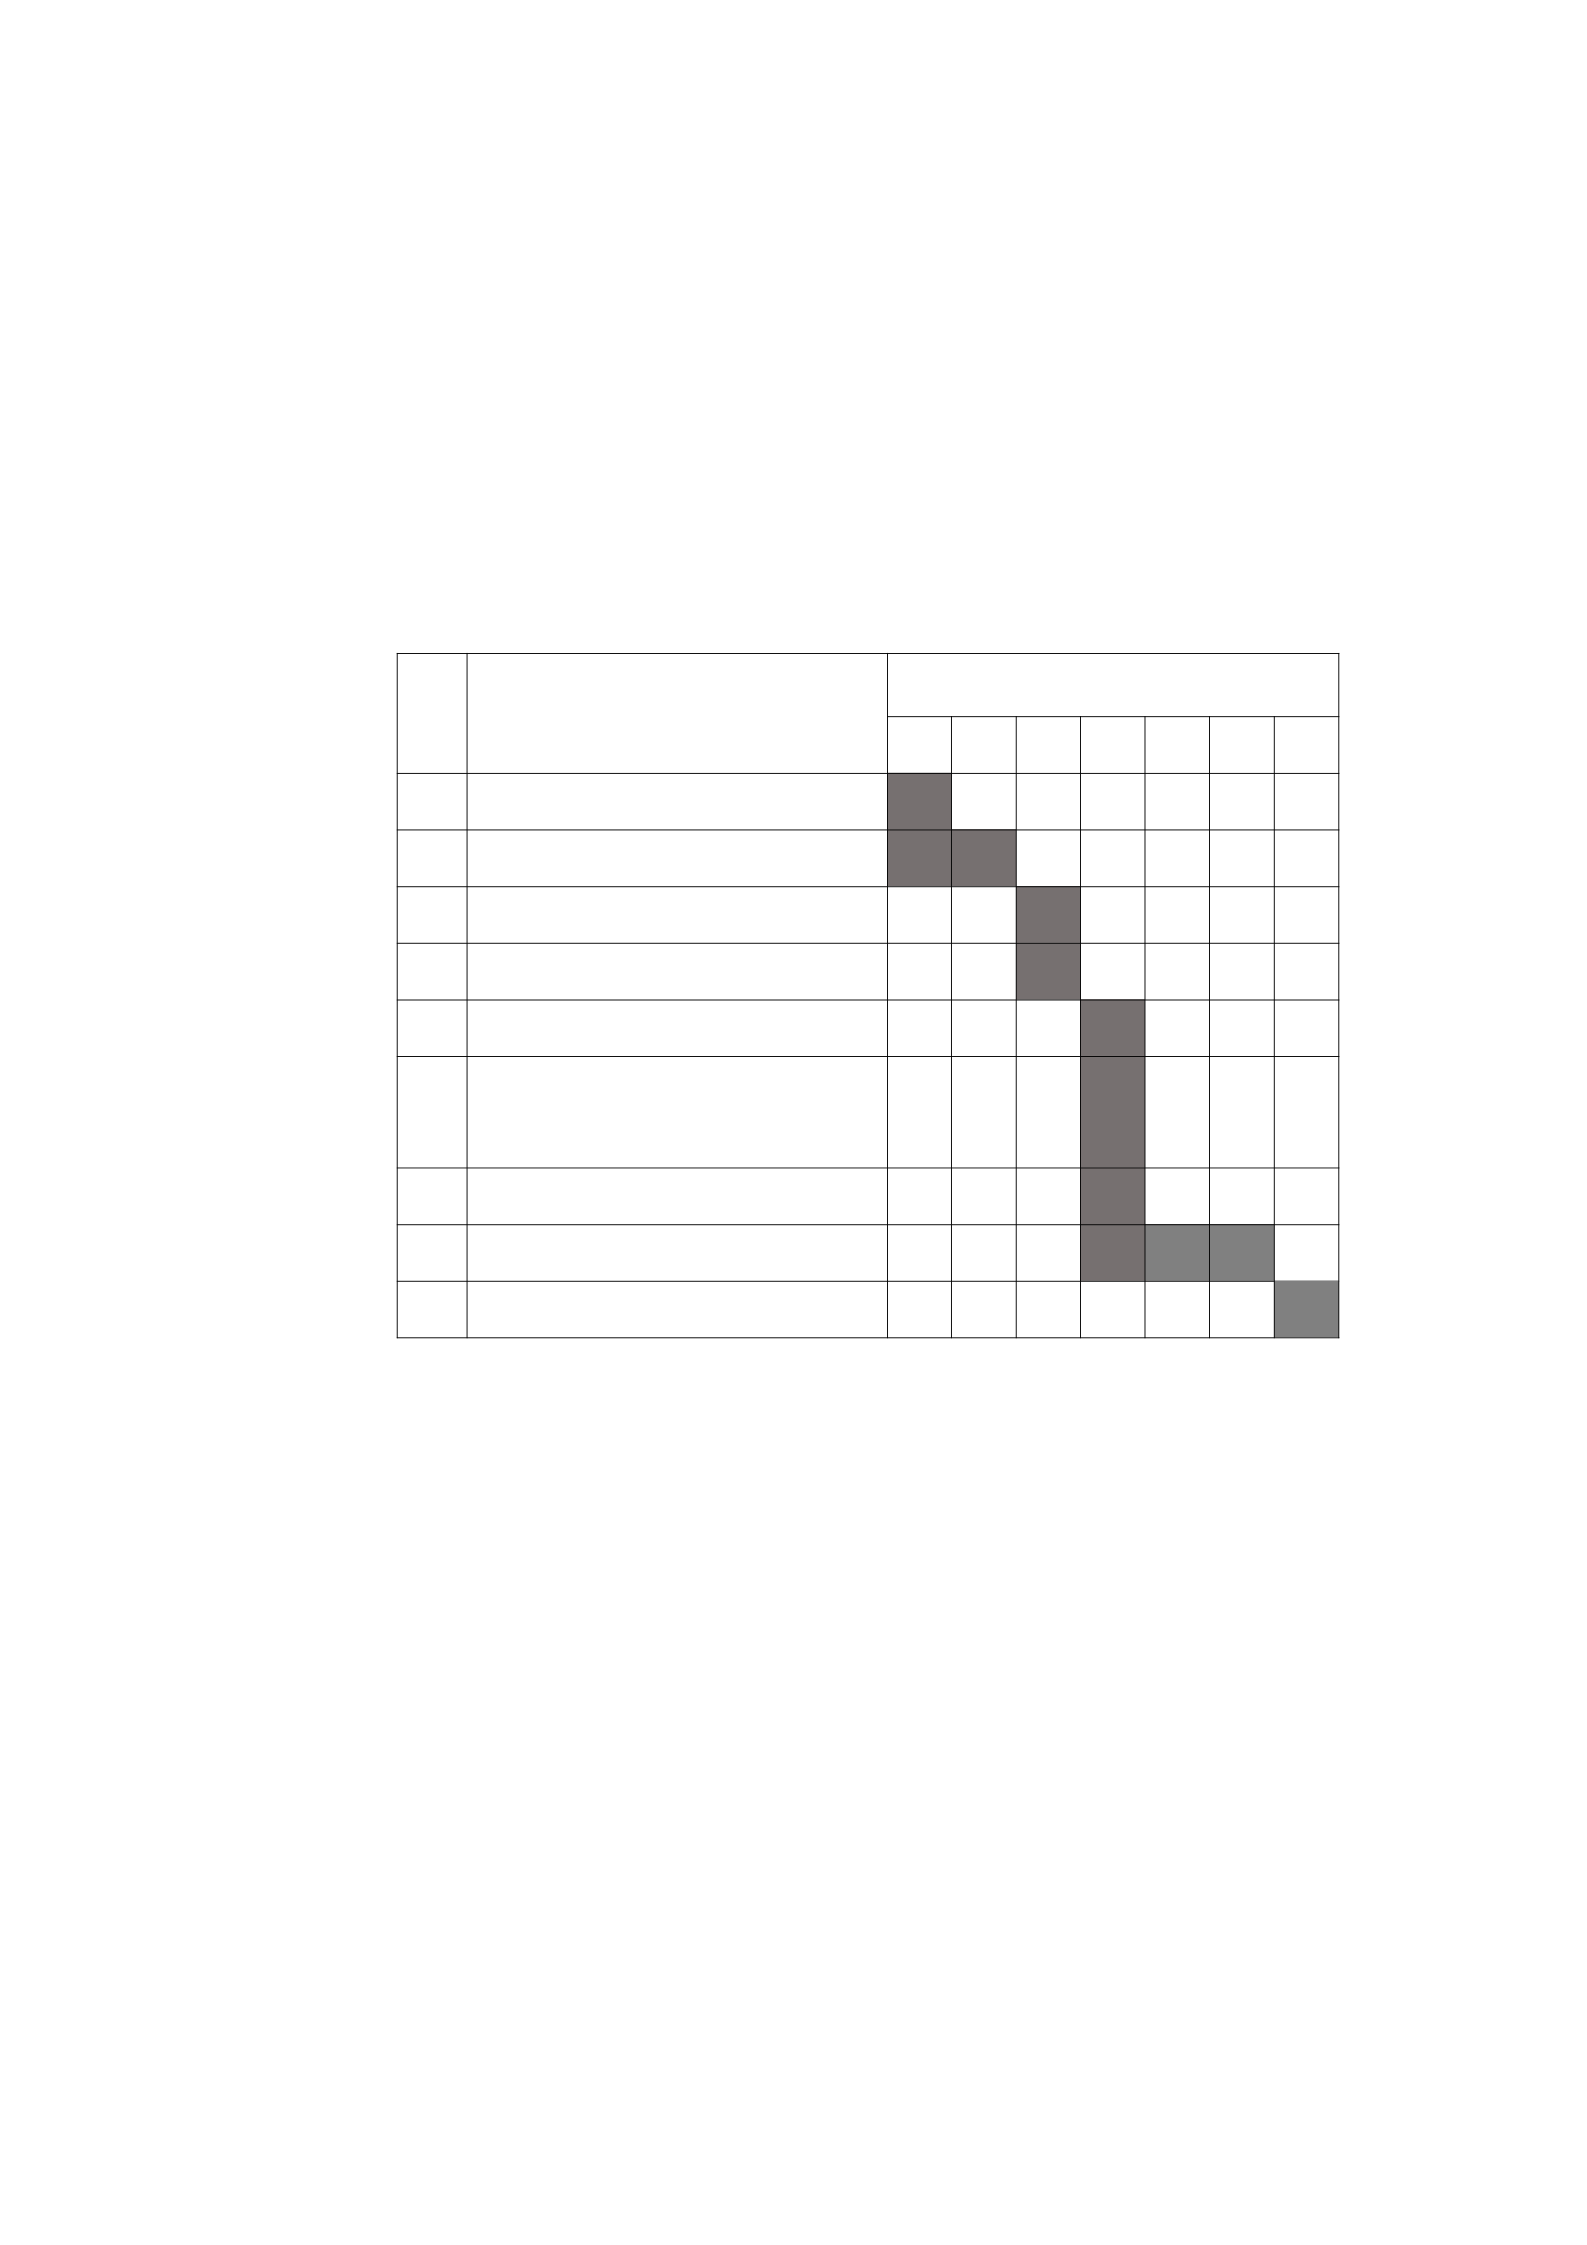
Table 3.11
Research Schedule
It Activities Moon
1 2 3 4 5 6 7
1 Observation
2 Proposal Preparation
3 Seminar Proposal
4 Revision
5 Research Implementation
6 Collection and Processing
Data
7 Data Analysis
8 Report Preparation
9 Seminar on Research Results
37

CHAPTER IV
DATA PRESENTATION AND ANALYSIS
A. Overview of Research Objects
1. History of the establishment of TPQ Nurul Iman
Al-Quran education park (TPQ) Nurul Iman is an institution
engaged in religious activities located on Jalan Sunajati, RT 01/RW 01
Gunungjaya Village, Salem District, Brebes Regency which was
established by Mr. Sarka in 2003, but at that time TPQ was only active
until 2012, which was then reactivated by Mr. Abdul Rohim and
Mr. Auf ma'ruf in 2016 which is still active today.
The existence of the Nurul Iman Al-Quran education park is quite
high with the many achievements obtained by the children of the Nurul
Iman Al-Quran education park (TPQ) from several competitions that
have been held at the Nurul Iman Al-Quran education park (TPQ) itself
as well as competitions held at TPQ/TPA or other non-formal educational
institutions, because based on the results of the interview conducted by
the researcher with Mr. Abdul Rohim as a teacher at TPQ Nurul Iman
that the park Al-Quran education Nurul Iman Gunungjaya Village also
collaborates with the surrounding community and several Al-Quran
education parks and several other non-formal educational institutions in
Gunungjaya village or in Salem District.
2. Geographical Location of TPQ Nurul Iman
The Nurul Iman Al-Quran education park (TPQ) is located on
Jalan Sunajati, RT 01/RW 01 Gunungjaya Village, Salem District, Brebes
Regency with the following boundaries:
a. The east is bordered by residential areas
b. The west is bordered by residential areas
c. To the north it is bordered by gardens
46
d. The south is bordered by residential areas

3. Vision and Mission of TPQ Nurul Iman
As for the vision of the Al-Quran Education Park (TPQ)
Nurul Iman is "to produce a generation of Qur'anis with morals based on
faith and piety" with the following objectives
a. Reading the Qur'an correctly in accordance with the rules of tajweed
science
b. Perform ablution and prayer correctly
c. Getting to know Arabic vocabulary
d. Morality with Islamic morals
e. True faith and far from shari'a
f. Memorize daily prayers and short letters
g. Memorize selected hadiths
h. Writing Arabic correctly
Furthermore, the mission of the Nurul Iman Al-Quran Education
Park (TPQ) is as follows:
a. Teaching how to read the Quran properly and correctly in accordance
with the rules of tajweed science
b. Introduce and also teach Islamic morals to make it a guideline for
daily life based on the Quran and Sunnah
4. The Condition of TPQ Nurul Iman
In general, TPQ Nurul Iman has quite adequate infrastructure, one
of which is a comfortable study room, which in this case is a study room
for children who are learning at the Al-Quran level and children who are
still learning at the Iqro level have a separate room, which in this case is
to make it easier for children and teachers to maximize the learning
process. In this case, it is also supported by several posters or images to
support children's learning, such as short prayers, Arabic vocabulary,
hijaiyah letters, and so on.
5. Teaching situation
The number of teachers of TPQ Nurul Iman Gunungjaya Village
consists of 2 people. The details of the teacher's condition are as follows:
Table 4. 1
Instructor Condition
It Name Position
1. Abdul Rohim Teacher
39

2. Yeyen Teacher
6. Children's Condition
The number of child samples at TPQ Nurul Iman Gunungjaya
Village consists of 20 people, The details of the child's condition are as
follows:
Table 4. 2
Children's Condition
It Name Age Levels
1. Adam 11 Years Al-Quran
2. Aisya 9 Years Al-Quran
3. Amel 8 Years Al-Quran
4. Arjuna 9 Years Al-Quran
5. Arin 8 Years Al-Quran
6. Bagas 11 Years Al-Quran
7. Cheryl 9 Years Al-Quran
8. Hilmi 10 Years Al-Quran
9. Kusma 9 Years Al-Quran
10. Kenji 8 Years Al-Quran
11. Latif 11 Years Al-Quran
12. Meli 8 Years Al-Quran
13. Mila 12 Years Al-Quran
14. Novi 8 Years Al-Quran
15. Rani 8 Years Al-Quran
16. Regine 8 Years Al-Quran
17. Rizki 9 Years Al-Quran
18 Rizwan 10 Years Al-Quran
19. Rahma 11 Years Al-Quran
20. Salma 11 Years Al-Quran
40

7. Management Structure of TPQ Nurul Iman
2. Yeyen
B. Data Presentation
1. Learning Interest Questionnaire
a. Data of Student Learning Interest Questionnaire (Pretest) Control
Group Table 4. 3
Pretest Respondent Data
It Respondents Control Group
1 Adam 28
2 Aisya 30
3 Amel 26
4 Arjuna 29
5 Arin 28
6 Bagas 31
7 Cheryl 25
8 Hilmi 25
9 Kusma 27
10 Kenji 24
11 Latif 29
12 Meli 30
13 Mila 28
14 Novi 28
15 Rani 28
16 Regine 28
17 Rizki 27
18 Rizwan 30
19 Rahma 29
20 Salma 32
The results of the student learning interest questionnaire
(pretest) are written in total from the questionnaire choice answers
and presented in the form of frequency distribution as follows:
41
Disruptors ng Answer
KaSar
Head
Abdul Rohim
Advisor
Auf Ma'ruf
Teacher
1. Abdul Rohim

Table 4. 4
Control Group Pretest Frequency Distribution
Category Interval
Group Frequency Percentage
1. Strongly Agree 32-33 1 5%
2. Agree 30-31 4 20%
3. Nervous 28-29 9 45%
4. Disagree 26-27 3 15%
5. Strongly disagree 24-25 3 15%
SUM 20 100%
b. Data Questionnaire Interest Learn Student (Posttest) Group
Experiment
Table 4. 5
Posttest Respondent Data
It Respondents Experimental Group
1 Adam 42
2 Aisya 40
3 Amel 39
4 Arjuna 41
5 Arin 41
6 Bagas 46
7 Cheryl 42
8 Hilmi 41
9 Kusma 42
10 Kenji 40
11 Latif 41
12 Meli 41
13 Mila 41
14 Novi 41
15 Rani 42
16 Regine 40
17 Rizki 43
18 Rizwan 42
19 Rahma 44
20 Salma 46
The results of the student learning interest questionnaire
(posttest) are written in total from the questionnaire choice answers
and presented in the form of frequency distribution as follows:
42

Table 4. 6
Posttest Frequency Distribution of Experimental Groups
Category Interval
Group Frequency Percentage
1. Strongly Agree 45-46 2 10%
2. Agree 43-44 2 10%
3. Nervous 40-42 15 75%
4. Disagree 37-39 1 5%
5. Strongly disagree 34-36 0 0%
SUM 20 100%
Based on the frequency distribution of students' learning
interests before being given the treatment (pretest) above, it can be
seen that there is a difference in the frequency of values between the
control group and the experimental group.
The interval of 45–46 (strongly agreed) in the experimental
group obtained 2 frequencies. The interval of 43–44 (agree) in the
experimental group got 2 frequencies. The interval of 40–42
(hesitation) in the experimental group got 15 frequencies. The
interval of 37–39 (disagree) in the experimental group got 1
frequency. The interval of 34–36 (strongly disagreed) in the
experimental group got 0 frequencies.
While the interval of 32–33 (strongly agreed) in the control
group got 1 frequency. The interval of 30–31 (agree) in the control
group obtained 4 frequencies. The interval of 28–29 (hesitant) in the
control group obtained 9 frequencies. Intervals 26–27 (disagree) in
the control group get 3 frequencies and Intervals 24–25 (strongly
disagree) in the control group get 3 frequencies.
c. Comparison of Learning Interests of Control Groups and Groups
Experiment
Based on the description of the frequency distribution of
pretest and posttest learning interest data of the control group and
the experimental group, it can be compared with the conditions of
learning interest before and after treatment between the control group
and the experimental group. To make it easier to make the
comparison, the following table is presented below:
Table 4. 7
43
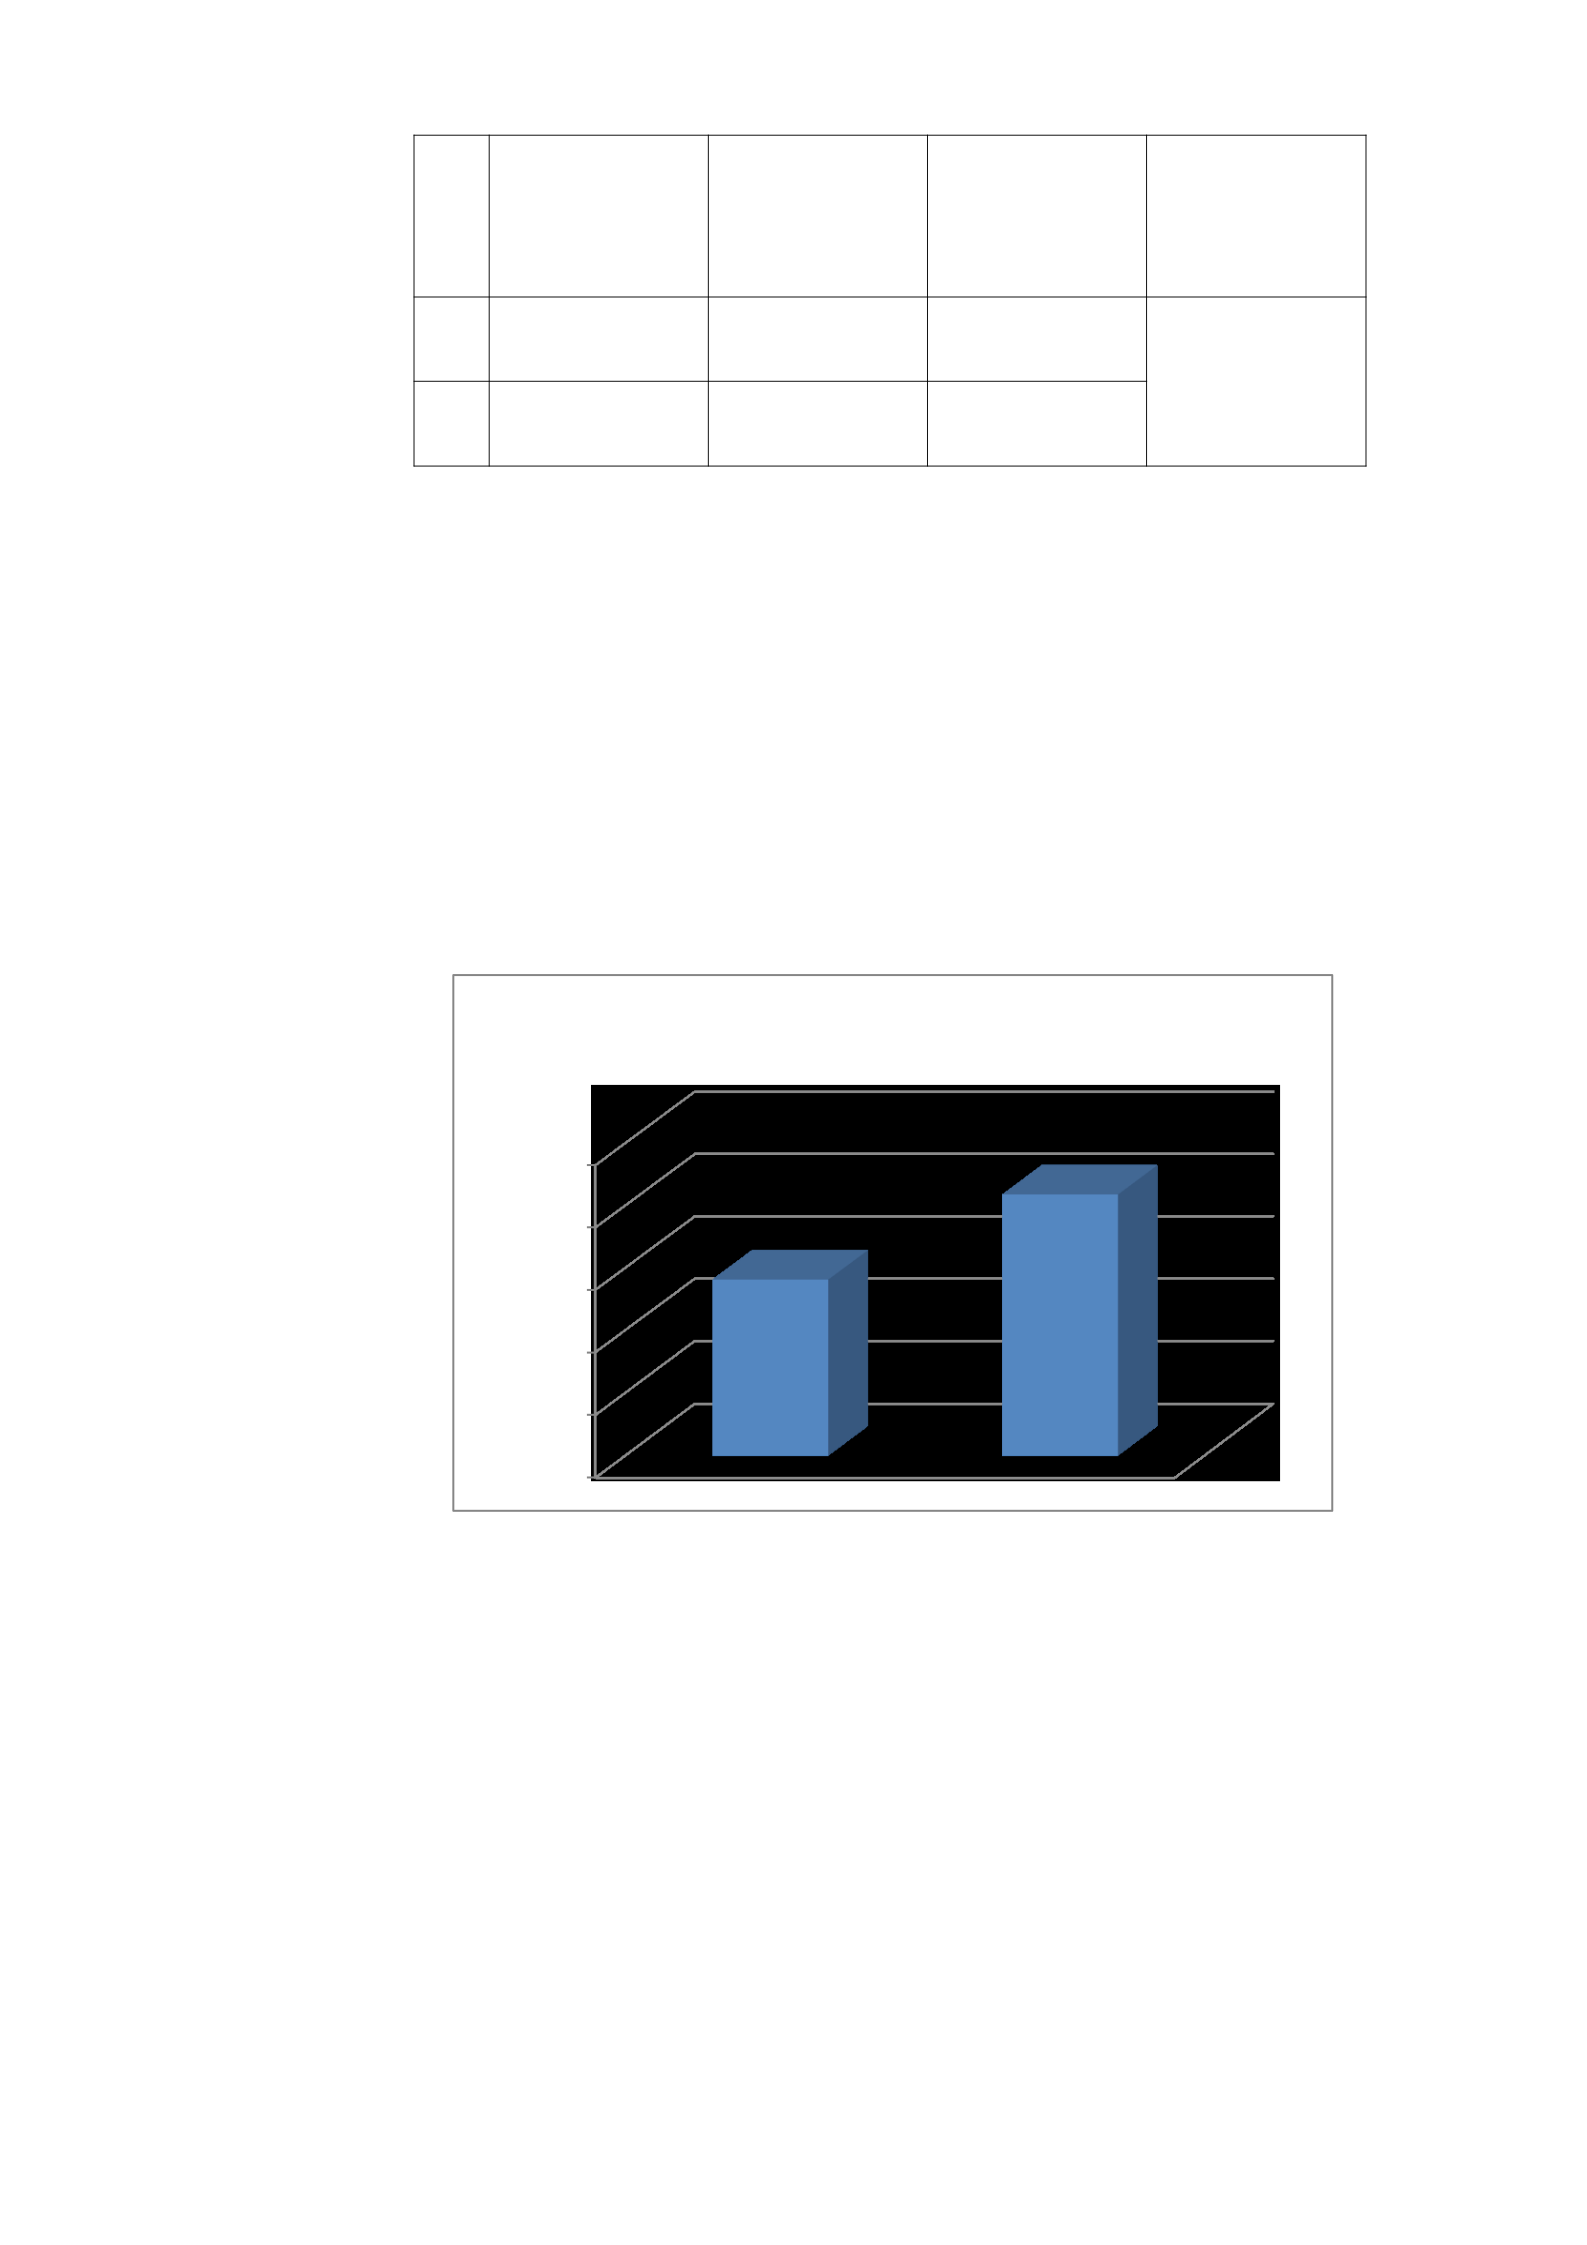
Comparison of the Learning Interests of Control Group
Students and
Experimental Group
It Group
Average
Score
Group
Pretest
Average
Score
Group
Posttest
Percentage
Increase
1. Control
Group 28,10
49,00%
2. Experimental
Group 41,75
Comparison Charts are calculated using the help of Microsoft
Excel.
Based on the table above, the average posttest was higher than
the pretest in the experimental group, which was 41.75 > 28.10,
there was an increase of 49.00% after the experimental group was
given learning treatment using Visme media.
The comparison of pretest and posttest learning interests
between the control group and the experimental group can be
visualized in the following diagram:
Control Group 28.10 and Experimental Group 41.75 Figure 4. 1
Comparison of Pretest and Posttest Learning Interests
Comparison Charts are calculated using the help of Microsoft
Excel.
C. Hypothesis Analysis and Testing
After successfully collecting data, the data is then analyzed for data. The first
thing that is carried out is the prerequisite test of the questionnaire instrument,
namely.
44
0%
1000%
2000%
3000%
4000%
5000%
Pre-Test and Post-Test

1. Data Analysis
a. Validity Test
The first test is the validity test. To strengthen the validity of
the instrument before the questionnaire (questionnaire) is given to
students to be used as research, the instrument is tested on students
from both the control group and the experimental group.
In this test, the researcher took TPQ Nurul Iman Gunungjaya students.
To make it easier to test the validity of the instrument in this
study, the researcher used Microsoft Excel and IBM SPSS Statistics 26
for Windows programs. Based on the calculations of the Microsoft
Excel and IBM SPSS Statistics 26 for Windows programs, the
following data was obtained:
Table 4. 8
Results of Pretest and Posttest Validity Tests for Learning Interest
Variables
No. Item Sig. Sig. Scale: 0.05 Information
X1 0,001 0.05 Valid
X2 0,000 0,05 Valid
X3 0,000 0,05 Valid
X4 0,001 0,05 Valid
X5 0,020 0,05 Valid
X6 0,000 0,05 Valid
X7 0,000 0,05 Valid
X8 0,000 0,05 Valid
X9 0,001 0,05 Valid
X10 0,000 0,05 Valid
From the results of the posttest validity test of the learning
interest variable in the learning of the history of the Prophet
Muhammad SAW, there are 10 items of statements, namely the
numbers X1, X2, X3, X4, X5, X6, X7, X8, X9, X10.
declared valid because the value of Sig. < 0.05.
b. Reliability Test
The second test is the reliability test. Researchers used
Cronbach's Alpha reliability test with the help of the IBM SPSS
Statistics 26 for Windows program. The researcher uses the IBM SPSS
Statistics 26 for Windows program on the basis of taking reliability
tests, namely:
45

1) If the α > score is 0.6, then the questionnaire is said to be reliable.
2) If the α < score is 0.6, then the questionnaire is said to be
unreliable.
Based on the calculation of the IBM SPSS Statistics 26 for
Windows program, the following data was obtained:
Case Processing Summary
N %
Cases Valid 20 100.0
Excludeda 0 .0
Total 20 100.0
a. Listwise deletion based on all variables in the procedure.
Reliability Statistics
Cronbach's Alphaa N of Items
-.778 10
a. The value is negative due to a negative average covariance among items. This
violates reliability model assumptions. You may want to check item codings.
Figure 4. 2 Output Results of the Reliability Test of Learning
Interest Variables
Based on the IBM SPSS Statistics 26 for
Windows can be found that Cronbach's Alpha number from the
learning interest variable is 0.778. Because 0.778 > 0.6, as the basis
for decision-making in the reliability test, it can be concluded that the
Visme learning media questionnaire instrument in an effort to increase
learning interest in TPQ Nurul Iman can be said to be reliable.
D. Hypothesis Testing
Furthermore, the prerequisite tests for the analysis test are carried out,
namely:
1. Test Normality
The researcher used the Kolmogorov-Smirnov normality test with
the help of the IBM SPSS Statistics 26 for Windows program.
The researcher uses the IBM SPSS Statistics 26 for Windows
program based on the decision making of the normality test, namely:
a. If the Significance value > 0.05, then the residual value is normally
distributed.
b. If the Significance value < 0.05, then the residual value is not
normally distributed.
46

Based on the calculation of the IBM SPSS Statistics 26 for
Windows program, the following data was obtained:
One-Sample Kolmogorov-Smirnov Test
Unstandardized
Residual
N 19
Normal Parametersa,b Mean
.0000000
1.44892257 Std. Deviation
Most Extreme Differences Absolute .140
.140
-.063
Positive
Negative
Test Statistic .140
Asymp. Sig. (2-tailed)
.200c,d
a. Test distribution is Normal.
b. Calculated from data.
c. Lilliefors Significance Correction.
d. This is a lower bound of the true significance.
Figure 4. 3 One Sample Kolmogorov-Smirnov Test
Based on the IBM SPSS Statistics 26 for Windows output result
table, it can be seen that the pretest and posttest significance values of
the control group and the experimental group are 0.200. Because the
significance value of the two groups is more than 0.05, it can be
concluded that the research data is normally distributed.
2. Homogeneity Test
The researcher used a paired t-test with the help of the IBM SPSS
Statistics 26 for Windows program.
The researcher used the IBM SPSS Statistics 26 for Windows
program on the basis of decision making for homogeneity tests, namely:
a. If the value of Sig. > 0.05, then the distribution of homogeneous data.
b. If the value of Sig. < 0.05, then the distribution of the data is not
homogeneous.
Based on the calculation of the IBM SPSS Statistics program
26 for Windows, the following data was obtained:
Test of Homogeneity of Variances
Levene
Statistics df1 DF2 Sig.
Pretest- Based on Mean .232 1 38 .633
Posttest Based on Median .302 1 38 .586
47
Based on Median and
with adjusted df
.302 1 37.537 .586
Based on trimmed
mean
.256 1 38 .616
Figure 4.4 Output Results of Homogeneity Test
Based on the IBM SPSS Statistics 26 for
Windows can be found that the Significance value is 0.633, because it is
0.633> 0.05 then as the basis for decision-making in the homogeneity
test, it can be concluded that the variance of the pretest data of the
control group and the posttest of the experimental group is homogeneous.
3. Paired Sample T-Test
The researcher used a paired sample t-test with the help of the
IBM SPSS Statistics 26 for Windows program. Based on the calculation of
the IBM SPSS Statistics 26 for Windows program, the following data was
obtained:
Paired Samples Statistics
Mean N Std. Deviation Std. Error Mean
Pair 1 Pretest 28.1000 20 2.04939 .45826
Posttest 41.7500 20 1.83174 .40959
Figure 4.5 Output Results of T-Test Paired Sample Statistics
Based on the output statistics of the paired test of the t-test, there
was a difference in values between the pretest and the posttest, which
was 28.10 for the pretest and 41.75 for the posttest.
Paired Samples Test
Mean
Std.
Deviatio
n
Paired Differences
Std.
Error
Mean
95% Confidence
Interval of the
Difference
t Df
Sig.
(2tailed) Lower Upper
Pair Pretest -
1 Posttest
-13.65000 1.87153 .41849 -14.52590 -12.77410 -32.617 19 .000
Figure 4. 6 Paired T-Test Output Results
Based on the table of IBM SPSS Statistics 26 for Windows output
results, it can be seen that the Pretest and Posttest Significance values
48

are 0.000, because the Sig. value is 0.000 < 0.05, so based on the
available information is:
H1 : There is a difference in the influence of the application of learning
using Visme media on students' learning interest at TPQ Nurul
Iman Gunungjaya.
H0 :Not exist difference influence Application Learning
using Visme media on students' learning interests at TPQ Nurul
Iman Gunungjaya.
The criteria used to draw conclusions are as follows:
a. If the value of Sig. < is 0.05, H0 is rejected and H1 is accepted, then
there is an effect of the application of learning using Visme media on
students' learning interest at TPQ Nurul Iman Gunungjaya.
b. If the value of Sig. > 0.05, H1 is rejected and H0 is accepted, then
there is no difference in the effect of the application of learning using
Visme media on students' learning interest at TPQ Nurul Iman
Gunungjaya.
Based on the IBM SPSS Statistics 26 for Windows output table, it
can be seen that the Significance value is 0.000, because 0.000 < 0.05,
meaning that there is a difference in the average learning interest of
students for the control group pretest and the experimental group
posttest. Thus, H1 is accepted and H0 is rejected where learning using
Visme media affects the learning interest of TPQ Nurul Iman Gunungjaya
students.
4. Discussion
In the research that has been conducted, researchers have proven
that learning using Visme media has a great influence on students'
learning interests at TPQ Nurul Iman Gunungjaya.
Evidence of the influence of treatment on the learning interest of
students in the control group and the experimental group can be seen
from the results of the comparison of group averages and the analysis of
the paired test (T-test).The comparison of learning interest data of
students in the experimental group was higher than that of the control
group, where the experimental group had an average score of 41.75 while
the control group had an average score of 28.10.
The average score from pretest to posttest of the experimental
group was higher than that of the control group. The increase in the
experimental group after using Visme media in learning at TPQ Nurul
Iman was 49%.
49

The average significance value of students' learning interest for
the control group pretest with the experimental group posttest was 0.000
< 0.05, so that H1 was accepted and H0 was rejected, meaning that the
use of Visme media had an effect on learning at TPQ Nurul Iman
Gunungjaya.
50

CHAPTER V
COVER
A. Conclusion
Based on the research that has been carried out and referring to the
formulation of the problem, it can be concluded that the application of Visme
media in learning at TPQ Nurul Iman Gunungjaya, has a positive impact on
increasing interest in learning Islam in children. Based on the analysis of the
data and findings obtained, it can be seen that there is an increase in active
participation, involvement, and enthusiasm in the learning process. The use of
interactive visual, audio, and animation media through Visme media has
helped create a more engaging and entertaining learning environment for
children.
The results of this study provide important practical implications for
education practitioners at TPQ Nurul Iman Gunungjaya. The application of
Visme media can be used as an effective alternative in an effort to increase
interest in learning Islam in children. Teachers and teachers can take
advantage of Visme's interactive features to develop learning materials that
are more engaging and relevant for students.
In the ever-evolving world of education, the use of technology and
learning media is increasingly important. The application of Visme media as a
learning aid at TPQ Nurul Iman Gunungjaya makes a positive contribution in
an effort to increase interest in learning Islam in children.
B. Suggestions
Based on the conclusion of the research, the following can be
suggested:
1. Learning using Visme media can be used as an alternative learning by
teachers to improve students' thinking skills, students' interest in learning
and increase student activities.
2. Furthermore, researchers should make initial observations of students'
learning time and activities in schools that are
60
51

may interfere with research and the characteristics of students in schools
that will be used as a research population in order to minimize
disturbances that may occur during research and to optimize research
results.
3. The next researcher, if you want to observe students' learning interests,
the statements used should not be too much, but simply represent each
indicator of children's learning interests.

