


INTRODUCTION Development is a process of change
Development is a process of change towards a better improvement.
Development is an effort to improve the quality of life by utilizing its supporting
resources or sustainable resources (Maryunani, 2018). In essence, the concept of
development has the goal of improving the quality of human life which becomes a
unity in the major process of development towards the welfare of a just and
equitable society. The measurement of people's welfare can be known through
the most common indicator, namely economic growth or per capita income of a
country. Development is said to be successful if the development can produce a
positive impact greater than the negative impact.
In fact, the development success that Indonesia has achieved is not in
accordance with the development goals themselves. The progress of development
is identical in the economic field, which in reality is still uneven. Development
often gives birth to various kinds of inequality that are inseparable from the
limited funds and management they have, resulting in problems of poverty,
unemployment and disparities between regions or regions (Mulyani and Suripto,
2016). According to Jamaludin (2016), development does not only focus on
creating higher economic growth, but must also consider the realization of a better
quality of life, equity and social justice.
The measure of the achievement of development success is currently more
complex, meaning that in looking at the achievement of development success can
also be seen through the existence of quality of life as a fulfillment of basic human
needs. Quality of life as a fulfillment of basic needs can be seen with better social
security such as education and health, improvement of the quality of the
environment where humans live, technological advances, job creation,
improvement of the quality of human resources and changes in the economic
structure from an agrarian economic structure to an industrial economic sector.
Economic development is interrelated with other aspects so that each
region will experience various obstacles in development. Various kinds of losses as
a result of the development process are also called social costs that must be borne
at high costs. In meeting development needs in social and economic aspects, there
is often an imbalance with efforts to maintain environmental sustainability or pay

attention to environmental aspects. This was also explained by Fauzi (2004) that
the geographical conditions owned by provinces in Indonesia with four national
parks must experience a trade-off between protecting the environment and
triggering positive economic growth in accordance with the development targets
that have been proclaimed in the Regional Medium-Term Development Plan
(RPJMD).
In the development process, it shows that the socio-economic aspect with
the environmental aspect has a gap in development goals that do not consider
environmental damage. Industrial development is also directly related to
environmental aspects that generally occur in developing countries that are rich in
natural resources to attract investors, so that the country does not pay attention to
the losses resulting from development itself such as industrial waste, forest loss
and so on (Mulyani and Suripto, 2016). According to Rozikin (2012) paradigm
Economic development that reflects economic growth can increase the
accumulation of capital and per capita income of developing countries and has
negative impacts such as the sacrifice of ecological deauthorization in the form of
shrinking natural resources and the emergence of social inequality. The
sustainability of this development will unconsciously have an impact on the
decline in the welfare of future generations will also be disrupted. According to
Bartniczak and Raszkowski (2018) stated that in the Continent
Africa has great potential in developing the quality of human life, but at the same
time the African continent is also experiencing a decline in the quality of the
environment. This shows that sustainable development is very important to be
applied to solve a problem caused by socio-economic development such as
congestion levels, demographic problems, urbanization, climate change, high
consumerism and others. Development has undergone a paradigm shift, this is
because development is not only synonymous with economic growth as a
development goal, but focuses more on the quality of the development process. A
paradigm shift towards a sustainable development paradigm based on the
perspectives of the World Bank and development economics experts.
Sustainable Development emerged in relation to the issue of the
environment in the 1970s which explained that development in the world would
not be profitable if the natural resources that sustain the world economy were not

considered. Increasingly complex environmental issues related to environmental
damage as a result of the development process and development problems related
to high economic growth and
social disparities that incur high costs. Related to this issue, it is necessary to review
the development paradigm and evaluate development policies for future
generations.
Sustainable development is development that realizes (fulfills) the needs
of today's life without reducing the ability of future generations to realize their
living needs (Muktianto and Diartho, 2018). Sustainable development itself is
development to meet current needs without sacrificing capabilities for future
generations (WCED, 1987 in Maryunani 2018). Sustainable development has
three interrelated aspects of development, namely economic, social and
environmental aspects. The integration of social, economic and environmental
aspects is very important so that sustainable development goals produce
development that will later achieve national goals without damaging non-
renewable natural resources.
The current development paradigm focuses on achieving equitable
development (Equity), efficient growth (Growth Efficiency) and sustainability
(Sustainability) in the balance of development (Erlinda, 2016). The high risk of the
development process without considering environmental damage is a challenge in
achieving sustainable development goals. As in the concept of sustainable
development which has a concentration of development with sustainability
measures, among others, through economic, social and environmental aspects.
The concept of sustainable development which has three aspects of
economy, social and environmental has shifted from a global focus to a regional or
regional focus (Nijkamp and Vreeker, 2000). According to Nijkamp and Vreeker
(2000), development has shifted to a regional focus, this is because the region or
region has a clear demarcation or boundary of the separation area and makes it
easier to conduct a more operational empirical analysis. Sustainable regional
development or Sustainable Regional Development (SRD) is a concept that
integrates the principles of sustainable development into development and
planning practices in the region. From the issue of development aspects such as

economic, social and environmental aspects, an integration of these various
aspects is needed for sustainable regional development.
Regional development has existed since the implementation of the
regional autonomy regime in accordance with Law No. 22 of 1999 which was later
updated and revised so that the latest law, Law No. 32 of 2004 concerning local
government which also emphasizes the development of
considering environmental sustainability. This is also explained in Law No. 17 of
2007 concerning the National Long-Term Development Plan 2005-2025 which
states that natural resources must be developed and utilized by paying attention
to regional autonomy policies in order to improve community welfare, develop
strategic and fast-growing regions and strengthen regional capacity and
commitment to support sustainable development.
Unsustainable management of natural resources will cause externalities as a result of
development itself.
Java Island is the largest island in Indonesia. Java Island has 6 regions out of
33 provinces in Indonesia, namely DKI Jakarta, West Java, Java
Central, DI Yogyakarta, East Java and Banten. Figure 1.1 shows that the island of Java
has a GDP growth rate of
increasing quite stably every year compared to Bali and Nusa Tenggara, Kalimantan,
Sulawesi, as well as Maluku and Papua which are quite dynamic.
The GDP growth rate in Java Island on the basis of cash prices in 2010 in
2014 by 5.57% and increased in 2018 by 5.72%.
Development on the island of Java is dominated by the concentration of
manufacturing industries and the high conversion of agricultural land to non-
agriculture which is also caused by ineffective spatial planning.
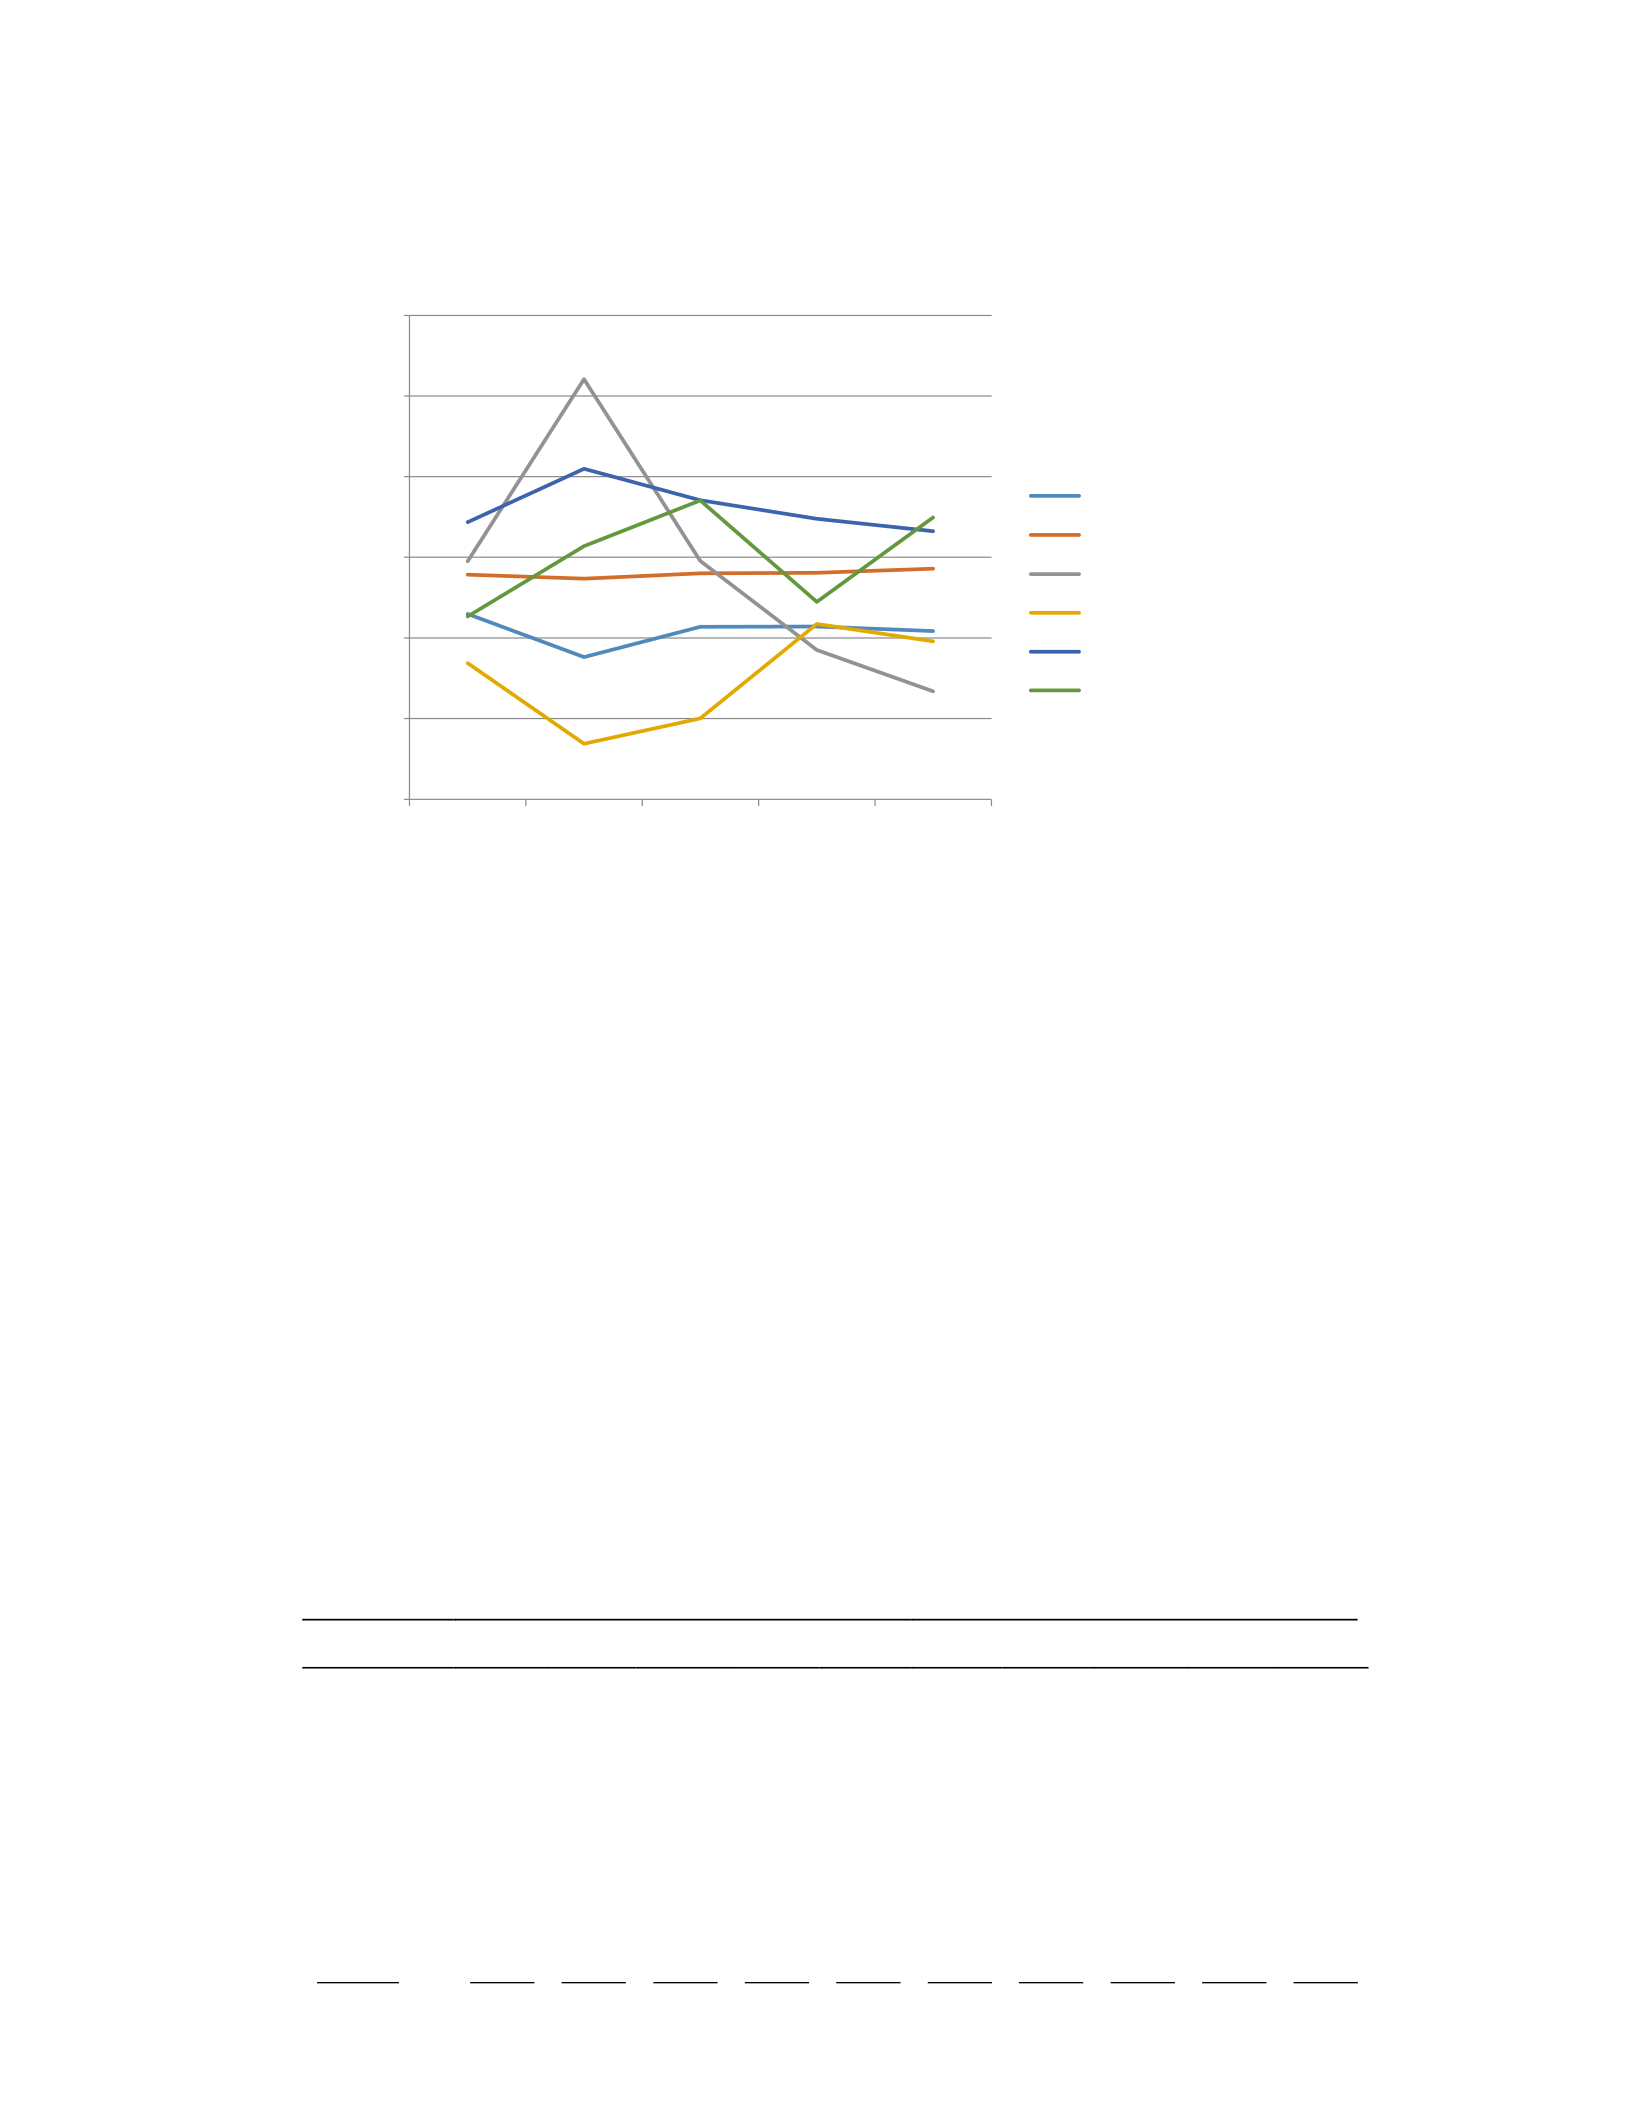
Figure 1.1 GDP Growth Rate Per Island, 2014-2018
Source: Central Statistics Agency
Economic growth that is quite stable in its increase is not always directly
proportional to environmental conditions. The increasing economic condition
(GDP) is an increase and progress of destructive development as explained by Fauzi
(2012) in Margiyono (2018). The increase in high economic growth will be followed
by high inequality and environmental degradation that must be paid dearly. This
was also explained by Margiyono (2018) that the sustainability of development in
Indonesia has three interesting areas, namely, DKI Jakarta Province, DI Yogyakarta
and East Kalimantan. In addition to being seen from economic growth, it can also
be seen by comparing social and environmental aspects in the form of the Human
Development Index (HDI) and the Environmental Quality Index (IKLH).
Table 1.1 Human Development Index (HDI) and Environmental Quality Index (IKLH)
Province
Jakarta
West Java 68,80 69,50 70,05 70,69 71,30 45,06 63,49 51,78 50,26 56,98
Central Java 68,78 69,49 69,98 70,52 71,12 60,63 60,78 58,75 58,15 68,27
AT
Yogyakarta
76,81 77,59 78,38 78,89 79,53 49,53 50,99 51,37 49,80 62,98
East Java 68,14 68,95 69,74 70,27 70,77 56,48 62,67 58,98 57,46 67,08
Banten 69,89 70,27 70,96 71,42 71,95 43,67 55,36 66,00 51,58 57,00
Javanese 360,92 364,52 367,75 370,43 373,19 292,25 337,08 325,57 303,03 357,52
Source: BPS and the Ministry of Environment
201 201 201 201 201
Year
Sumater
Jaw
Bali and Nusa Tenggara
Kalimanta
Sulawes
Maluku and Papu
HDI IKLH
2014 2015 2016 2017 2018 2014 2015 2016 2017 2018
3978 9978 79 60 80 06 80 47 36 88 7943 6938 7835 2145

The comparison between HDI and IKLH values shows the relationship
between economic, social and environmental development. Table 1.2 shows the
difference between HDI and provincial IKLH in Java Island which have a high HDI
value, but have a low IKLH value. Likewise, provinces on the island of Java have a
low HDI value, but have a relatively high IKLH value. It can be seen in table 1.2 that
DKI Jakarta in the vulnerable period 2014-2018 has a high HDI value, but has a very
poor IKLH value compared to other provinces on the island of Java. Likewise, the
province of Central Java has a fairly low HDI value but has a fairly good IKLH score.
Development can be said to be sustainable if there is a balance of growth
in economic, social and environmental aspects in the development process.
Development on the island of Java is suspected to still be predominantly
concerned with economic and social aspects, but weak in paying attention to
environmental aspects.
1.2 Problem Formulation
1. What are the conditions of economic development carried out in the Java Island
region?
2. How is sustainable regional development seen from the economic, social and
environmental aspects carried out in the Java Island region with the Sustainable
Development Composite Index (IPB)?
3. How is sustainable development distributed spatially on the island of Java with
the Geographic Information System/GIS approach?
1.3 Research Objectives and Benefits
1.3.1 Research Objectives
The objectives to be achieved in the framework of this research are
formulated, including:
1. Knowing the conditions of economic development carried out in the Java Island
region.
2. Knowing the sustainability of regional development (sustainable regional
development) is seen from the economic, social and environmental aspects
carried out in the Java Island region with the Sustainable Development
Composite Index (IPB).

3. Knowing the spatial distribution of sustainable development on the island of
Java with the Geographic Information System / GIS.
1.3.2 Research Benefits
The benefits obtained from the results of this research can contribute to
thought, including:
1. It is hoped that the results of this research can provide references in the field
of science in the field of Development Economics and sustainable
development.
2. It is hoped that the results of this research can be used as reference materials
and information for future researchers.
3. It is hoped that this research will be useful as a source of useful information for
parties within the scope of the Provincial Government on the Island of Java in
formulating sustainable regional development policies.

CHAPTER 2. LITERATURE REVIEW
2.1 Theoretical Foundations
2.1.1 Theory of Sustainable Development
Sustainable development has existed since the 18th century which was
introduced by Thomas Robert Malthus in 1798 with his hypothesis regarding
population growth and land limitations. Malthus in his hypothesis explained that
there are concerns related to the availability of land, especially in non-renewable
natural resources in the UK as a result of the population explosion. This concern
for the environment is caused by the increasing population over time but the
amount of natural resources available is limited.
Conceptually, Malthus' theory is the theory that underlies the growing gap
between development that focuses on economic aspects and its carrying capacity,
namely the environment or natural resources that are not renewed. The concept of
sustainable development is also explained by several economists who explain that
sustainable development has existed for a long time and has received more serious
attention related to environmental problems (Fauzi, 2004). The increasing
awareness of the crisis related to the environment which is increasingly worrying has
raised awareness that the cause is excessive development. In the sense that
development is carried out continuously to prosper the community without
considering the environment.
Later this concept was clarified by Meadows et al. (1972) in his book entitled
"The Limit to Growth" which gives more serious attention to the existence of a limit
to growth. The meaning of this limit of growth explains that economic growth will
inadvertently be limited by the availability of natural resources in the future. So that
the limited availability of natural resources will result in economic activities such as
the flow of goods and services produced by natural resources cannot be carried out
continuously. In 1992 Meadows et al. updated his book entitled "Beyond the
Limits" which made people realize that growth over the past 20 years has led to
more unsustainability towards the environment.
Environmental concerns have also led to a book titled "Our Common Future"
published by the World Commission on

Environmental, and Development (WCED) or known as Brundland Commission in
1987. With the publication of a book that explains the concept of economic
development that is related to the environment as a result of the concept of
sustainable development. The concept of sustainable development is a challenge
to the concept of neo-classical economic development which is a conventional
development concept. The definition of sustainable development was first
explained in his book that sustainable development is development to meet the
needs of the present without sacrificing the rights to meet the needs of the
future.
Sustainable development is a human effort to meet the need to improve the
quality of life without damaging ecosystems or natural resources in meeting all the
needs of life. Sustainable development conceptually contains two important ideas,
namely needs and limitations that are clarified with limitations. The limitations in
question are those that are related to technology, social organization, natural
resources and the environment as a result of all human activities (Kates, et al.
2005). In essence, sustainable development is a process of change in which all
activities such as resource exploitation, investment direction, orientation of
technological development and institutional change are in harmony and increase
the potential of the present and future to meet human needs and aspirations (Fauzi
& Oxtavianus, 2014). So that development goals, in addition to paying attention to
economic and social aspects, must also consider environmental aspects that are
carried out in a sustainable manner.
The pillars of sustainable development consist of various aspects, including:
economic, social and environmental aspects that have a relationship between one
aspect and another. The relationship between the three aspects in a balanced
manner will achieve sustainable development. Economic and social relations are
expected to be fair, meaning that they can create and guarantee social justice in
the distribution of income and social services. The economic relationship with the
environment is expected to continue, meaning that it can maintain stable
economic growth by saving resources and energy in a sustainable manner. Social
relations with the environment are expected to survive, meaning preserving the
ecosystem for future generations.

Figure 2.1 Relationship of Sustainable Development Aspects
Table 2.1 explains the linkages in achieving sustainable development. In the
economic aspect to alleviate poverty , there are several impacts that must be
considered, namely social and environmental aspects. Likewise, efforts to achieve
improvements in human development must consider the impact that occurs on
economic and environmental aspects. Likewise, in the environmental aspect, in an
effort to preserve the environment, it must consider the impact that occurs on
economic and social aspects.
Table 2.1 Linkages of Sustainable Development Aspects
Aspects Economics Social Milieu
Economics People's alleviation Related impacts Poverty-related impacts
Social Impact related to human development Impact related to the environment Impact
related to ecosystem conservation
Source: Rozikin, (2012)
The concept of sustainable development can be broken down into 3 aspects
of understanding, including: (1) sustainability in the economic aspect is defined as
development that is able to produce goods and services continuously to maintain
the continuity of government and avoid sectoral balances that can damage
agricultural and industrial production. (2) Sustainability of the social aspect is
defined as a system that is able to achieve equality, provision of social services
including health, education, gender, and political accountability. (3) sustainability of
environmental aspects must be able to maintain resources stably, avoid exploitation
of natural resources and environmental functions. The concept of environmental
Economics Social
Milieu
SD
Fair

sustainability concerns the maintenance of biodiversity, air space stability, and other
ecosystem functions that are not included in the category of sources (Fauzi (2004) in
Jamaludin (2016)).
2.1.2 Concept of Sustainable Regional Development (SRD)
The concept of Sustainable Regional Development (SRD) refers to the
integration of aspects of sustainable development (Sustainable Development) into
sustainable regional development. The integration of this aspect of sustainable
development resulted in the concept of sustainable regional development or
Sustainable Regional Development (SRD). The SRD concept refers to the integration
of sustainable development principles into regional development (Clement, et al.
2003). Therefore, according to Clement, et al. (2003) SRD involves activities and
instruments that promote development into regional development initiatives
(Erlinda.2016). Sustainable development has shifted its focus to the regional or
regional level, this is because the role of the region is very important as an
intermediary for local and national interests and can be used as a more operational
analysis tool. At the regional level, sustainable development plays a role as a
consensus from the development of a sustainable development concept which is an
important component of regional development in the future.
The definition of regional development is based on integrated community
development covering various aspects such as social, economic, environmental,
health, technological and cultural aspects in a certain area. Territorial
development now includes broader regional policies, ranging from socio-
economic processes that can be governed in more specific and focused political
and cultural relations. However, the current development of the region shows a
very worrying situation so it is necessary to return to review the economic
development paradigm. Sustainable regional development is expected to carry
out actions on aspects of development in coordination in various regions that
produce economic growth without damaging natural resources.
The concept of sustainability has meanings, among others: the sustainability
of a development process requires integration and linkages between social,
economic and ecological problems. All sustainability concepts are based on the
needs of different regions, so this concept requires a lot of knowledge about how to

deal with different interests. The application of the concept of sustainable
development at the regional level must consider the local needs of a region
Sustainable development at the regional level is oriented towards products and
processes. The meaning of orientation to products and processes is that the value
provided by the region to its users and focuses on the fundamental processes that
occur in this region. This fundamental process is closely related to the process of
preparing regional development strategies and broader regional planning concepts.
The main issue in the preparation of this strategy is closely related to how to
achieve the goal of sustainable regional development by using existing resources
without damaging them. This is a big challenge for local governments in making
decisions in managing natural resources that require participation in external
environmental management. External variables have the most important influence,
namely the existence of sophisticated technology or regional competitiveness.
These external factors can directly impact the formulation of regional development
strategies. Therefore, regional authorities have the duty and responsibility to
maintain a balance between economic, social and environmental aspects efficiently
in accordance with the principles of sustainable development. The sustainability of
the development area is realized through the integration of aspects of sustainable
development implemented through sustainable regional development strategies
and programs.
2.1.3 Regional Planning Theory
In the concept of planning and implementation of development,
One of them is through a regional approach. According to Law No. 26 of 2007
concerning spatial planning states that a region is a geographical unit along with all
elements related to its boundaries and systems which are determined based on
administrative aspects or functional aspects. In a region, there are several regional
characteristics that need to be known, including: 1) Developed regions, 2)
Developing regions, 3) Undeveloped regions and 4) Undeveloped regions (Anwar,
2005 in Pahlevi, 2014).
An area is said to be advanced if it has characteristics as a center of growth
where this area has the center of population growth, industry, potential markets
and government. Regions are said to be developing, have good accessibility to

developed regions, and have high natural resource potential and income, but do
not experience high social cost pressure. The region is said to be undeveloped and
has the characteristics of a low growth rate and has not been able to manage
existing resources as well as population density, income, and education levels that
are still relatively low. Meanwhile, an area is said to be undeveloped if the
potential of existing resources is not managed properly and tends to be exploited
by other regions so that the area does not develop and grow.
Regional planning or regional development planning is basically a
systematic activity that aims to make changes towards development for the better
by utilizing the potential of existing resources and providing benefits or
contributions to the development of a region. The idea of regional planning began
to be discussed in the 1920s when the thinking of the approach to regional
planning was formally stated (Friedman, 1978 in Saraswati, 2006). Regional or
spatial planning was initially seen as a physical application to a residential
environment. However, in planning, there is a process that continues to develop
from regional welfare to community welfare and economic welfare to sustainable
development welfare.
The process of economic growth and equitable development becomes
an important issue and has received attention by several economists in regional
development efforts. According to Archubugi (2008) and Soares, et al (2015)
there are four components based on the application of regional planning theory,
including:
1. Physical Planning
This planning theory discusses the arrangement of the physical form of the
city with the network of urban infrastructure that connects several activities. In
the development of this theory, environmental aspects have been studied and
included. Examples of this area planning are spatial planning, residential locations,
agglomeration, provision of public facilities and land use.
2. Macro Economic Planning
Regional or regional economic theories also use the same theories as
macroeconomic theories related to economic growth, economic development,
income, income distribution, labor, consumption and investment. Therefore,
regional macroeconomic planning is to encourage regional economic policy

making to increase regional economic growth. An example of this planning is by
making policies for the accessibility of financial institutions, job opportunities and
others.
3. Social Planning
In social planning, the government is directed to make a policy to encourage
social development programs in the region such as education, health, basic ability
of the population, skills and criminal problems.
4. Development Planning
This development planning is interrelated with comprehensive development
program planning to achieve regional development.
2.1.4 Enviromental Kuznet Curve
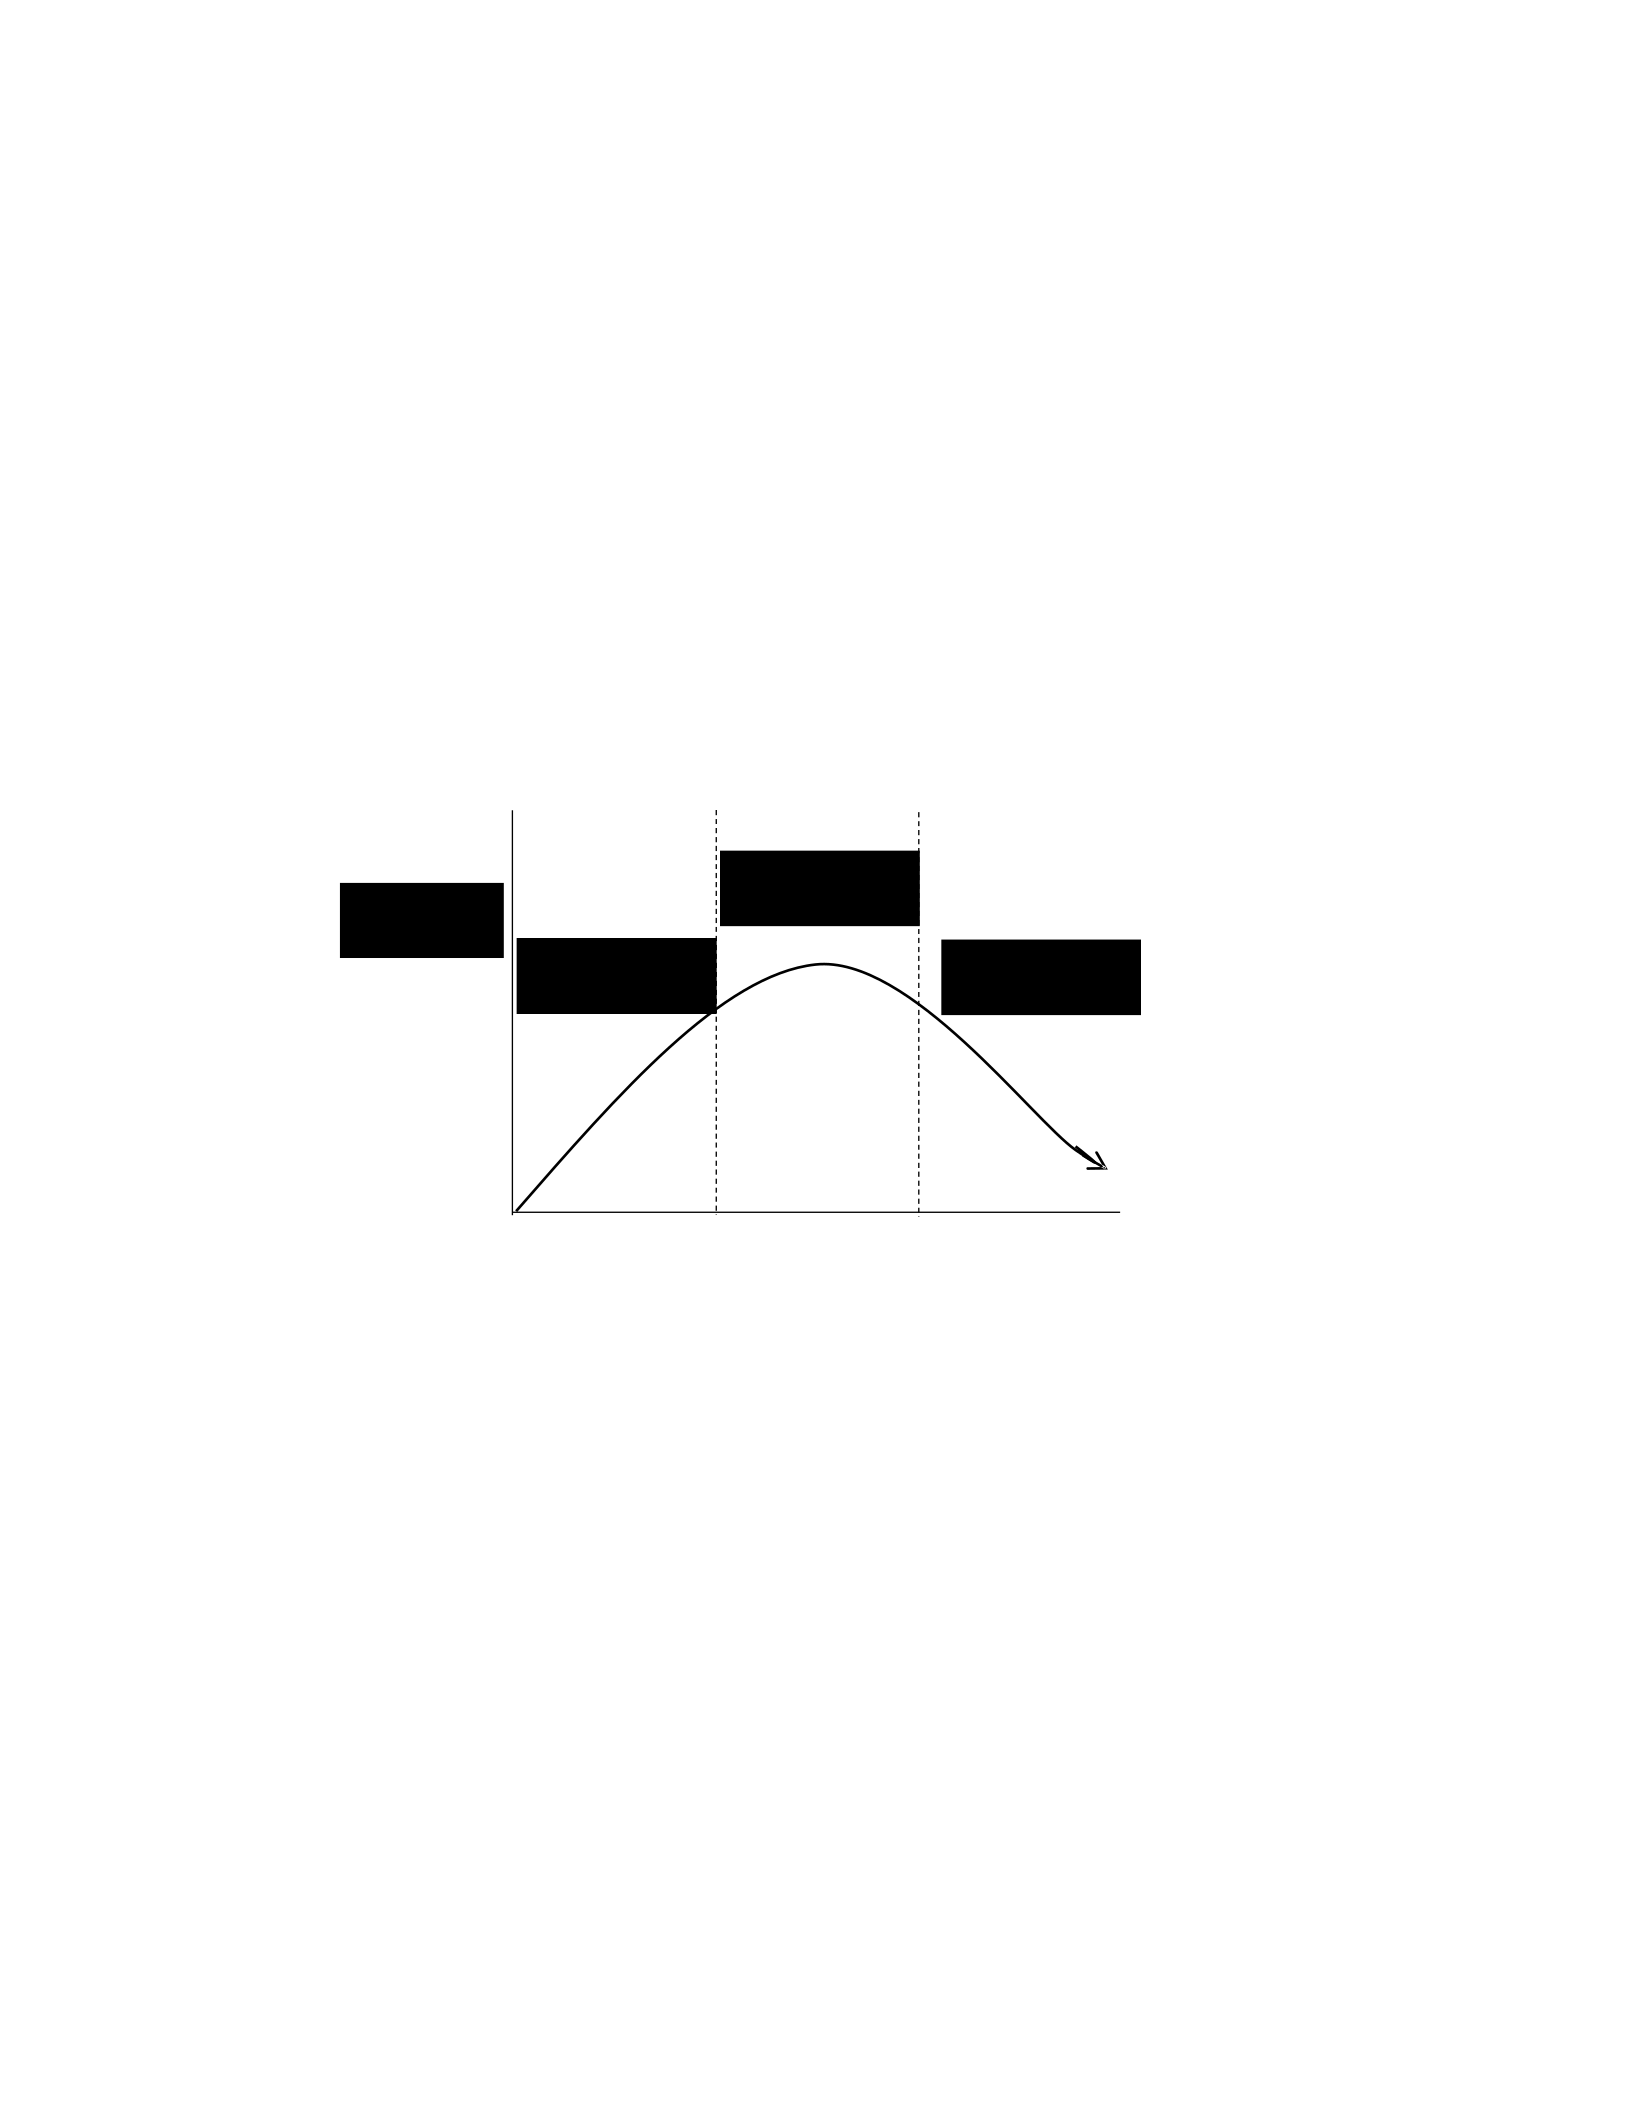
The Enviromental Kuznet Curve (EKC) is one of the hypotheses used to
explain and identify the relationship between economic growth and the
environment (Grossman and Krueger (1991) in Susianti (2018)). Simon Kuznet is
the pioneer of the Enviromental Kuznet Curve (EKC) hypothesis which describes an
inverted U-shaped curve that explains the long-term relationship between
economic growth and environmental quality, where environmental damage in
future generations is caused by development or economic growth itself. In other
words, the Environmental Kuznet Curve (EKC) explains that a country with a low
income level will tend to focus more on increasing income so that it does not pay
attention to the impact of environmental quality in future generations.
Kuznet describes the evolutionary changes in economic growth inequality,
usually using data in a time series. Income inequality increases because many
residents urbanize to an area that has a higher income than the area where they
originally lived (Kuznet (1995) in Susanti (2018)). Kuznet assumes that if the
uneven distribution of income increases along with changes in the economic
growth of a region, but after reaching the maximum point, the inequality will
decrease along with better and more efficient economic growth (Erlangga, 2019).
The success of economic development is synonymous with increasing
economic growth or per capita income. This increase in economic growth will also
trigger an increase in environmental degradation or inequality to a certain turning
point. So after passing the turning point, there will be an increase in economic
growth which will be followed by a decrease in environmental degradation.
Economic activities that are carried out continuously destructively result in a
decrease in environmental quality in the form of water, soil and air pollution. The
increase in economic growth will make people aware that environmental quality is
very important.
In the Eviromental Kuznet Curve (EKC) figure above, it explains the process of
the relationship between changes in economic structure and economic growth in a
country. Panayotou (2003) in Susianti (2019) divides the Eviromental Kuznet Curve
(EKC) into 3 stages, including:
Figure 2.2 Enviromental Kuznet Curve (EKC)
Source: Panayotou (2003) in Susianti (2019)
1. Pre-Industrial Economy
At this stage, economic development carried out by a country is
accompanied by an increase in environmental damage. The change in industrial
processes starting from small industries to large industries will increase the use of
natural resources. In other words, changes in the economic structure from rural to
urban areas carry out mass production and excessive consumption resulting in a
further decline in environmental quality. The decline was caused by a change in the
economic structure that came from industries that were increasingly sophisticated
or heavy energy-based to industries and services based on advanced technology.
2. Industrial Economy
At this stage, a country will increase its industry as part of the process of
forming a stable domestic product in a country. This process will encourage a shift
in the economic structure from the agricultural sector to the industrial sector. The
Degradation
Milieu Economy
Pre-Industrial
Economy
Industry
Economy
Post-Industrial

shift towards increasing the stage of industrialization will lead to environmental
degradation, such as pollution or increased air pollution. The agricultural sector
and the use of natural resources are increasingly intensively carried out so that the
decline in natural resources or the intensity of waste produced is also increasing.
3. Post-Industrial Economy
At this stage, the shift in economic structure continues to occur from the
industrial sector to the service sector which has more sophisticated and efficient
information and technology. This shift in economic structure will cause a decrease
in environmental degradation in line with an increase in income, causing an
increase in the intensity of air pollution or pollution as a result of the demands of
economic activities to increase output. Thus, countries that have a high level of
income reflect the post-industrial economic structure or service economy, but the
awareness in paying attention to the environment is increasingly being considered.
Environmental awareness has unconsciously brought about better
changes to carry out environmentally friendly development. So that the
movement of the EKC curve begins to reach equilibrium by bringing
Changes and advances in the industrial sector that consider the environment and for
the better, the community can better appreciate the environment and government
regulatory policies are expected to be more effective and efficient. If this hypothesis
is proven, then increasing income is one of the right ways to improve the
environment. Meanwhile, if this hypothesis is not proven, government intervention
is urgently needed to reduce environmental degradation and realize the concept of
sustainable development.
2.2 Previous research
Some of the empirical studies used as reference materials and references
in this study are sourced from previous studies that are briefly explained.
Fauzi and Oxtavianus (2014) in their research entitled The Measurent
Sustainable Development Indonesia which resulted in development in Indonesia
showing that development in Indonesia shows an imbalance between economic,
social and environmental development. Development in Indonesia focuses more on
the economic aspect and puts pressure on the environmental aspect as a result of
the development itself. The use of the sustainable development index shows

suboptimal achievements. So that this study provides one of the empirical evidence
that the balance between the dimensions of economic, social and environmental
development is needed in sustainable development.
Erlinda (2016) in a study entitled Sustainable Regional Development Policy
in JAMBI Province Through the Model Flag Approach which resulted in an analysis
of development sustainability in Jambi Province with a business as usual scenario
tended not to pass the sustainability test with the emergence of yellow, red and
black flags in various strong, medium and weak sustainability scenarios.
Pratiwi, et all (2018) with their research entitled Analysis of the
Implementation of Sustainable Development in East Java resulted that
development in East Java Province has not shown sustainable development related
to its relationship with economic, social and environmental aspects. The factors
that most affect the economic aspect are poverty and the basis of the economic
structure. Meanwhile, in the social aspect, namely, population density and crime
levels and factors that affect environmental aspects, namely the percentage of
land area.
Rosana (2018) in her research entitled Environmentally Friendly
Sustainable Development Policies in Indonesia resulted that development has a
close relationship with the environment. However, the development carried out
does not provide benefits to the environment which will ultimately have an
impact on the extinction of life for future generations.
Wibowo, et all (2015) in their research entitled Sustainability Status of
Development of Ecological Dimensions in Fisheries-Based Sustainable
Development of Minapolitan Areas which resulted in the ecological sustainability
status of Minapolitan area development in Magelang Regency showed a fairly
sustainable status with an index value of 65.90 on a sustainability scale of 0-100.
Ridwan and Setiawan (2013) in their research entitled Assessment
The level of Development Sustainability in Bangkalan Regency as a Disadvantaged
Region which results in development inequality between economic, social, and
infrastructure aspects and environmental aspects. Development in economic,
social and infrastructure aspects is in a less sustainable status. However, the
sustainability status on the environmental aspect shows that it is not sustainable.
Margiyono (2018) in his research entitled Development

Sustainable Development Model in East Kalimantan Province. Results of Analysis
RSA shows that the regional aspects of the three cities are; Balikpapan, Samarinda
and Bontang are heading towards unsustainable, even Balikpapan has reached the
criterion of cronic unsustainable, while seven districts tend to still be sustainable
except for East Kutai but the average value has decreased.
The problem of regional sustainability for the economic dimension is influenced
by, poverty and unemployment; The environmental dimension is more by the
height of critical land and the mining sector, then the social dimension, caused by
the high number of traffic accidents and divorces. Then the results of BCA's
analysis show that development in East Kalimantan Province experiences high
development "costs" of up to 83 percent of GDP, while the ratio of "Benefit" to
GDP reaches an average of 64 percent. The results of BCA's analysis placed East
Kalimantan in the criterion of "cronic unsustainable", further based on the results
of the natural resources analysis for the next 50 years (20192069) East Kalimantan
Province remains in an unsustainable situation.
Rozikin (2012) his research entitled Implementation Analysis
Sustainable Development in Batu City, which produces high natural resource
potential in Batu City, makes people use natural resources as a place to live
because it requires high awareness and community participation. Agropolitan
policies have not run optimally, so the poverty rate from year to year cannot be
associated with the success of agropolitan policies. The socio-cultural balance in
the implementation of agropolitan is very minimal, this is because many things
have not been coordinated and guaranteed properly in agropolitan policies.
Lestari and Firdausi (2017) in their research entitled The Role of the Batu
City Government in the Implementation of Tourism Development Policies Based
on the Sustainable Development Paradigm (Sustainable Development) resulted
that the implementation of tourism development policies in Batu City is in
accordance with the principles of sustainable development, namely pro-economic
welfare, sustainable environment, social justice and the environment. The role of
the government in the success of tourism development policies based on
sustainable development is to make policies in general and licensing regulations
as well as policies that favor the community and control private parties that invest
in Batu City.

Nurmalia (2008) in her research entitled Analysis of the Index and
Sustainability Status of the Rice Availability System in Several Regions of Indonesia
resulted that the RAP Rice method is good enough to be used as a tool to evaluate
the sustainability of the rice availability system at the regional level or several
regions in Indonesia.
Oxtavianus (2014) in his research entitled Sustainable Development and Its
Relationship with Social Capital in Indonesia which resulted in high progress in the
economic, social and institutional fields showed low progress and a decline in the
environmental field. The increase in Indonesia's sustainable development index
only indicates sustainable development in the short term, but not in the long
term. The relationship between development and social capital shows that there
is a tendency for regions whose development is more advanced, but there is a
decrease in social capital.
Bartniczak and Raszkowksi (2018) in their research entitled Sustainable
Development in African Countries: An Indicator-Based Approach and
Recommendations for the Future found that in Africa the level of sustainable
development increased quite significantly from 2002-2016. The positive increase
from each country in Africa indicates unfavorable conditions for the epidemic
situation. African countries are aware of the importance of sustainable
development goals. Policy recommendations directed for the future must contain
the principles of sustainable development.

No. Research Method
1.
Table 2.2 Previous Research
Researcher and Year
Heading
Ahmad Fauzi and Alex The Measurent of - Quantitative Methods in Builder
Oxtavian (2014) Sustainable
Development
Indonesia
the scope of descriptive analysis. not yet
in Analysis Descriptive
Exploring data in the form of
tables and graphs.
- Composite index for
environmental
development.
more
Download
The economy
and
environmental
aspects of the
PE index are
optimal. Seh
said that the
use of the
environment
do valuation
building
Sustainable (IPB)
2. Novita Erlinda (2016) Policy
Building
Region
Sustainable at
Quantitative and Qualitative
models , through the flag
model approach.
The flag model indicates the
value of the critical limit for
the sustainability of regional
development.
Analysis of
the Province
of Jam as
usual c yellow
sustainability,
mer the
scenario of
weakness.
Province JAMBI
Through Approach
Model Flag

3. Nickel Pratiwi, Dual Analysis of the Implementation of the Quantitative Tariff Method
Implementation
Mind Santosa and Development Javanese Team
Khusnul Ashar (2018) Sustainable in Java builder
East Conjunction
economy, so
the most
economical
yes
Perk
structure of
social
aspects and
level of
influence,
namely
persent
4. Mira Rosana (2018) Policies Descriptive Method Builder
Building with route
Sustainable that builder
Insightful In fact,
Milieu at against Ling
Indonesia will berd
your life is
coming.

5. Arif Budi Wibowo, Sustainability Status Sutrisno Anggoro Status and Development quantitative
descriptive method using developer coordination techniques
Bambang Yulianto Multidimensional RAP Ecological Dimension (Rapid Regency M (2015) in the
Development of Appraisal for Quite
Minapolitan Multidimensional Area) 65.90 at SK
Sustainable
Based Fishing

m
Freshwater Aquaculture
in Regency
Magelang
6. Yennita Hana Ridwan and
Rulli
Anonymous
Setiawan (2013)
Valuation Level of Quantitative Descriptive Method
Sustainability with Scoring. Development Techniques in
scoring is the method of
Bangkalan Regency gives scores to each
as the Region of each Laggard variable is used.
It is known
that there is a
gap between
the e aspect
and the aspe
at Aspects
Sustainable
infrastructure
sustainability
shows
7. Margiyono, 2018 Development of Quantitative Method Models
Development Data Analysis: Sustainable Regional in
the Sustainable Account (RSA) of Kalimantan
Province and System Dynamic Analysis
East (SDA)
The results of
Anal that, in
the city,
namely;
Bontang me
Balikpapan
cronic unsu
regency c
except Kut
the value
Problems for
the critical
environmental
poverty
dimension
and social
dimension
Accident
The results of
the analysis of
the year that
Kalimantan
Province is
unsustainable
in the situation
of the
8. M. Rozikin (2012) Implementation
Analysis
Building
Sustainable in the city
Stone
Qualitative Methods The potential
of natural
resources
makes natural
resources as
an optimal
agropolitan
community,
year after year
with
agropolitan. K
on minimal
plastics, things
that have not
been
well d
9. Asih Widi Lestari and
Firman Firdausi (2017)
The Role of the Batu
City Government in
Implementation
Policy
Building
Tourism
Descriptive research method:
qualitative approach.
Interactive model analysis by
Miles & Huberman by means
of data collection,
Data reduction, data
presentation
Tourism
implementation
d
with Pri
sustainable
welfare of
social justice

y
y
By
Paradigm
Building
Sustainable
Development)
and conclusion. Role Pem
licensing
policy se in
the Batu
private
sector.
10. Nurmalia, R., 2008 Analysis of the Index
and Sustainability
Status of the Rice
Availability System in
Several
Region of Indonesia
Method analysis:
technique RAP-RICE
coordination through Multi
Dimensional method
Scalling (MDS) and prospective
analytics
Based on 23
attributes,
attributes or
influential
key factors
that are m
factors, even
if they are
strong, show
that one of
the
sustainability
at the re
level in
Indonesia is
quite good.
11. Alex Oxtavianus (2014) Building
Sustainable and
- Analysis Descriptive
Quantitative
Composite index
The results
of social
progress and
progress of
decline in
continuous
increases
indicate
Its relationship with -
Capital Social at
Indonesia
sustainable
but not the
relationship
of the social
menu to the
more
advanced da
j social
capital.
12. Ricky Jordan
Sugiarto (2016)
and Grouping
Regency/City in East
Java Province Based on
Indicators
Building
Sustainable
20132013
-
-
Self Organizing Method
Map (SOM) to find out
the distribution pattern of
growth centers in a region
using cluster analysis.
Major Component
Analysis (AKU) to see the
shaping variables in the
regional grouping.
The results of
the
researchers
are good
Cluster is
including k
Sumenep, B
variable yes
has nil
murder
No amount
of PE
The Living
Lighting of
Community
Forests also
requires the
suitability of
Stra services
in the Den
area that is
built
13. Bachril Bakri (2016) Assessment of
Regional Sustainable
Development in
Flag Method The results
of the
construction
pencil reach
be

S
Indonesia Business As
sustainability
indicators
MEA and
(BAU)
builders
Indonesia's
Sustainable
Development
Scheme, s
shows that
the region in
Indonesia
can be
Better un
14. Bartosz Bartniczak and Sustainable
Andrzej Raszkowksi Development in
(2018) African Countries: An
Indicator-Based
Approach and
Recommendations for
the Future
Synthetic Measure of
Development (SMD) be
method that Used
to judge
implementation building
Sustainable at country
Afrikaans.
The country's
penel results
in A are
significant
improvement
in each
country's
conditions
where the
situation is
moderate to
sustainable
pentine,
which is
directed to
come to the
builder's
15. Ana Vovk Korze The Need a (2014)
Sustainability Strategy for Regional
Green English
economist Paul Ekins
based on assessment analysis
techniques
The results
of the pe
program are
not memp

Regional
shows that it
must go to
the
government
No.
1.
Researcher and Research Year Equation
Ahmad Fauzi and Alex Oxtavianus The equation in this study is TAvailability beb
(2014), The Measurent of Sustainable
Development in
Indonesia
The purpose is the same to find outthe sustainability of
the region, the indicators that havebeen used in the
past include: GDP, HDI inthis research and IKLH and
using the methodof six analysis of the Development
Index of theroad
Sustainable (IPB). jAlso use
myou don't
know the
continuation in
2. Novita Erlinda (2016), Policy
Building Region
Sustainable in JAMBI Province
The similarity in this study is not onlythe perbe of the
objectives to be studied, but also the indicators that are
used, namely GDP and HDI. d use no
Development
Programmes- Using
the Example of the
Podravje Region in
Slovenia
environmental impact and
strategic environmental
testing.
and the
building
environment
year 2009 in
Podravje
economy,

2.3 Similarities and Differences with Previous Research
Table 2.3 Similarities and Differences of Previous Research

Digital Repository of the University of Jemberr Digital
Repository of the University of Jemberr
Through the Flag Model Approach Analysis methods
used for the
development of
d Flag. While aB
Index analysis
continues. aGIS
analysis
pembangunan b
3. Niken Pratiwi, Dwi Budi Santosa The equation in this study is Tercan perbe and Khusnul Ashar
(2018), The analysis aims to find out what are the indicators of the Implementation of
Sustainable Development of regional development. Sustainableresearch in East Java Research
methods used by PDRB, IPM,
Same using method bHealing the road Quantitative.
tEranmen
serect penel
aanalysis I
How to use it
Continuedin
4. Mira Rosana (2018), The Policy of Equality in this study shows that there is a Sustainable
Development perspective that from the same goal knows that itis a research
Insightful Milieu in the sustainability of development. mEtode Desk
Indonesia mUse m
muse a mto
know
thecontinuation
in
6. Yennita Hana Ridwan and Rulli Pratiwi
Setiawan (2013), Assessment of
Development Sustainability in
Bangkalan Regency as
Disadvantaged Areas
The similarities in this study can be
seen from the same objective, namely
to know the sustainability of
development and the indicators used,
namely GDP and HDI. berobat road d a
analysis of the
researcher
teknik
coordinates
Appraisal for M
u
I
d
5. Arif Budi Wibowo, Sutrisno Anggoro
and Bambang Yulianto (2015),
Sustainability Status of Development
of Ecological Dimensions in Regional
Development
Sustainable Minapolitan Based
Freshwater Aquaculture Fisheries in
Magelang Regency
The similarities in this study can be
seen from the same goal of knowing
the sustainability of development.
There is a
perbe, which is
ecological
research,
3 PE Dimension
(economics
Numbers
Ithe principal of
this research
PDRB, IPM, I

Digital Repository of the University of Jemberr Digital
Repository of the University of Jemberr
dalam research IPB and GIS u
pembangunan b
Terdime terr m pembangunan sosial, the
environment swhile muse dan
environment
pthis research IKLAH.
Presearch is
described as a
IPB and GIS u
development b
7. Margiyono (2018), Development of Equations in this study, namely There is a perbe The
Sustainable Development Model aims to Knowing PThis is a
In East Kalimantan Province sustainability of regional development. IKLH. Researcher aBE Data
Analysis
Account (RSA
Aanalysis (SDA)
menguse a
mengetahui
Continuedin
8. M. Rozikin (2012), The Equation Analysis in this study is TAvailability Perb
Implementation Development of the goal to Know tIn the past, Meng
Sustainable in Batu City sustainability of regional development. sDangangan Pene
dQuantity Exclusion
9. Asih Widi Sustainable and The Word of Equation in this study is TAvailability Perb
Firdausi (2017), The Role of the Government to Know tEranmen
City Stone deep Implementation of regional development sustainability. interactive by M
Tourism Development Policy Previous research by researcher cPengump ara
By The paradigm is the same using the descriptive method pData Presentation
Building Quantitative sustainable. pMeng Research
(Sustainable Development) GIS to
PEmbangunan B
10. Rita Nurmalia (2008), The Equation Analysis in this study is TAvailability Perb
Index and Sustainability Status of its objectives to judge T statuserused mene
System Availability Rice in sustainability. bEras keep
Some Regions of Indonesia kSustainability PE Leading researcher in technical analysis o
Multi D method and pro analysis sEkarang Meng
GIS to
PEmbangunan B
11. Alex Oxtavianus (2014), The similarities in this study other than TGet Perbe
Building Sustainable and the goal to be achieved, namely yThat's the researcher t The
relationship with Social Capital is the same indicator using GDP pembangunan in Indonesia and
IKLH and using analysis sOsial, Environment Index Composite S developmentStretch PE
continuous in the analysis method (Economics, Social quantitative descriptive. dNature Researcher

Digital Repository of the University of Jemberr Digital
Repository of the University of Jemberr
IKLH. Researcher hPond Pem dWith capital m Adescriptive analysis 12. Ricky Jordan and Sugiarto
(2016), The equation in this study is the same as TGet Perbe
The grouping of districts/cities uses the GDP indicator. yThat's the indicator
East Java Province Based on PDRB, HDI
Development Indicators tEranmen Sustainable 2013-2013 Organizing Ma
Klaster. Keep
aIPB analysis da
sdistribution of
Javanese Pearl.
13. Bachril Bakri (2016), Assessment of The equation in this study is T Get Perbe The goal of
Regional Sustainable Development is to assess the status, namely indicators in Indonesia's
sustainability. IKLH. Researchers
Model analysis
using a
knowledge of
the
continuation in
14. Bartosz Bartniczak and Andrzej The equation in this study is TGet Perbe
Raszkowksi (2018), Sustainable goals to judge Status YThat's the indicator
Development in African Countries: sustainability. PDRB, IPM
An Indicator-Based Approach and menguse a Recommendations for the Future of Development
yang is used in
thedevelopmen
t of Africa
While
ananalysis of
IPB da
sdistribution of
Javanese
people.
15. Ana Vovk Korze (2014), The Need The equation in this study is that itcan be found a
Sustainability Strategy for its purpose to assess the status of Regional Development
Programmes indicators - sustainability and GDP indicators. SEkarang Meliu
Using the Example of the Podravje Previous Researchers with Researchers PResearch
Region in Slovenia Now the same Researching 3 G aspectreen English
e sustainable development. dbase pad dampak Lingk
lSurroundings yes
pResearch
Download
ananalysis of
IPB da

Digital Repository of the University of Jemberr Digital
Repository of the University of Jemberr
sdistribution of
Java Island.

2.4 Conceptual Framework
Regional development on the island of Java can be known through economic
growth which shows that economic activities are still concentrated on the island of
Java. The success of economic growth is a challenge that must be considered in
managing natural resources as best as possible and wisely in their use. However, the
focus of development is not only related to increasing economic growth but also how
the development can last until the next generation. This is also stated in the direction
of the national policy for regional development contained in the National Medium-
Term Development Plan (RPJMN 2015-2019) that efforts to increase economic
development in all growth centers must refer to regional spatial plans and strategic
environmental studies to maintain the balance of nature, ecosystems and the
surrounding environment.
In theory, regional planning was initially seen as a physical application to the
residential environment. However, in the regional planning, there is a process that
continues to develop from regional welfare to community welfare and economic
welfare to sustainable development welfare.
The theory of sustainable development also emerged as a result of the
existence of issues related to the environment. This theory is based on the growth of
development that focuses on the economic aspect and its carrying capacity, namely the
environment or natural resources that are not renewable. In addition, sustainable
development can occur if there is a balance between economic, social and
environmental aspects. The integration of this aspect of sustainable development
resulted in the concept of sustainable regional development or Sustainable Regional
Development (SRD). The concept of SRD refers to the principles of sustainable
development into regional development (Clement, et al. 2003).
This is also explained by the kuznet hypothesis which describes an inverted U-
shaped curve that explains the long-term relationship between per capita income or
economic growth and environmental degradation. When passing the turning point on

the inverted U curve, there will be an increase in economic growth which will be
followed by a decrease in environmental degradation.
This study aims to find out how the condition of economic development in the
Java Island region is. Then, to find out the application in the process of sustainable
regional development (Sustainable Regional Development) in economic, social and
environmental aspects. In conducting an analysis of the sustainability of regional
development, several indicators are used from each aspect of development. Indicators
used in the sustainable development aspect include GDP per capita and the Open
Unemployment Rate (TPT) from the economic aspect, HDI and % of the population on
street medicine from the social aspect, as well as IKLH and proper sanitation from the
environmental aspect. Then, from some of the indicators used, the development of
the sustainable development composite index will be carried out.
The sustainable regional development composite index is an analytical tool
used to determine the sustainability of regional development. The sustainable regional
development composite index is a combination of several composite indices, namely
the economic development index, the social development index and the environmental
development index. The resulting composite index of sustainable regional development
will explain and indicate whether regional development on the island of Java is in
accordance with the principles of sustainable development. The results of the analysis
of the sustainable development index will be mapped through the Geographic
Information System (GIS) approach so that the spatial distribution of sustainable
development on the island of Java will be known.
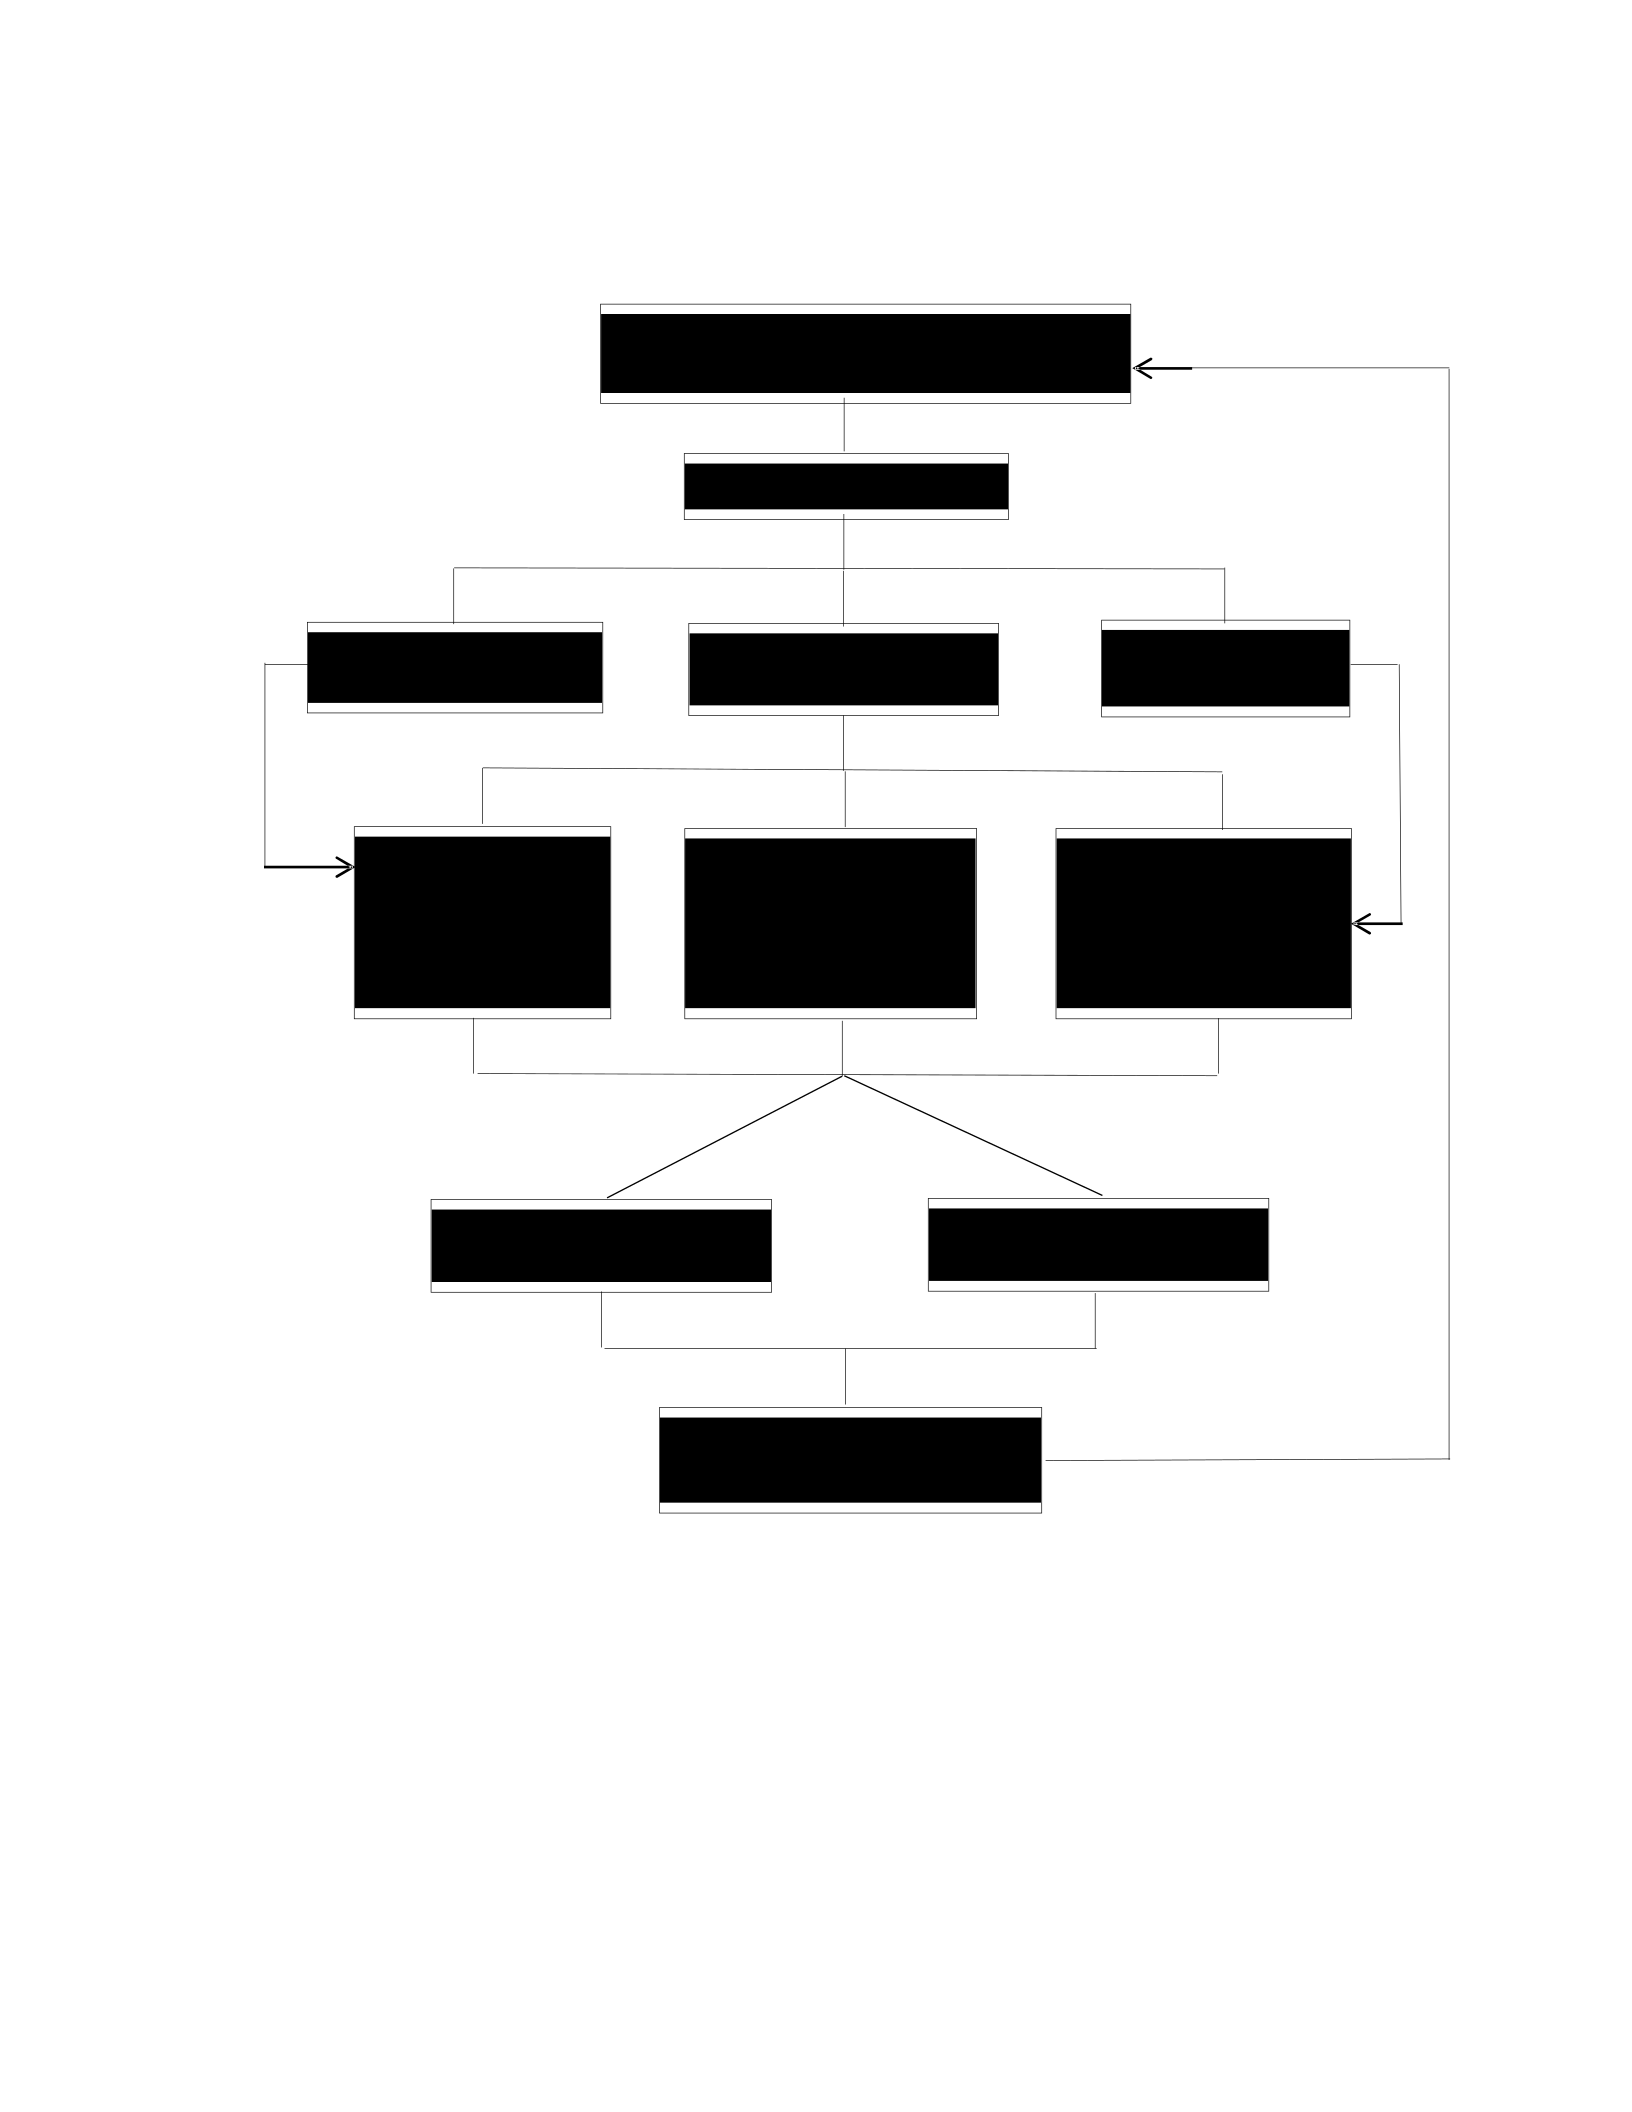
Figure 2.3 Conceptual Framework
CHAPTER 3. RESEARCH METHODOLOGY
Planning Theory
Region
Development Theory
Sustainable
Economic Aspects
GDP
Per capita
TPT
Regional Development
Sustainable
Regional Development
Java
Enviromental
Kuznets Curve
Social Aspects
HDI
Percentage
the population
Outpatient
treatment
Environmental Aspects
IKLH
Proper Sanitation
RPJMN 2015-2019
Development Conditions
Economics
Development Distribution
Sustainable

3.1 Research Design
3.1.1 Types of Research
The type of research used is quantitative descriptive research using
secondary data obtained from the Central Statistics Agency (BPS), Statistics
Indonesia, the Ministry of Environment and Forestry (KLHK), journals and previous
research results.
3.1.2 Research Time and Location
This research was carried out in Indonesia in 2014-2018. The location of the
research is Java Island in Indonesia. Java Island consists of 6 provinces in Indonesia,
namely, DKI Jakarta, West Java, Central Java, DI Yogyakarta, East Java and Banten in
2014-2018. The selection of Java Island as the research site because the growth rate in
2014-2018 on Java Island shows a considerable increase in the growth rate, which can
be seen from the GDP on the base price of cash in 2010 from 2014 of 5.57% and in 2018
by 5.72%. The increasing economic condition (GDP) is an increase and progress of
destructive development as explained by Fauzi, (2012).
3.2 Types and Data Sources
The type of data used in this study is secondary data obtained from various
sources and literature related to the research objectives. Secondary data is obtained by
collecting data through various literature, scientific books, journals, previous research,
and references related to research. The data in this study uses a period of 5 years,
namely in 2014-2018. In this study, data sources published by the Central Statistics
Agency (BPS), Statistics Indonesia, Ministry of Environment and Forestry (KLHK) were
used.
3.3 Data Analysis Methods
The data analysis method used in this study is using the Klassen Typology, the
Sustainable Development Composite Index (IPB) and the Geographic Information
System (GIS). The explanation related to data analysis is as follows:

3.3.1 Klassen typology
The classy typology is an analytical tool used to find out an overview of the
pattern and structure of regional economic growth. The pattern and structure of
economic growth of each region or province divides regional typologies based on the
average economic growth and GDP per capita.
Table 3.1 Classification of Classy Typologies
Y
R Ij > Yj YIj < Yj
Quadrant I Quadrant III
RIj > Rj Developed and fast-growing regions Fast-growing area
Quadrant II Quadrant IV
Ij < Rj Developed but depressed districts Relatively underdeveloped areas
R
Information:
Rij : the rate of GDP growth on the basis of constant prices in each province of Java
Rj : average GDP growth rate on the basis of national constant prices
Yij : per capita income of each province on the island of Java
Yj : average national per capita income
This analysis divides into four regional classifications, each of which has different
characteristics, including:
a. Quadrant I is a developed and fast-growing region (high growth and high
income), which is an area that has a higher level of economic growth and per
capita income compared to the national average.
b. Quadrant II is a developed but depressed region (low growth but high income),
which is an area that has lower economic growth, but a higher per capita income
than the national average.
c. Quadrant III is a fast-growing region (high growth but low income), which is an
area with higher economic growth, but per capita income is lower than the
national average.

d. Quadrant IV is a relatively underdeveloped region (low growth and low income),
i.e. areas with lower economic growth and per capita income than the national
average.
3.3.2 Sustainable Regional Development Composite Index (IPB)
A composite index is a collection of several indicators or sub-indicators that do
not have a unit of measurement. Composite index adopted from research
Fauzi and Oktavianus, (2014) which can be considered as a model and its preparation
follows a series of steps as determined so that the resulting composite index
becomes useful and applicable to the public.
According to Segnestam, this composite index has advantages and disadvantages
in conducting an analysis, including:
1.Advantages of Composite Indices
a) Possible index incorporation can produce a clear overview of the problem and can
show performance easily.
b) The combined index also provides easy-to-understand information to the public
about the general state of the problems that occur.
c) The composite index explores the relationship between variables that are directly
related to environmental problems in the context of sustainable development.
2. Disadvantages of composite indices
a) Aggregate values are usually more difficult to assess quality because such
aggregates will eliminate the individual information of each index.
b) Combining indices will be incorrect if it is done by adding various indices with
different units.
c) Index merging is generally difficult to do because it involves the proper weighting of
the constituent indexes.

d) The combined value of the index is only good if it is done for comparison between
regions or countries, but does not necessarily have implications for the ease of
decision-making.
The steps in the preparation of the sustainable development composite index
(IPB) follow the preparation of composite indices in the OECD (2008) and Kondily
(2010), (Fauzi and Oxtavianus, 2014). There are seven steps in the preparation of a
composite index that can be carried out in order, including:
1) Preparation of the Theoretical Framework
The preparation of the theoretical framework is carried out to provide a strong
basis for selecting and mixing single indicators into meaningful composite indicators.
The resulting theoretical framework must be able to accurately determine the
phenomenon to be carried out with the elements that make up a measurement.
2) Indicator Identification and Selection
The identification and selection of indicators used are very necessary and
selected based on their level of reliability, related to the availability of data, spatial
coverage, in accordance with the phenomenon or reality measured and have a
relationship between indicators and each other. Variable merging should be considered
when the data obtained is difficult.
3) Imputation of Lost Data
The imputation of lost data is due to three methods of the case, including:
a) not including records with missing data, b) single imputations as in the example of
substitution with regression, mean or median and c) there are several imputations such
as the Monte Carlo Algorithm (Oktavianus, 2014). Therefore, this study uses a single
data amputation method adopted from the Oxtavianus (2014) study.
4) Data Normalization
Data normalization is needed because there are differences in the unit of
measure in each indicator used. The normalized indicator will produce a comparable
indicator value. The minimum-maximum method is one of the normalization

methods by performing linear transformation of the original data. The data to be
normalized in this method has a value range between 0-100.
This method uses the following formula:
( ) ×100
Ket:
x : The value to be normalized
Min Value: Minimum value limit
Max Value: Maximum value limit
5) Weight Determination
The determination of weights is greatly influenced by the output generated
from the composite index. The indicators used should be balanced according to the
underlying theoretical framework or based on empirical analysis, but can also take
into account expert opinion or public opinion. In general, there are three ways to
determine the same weight as the indicator. In this study, weighting can be done by
utilizing the results of Confirmatory Factor Analysis (CFA).
CFA is one of the Structural Equation Model (SEM) analysis techniques used to
determine whether indicator variables really form the latent variables being studied.
SEM analysis can use one of the statistical software called Lisrel (Linear Structural
Relationship) used to process data that cannot be solved by conventional analysis
tools. SEM analysis has two stages, including measurement models and structural
measurements . The measurement model serves to obtain a feasible latent variable
or fit so that the results can be used for the next stage. The CFA test is used to obtain
a viable latent variable. Meanwhile, the structural model functions to obtain a proper
structural model so that the Goodness of Fit (GOF) test is carried out.
Feasibility testing of CFA models in variable and model measurements

structural using the Goodness of Fit Test (GOF) criteria. There are several criteria
for testing the feasibility of a model as a whole can be seen in the table
Table 3.2 Goodness of Fit Test (GOF) Criteria in Structural Equation Model (SEM)
No. Statistics Fit Criteria Test Results
1. Minimum fit function chi-square (X2) p>0.05 Fit
2. RMSEA <0.08 Fit
3. GFI ≥0.90 Fit
4. AGFI 0.80≤AGFI,0.9 Fit
5. NFI ≥0.90 Fit
6. NNFI ≥0.90 Fit
7. CFI ≥0.90 Fit
8. IFI ≥0.90 Fit
9. RFI ≥0.90 Fit
10. PNFI 0: no fit, the bigger the
fit Not fit
Based on the table above, the criteria for the Goodness of Fit Test (GOF) are generally
grouped into three parts, including: 1) absolute fit measure, this absolute fit examines
the structural model and the measurement model together. The criteria in this section
include, a significant Chi-square value (x2) or a p<0.05 value, Goodness of Fit Index
(GFI) ≥ 0.09 where the larger the better, the Root Mean Square Error of Approximation
(RMSEA) is expected to be smaller than 0.08. 2).
incremental fit or Incremental fit measure, this fit
Compare the proposed model with other established models. Criterion
This section includes, the value of the Adjusted Godness of Fit Index (AGfI) which is
expected to be greater than 0.90, the Normed Fit Index (NFI), Non Normed Fit Index
(NNFI), Comparative Fit Index (CFI), Incremental Fit Index (IFI), Relative Fit Index (IFI) are
expected to be greater than 0.90 which means that the larger the value, the better.
6) Aggregation
The aggregation of indicators used can be linear, geometric or based on
multikeriteria analysis. In both linear and geometric aggregations, the resulting
weights will express the trade-off between indicators, while in multi-criteria analysis
seeks a compromise between two or more of the predetermined goals. The
aggregation carried out in this study uses linear aggregation. Linear aggregation is a

combination of indicators that is carried out by summing each indicator with a
predetermined weight to form a composite index of sustainable regional
development.
∑
Information: xIq : The value of the indicator to i
on the numerical variable to q wq : The value of
the weight on the number to q
7) Presentation and Dissemination of Results
The presentation and dissemination of results is the last step in the preparation
of this composite index. The assessment of sustainable regional development aims to
see the extent of the development process and policies in a region in accordance with
the principles of sustainable development.
Table 3.3 Sustainable Development Index Value
Index Value Criterion
0,00 – 25,00 Bad (Unsustainable)
25,01 – 50,00 Less (Less Sustainable)
50,01 – 75,00 Sufficient (Sufficiently Sustainable)
75,01 – 100,00 Good (Highly Sustainable)
Source: Thamrin (2009) and Nurmalina in Wibowo et al (2014)
Several researchers have previously assessed the sustainability status of
regional development by classifying four sustainability criteria, including, poor
(unsustainable), less (less sustainable), adequate ( moderately sustainable), good
(very sustainable).
3.3.3 Geographic Information System (GIS) Method
Geographic Information System (GIS) or Geographic Information System (GIS)
is one of the information systems that is integrated and used to manage data that
presents information in spatial (spatial) form using maps. GIS was first used in 1960

with the aim of solving geographical problems. According to Liu and Mason (2009) in
Robi (2019) stated that the Geographic Information System (GIS) has developed into
a science and technology that is well established with the development of other
sciences, especially information technology. The ability of GIS to integrate various
information, analyze and present data in the form of mapping based on geographical
location. Generally, GIS is part of analytical techniques in various fields, including:
development planning, assisting in the economic sector, forest management, and
environmental studies.
Geographic Information System (GIS) is also a spatial database system used to
facilitate the process of selecting alternative decisions. This is because GIS combines
several data that is composed of several layers. GIS is able to accommodate the
storage, processing and delivery of digital spatial data and even the integration of
diverse data.
Spatial analysis can be done using ArcGIS software applications by combining
information from multiple layers of data quickly and can be presented in a
geographic format. This analysis process is used to answer questions related to
spatial or space. In conducting this analysis, there are several steps, including:
1) Determining the problem
2) Collecting and preparing data 3) Determining methods and
tools for analysis
4) Perform the analysis process
5) Examining and improving the results of the analysis.
3.4 Operational Definition of Variables
Operational definition is a statement about the definition, limitations,
understanding and taking of variables in research. Meanwhile, variables are research
subjects that become the focus of a researcher's attention. In this study, 3 variables
of continuous development are used, namely variables in economic, social and
environmental aspects. Each variable used in the study uses one sustainable

development indicator. Sustainable development indicators, including: 1. Gross
Regional Domestic Product Per Capita
Gross Regional Domestic Product Per Capita (GDP) is the GDP of an area
divided by the number of people in the area. This PDRBC is an indicator in the
economic variables of sustainable development. The PDRBC used in this study is GDP
on the basis of constant prices that show the real economic growth per capita of the
population of a region.
2. HDI
The Human Development Index (HDI) explains how residents can access the
results of development in obtaining income, health, education and so on. HDI was
introduced in 1990 by the United Nations Development Programme (UNDP) and is
published regularly in the annual Human Development Report (HDR). HDI is a
composite index of a number of indicators to measure the main dimensions of
achieving the status of basic abilities of the population, such as longevity and health,
knowledge and skills as well as accessibility to resources needed to achieve a decent
standard of living (Fauzi and Oxtavianus, 2014).
In other words, HDI is one of the commonly used measures to measure the
level of achievement of economic and social development. HDI has useful benefits to
be able to determine the ranking or level of development in a region. The HDI indicator
is the most important indicator to measure success in efforts to build a decent quality
of life. Therefore, in this study, HDI indicators are used in the social variables of
sustainable development.
3. IKLH
The Environmental Quality Index (IKLH) is a composite index that was relatively
new in 2009 and experienced 4 improvements until 2018. IKLH is a combination of the
concept of Environmental Quality Index (IKL) and the concept of Enviromental
Performance Index (EPI). IKLH can be used to assess the performance of
environmental quality improvement programs and as information in supporting the

policy-making process related to environmental protection and management (Ministry
of Environment and Forestry). IKLH was developed by the Ministry of Environment
(MoEF) in collaboration with the Dannish International Development Agency
(DANIDA) which also developed a province-based environmental index modified from
the Environmental Performance Index (EPI) in 2009. The Ministry of Environment
(MoEF) adopted IKLH developed by Virginia Commonwealth.
IKLH is an indicator of environmental variables in development
Sustainable. This is in accordance with the preparation of the environmental quality
index which is closely related to the needs of sustainable development goals in the
National Development Plan in accordance with Presidential Regulation No. 43
Year 2014. The goals and policies in the 2015-2019 National Medium-Term
Development Plan (RPJMN) are related to strategic issues in the form of improving the
economy, biodiversity, and environmental quality. IKLH indicators consist of river
water quality, air quality and land cover. Environmental quality in coastal areas and
biodiversity conditions have not been indicators in the calculation of IKLH due to
limited data.
4. Open Unemployment Rate
The Open Unemployment Rate is the percentage of the number of
unemployed people in the labor force (BPS). 5. Percentage of the population receiving
outpatient treatment
Outpatient treatment is an activity or effort by households who have health
complaints to check themselves and get treatment by visiting modern or traditional
health service places without staying overnight, including bringing health workers to
residents' homes (BPS). The percentage of residents who received outpatient
treatment during the past month by province and place or method of treatment. This
data is obtained from Statistics
People's Welfare in 2014-2018 published by the Central Statistics Agency (BPS).
6.Proper sanitation

Sanitation is an activity to protect human health through the control,
management and prevention of environmental factors that interfere with health.
Sanitation is feasible to be measured using the percentage of households per district
which has criteria including; (1) The use of separate and shared toilet facilities, (2)
Types of gooseneck toilets, (3) Final disposal sites for tank feces/SPAL (Kustanto, 2015).
In this study, using data on the percentage of households by province and having
access to sanitation is feasible from the publication of the Central Statistics Agency.

