



The Nature and Challenge of Economic Development
Throughout most of history, poverty has been the human condition. For most people life
was, in the words of 17th-century English philosopher Thomas Hobbes, “solitary, poor, nasty,
brutish, and short.” Only within the past 200 years have a handful or so of countries been
able to break the chains of economic deprivation and poverty.
Consider these facts:United Nations Development Program, Human Development Report
2007/2008 (New York: Palgrave Macmillan, 2007).
• Over a third of the world’s people live in countries in which total per capita income in
2005 was less than $610 per year; 85% live in countries in which total per capita
income in 2005 was $2,808 or less. Adjusting for purchasing power, the per capita
income levels would be $2,531 and $7,416, respectively. The latter numbers compare
to per capita income in high-income countries of over $30,000.
• Babies born in poor countries are 16 times more likely to die in their first five years
than are babies born in rich countries.
• About a quarter of the populations of low-income countries is undernourished.
• About 40% (over 50% for women) of the people 15 years old and older in low-income
countries are illiterate.
• Roughly one-fourth of the people in low-income countries do not have access to safe
drinking water.
Clearly, the high standards of living enjoyed by people in the world’s developed economies
are the global exception, not the rule. This chapter looks at the problem of improving the
standard of living in poor countries.
Rich and Poor Nations
The World Bank, an international organization designed to support economic development
by providing financial assistance, advice, and other resources to poor countries, classifies
over 200 countries according to their levels of per capita gross national income. The
categories in its 2008 report, as shown in Table 33.1 "World Incomes, Selected Countries",
were as follows:
• Low-income countries: These countries had per capita incomes of $935 or less in
2007. There were 49 countries in this category. About 20% of the world’s total
population of about 6.5 billion people lived in low-income countries in 2007.
• Middle-income countries: There were 95 countries with per capita incomes of more
than $936 but less than $11,455. Middle-income countries are further subdivided
into lower middle-income and upper middle-income countries. Roughly two-thirds of
the world’s population lived in middle-income countries in 2007. We should note
that the percentage of the world’s population living in middle-income countries
increased dramatically (and the percentage living in low-income countries decreased

dramatically) when China and India moved from being low-income to middle-income
countries.
• High-income countries: There were 65 nations with per capita incomes of $11,456 or
more. Just 16% of the world’s total population lived in high-income countries in 2007.
Countries in the low- and middle-income categories are often called developing countries.
A developing country is thus a country that is not among the high-income nations of the
world.The World Development Report 2006 (New York: Oxford University Press, 2006), xiv,
comments on this usage: “The term developing countries includes low- and middle-income
economies and thus may include economies in transition from central planning, as a matter
of convenience. The term advanced countries may be used as a matter of convenience to
denote high-income economics.” Developing countries are sometimes referred to as third-
world countries.
How does the World Bank compare incomes across countries? The World Bank converts
gross national income (GNI) figures to dollars in two ways. One is to take GNI in a local
currency and convert using the exchange rate, averaged over a three-year period in order to
smooth out the effects of currency fluctuations. This type of comparison can, however, be
misleading. A country could have a relatively high standard of living but, for a variety of
reasons, a low exchange rate. The per capita GNI figure would be quite low; the country
would appear to be poorer than it is.
A better approach to comparing incomes converts currencies to dollars on the basis of
purchasing power. This measure is reported in what are called international dollars. An
international dollar has the same purchasing power as does a U.S. dollar in the United
States. This is reported in the column labeled “2007 International $” in Table 33.1 "World
Incomes, Selected Countries".
Table 33.1 World Incomes, Selected Countries
Gross National Income per Capita, 2007
Low-income countries
Middle-income countries
High-income countries
Countries
200
7 $
2007
Internatio
nal $
Countrie
s
200
7 $
2007
Internatio
nal $
Countri
es
2007
$
2007
Internatio
nal $
Burundi
110
330
India
95
0
2,740
Czech
Republi
c
14,45
0
22,020
Sierra
Leone
260
660
China
2,36
0
5,370
Saudi
Arabia
15,44
0
22,910

Gross National Income per Capita, 2007
Low-income countries
Middle-income countries
High-income countries
Countries
200
7 $
2007
Internatio
nal $
Countrie
s
200
7 $
2007
Internatio
nal $
Countri
es
2007
$
2007
Internatio
nal $
Mozambiq
ue
320
690
Thailand
3,40
0
7,880
Israel
21,90
0
25,930
Banglades
h
470
1,340
Iran
3,47
0
10,800
Greece
29,63
0
32,330
Haiti
560
1,150
Jamaica
3,71
0
6,210
Japan
37,67
0
34,600
Uzbekistan
730
2,430
Costa
Rica
5,56
0
10,700
France
38,50
0
33,600
Vietnam
790
2,550
Brazil
5,91
0
9,370
Canada
39,42
0
35,310
Zambia
800
1,220
Argentin
a
6,05
0
12,990
United
States
46,04
0
45,850
Pakistan
870
2,570
Russian
Federati
on
7,56
0
14,400
Ireland
48,14
0
37,090
Nigeria
930
1,770
Turkey
8,02
0
12,350
Norway
76,45
0
53,320
Average
578
1,494
Average
2,87
2
5,952
Average
37,56
6
36,100
Ave.,
lower
middle
1,88
7
4,543

Gross National Income per Capita, 2007
Low-income countries
Middle-income countries
High-income countries
Countries
200
7 $
2007
Internatio
nal $
Countrie
s
200
7 $
2007
Internatio
nal $
Countri
es
2007
$
2007
Internatio
nal $
Ave.,
upper
middle
6,98
7
11,868
Source: World Development Indicators database, World Bank, revised October 17, 2008.
The international dollar estimates typically show higher incomes than estimates based on an
exchange rate conversion. For example, in 2007 Mozambique’s per capita GNI, based on
exchange rates, was $320. Its per capita GNI based the international dollars was $690.
Ranking of countries, both rich and poor, by per capita GNI differs depending on the
measure used. According to the per capita GNI figures in Table 33.1 "World Incomes,
Selected Countries", which convert data in domestic currencies to dollars using exchange
rates, the United States ranked fifteenth of all countries in 2007. Using the international
dollars method, its rank is tenth. China is ranked at 132 when per capita GNI is based on the
exchange rate conversion method but rises to 122 based on the international dollar method.
Characteristics of Low-Income Countries
Low incomes are often associated with other characteristics: severe inequality, poor health
care and education, high unemployment, heavy reliance on agriculture, and rapid population
growth. We will examine most of these problems in this section. Population growth in low-
income nations is examined later in the chapter.
Inequality
Not only are incomes in low-income countries quite low; income distribution is often highly
unequal. Poverty is far more prevalent than per capita numbers suggest, as illustrated by
Lorenz curves, introduced in the chapter on inequality, that show the cumulative shares of
income received by individuals or groups.
Consider Costa Rica and Panama, two Latin American countries with roughly equivalent
levels of per capita GNI (Costa Rica’s was $5,560 and Panama’s $5,510 in 2007). Panama’s
income distribution is comparatively less equal, while Costa Rica’s is far more equal. Figure
33.1 "Poverty and the Distribution of Income: Costa Rica versus Panama" compares the 2003
Lorenz curves for Costa Rica and Panama, the most recent year for which the information
was available. The 20% of the households with the lowest incomes in Costa Rica had twice as
large a share of their country’s total income as did the bottom 20% of households in
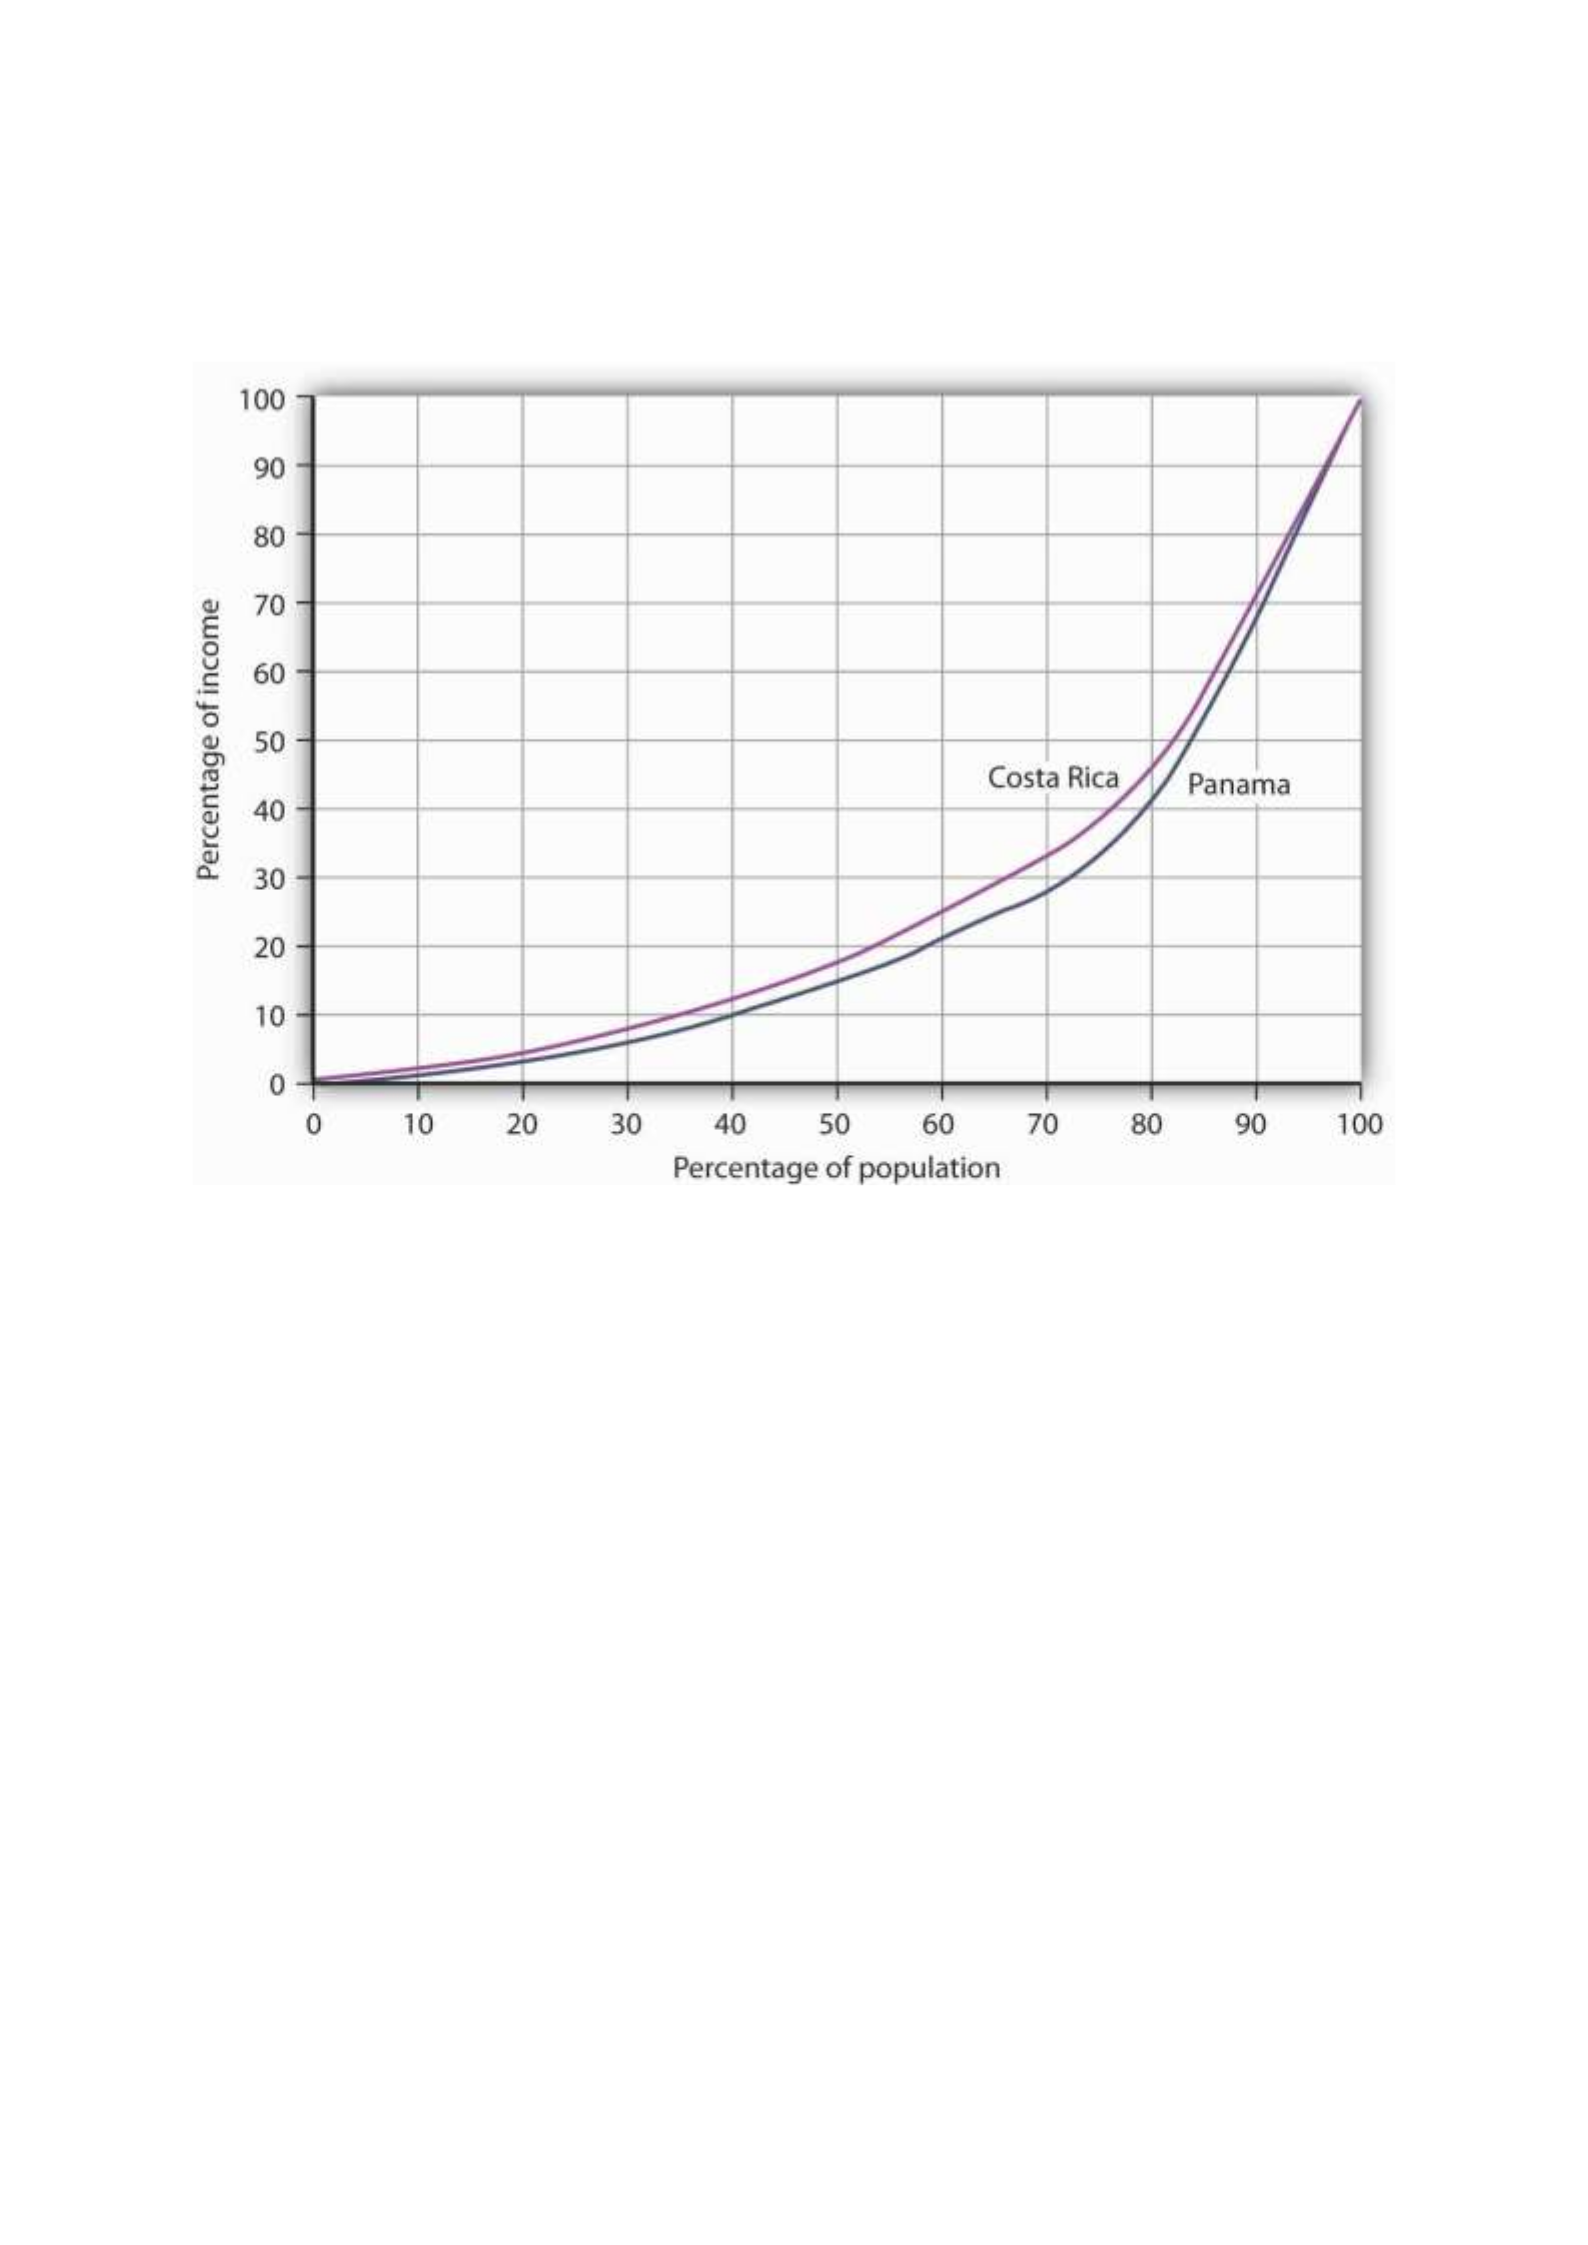
Panama. That means Costa Rica’s poor were about twice as well off, in material terms, as
Panama’s poor.
Figure 33.1 Poverty and the Distribution of Income: Costa Rica versus Panama
Costa Rica had about the same per capita GNI as Panama in 2003, but Panama’s income
distribution was far more unequal. Panama’s poor had much lower living standards than
Costa Rica’s poor, as suggested by the Lorenz curves for the two nations.
Source: World Development Indicators Online (revised October 17, 2008).
In general, the greater the degree of inequality, the more desperate is the condition of
people at the bottom of an income distribution. Given the high degree of inequality in many
low-income countries, it is very important to look at income distributions when we compare
living standards in different countries.
Health and Education
Poor nations are typically characterized by low levels of human capital. Where health-care
facilities are inadequate, that human capital can be reduced further by disease. Where
educational resources are poor, there will be little progress in improving human capital.
One indicator of poor health care appears on the supply side. Low-income countries have
fewer doctors, relative to their populations, than high-income countries. For example, the
UN estimates that in 2006 about 60% of mothers giving birth in developing countries had
access to a skilled health-care provider (doctor, nurse, or midwife). While that is up from
47% in 1990, the lack of access to a health-care provider may explain much of the difference

in maternal death rates between developed and developing countries: about nine maternal
deaths per 100,000 live births in developed countries compared to about 450 per 100,000 in
developing countries.United Nations, The Millennium Development Goals Report 2008, 27.
We can also see the results of poor health care in statistics on health. Among the world’s
developing countries, the infant mortality rate, which reports deaths in the first year of life,
was 57 per 1,000 live births in 2005. There were six infant deaths per 1,000 live births
among the high-income countries that year.United Nations Development Program, Human
Development Report 2007/2008 (New York: Palgrave Macmillan, 2007), 264.
Another health issue facing the world’s low-income countries is malnutrition. Malnutrition
rates in all developing countries in the 2002 to 2004 period averaged 17%, 35% in the least
developed countries.
Still another issue is the spread of HIV/AIDS. Here there is some progress. The number of
people newly infected declined from 3 million in 2001 to 2.7 million in 2005. Antiretroviral
treatments are also leading to a reduction in deaths from 2.2 million in 2005 to 2 million in
2007. Longer survival means that the number of people living with HIV (from just under 30
million in 2001 to about 33 million in 2007) is rising and most of the people living with HIV
are in Sub-Saharan Africa.United Nations, The Millennium Development Goals Report 2008,
30.
Education in poor and middle-income nations is improving. In 1991, about 80% of children in
developing countries were enrolled in primary schools. In 2005, about 85% were. The
comparable numbers in developed countries are about 95%. Enrollment rates taper off for
high school (about 53% in 2005 in developing countries compared to 91% in developed
countries).United Nations Development Program, Human Development Report
2007/2008 (New York: Palgrave Macmillan, 2007), 272.
Unemployment
Unemployment is pervasive in low-income nations. These nations, already faced with low
levels of potential output, are producing well below their potential. Unemployment rates in
low-income countries vary widely, reaching as high as 15% or more in some countries. If we
count discouraged workers, people who have given up looking for work but who would take
it if it were available, and people who work less than full time, not by choice but because
more work is unavailable, then unemployment in low-income countries soars—often to
more than 30%.
Migration within low-income countries often contributes to unemployment in urban areas.
Factors such as ethnic violence, poverty, and drought often force people to move from rural
areas to cities, where unemployment rates are already high.
Reliance on Agriculture
One of the dominant characteristics of poor nations is the concentration of employment in
agriculture. Another is the very low productivity of that employment. Agriculture in low-

income countries often employs a majority of the population but produces less than one-
third of GDP.
One of the primary forces behind income growth in wealthy countries has been the shift of
labor out of agriculture and into more productive sectors such as manufacturing. This shift is
also occurring in low-income nations but has lagged far behind.
The solution to these problems lies in economic development, to which we turn next.
Economic Development: A Definition
If the problems of low-income nations are pervasive, the development that helps to solve
those problems must transform the very nature of their societies. The late Austrian
economist Joseph Schumpeter described economic development as a revolutionary process.
Whereas economic growth implies quantitative change in production processes that are
already familiar to the society, economic development requires qualitative change in
virtually every aspect of life.
Robert Heilbroner, an economist at the New School for Social Research in New York, has
argued,
“Economic development is political and social change on a wrenching and tearing scale. … It
is a process of institutional birth and institutional death. It is a time when power shifts, often
violently and abruptly, a time when old regimes go under and new ones rise in their places.
And these are not just the unpleasant side effects of development. They are part and parcel
of the process, the very driving force of change itself.”Robert Heilbroner, Between Capitalism
and Socialism (New York: Vintage Books, 1970), 53–54.
Economic development transforms a nation at its core. But what, precisely, is development?
Many definitions follow Heilbroner in noting the massive institutional and cultural changes
economic development involves. But whatever the requirements of development, its
primary characteristics are rising incomes and improving standards of living. That means
output must increase—and it must increase relative to population growth. And because
inequality is so serious a problem in low-income nations, development must deliver
widespread improvement in living conditions. It therefore seems useful to define economic
development as a process that produces sustained and widely shared gains in per capita real
GDP.
In recent years, the United Nations has constructed measures incorporating dimensions of
economic development that go beyond the level of per capita GDP. The Human
Development Index (HDI) includes three dimensions—life expectancy, educational
attainment (adult literacy and combined primary, secondary, and post-secondary
enrollment), as well as purchasing-power-adjusted per capita real GDP. The Gender
Development Index (GDI) uses the same variables as the HDI but adjusts them downward to
take into account the extent of gender inequality. A third index, the Human Poverty Index
(HPI), measures human deprivation and includes such indicators as the percentage of people
expected to die before age 40, the percentage of underweight children under age 5, the
percentage of adults who are illiterate, and the percentage of people who live in poverty.

The number reported for the HPI shows the percentage of people in the country who suffer
these deprivations.
Table 33.2 "Human Development Index, Gender Development Index, and Human Poverty
Index" shows the HDI, the GDI rank, and the HPI for selected countries, by HDI rank. The HDI
is constructed to have an upper limit of 1. Canada’s HDI is 0.96; the United States’ is 0.95. As
the table shows, the HDIs for developing countries range from 0.87 in Argentina to 0.34 in
Sierra Leone. The greater the difference between the HDI and the GDI of a country, the
greater the disparity in achievement between males and females in the country. Countries
can have similar HDIs but different GDIs or HPIs. By looking at a variety of measures, we
come closer to examining the extent to which the gains in income growth have been shared
or not.
Table 33.2 Human Development Index, Gender Development Index, and Human Poverty
Index
HDI
rank
Country
Human
Development
Index (HDI),
2005
Gender-Related
Development
Index (GDI) 2005,
Rank
Human Poverty Index (HPI), %
2005The definition of
deprivation for developed
countries applies a higher
standard than it does for
developing countries.
1
Iceland
0.968
1
NA
2
Norway
0.968
3
6.8
4
Canada
0.961
4
10.9
10
France
0.952
7
11.2
12
United
States
0.951
16
15.4
24
Greece
0.926
24
NA
32
Czech
Republic
0.891
29
NA
38
Argentina
0.869
36
4.1
48
Costa Rica
0.846
47
4.4

HDI
rank
Country
Human
Development
Index (HDI),
2005
Gender-Related
Development
Index (GDI) 2005,
Rank
Human Poverty Index (HPI), %
2005The definition of
deprivation for developed
countries applies a higher
standard than it does for
developing countries.
61
Saudi
Arabia
0.812
70
NA
67
Russian
Federation
0.802
59
NA
70
Brazil
0.8
60
9.7
78
Thailand
0.781
71
10.0
81
China
0.777
73
11.7
84
Turkey
0.775
79
9.2
90
Philippines
0.771
77
15.3
94
Iran
0.759
84
12.9
101
Jamaica
0.736
90
14.3
105
Viet Nam
0.733
91
15.2
114
Mongolia
0.7
100
NA
117
Bolivia
0.695
103
13.6
126
Morocco
0.646
112
33.4
128
India
0.619
113
31.3
135
Ghana
0.553
117
32.3
136
Pakistan
0.551
125
36.2
148
Kenya
0.521
127
30.8

HDI
rank
Country
Human
Development
Index (HDI),
2005
Gender-Related
Development
Index (GDI) 2005,
Rank
Human Poverty Index (HPI), %
2005The definition of
deprivation for developed
countries applies a higher
standard than it does for
developing countries.
154
Uganda
0.505
132
34.7
156
Senegal
0.499
135
42.9
173
Mali
0.38
151
56.4
177
Sierra
Leone
0.336
157
51.7
Source: United Nations Development Program, Human Development Report
2007/2008 (New York: Palgrave Macmillan, 2007).
Throughout most of history, poverty has been the human condition. For most people life
was, in the words of 17th-century English philosopher Thomas Hobbes, “solitary, poor, nasty,
brutish, and short.” Only within the past 200 years have a handful or so of countries been
able to break the chains of economic deprivation and poverty.
Consider these facts:United Nations Development Program, Human Development Report
2007/2008 (New York: Palgrave Macmillan, 2007).
• Over a third of the world’s people live in countries in which total per capita income in
2005 was less than $610 per year; 85% live in countries in which total per capita
income in 2005 was $2,808 or less. Adjusting for purchasing power, the per capita
income levels would be $2,531 and $7,416, respectively. The latter numbers compare
to per capita income in high-income countries of over $30,000.
• Babies born in poor countries are 16 times more likely to die in their first five years
than are babies born in rich countries.
• About a quarter of the populations of low-income countries is undernourished.
• About 40% (over 50% for women) of the people 15 years old and older in low-income
countries are illiterate.
• Roughly one-fourth of the people in low-income countries do not have access to safe
drinking water.
Clearly, the high standards of living enjoyed by people in the world’s developed economies
are the global exception, not the rule. This chapter looks at the problem of improving the
standard of living in poor countries.

Rich and Poor Nations
The World Bank, an international organization designed to support economic development
by providing financial assistance, advice, and other resources to poor countries, classifies
over 200 countries according to their levels of per capita gross national income. The
categories in its 2008 report, as shown in Table 33.1 "World Incomes, Selected Countries",
were as follows:
• Low-income countries: These countries had per capita incomes of $935 or less in
2007. There were 49 countries in this category. About 20% of the world’s total
population of about 6.5 billion people lived in low-income countries in 2007.
• Middle-income countries: There were 95 countries with per capita incomes of more
than $936 but less than $11,455. Middle-income countries are further subdivided
into lower middle-income and upper middle-income countries. Roughly two-thirds of
the world’s population lived in middle-income countries in 2007. We should note
that the percentage of the world’s population living in middle-income countries
increased dramatically (and the percentage living in low-income countries decreased
dramatically) when China and India moved from being low-income to middle-income
countries.
• High-income countries: There were 65 nations with per capita incomes of $11,456 or
more. Just 16% of the world’s total population lived in high-income countries in 2007.
Countries in the low- and middle-income categories are often called developing countries.
A developing country is thus a country that is not among the high-income nations of the
world.The World Development Report 2006 (New York: Oxford University Press, 2006), xiv,
comments on this usage: “The term developing countries includes low- and middle-income
economies and thus may include economies in transition from central planning, as a matter
of convenience. The term advanced countries may be used as a matter of convenience to
denote high-income economics.” Developing countries are sometimes referred to as third-
world countries.
How does the World Bank compare incomes across countries? The World Bank converts
gross national income (GNI) figures to dollars in two ways. One is to take GNI in a local
currency and convert using the exchange rate, averaged over a three-year period in order to
smooth out the effects of currency fluctuations. This type of comparison can, however, be
misleading. A country could have a relatively high standard of living but, for a variety of
reasons, a low exchange rate. The per capita GNI figure would be quite low; the country
would appear to be poorer than it is.
A better approach to comparing incomes converts currencies to dollars on the basis of
purchasing power. This measure is reported in what are called international dollars. An
international dollar has the same purchasing power as does a U.S. dollar in the United
States. This is reported in the column labeled “2007 International $” in Table 33.1 "World
Incomes, Selected Countries".
Table 33.1 World Incomes, Selected Countries

Gross National Income per Capita, 2007
Low-income countries
Middle-income countries
High-income countries
Countries
200
7 $
2007
Internatio
nal $
Countrie
s
200
7 $
2007
Internatio
nal $
Countri
es
2007
$
2007
Internatio
nal $
Burundi
110
330
India
95
0
2,740
Czech
Republi
c
14,45
0
22,020
Sierra
Leone
260
660
China
2,36
0
5,370
Saudi
Arabia
15,44
0
22,910
Mozambiq
ue
320
690
Thailand
3,40
0
7,880
Israel
21,90
0
25,930
Banglades
h
470
1,340
Iran
3,47
0
10,800
Greece
29,63
0
32,330
Haiti
560
1,150
Jamaica
3,71
0
6,210
Japan
37,67
0
34,600
Uzbekistan
730
2,430
Costa
Rica
5,56
0
10,700
France
38,50
0
33,600
Vietnam
790
2,550
Brazil
5,91
0
9,370
Canada
39,42
0
35,310
Zambia
800
1,220
Argentin
a
6,05
0
12,990
United
States
46,04
0
45,850
Pakistan
870
2,570
Russian
Federati
on
7,56
0
14,400
Ireland
48,14
0
37,090
Nigeria
930
1,770
Turkey
8,02
0
12,350
Norway
76,45
0
53,320
Average
578
1,494
Average
2,87
2
5,952
Average
37,56
6
36,100

Gross National Income per Capita, 2007
Low-income countries
Middle-income countries
High-income countries
Countries
200
7 $
2007
Internatio
nal $
Countrie
s
200
7 $
2007
Internatio
nal $
Countri
es
2007
$
2007
Internatio
nal $
Ave.,
lower
middle
1,88
7
4,543
Ave.,
upper
middle
6,98
7
11,868
Source: World Development Indicators database, World Bank, revised October 17, 2008.
The international dollar estimates typically show higher incomes than estimates based on an
exchange rate conversion. For example, in 2007 Mozambique’s per capita GNI, based on
exchange rates, was $320. Its per capita GNI based the international dollars was $690.
Ranking of countries, both rich and poor, by per capita GNI differs depending on the
measure used. According to the per capita GNI figures in Table 33.1 "World Incomes,
Selected Countries", which convert data in domestic currencies to dollars using exchange
rates, the United States ranked fifteenth of all countries in 2007. Using the international
dollars method, its rank is tenth. China is ranked at 132 when per capita GNI is based on the
exchange rate conversion method but rises to 122 based on the international dollar method.
Characteristics of Low-Income Countries
Low incomes are often associated with other characteristics: severe inequality, poor health
care and education, high unemployment, heavy reliance on agriculture, and rapid population
growth. We will examine most of these problems in this section. Population growth in low-
income nations is examined later in the chapter.
Inequality
Not only are incomes in low-income countries quite low; income distribution is often highly
unequal. Poverty is far more prevalent than per capita numbers suggest, as illustrated by
Lorenz curves, introduced in the chapter on inequality, that show the cumulative shares of
income received by individuals or groups.
Consider Costa Rica and Panama, two Latin American countries with roughly equivalent
levels of per capita GNI (Costa Rica’s was $5,560 and Panama’s $5,510 in 2007). Panama’s
income distribution is comparatively less equal, while Costa Rica’s is far more equal. Figure
33.1 "Poverty and the Distribution of Income: Costa Rica versus Panama" compares the 2003

Lorenz curves for Costa Rica and Panama, the most recent year for which the information
was available. The 20% of the households with the lowest incomes in Costa Rica had twice as
large a share of their country’s total income as did the bottom 20% of households in
Panama. That means Costa Rica’s poor were about twice as well off, in material terms, as
Panama’s poor.
Figure 33.1 Poverty and the Distribution of Income: Costa Rica versus Panama
Costa Rica had about the same per capita GNI as Panama in 2003, but Panama’s income
distribution was far more unequal. Panama’s poor had much lower living standards than
Costa Rica’s poor, as suggested by the Lorenz curves for the two nations.
Source: World Development Indicators Online (revised October 17, 2008).
In general, the greater the degree of inequality, the more desperate is the condition of
people at the bottom of an income distribution. Given the high degree of inequality in many
low-income countries, it is very important to look at income distributions when we compare
living standards in different countries.
Health and Education
Poor nations are typically characterized by low levels of human capital. Where health-care
facilities are inadequate, that human capital can be reduced further by disease. Where
educational resources are poor, there will be little progress in improving human capital.
One indicator of poor health care appears on the supply side. Low-income countries have
fewer doctors, relative to their populations, than high-income countries. For example, the

UN estimates that in 2006 about 60% of mothers giving birth in developing countries had
access to a skilled health-care provider (doctor, nurse, or midwife). While that is up from
47% in 1990, the lack of access to a health-care provider may explain much of the difference
in maternal death rates between developed and developing countries: about nine maternal
deaths per 100,000 live births in developed countries compared to about 450 per 100,000 in
developing countries.United Nations, The Millennium Development Goals Report 2008, 27.
We can also see the results of poor health care in statistics on health. Among the world’s
developing countries, the infant mortality rate, which reports deaths in the first year of life,
was 57 per 1,000 live births in 2005. There were six infant deaths per 1,000 live births
among the high-income countries that year.United Nations Development Program, Human
Development Report 2007/2008 (New York: Palgrave Macmillan, 2007), 264.
Another health issue facing the world’s low-income countries is malnutrition. Malnutrition
rates in all developing countries in the 2002 to 2004 period averaged 17%, 35% in the least
developed countries.
Still another issue is the spread of HIV/AIDS. Here there is some progress. The number of
people newly infected declined from 3 million in 2001 to 2.7 million in 2005. Antiretroviral
treatments are also leading to a reduction in deaths from 2.2 million in 2005 to 2 million in
2007. Longer survival means that the number of people living with HIV (from just under 30
million in 2001 to about 33 million in 2007) is rising and most of the people living with HIV
are in Sub-Saharan Africa.United Nations, The Millennium Development Goals Report 2008,
30.
Education in poor and middle-income nations is improving. In 1991, about 80% of children in
developing countries were enrolled in primary schools. In 2005, about 85% were. The
comparable numbers in developed countries are about 95%. Enrollment rates taper off for
high school (about 53% in 2005 in developing countries compared to 91% in developed
countries).United Nations Development Program, Human Development Report
2007/2008 (New York: Palgrave Macmillan, 2007), 272.
Unemployment
Unemployment is pervasive in low-income nations. These nations, already faced with low
levels of potential output, are producing well below their potential. Unemployment rates in
low-income countries vary widely, reaching as high as 15% or more in some countries. If we
count discouraged workers, people who have given up looking for work but who would take
it if it were available, and people who work less than full time, not by choice but because
more work is unavailable, then unemployment in low-income countries soars—often to
more than 30%.
Migration within low-income countries often contributes to unemployment in urban areas.
Factors such as ethnic violence, poverty, and drought often force people to move from rural
areas to cities, where unemployment rates are already high.
Reliance on Agriculture

One of the dominant characteristics of poor nations is the concentration of employment in
agriculture. Another is the very low productivity of that employment. Agriculture in low-
income countries often employs a majority of the population but produces less than one-
third of GDP.
One of the primary forces behind income growth in wealthy countries has been the shift of
labor out of agriculture and into more productive sectors such as manufacturing. This shift is
also occurring in low-income nations but has lagged far behind.
The solution to these problems lies in economic development, to which we turn next.
Economic Development: A Definition
If the problems of low-income nations are pervasive, the development that helps to solve
those problems must transform the very nature of their societies. The late Austrian
economist Joseph Schumpeter described economic development as a revolutionary process.
Whereas economic growth implies quantitative change in production processes that are
already familiar to the society, economic development requires qualitative change in
virtually every aspect of life.
Robert Heilbroner, an economist at the New School for Social Research in New York, has
argued,
“Economic development is political and social change on a wrenching and tearing scale. … It
is a process of institutional birth and institutional death. It is a time when power shifts, often
violently and abruptly, a time when old regimes go under and new ones rise in their places.
And these are not just the unpleasant side effects of development. They are part and parcel
of the process, the very driving force of change itself.”Robert Heilbroner, Between Capitalism
and Socialism (New York: Vintage Books, 1970), 53–54.
Economic development transforms a nation at its core. But what, precisely, is development?
Many definitions follow Heilbroner in noting the massive institutional and cultural changes
economic development involves. But whatever the requirements of development, its
primary characteristics are rising incomes and improving standards of living. That means
output must increase—and it must increase relative to population growth. And because
inequality is so serious a problem in low-income nations, development must deliver
widespread improvement in living conditions. It therefore seems useful to define economic
development as a process that produces sustained and widely shared gains in per capita real
GDP.
In recent years, the United Nations has constructed measures incorporating dimensions of
economic development that go beyond the level of per capita GDP. The Human
Development Index (HDI) includes three dimensions—life expectancy, educational
attainment (adult literacy and combined primary, secondary, and post-secondary
enrollment), as well as purchasing-power-adjusted per capita real GDP. The Gender
Development Index (GDI) uses the same variables as the HDI but adjusts them downward to
take into account the extent of gender inequality. A third index, the Human Poverty Index
(HPI), measures human deprivation and includes such indicators as the percentage of people

expected to die before age 40, the percentage of underweight children under age 5, the
percentage of adults who are illiterate, and the percentage of people who live in poverty.
The number reported for the HPI shows the percentage of people in the country who suffer
these deprivations.
Throughout most of history, poverty has been the human condition. For most people life
was, in the words of 17th-century English philosopher Thomas Hobbes, “solitary, poor, nasty,
brutish, and short.” Only within the past 200 years have a handful or so of countries been
able to break the chains of economic deprivation and poverty.
Consider these facts:United Nations Development Program, Human Development Report
2007/2008 (New York: Palgrave Macmillan, 2007).
• Over a third of the world’s people live in countries in which total per capita income in
2005 was less than $610 per year; 85% live in countries in which total per capita
income in 2005 was $2,808 or less. Adjusting for purchasing power, the per capita
income levels would be $2,531 and $7,416, respectively. The latter numbers compare
to per capita income in high-income countries of over $30,000.
• Babies born in poor countries are 16 times more likely to die in their first five years
than are babies born in rich countries.
• About a quarter of the populations of low-income countries is undernourished.
• About 40% (over 50% for women) of the people 15 years old and older in low-income
countries are illiterate.
• Roughly one-fourth of the people in low-income countries do not have access to safe
drinking water.
Clearly, the high standards of living enjoyed by people in the world’s developed economies
are the global exception, not the rule. This chapter looks at the problem of improving the
standard of living in poor countries.
Rich and Poor Nations
The World Bank, an international organization designed to support economic development
by providing financial assistance, advice, and other resources to poor countries, classifies
over 200 countries according to their levels of per capita gross national income. The
categories in its 2008 report, as shown in Table 33.1 "World Incomes, Selected Countries",
were as follows:
• Low-income countries: These countries had per capita incomes of $935 or less in
2007. There were 49 countries in this category. About 20% of the world’s total
population of about 6.5 billion people lived in low-income countries in 2007.
• Middle-income countries: There were 95 countries with per capita incomes of more
than $936 but less than $11,455. Middle-income countries are further subdivided
into lower middle-income and upper middle-income countries. Roughly two-thirds of
the world’s population lived in middle-income countries in 2007. We should note

that the percentage of the world’s population living in middle-income countries
increased dramatically (and the percentage living in low-income countries decreased
dramatically) when China and India moved from being low-income to middle-income
countries.
• High-income countries: There were 65 nations with per capita incomes of $11,456 or
more. Just 16% of the world’s total population lived in high-income countries in 2007.
Countries in the low- and middle-income categories are often called developing countries.
A developing country is thus a country that is not among the high-income nations of the
world.The World Development Report 2006 (New York: Oxford University Press, 2006), xiv,
comments on this usage: “The term developing countries includes low- and middle-income
economies and thus may include economies in transition from central planning, as a matter
of convenience. The term advanced countries may be used as a matter of convenience to
denote high-income economics.” Developing countries are sometimes referred to as third-
world countries.
How does the World Bank compare incomes across countries? The World Bank converts
gross national income (GNI) figures to dollars in two ways. One is to take GNI in a local
currency and convert using the exchange rate, averaged over a three-year period in order to
smooth out the effects of currency fluctuations. This type of comparison can, however, be
misleading. A country could have a relatively high standard of living but, for a variety of
reasons, a low exchange rate. The per capita GNI figure would be quite low; the country
would appear to be poorer than it is.
A better approach to comparing incomes converts currencies to dollars on the basis of
purchasing power. This measure is reported in what are called international dollars. An
international dollar has the same purchasing power as does a U.S. dollar in the United
States. This is reported in the column labeled “2007 International $” in Table 33.1 "World
Incomes, Selected Countries".
Table 33.1 World Incomes, Selected Countries
Gross National Income per Capita, 2007
Low-income countries
Middle-income countries
High-income countries
Countries
200
7 $
2007
Internatio
nal $
Countrie
s
200
7 $
2007
Internatio
nal $
Countri
es
2007
$
2007
Internatio
nal $
Burundi
110
330
India
95
0
2,740
Czech
Republi
c
14,45
0
22,020

Gross National Income per Capita, 2007
Low-income countries
Middle-income countries
High-income countries
Countries
200
7 $
2007
Internatio
nal $
Countrie
s
200
7 $
2007
Internatio
nal $
Countri
es
2007
$
2007
Internatio
nal $
Sierra
Leone
260
660
China
2,36
0
5,370
Saudi
Arabia
15,44
0
22,910
Mozambiq
ue
320
690
Thailand
3,40
0
7,880
Israel
21,90
0
25,930
Banglades
h
470
1,340
Iran
3,47
0
10,800
Greece
29,63
0
32,330
Haiti
560
1,150
Jamaica
3,71
0
6,210
Japan
37,67
0
34,600
Uzbekistan
730
2,430
Costa
Rica
5,56
0
10,700
France
38,50
0
33,600
Vietnam
790
2,550
Brazil
5,91
0
9,370
Canada
39,42
0
35,310
Zambia
800
1,220
Argentin
a
6,05
0
12,990
United
States
46,04
0
45,850
Pakistan
870
2,570
Russian
Federati
on
7,56
0
14,400
Ireland
48,14
0
37,090
Nigeria
930
1,770
Turkey
8,02
0
12,350
Norway
76,45
0
53,320
Average
578
1,494
Average
2,87
2
5,952
Average
37,56
6
36,100
Ave.,
lower
middle
1,88
7
4,543

Gross National Income per Capita, 2007
Low-income countries
Middle-income countries
High-income countries
Countries
200
7 $
2007
Internatio
nal $
Countrie
s
200
7 $
2007
Internatio
nal $
Countri
es
2007
$
2007
Internatio
nal $
Ave.,
upper
middle
6,98
7
11,868
Source: World Development Indicators database, World Bank, revised October 17, 2008.
The international dollar estimates typically show higher incomes than estimates based on an
exchange rate conversion. For example, in 2007 Mozambique’s per capita GNI, based on
exchange rates, was $320. Its per capita GNI based the international dollars was $690.
Ranking of countries, both rich and poor, by per capita GNI differs depending on the
measure used. According to the per capita GNI figures in Table 33.1 "World Incomes,
Selected Countries", which convert data in domestic currencies to dollars using exchange
rates, the United States ranked fifteenth of all countries in 2007. Using the international
dollars method, its rank is tenth. China is ranked at 132 when per capita GNI is based on the
exchange rate conversion method but rises to 122 based on the international dollar method.
Characteristics of Low-Income Countries
Low incomes are often associated with other characteristics: severe inequality, poor health
care and education, high unemployment, heavy reliance on agriculture, and rapid population
growth. We will examine most of these problems in this section. Population growth in low-
income nations is examined later in the chapter.
Inequality
Not only are incomes in low-income countries quite low; income distribution is often highly
unequal. Poverty is far more prevalent than per capita numbers suggest, as illustrated by
Lorenz curves, introduced in the chapter on inequality, that show the cumulative shares of
income received by individuals or groups.
Consider Costa Rica and Panama, two Latin American countries with roughly equivalent
levels of per capita GNI (Costa Rica’s was $5,560 and Panama’s $5,510 in 2007). Panama’s
income distribution is comparatively less equal, while Costa Rica’s is far more equal. Figure
33.1 "Poverty and the Distribution of Income: Costa Rica versus Panama" compares the 2003
Lorenz curves for Costa Rica and Panama, the most recent year for which the information
was available. The 20% of the households with the lowest incomes in Costa Rica had twice as
large a share of their country’s total income as did the bottom 20% of households in
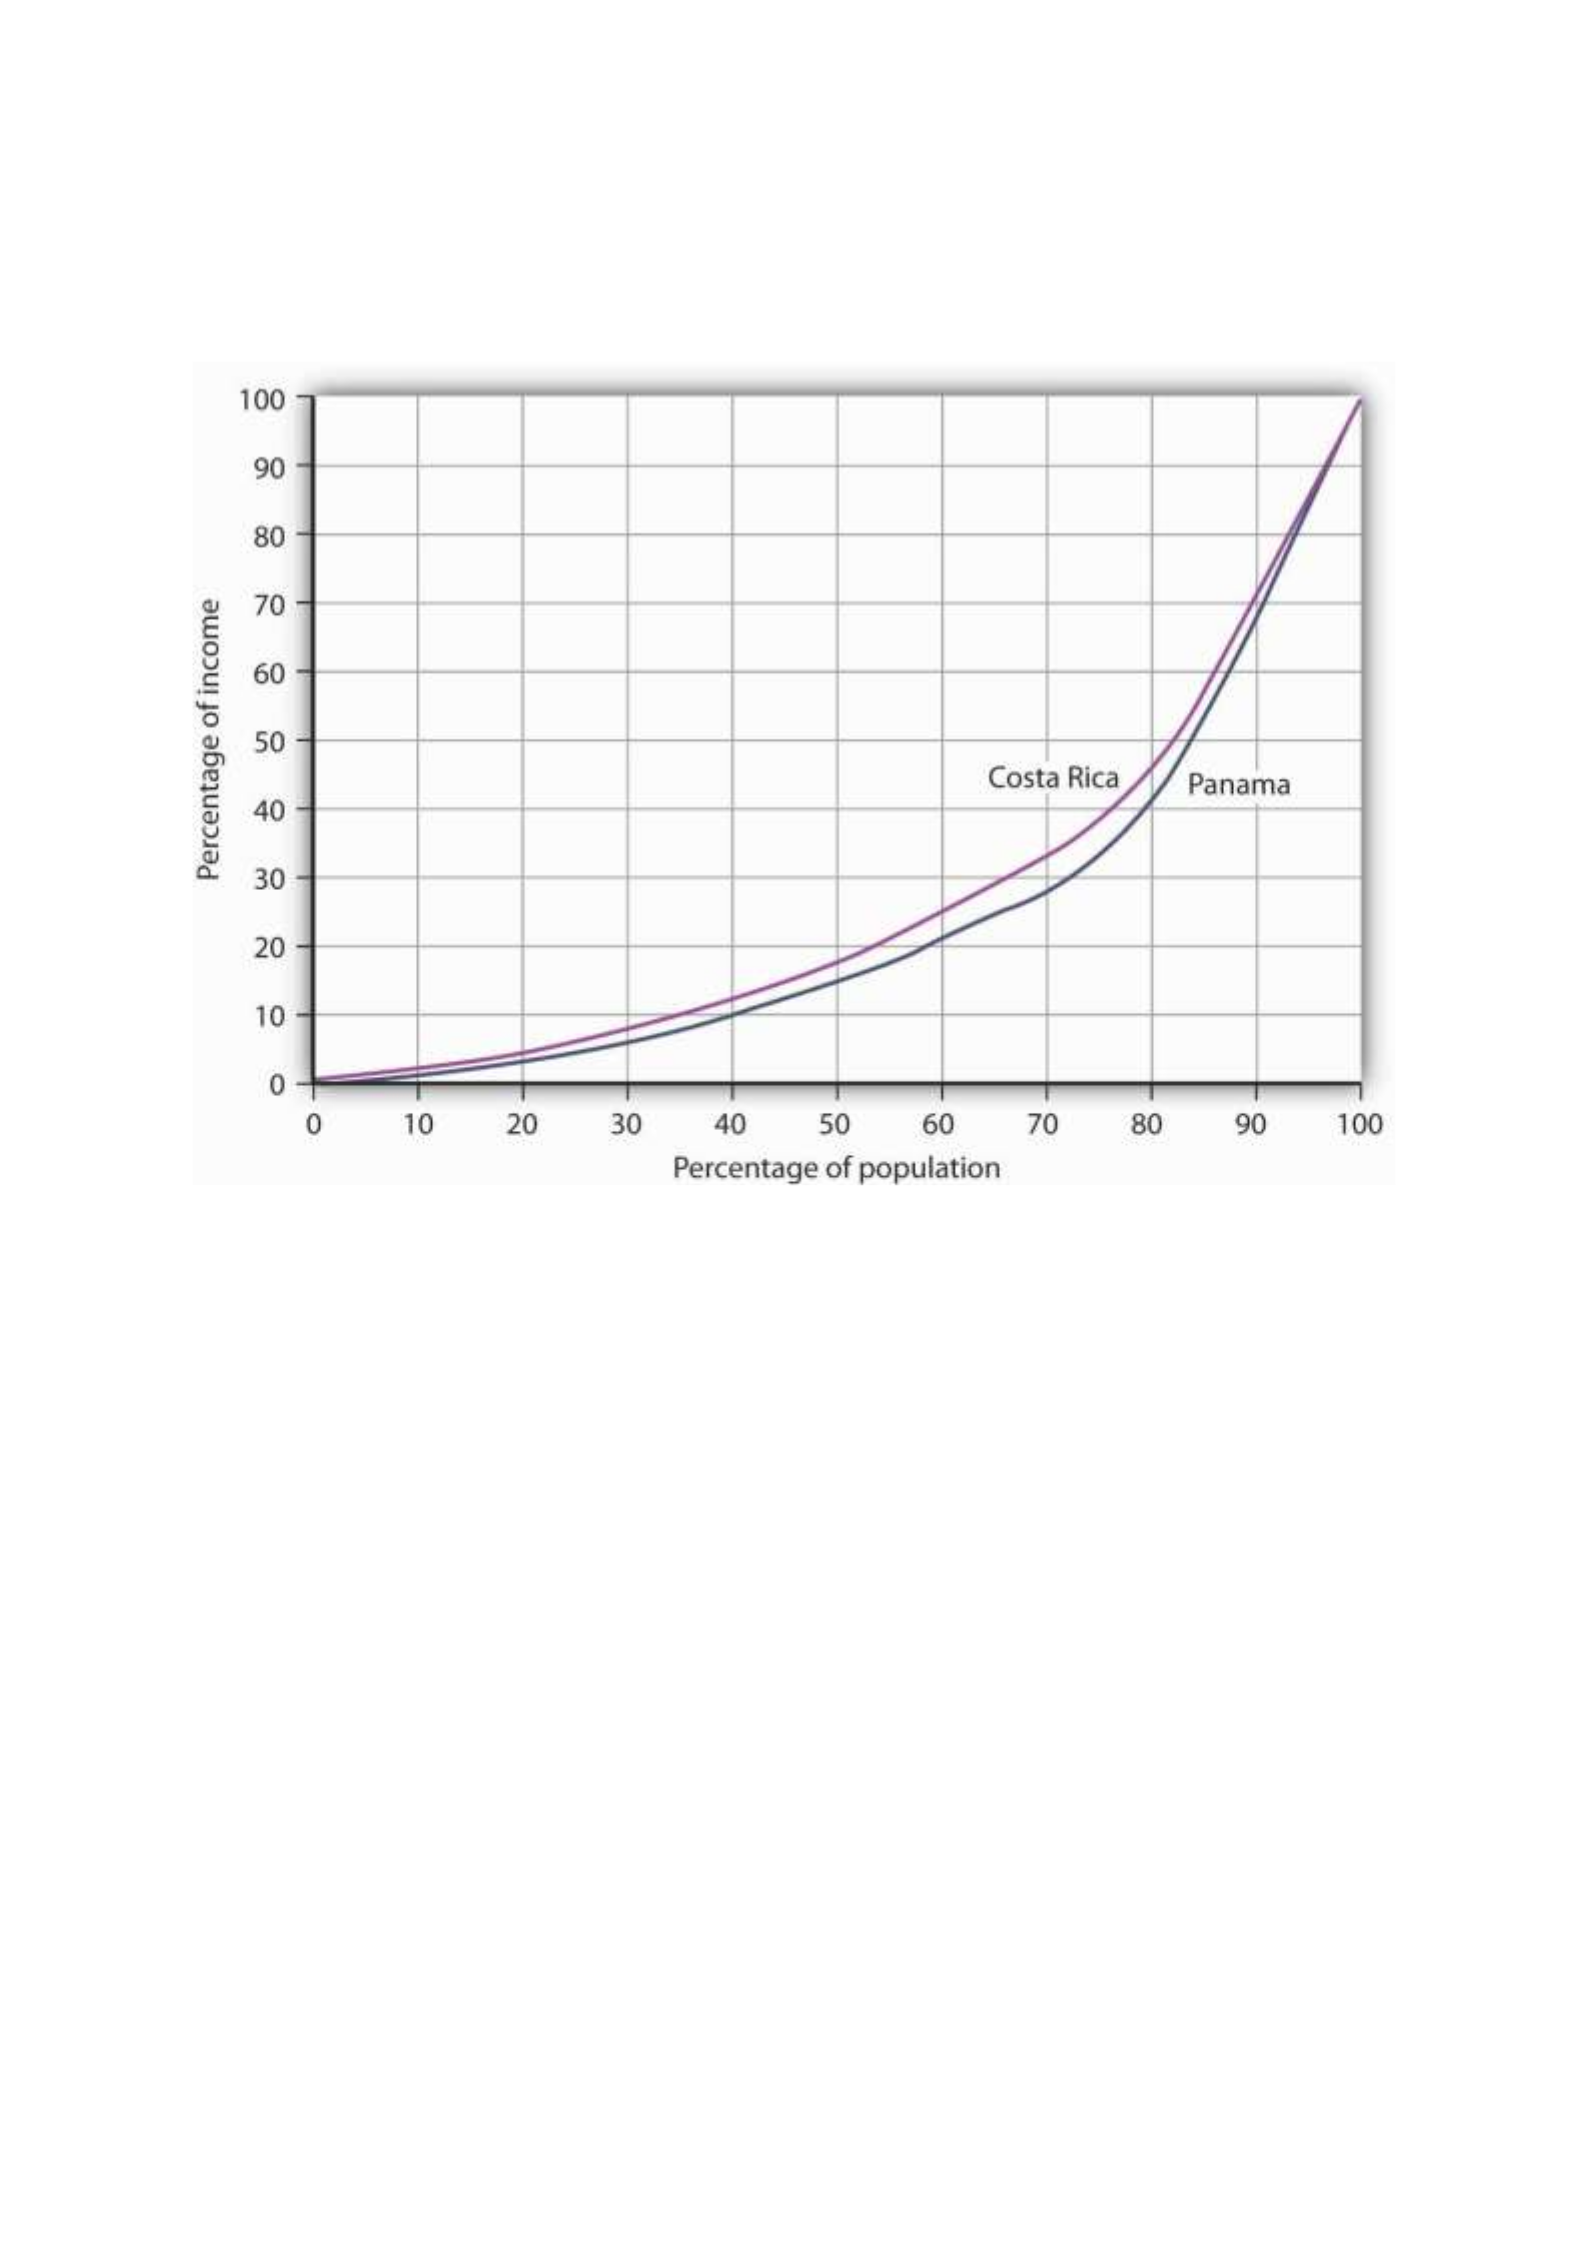
Panama. That means Costa Rica’s poor were about twice as well off, in material terms, as
Panama’s poor.
Figure 33.1 Poverty and the Distribution of Income: Costa Rica versus Panama
Costa Rica had about the same per capita GNI as Panama in 2003, but Panama’s income
distribution was far more unequal. Panama’s poor had much lower living standards than
Costa Rica’s poor, as suggested by the Lorenz curves for the two nations.
Source: World Development Indicators Online (revised October 17, 2008).
In general, the greater the degree of inequality, the more desperate is the condition of
people at the bottom of an income distribution. Given the high degree of inequality in many
low-income countries, it is very important to look at income distributions when we compare
living standards in different countries.
Health and Education
Poor nations are typically characterized by low levels of human capital. Where health-care
facilities are inadequate, that human capital can be reduced further by disease. Where
educational resources are poor, there will be little progress in improving human capital.
One indicator of poor health care appears on the supply side. Low-income countries have
fewer doctors, relative to their populations, than high-income countries. For example, the
UN estimates that in 2006 about 60% of mothers giving birth in developing countries had
access to a skilled health-care provider (doctor, nurse, or midwife). While that is up from
47% in 1990, the lack of access to a health-care provider may explain much of the difference

in maternal death rates between developed and developing countries: about nine maternal
deaths per 100,000 live births in developed countries compared to about 450 per 100,000 in
developing countries.United Nations, The Millennium Development Goals Report 2008, 27.
We can also see the results of poor health care in statistics on health. Among the world’s
developing countries, the infant mortality rate, which reports deaths in the first year of life,
was 57 per 1,000 live births in 2005. There were six infant deaths per 1,000 live births
among the high-income countries that year.United Nations Development Program, Human
Development Report 2007/2008 (New York: Palgrave Macmillan, 2007), 264.
Another health issue facing the world’s low-income countries is malnutrition. Malnutrition
rates in all developing countries in the 2002 to 2004 period averaged 17%, 35% in the least
developed countries.
Still another issue is the spread of HIV/AIDS. Here there is some progress. The number of
people newly infected declined from 3 million in 2001 to 2.7 million in 2005. Antiretroviral
treatments are also leading to a reduction in deaths from 2.2 million in 2005 to 2 million in
2007. Longer survival means that the number of people living with HIV (from just under 30
million in 2001 to about 33 million in 2007) is rising and most of the people living with HIV
are in Sub-Saharan Africa.United Nations, The Millennium Development Goals Report 2008,
30.
Education in poor and middle-income nations is improving. In 1991, about 80% of children in
developing countries were enrolled in primary schools. In 2005, about 85% were. The
comparable numbers in developed countries are about 95%. Enrollment rates taper off for
high school (about 53% in 2005 in developing countries compared to 91% in developed
countries).United Nations Development Program, Human Development Report
2007/2008 (New York: Palgrave Macmillan, 2007), 272.
Unemployment
Unemployment is pervasive in low-income nations. These nations, already faced with low
levels of potential output, are producing well below their potential. Unemployment rates in
low-income countries vary widely, reaching as high as 15% or more in some countries. If we
count discouraged workers, people who have given up looking for work but who would take
it if it were available, and people who work less than full time, not by choice but because
more work is unavailable, then unemployment in low-income countries soars—often to
more than 30%.
Migration within low-income countries often contributes to unemployment in urban areas.
Factors such as ethnic violence, poverty, and drought often force people to move from rural
areas to cities, where unemployment rates are already high.
Reliance on Agriculture
One of the dominant characteristics of poor nations is the concentration of employment in
agriculture. Another is the very low productivity of that employment. Agriculture in low-

income countries often employs a majority of the population but produces less than one-
third of GDP.
One of the primary forces behind income growth in wealthy countries has been the shift of
labor out of agriculture and into more productive sectors such as manufacturing. This shift is
also occurring in low-income nations but has lagged far behind.
The solution to these problems lies in economic development, to which we turn next.
Economic Development: A Definition
If the problems of low-income nations are pervasive, the development that helps to solve
those problems must transform the very nature of their societies. The late Austrian
economist Joseph Schumpeter described economic development as a revolutionary process.
Whereas economic growth implies quantitative change in production processes that are
already familiar to the society, economic development requires qualitative change in
virtually every aspect of life.
Robert Heilbroner, an economist at the New School for Social Research in New York, has
argued,
“Economic development is political and social change on a wrenching and tearing scale. … It
is a process of institutional birth and institutional death. It is a time when power shifts, often
violently and abruptly, a time when old regimes go under and new ones rise in their places.
And these are not just the unpleasant side effects of development. They are part and parcel
of the process, the very driving force of change itself.”Robert Heilbroner, Between Capitalism
and Socialism (New York: Vintage Books, 1970), 53–54.
Economic development transforms a nation at its core. But what, precisely, is development?
Many definitions follow Heilbroner in noting the massive institutional and cultural changes
economic development involves. But whatever the requirements of development, its
primary characteristics are rising incomes and improving standards of living. That means
output must increase—and it must increase relative to population growth. And because
inequality is so serious a problem in low-income nations, development must deliver
widespread improvement in living conditions. It therefore seems useful to define economic
development as a process that produces sustained and widely shared gains in per capita real
GDP.
In recent years, the United Nations has constructed measures incorporating dimensions of
economic development that go beyond the level of per capita GDP. The Human
Development Index (HDI) includes three dimensions—life expectancy, educational
attainment (adult literacy and combined primary, secondary, and post-secondary
enrollment), as well as purchasing-power-adjusted per capita real GDP. The Gender
Development Index (GDI) uses the same variables as the HDI but adjusts them downward to
take into account the extent of gender inequality. A third index, the Human Poverty Index
(HPI), measures human deprivation and includes such indicators as the percentage of people
expected to die before age 40, the percentage of underweight children under age 5, the
percentage of adults who are illiterate, and the percentage of people who live in poverty.

The number reported for the HPI shows the percentage of people in the country who suffer
these deprivations.
Throughout most of history, poverty has been the human condition. For most people life
was, in the words of 17th-century English philosopher Thomas Hobbes, “solitary, poor, nasty,
brutish, and short.” Only within the past 200 years have a handful or so of countries been
able to break the chains of economic deprivation and poverty.
Consider these facts:United Nations Development Program, Human Development Report
2007/2008 (New York: Palgrave Macmillan, 2007).
• Over a third of the world’s people live in countries in which total per capita income in
2005 was less than $610 per year; 85% live in countries in which total per capita
income in 2005 was $2,808 or less. Adjusting for purchasing power, the per capita
income levels would be $2,531 and $7,416, respectively. The latter numbers compare
to per capita income in high-income countries of over $30,000.
• Babies born in poor countries are 16 times more likely to die in their first five years
than are babies born in rich countries.
• About a quarter of the populations of low-income countries is undernourished.
• About 40% (over 50% for women) of the people 15 years old and older in low-income
countries are illiterate.
• Roughly one-fourth of the people in low-income countries do not have access to safe
drinking water.
Clearly, the high standards of living enjoyed by people in the world’s developed economies
are the global exception, not the rule. This chapter looks at the problem of improving the
standard of living in poor countries.
Rich and Poor Nations
The World Bank, an international organization designed to support economic development
by providing financial assistance, advice, and other resources to poor countries, classifies
over 200 countries according to their levels of per capita gross national income. The
categories in its 2008 report, as shown in Table 33.1 "World Incomes, Selected Countries",
were as follows:
• Low-income countries: These countries had per capita incomes of $935 or less in
2007. There were 49 countries in this category. About 20% of the world’s total
population of about 6.5 billion people lived in low-income countries in 2007.
• Middle-income countries: There were 95 countries with per capita incomes of more
than $936 but less than $11,455. Middle-income countries are further subdivided
into lower middle-income and upper middle-income countries. Roughly two-thirds of
the world’s population lived in middle-income countries in 2007. We should note
that the percentage of the world’s population living in middle-income countries
increased dramatically (and the percentage living in low-income countries decreased

dramatically) when China and India moved from being low-income to middle-income
countries.
• High-income countries: There were 65 nations with per capita incomes of $11,456 or
more. Just 16% of the world’s total population lived in high-income countries in 2007.
Countries in the low- and middle-income categories are often called developing countries.
A developing country is thus a country that is not among the high-income nations of the
world.The World Development Report 2006 (New York: Oxford University Press, 2006), xiv,
comments on this usage: “The term developing countries includes low- and middle-income
economies and thus may include economies in transition from central planning, as a matter
of convenience. The term advanced countries may be used as a matter of convenience to
denote high-income economics.” Developing countries are sometimes referred to as third-
world countries.
How does the World Bank compare incomes across countries? The World Bank converts
gross national income (GNI) figures to dollars in two ways. One is to take GNI in a local
currency and convert using the exchange rate, averaged over a three-year period in order to
smooth out the effects of currency fluctuations. This type of comparison can, however, be
misleading. A country could have a relatively high standard of living but, for a variety of
reasons, a low exchange rate. The per capita GNI figure would be quite low; the country
would appear to be poorer than it is.
A better approach to comparing incomes converts currencies to dollars on the basis of
purchasing power. This measure is reported in what are called international dollars. An
international dollar has the same purchasing power as does a U.S. dollar in the United
States. This is reported in the column labeled “2007 International $” in Table 33.1 "World
Incomes, Selected Countries".
Table 33.1 World Incomes, Selected Countries
Gross National Income per Capita, 2007
Low-income countries
Middle-income countries
High-income countries
Countries
200
7 $
2007
Internatio
nal $
Countrie
s
200
7 $
2007
Internatio
nal $
Countri
es
2007
$
2007
Internatio
nal $
Burundi
110
330
India
95
0
2,740
Czech
Republi
c
14,45
0
22,020
Sierra
Leone
260
660
China
2,36
0
5,370
Saudi
Arabia
15,44
0
22,910

Gross National Income per Capita, 2007
Low-income countries
Middle-income countries
High-income countries
Countries
200
7 $
2007
Internatio
nal $
Countrie
s
200
7 $
2007
Internatio
nal $
Countri
es
2007
$
2007
Internatio
nal $
Mozambiq
ue
320
690
Thailand
3,40
0
7,880
Israel
21,90
0
25,930
Banglades
h
470
1,340
Iran
3,47
0
10,800
Greece
29,63
0
32,330
Haiti
560
1,150
Jamaica
3,71
0
6,210
Japan
37,67
0
34,600
Uzbekistan
730
2,430
Costa
Rica
5,56
0
10,700
France
38,50
0
33,600
Vietnam
790
2,550
Brazil
5,91
0
9,370
Canada
39,42
0
35,310
Zambia
800
1,220
Argentin
a
6,05
0
12,990
United
States
46,04
0
45,850
Pakistan
870
2,570
Russian
Federati
on
7,56
0
14,400
Ireland
48,14
0
37,090
Nigeria
930
1,770
Turkey
8,02
0
12,350
Norway
76,45
0
53,320
Average
578
1,494
Average
2,87
2
5,952
Average
37,56
6
36,100
Ave.,
lower
middle
1,88
7
4,543

Gross National Income per Capita, 2007
Low-income countries
Middle-income countries
High-income countries
Countries
200
7 $
2007
Internatio
nal $
Countrie
s
200
7 $
2007
Internatio
nal $
Countri
es
2007
$
2007
Internatio
nal $
Ave.,
upper
middle
6,98
7
11,868
Source: World Development Indicators database, World Bank, revised October 17, 2008.
The international dollar estimates typically show higher incomes than estimates based on an
exchange rate conversion. For example, in 2007 Mozambique’s per capita GNI, based on
exchange rates, was $320. Its per capita GNI based the international dollars was $690.
Ranking of countries, both rich and poor, by per capita GNI differs depending on the
measure used. According to the per capita GNI figures in Table 33.1 "World Incomes,
Selected Countries", which convert data in domestic currencies to dollars using exchange
rates, the United States ranked fifteenth of all countries in 2007. Using the international
dollars method, its rank is tenth. China is ranked at 132 when per capita GNI is based on the
exchange rate conversion method but rises to 122 based on the international dollar method.
Characteristics of Low-Income Countries
Low incomes are often associated with other characteristics: severe inequality, poor health
care and education, high unemployment, heavy reliance on agriculture, and rapid population
growth. We will examine most of these problems in this section. Population growth in low-
income nations is examined later in the chapter.
Inequality
Not only are incomes in low-income countries quite low; income distribution is often highly
unequal. Poverty is far more prevalent than per capita numbers suggest, as illustrated by
Lorenz curves, introduced in the chapter on inequality, that show the cumulative shares of
income received by individuals or groups.
Consider Costa Rica and Panama, two Latin American countries with roughly equivalent
levels of per capita GNI (Costa Rica’s was $5,560 and Panama’s $5,510 in 2007). Panama’s
income distribution is comparatively less equal, while Costa Rica’s is far more equal. Figure
33.1 "Poverty and the Distribution of Income: Costa Rica versus Panama" compares the 2003
Lorenz curves for Costa Rica and Panama, the most recent year for which the information
was available. The 20% of the households with the lowest incomes in Costa Rica had twice as
large a share of their country’s total income as did the bottom 20% of households in

Panama. That means Costa Rica’s poor were about twice as well off, in material terms, as
Panama’s poor.
Figure 33.1 Poverty and the Distribution of Income: Costa Rica versus Panama
Costa Rica had about the same per capita GNI as Panama in 2003, but Panama’s income
distribution was far more unequal. Panama’s poor had much lower living standards than
Costa Rica’s poor, as suggested by the Lorenz curves for the two nations.
Source: World Development Indicators Online (revised October 17, 2008).
In general, the greater the degree of inequality, the more desperate is the condition of
people at the bottom of an income distribution. Given the high degree of inequality in many
low-income countries, it is very important to look at income distributions when we compare
living standards in different countries.
Health and Education
Poor nations are typically characterized by low levels of human capital. Where health-care
facilities are inadequate, that human capital can be reduced further by disease. Where
educational resources are poor, there will be little progress in improving human capital.
One indicator of poor health care appears on the supply side. Low-income countries have
fewer doctors, relative to their populations, than high-income countries. For example, the
UN estimates that in 2006 about 60% of mothers giving birth in developing countries had
access to a skilled health-care provider (doctor, nurse, or midwife). While that is up from
47% in 1990, the lack of access to a health-care provider may explain much of the difference

in maternal death rates between developed and developing countries: about nine maternal
deaths per 100,000 live births in developed countries compared to about 450 per 100,000 in
developing countries.United Nations, The Millennium Development Goals Report 2008, 27.
We can also see the results of poor health care in statistics on health. Among the world’s
developing countries, the infant mortality rate, which reports deaths in the first year of life,
was 57 per 1,000 live births in 2005. There were six infant deaths per 1,000 live births
among the high-income countries that year.United Nations Development Program, Human
Development Report 2007/2008 (New York: Palgrave Macmillan, 2007), 264.
Another health issue facing the world’s low-income countries is malnutrition. Malnutrition
rates in all developing countries in the 2002 to 2004 period averaged 17%, 35% in the least
developed countries.
Still another issue is the spread of HIV/AIDS. Here there is some progress. The number of
people newly infected declined from 3 million in 2001 to 2.7 million in 2005. Antiretroviral
treatments are also leading to a reduction in deaths from 2.2 million in 2005 to 2 million in
2007. Longer survival means that the number of people living with HIV (from just under 30
million in 2001 to about 33 million in 2007) is rising and most of the people living with HIV
are in Sub-Saharan Africa.United Nations, The Millennium Development Goals Report 2008,
30.
Education in poor and middle-income nations is improving. In 1991, about 80% of children in
developing countries were enrolled in primary schools. In 2005, about 85% were. The
comparable numbers in developed countries are about 95%. Enrollment rates taper off for
high school (about 53% in 2005 in developing countries compared to 91% in developed
countries).United Nations Development Program, Human Development Report
2007/2008 (New York: Palgrave Macmillan, 2007), 272.
Unemployment
Unemployment is pervasive in low-income nations. These nations, already faced with low
levels of potential output, are producing well below their potential. Unemployment rates in
low-income countries vary widely, reaching as high as 15% or more in some countries. If we
count discouraged workers, people who have given up looking for work but who would take
it if it were available, and people who work less than full time, not by choice but because
more work is unavailable, then unemployment in low-income countries soars—often to
more than 30%.
Migration within low-income countries often contributes to unemployment in urban areas.
Factors such as ethnic violence, poverty, and drought often force people to move from rural
areas to cities, where unemployment rates are already high.
Reliance on Agriculture
One of the dominant characteristics of poor nations is the concentration of employment in
agriculture. Another is the very low productivity of that employment. Agriculture in low-

income countries often employs a majority of the population but produces less than one-
third of GDP.
One of the primary forces behind income growth in wealthy countries has been the shift of
labor out of agriculture and into more productive sectors such as manufacturing. This shift is
also occurring in low-income nations but has lagged far behind.
The solution to these problems lies in economic development, to which we turn next.
Economic Development: A Definition
If the problems of low-income nations are pervasive, the development that helps to solve
those problems must transform the very nature of their societies. The late Austrian
economist Joseph Schumpeter described economic development as a revolutionary process.
Whereas economic growth implies quantitative change in production processes that are
already familiar to the society, economic development requires qualitative change in
virtually every aspect of life.
Robert Heilbroner, an economist at the New School for Social Research in New York, has
argued,
“Economic development is political and social change on a wrenching and tearing scale. … It
is a process of institutional birth and institutional death. It is a time when power shifts, often
violently and abruptly, a time when old regimes go under and new ones rise in their places.
And these are not just the unpleasant side effects of development. They are part and parcel
of the process, the very driving force of change itself.”Robert Heilbroner, Between Capitalism
and Socialism (New York: Vintage Books, 1970), 53–54.
Economic development transforms a nation at its core. But what, precisely, is development?
Many definitions follow Heilbroner in noting the massive institutional and cultural changes
economic development involves. But whatever the requirements of development, its
primary characteristics are rising incomes and improving standards of living. That means
output must increase—and it must increase relative to population growth. And because
inequality is so serious a problem in low-income nations, development must deliver
widespread improvement in living conditions. It therefore seems useful to define economic
development as a process that produces sustained and widely shared gains in per capita real
GDP.
In recent years, the United Nations has constructed measures incorporating dimensions of
economic development that go beyond the level of per capita GDP. The Human
Development Index (HDI) includes three dimensions—life expectancy, educational
attainment (adult literacy and combined primary, secondary, and post-secondary
enrollment), as well as purchasing-power-adjusted per capita real GDP. The Gender
Development Index (GDI) uses the same variables as the HDI but adjusts them downward to
take into account the extent of gender inequality. A third index, the Human Poverty Index
(HPI), measures human deprivation and includes such indicators as the percentage of people
expected to die before age 40, the percentage of underweight children under age 5, the
percentage of adults who are illiterate, and the percentage of people who live in poverty.

The number reported for the HPI shows the percentage of people in the country who suffer
these deprivations.
Throughout most of history, poverty has been the human condition. For most people life
was, in the words of 17th-century English philosopher Thomas Hobbes, “solitary, poor, nasty,
brutish, and short.” Only within the past 200 years have a handful or so of countries been
able to break the chains of economic deprivation and poverty.
Consider these facts:United Nations Development Program, Human Development Report
2007/2008 (New York: Palgrave Macmillan, 2007).
• Over a third of the world’s people live in countries in which total per capita income in
2005 was less than $610 per year; 85% live in countries in which total per capita
income in 2005 was $2,808 or less. Adjusting for purchasing power, the per capita
income levels would be $2,531 and $7,416, respectively. The latter numbers compare
to per capita income in high-income countries of over $30,000.
• Babies born in poor countries are 16 times more likely to die in their first five years
than are babies born in rich countries.
• About a quarter of the populations of low-income countries is undernourished.
• About 40% (over 50% for women) of the people 15 years old and older in low-income
countries are illiterate.
• Roughly one-fourth of the people in low-income countries do not have access to safe
drinking water.
Clearly, the high standards of living enjoyed by people in the world’s developed economies
are the global exception, not the rule. This chapter looks at the problem of improving the
standard of living in poor countries.
Rich and Poor Nations
The World Bank, an international organization designed to support economic development
by providing financial assistance, advice, and other resources to poor countries, classifies
over 200 countries according to their levels of per capita gross national income. The
categories in its 2008 report, as shown in Table 33.1 "World Incomes, Selected Countries",
were as follows:
• Low-income countries: These countries had per capita incomes of $935 or less in
2007. There were 49 countries in this category. About 20% of the world’s total
population of about 6.5 billion people lived in low-income countries in 2007.
• Middle-income countries: There were 95 countries with per capita incomes of more
than $936 but less than $11,455. Middle-income countries are further subdivided
into lower middle-income and upper middle-income countries. Roughly two-thirds of
the world’s population lived in middle-income countries in 2007. We should note
that the percentage of the world’s population living in middle-income countries
increased dramatically (and the percentage living in low-income countries decreased

dramatically) when China and India moved from being low-income to middle-income
countries.
• High-income countries: There were 65 nations with per capita incomes of $11,456 or
more. Just 16% of the world’s total population lived in high-income countries in 2007.
Countries in the low- and middle-income categories are often called developing countries.
A developing country is thus a country that is not among the high-income nations of the
world.The World Development Report 2006 (New York: Oxford University Press, 2006), xiv,
comments on this usage: “The term developing countries includes low- and middle-income
economies and thus may include economies in transition from central planning, as a matter
of convenience. The term advanced countries may be used as a matter of convenience to
denote high-income economics.” Developing countries are sometimes referred to as third-
world countries.
How does the World Bank compare incomes across countries? The World Bank converts
gross national income (GNI) figures to dollars in two ways. One is to take GNI in a local
currency and convert using the exchange rate, averaged over a three-year period in order to
smooth out the effects of currency fluctuations. This type of comparison can, however, be
misleading. A country could have a relatively high standard of living but, for a variety of
reasons, a low exchange rate. The per capita GNI figure would be quite low; the country
would appear to be poorer than it is.
A better approach to comparing incomes converts currencies to dollars on the basis of
purchasing power. This measure is reported in what are called international dollars. An
international dollar has the same purchasing power as does a U.S. dollar in the United
States. This is reported in the column labeled “2007 International $” in Table 33.1 "World
Incomes, Selected Countries".
Table 33.1 World Incomes, Selected Countries
Gross National Income per Capita, 2007
Low-income countries
Middle-income countries
High-income countries
Countries
200
7 $
2007
Internatio
nal $
Countrie
s
200
7 $
2007
Internatio
nal $
Countri
es
2007
$
2007
Internatio
nal $
Burundi
110
330
India
95
0
2,740
Czech
Republi
c
14,45
0
22,020
Sierra
Leone
260
660
China
2,36
0
5,370
Saudi
Arabia
15,44
0
22,910

Gross National Income per Capita, 2007
Low-income countries
Middle-income countries
High-income countries
Countries
200
7 $
2007
Internatio
nal $
Countrie
s
200
7 $
2007
Internatio
nal $
Countri
es
2007
$
2007
Internatio
nal $
Mozambiq
ue
320
690
Thailand
3,40
0
7,880
Israel
21,90
0
25,930
Banglades
h
470
1,340
Iran
3,47
0
10,800
Greece
29,63
0
32,330
Haiti
560
1,150
Jamaica
3,71
0
6,210
Japan
37,67
0
34,600
Uzbekistan
730
2,430
Costa
Rica
5,56
0
10,700
France
38,50
0
33,600
Vietnam
790
2,550
Brazil
5,91
0
9,370
Canada
39,42
0
35,310
Zambia
800
1,220
Argentin
a
6,05
0
12,990
United
States
46,04
0
45,850
Pakistan
870
2,570
Russian
Federati
on
7,56
0
14,400
Ireland
48,14
0
37,090
Nigeria
930
1,770
Turkey
8,02
0
12,350
Norway
76,45
0
53,320
Average
578
1,494
Average
2,87
2
5,952
Average
37,56
6
36,100
Ave.,
lower
middle
1,88
7
4,543

Gross National Income per Capita, 2007
Low-income countries
Middle-income countries
High-income countries
Countries
200
7 $
2007
Internatio
nal $
Countrie
s
200
7 $
2007
Internatio
nal $
Countri
es
2007
$
2007
Internatio
nal $
Ave.,
upper
middle
6,98
7
11,868
Source: World Development Indicators database, World Bank, revised October 17, 2008.
The international dollar estimates typically show higher incomes than estimates based on an
exchange rate conversion. For example, in 2007 Mozambique’s per capita GNI, based on
exchange rates, was $320. Its per capita GNI based the international dollars was $690.
Ranking of countries, both rich and poor, by per capita GNI differs depending on the
measure used. According to the per capita GNI figures in Table 33.1 "World Incomes,
Selected Countries", which convert data in domestic currencies to dollars using exchange
rates, the United States ranked fifteenth of all countries in 2007. Using the international
dollars method, its rank is tenth. China is ranked at 132 when per capita GNI is based on the
exchange rate conversion method but rises to 122 based on the international dollar method.
Characteristics of Low-Income Countries
Low incomes are often associated with other characteristics: severe inequality, poor health
care and education, high unemployment, heavy reliance on agriculture, and rapid population
growth. We will examine most of these problems in this section. Population growth in low-
income nations is examined later in the chapter.
Inequality
Not only are incomes in low-income countries quite low; income distribution is often highly
unequal. Poverty is far more prevalent than per capita numbers suggest, as illustrated by
Lorenz curves, introduced in the chapter on inequality, that show the cumulative shares of
income received by individuals or groups.
Consider Costa Rica and Panama, two Latin American countries with roughly equivalent
levels of per capita GNI (Costa Rica’s was $5,560 and Panama’s $5,510 in 2007). Panama’s
income distribution is comparatively less equal, while Costa Rica’s is far more equal. Figure
33.1 "Poverty and the Distribution of Income: Costa Rica versus Panama" compares the 2003
Lorenz curves for Costa Rica and Panama, the most recent year for which the information
was available. The 20% of the households with the lowest incomes in Costa Rica had twice as
large a share of their country’s total income as did the bottom 20% of households in

Panama. That means Costa Rica’s poor were about twice as well off, in material terms, as
Panama’s poor.
Figure 33.1 Poverty and the Distribution of Income: Costa Rica versus Panama
Costa Rica had about the same per capita GNI as Panama in 2003, but Panama’s income
distribution was far more unequal. Panama’s poor had much lower living standards than
Costa Rica’s poor, as suggested by the Lorenz curves for the two nations.
Source: World Development Indicators Online (revised October 17, 2008).
In general, the greater the degree of inequality, the more desperate is the condition of
people at the bottom of an income distribution. Given the high degree of inequality in many
low-income countries, it is very important to look at income distributions when we compare
living standards in different countries.
Health and Education
Poor nations are typically characterized by low levels of human capital. Where health-care
facilities are inadequate, that human capital can be reduced further by disease. Where
educational resources are poor, there will be little progress in improving human capital.
One indicator of poor health care appears on the supply side. Low-income countries have
fewer doctors, relative to their populations, than high-income countries. For example, the
UN estimates that in 2006 about 60% of mothers giving birth in developing countries had
access to a skilled health-care provider (doctor, nurse, or midwife). While that is up from
47% in 1990, the lack of access to a health-care provider may explain much of the difference

in maternal death rates between developed and developing countries: about nine maternal
deaths per 100,000 live births in developed countries compared to about 450 per 100,000 in
developing countries.United Nations, The Millennium Development Goals Report 2008, 27.
We can also see the results of poor health care in statistics on health. Among the world’s
developing countries, the infant mortality rate, which reports deaths in the first year of life,
was 57 per 1,000 live births in 2005. There were six infant deaths per 1,000 live births
among the high-income countries that year.United Nations Development Program, Human
Development Report 2007/2008 (New York: Palgrave Macmillan, 2007), 264.
Another health issue facing the world’s low-income countries is malnutrition. Malnutrition
rates in all developing countries in the 2002 to 2004 period averaged 17%, 35% in the least
developed countries.
Still another issue is the spread of HIV/AIDS. Here there is some progress. The number of
people newly infected declined from 3 million in 2001 to 2.7 million in 2005. Antiretroviral
treatments are also leading to a reduction in deaths from 2.2 million in 2005 to 2 million in
2007. Longer survival means that the number of people living with HIV (from just under 30
million in 2001 to about 33 million in 2007) is rising and most of the people living with HIV
are in Sub-Saharan Africa.United Nations, The Millennium Development Goals Report 2008,
30.
Education in poor and middle-income nations is improving. In 1991, about 80% of children in
developing countries were enrolled in primary schools. In 2005, about 85% were. The
comparable numbers in developed countries are about 95%. Enrollment rates taper off for
high school (about 53% in 2005 in developing countries compared to 91% in developed
countries).United Nations Development Program, Human Development Report
2007/2008 (New York: Palgrave Macmillan, 2007), 272.
Unemployment
Unemployment is pervasive in low-income nations. These nations, already faced with low
levels of potential output, are producing well below their potential. Unemployment rates in
low-income countries vary widely, reaching as high as 15% or more in some countries. If we
count discouraged workers, people who have given up looking for work but who would take
it if it were available, and people who work less than full time, not by choice but because
more work is unavailable, then unemployment in low-income countries soars—often to
more than 30%.
Migration within low-income countries often contributes to unemployment in urban areas.
Factors such as ethnic violence, poverty, and drought often force people to move from rural
areas to cities, where unemployment rates are already high.
Reliance on Agriculture
One of the dominant characteristics of poor nations is the concentration of employment in
agriculture. Another is the very low productivity of that employment. Agriculture in low-

income countries often employs a majority of the population but produces less than one-
third of GDP.
One of the primary forces behind income growth in wealthy countries has been the shift of
labor out of agriculture and into more productive sectors such as manufacturing. This shift is
also occurring in low-income nations but has lagged far behind.
The solution to these problems lies in economic development, to which we turn next.
Economic Development: A Definition
If the problems of low-income nations are pervasive, the development that helps to solve
those problems must transform the very nature of their societies. The late Austrian
economist Joseph Schumpeter described economic development as a revolutionary process.
Whereas economic growth implies quantitative change in production processes that are
already familiar to the society, economic development requires qualitative change in
virtually every aspect of life.
Robert Heilbroner, an economist at the New School for Social Research in New York, has
argued,
“Economic development is political and social change on a wrenching and tearing scale. … It
is a process of institutional birth and institutional death. It is a time when power shifts, often
violently and abruptly, a time when old regimes go under and new ones rise in their places.
And these are not just the unpleasant side effects of development. They are part and parcel
of the process, the very driving force of change itself.”Robert Heilbroner, Between Capitalism
and Socialism (New York: Vintage Books, 1970), 53–54.
Economic development transforms a nation at its core. But what, precisely, is development?
Many definitions follow Heilbroner in noting the massive institutional and cultural changes
economic development involves. But whatever the requirements of development, its
primary characteristics are rising incomes and improving standards of living. That means
output must increase—and it must increase relative to population growth. And because
inequality is so serious a problem in low-income nations, development must deliver
widespread improvement in living conditions. It therefore seems useful to define economic
development as a process that produces sustained and widely shared gains in per capita real
GDP.
In recent years, the United Nations has constructed measures incorporating dimensions of
economic development that go beyond the level of per capita GDP. The Human
Development Index (HDI) includes three dimensions—life expectancy, educational
attainment (adult literacy and combined primary, secondary, and post-secondary
enrollment), as well as purchasing-power-adjusted per capita real GDP. The Gender
Development Index (GDI) uses the same variables as the HDI but adjusts them downward to
take into account the extent of gender inequality. A third index, the Human Poverty Index
(HPI), measures human deprivation and includes such indicators as the percentage of people
expected to die before age 40, the percentage of underweight children under age 5, the
percentage of adults who are illiterate, and the percentage of people who live in poverty.

The number reported for the HPI shows the percentage of people in the country who suffer
these deprivations.
Throughout most of history, poverty has been the human condition. For most people life
was, in the words of 17th-century English philosopher Thomas Hobbes, “solitary, poor, nasty,
brutish, and short.” Only within the past 200 years have a handful or so of countries been
able to break the chains of economic deprivation and poverty.
Consider these facts:United Nations Development Program, Human Development Report
2007/2008 (New York: Palgrave Macmillan, 2007).
• Over a third of the world’s people live in countries in which total per capita income in
2005 was less than $610 per year; 85% live in countries in which total per capita
income in 2005 was $2,808 or less. Adjusting for purchasing power, the per capita
income levels would be $2,531 and $7,416, respectively. The latter numbers compare
to per capita income in high-income countries of over $30,000.
• Babies born in poor countries are 16 times more likely to die in their first five years
than are babies born in rich countries.
• About a quarter of the populations of low-income countries is undernourished.
• About 40% (over 50% for women) of the people 15 years old and older in low-income
countries are illiterate.
• Roughly one-fourth of the people in low-income countries do not have access to safe
drinking water.
Clearly, the high standards of living enjoyed by people in the world’s developed economies
are the global exception, not the rule. This chapter looks at the problem of improving the
standard of living in poor countries.
Rich and Poor Nations
The World Bank, an international organization designed to support economic development
by providing financial assistance, advice, and other resources to poor countries, classifies
over 200 countries according to their levels of per capita gross national income. The
categories in its 2008 report, as shown in Table 33.1 "World Incomes, Selected Countries",
were as follows:
• Low-income countries: These countries had per capita incomes of $935 or less in
2007. There were 49 countries in this category. About 20% of the world’s total
population of about 6.5 billion people lived in low-income countries in 2007.
• Middle-income countries: There were 95 countries with per capita incomes of more
than $936 but less than $11,455. Middle-income countries are further subdivided
into lower middle-income and upper middle-income countries. Roughly two-thirds of
the world’s population lived in middle-income countries in 2007. We should note
that the percentage of the world’s population living in middle-income countries
increased dramatically (and the percentage living in low-income countries decreased

dramatically) when China and India moved from being low-income to middle-income
countries.
• High-income countries: There were 65 nations with per capita incomes of $11,456 or
more. Just 16% of the world’s total population lived in high-income countries in 2007.
Countries in the low- and middle-income categories are often called developing countries.
A developing country is thus a country that is not among the high-income nations of the
world.The World Development Report 2006 (New York: Oxford University Press, 2006), xiv,
comments on this usage: “The term developing countries includes low- and middle-income
economies and thus may include economies in transition from central planning, as a matter
of convenience. The term advanced countries may be used as a matter of convenience to
denote high-income economics.” Developing countries are sometimes referred to as third-
world countries.
How does the World Bank compare incomes across countries? The World Bank converts
gross national income (GNI) figures to dollars in two ways. One is to take GNI in a local
currency and convert using the exchange rate, averaged over a three-year period in order to
smooth out the effects of currency fluctuations. This type of comparison can, however, be
misleading. A country could have a relatively high standard of living but, for a variety of
reasons, a low exchange rate. The per capita GNI figure would be quite low; the country
would appear to be poorer than it is.
A better approach to comparing incomes converts currencies to dollars on the basis of
purchasing power. This measure is reported in what are called international dollars. An
international dollar has the same purchasing power as does a U.S. dollar in the United
States. This is reported in the column labeled “2007 International $” in Table 33.1 "World
Incomes, Selected Countries".
Table 33.1 World Incomes, Selected Countries
Gross National Income per Capita, 2007
Low-income countries
Middle-income countries
High-income countries
Countries
200
7 $
2007
Internatio
nal $
Countrie
s
200
7 $
2007
Internatio
nal $
Countri
es
2007
$
2007
Internatio
nal $
Burundi
110
330
India
95
0
2,740
Czech
Republi
c
14,45
0
22,020
Sierra
Leone
260
660
China
2,36
0
5,370
Saudi
Arabia
15,44
0
22,910

Gross National Income per Capita, 2007
Low-income countries
Middle-income countries
High-income countries
Countries
200
7 $
2007
Internatio
nal $
Countrie
s
200
7 $
2007
Internatio
nal $
Countri
es
2007
$
2007
Internatio
nal $
Mozambiq
ue
320
690
Thailand
3,40
0
7,880
Israel
21,90
0
25,930
Banglades
h
470
1,340
Iran
3,47
0
10,800
Greece
29,63
0
32,330
Haiti
560
1,150
Jamaica
3,71
0
6,210
Japan
37,67
0
34,600
Uzbekistan
730
2,430
Costa
Rica
5,56
0
10,700
France
38,50
0
33,600
Vietnam
790
2,550
Brazil
5,91
0
9,370
Canada
39,42
0
35,310
Zambia
800
1,220
Argentin
a
6,05
0
12,990
United
States
46,04
0
45,850
Pakistan
870
2,570
Russian
Federati
on
7,56
0
14,400
Ireland
48,14
0
37,090
Nigeria
930
1,770
Turkey
8,02
0
12,350
Norway
76,45
0
53,320
Average
578
1,494
Average
2,87
2
5,952
Average
37,56
6
36,100
Ave.,
lower
middle
1,88
7
4,543

Gross National Income per Capita, 2007
Low-income countries
Middle-income countries
High-income countries
Countries
200
7 $
2007
Internatio
nal $
Countrie
s
200
7 $
2007
Internatio
nal $
Countri
es
2007
$
2007
Internatio
nal $
Ave.,
upper
middle
6,98
7
11,868
Source: World Development Indicators database, World Bank, revised October 17, 2008.
The international dollar estimates typically show higher incomes than estimates based on an
exchange rate conversion. For example, in 2007 Mozambique’s per capita GNI, based on
exchange rates, was $320. Its per capita GNI based the international dollars was $690.
Ranking of countries, both rich and poor, by per capita GNI differs depending on the
measure used. According to the per capita GNI figures in Table 33.1 "World Incomes,
Selected Countries", which convert data in domestic currencies to dollars using exchange
rates, the United States ranked fifteenth of all countries in 2007. Using the international
dollars method, its rank is tenth. China is ranked at 132 when per capita GNI is based on the
exchange rate conversion method but rises to 122 based on the international dollar method.
Characteristics of Low-Income Countries
Low incomes are often associated with other characteristics: severe inequality, poor health
care and education, high unemployment, heavy reliance on agriculture, and rapid population
growth. We will examine most of these problems in this section. Population growth in low-
income nations is examined later in the chapter.
Inequality
Not only are incomes in low-income countries quite low; income distribution is often highly
unequal. Poverty is far more prevalent than per capita numbers suggest, as illustrated by
Lorenz curves, introduced in the chapter on inequality, that show the cumulative shares of
income received by individuals or groups.
Consider Costa Rica and Panama, two Latin American countries with roughly equivalent
levels of per capita GNI (Costa Rica’s was $5,560 and Panama’s $5,510 in 2007). Panama’s
income distribution is comparatively less equal, while Costa Rica’s is far more equal. Figure
33.1 "Poverty and the Distribution of Income: Costa Rica versus Panama" compares the 2003
Lorenz curves for Costa Rica and Panama, the most recent year for which the information
was available. The 20% of the households with the lowest incomes in Costa Rica had twice as
large a share of their country’s total income as did the bottom 20% of households in
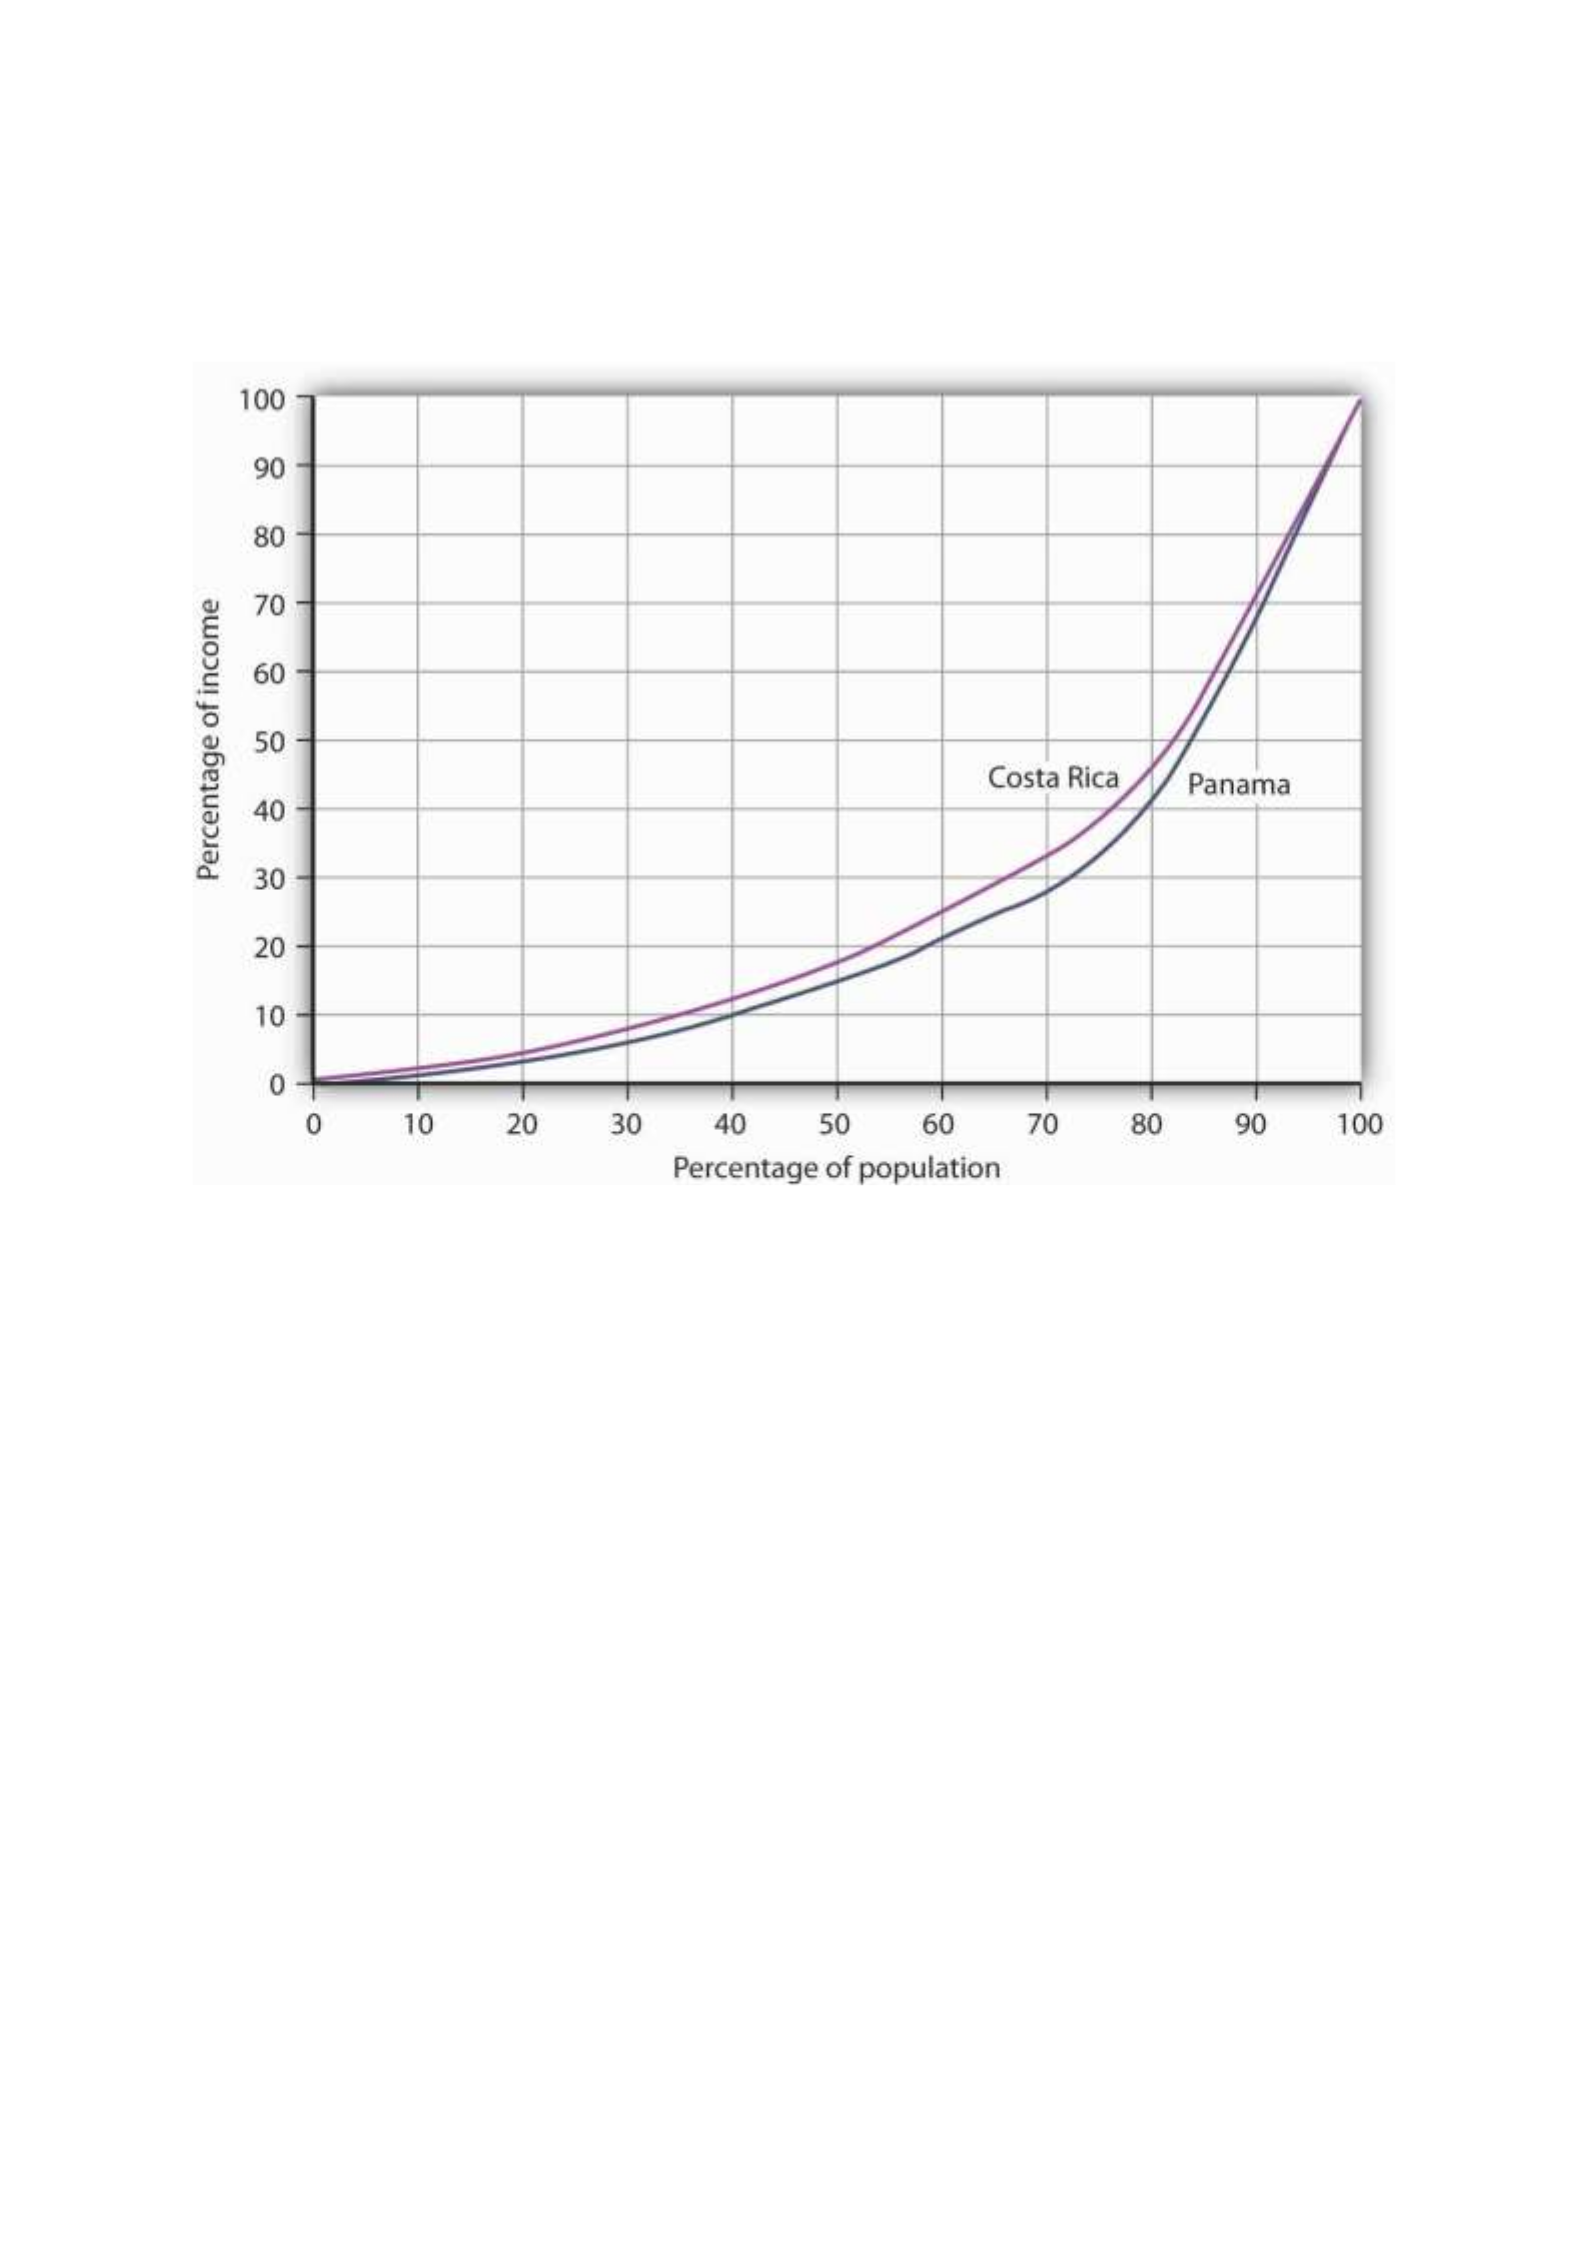
Panama. That means Costa Rica’s poor were about twice as well off, in material terms, as
Panama’s poor.
Figure 33.1 Poverty and the Distribution of Income: Costa Rica versus Panama
Costa Rica had about the same per capita GNI as Panama in 2003, but Panama’s income
distribution was far more unequal. Panama’s poor had much lower living standards than
Costa Rica’s poor, as suggested by the Lorenz curves for the two nations.
Source: World Development Indicators Online (revised October 17, 2008).
In general, the greater the degree of inequality, the more desperate is the condition of
people at the bottom of an income distribution. Given the high degree of inequality in many
low-income countries, it is very important to look at income distributions when we compare
living standards in different countries.
Health and Education
Poor nations are typically characterized by low levels of human capital. Where health-care
facilities are inadequate, that human capital can be reduced further by disease. Where
educational resources are poor, there will be little progress in improving human capital.
One indicator of poor health care appears on the supply side. Low-income countries have
fewer doctors, relative to their populations, than high-income countries. For example, the
UN estimates that in 2006 about 60% of mothers giving birth in developing countries had
access to a skilled health-care provider (doctor, nurse, or midwife). While that is up from
47% in 1990, the lack of access to a health-care provider may explain much of the difference

in maternal death rates between developed and developing countries: about nine maternal
deaths per 100,000 live births in developed countries compared to about 450 per 100,000 in
developing countries.United Nations, The Millennium Development Goals Report 2008, 27.
We can also see the results of poor health care in statistics on health. Among the world’s
developing countries, the infant mortality rate, which reports deaths in the first year of life,
was 57 per 1,000 live births in 2005. There were six infant deaths per 1,000 live births
among the high-income countries that year.United Nations Development Program, Human
Development Report 2007/2008 (New York: Palgrave Macmillan, 2007), 264.
Another health issue facing the world’s low-income countries is malnutrition. Malnutrition
rates in all developing countries in the 2002 to 2004 period averaged 17%, 35% in the least
developed countries.
Still another issue is the spread of HIV/AIDS. Here there is some progress. The number of
people newly infected declined from 3 million in 2001 to 2.7 million in 2005. Antiretroviral
treatments are also leading to a reduction in deaths from 2.2 million in 2005 to 2 million in
2007. Longer survival means that the number of people living with HIV (from just under 30
million in 2001 to about 33 million in 2007) is rising and most of the people living with HIV
are in Sub-Saharan Africa.United Nations, The Millennium Development Goals Report 2008,
30.
Education in poor and middle-income nations is improving. In 1991, about 80% of children in
developing countries were enrolled in primary schools. In 2005, about 85% were. The
comparable numbers in developed countries are about 95%. Enrollment rates taper off for
high school (about 53% in 2005 in developing countries compared to 91% in developed
countries).United Nations Development Program, Human Development Report
2007/2008 (New York: Palgrave Macmillan, 2007), 272.
Unemployment
Unemployment is pervasive in low-income nations. These nations, already faced with low
levels of potential output, are producing well below their potential. Unemployment rates in
low-income countries vary widely, reaching as high as 15% or more in some countries. If we
count discouraged workers, people who have given up looking for work but who would take
it if it were available, and people who work less than full time, not by choice but because
more work is unavailable, then unemployment in low-income countries soars—often to
more than 30%.
Migration within low-income countries often contributes to unemployment in urban areas.
Factors such as ethnic violence, poverty, and drought often force people to move from rural
areas to cities, where unemployment rates are already high.
Reliance on Agriculture
One of the dominant characteristics of poor nations is the concentration of employment in
agriculture. Another is the very low productivity of that employment. Agriculture in low-

income countries often employs a majority of the population but produces less than one-
third of GDP.
One of the primary forces behind income growth in wealthy countries has been the shift of
labor out of agriculture and into more productive sectors such as manufacturing. This shift is
also occurring in low-income nations but has lagged far behind.
The solution to these problems lies in economic development, to which we turn next.
Economic Development: A Definition
If the problems of low-income nations are pervasive, the development that helps to solve
those problems must transform the very nature of their societies. The late Austrian
economist Joseph Schumpeter described economic development as a revolutionary process.
Whereas economic growth implies quantitative change in production processes that are
already familiar to the society, economic development requires qualitative change in
virtually every aspect of life.
Robert Heilbroner, an economist at the New School for Social Research in New York, has
argued,
“Economic development is political and social change on a wrenching and tearing scale. … It
is a process of institutional birth and institutional death. It is a time when power shifts, often
violently and abruptly, a time when old regimes go under and new ones rise in their places.
And these are not just the unpleasant side effects of development. They are part and parcel
of the process, the very driving force of change itself.”Robert Heilbroner, Between Capitalism
and Socialism (New York: Vintage Books, 1970), 53–54.
Economic development transforms a nation at its core. But what, precisely, is development?
Many definitions follow Heilbroner in noting the massive institutional and cultural changes
economic development involves. But whatever the requirements of development, its
primary characteristics are rising incomes and improving standards of living. That means
output must increase—and it must increase relative to population growth. And because
inequality is so serious a problem in low-income nations, development must deliver
widespread improvement in living conditions. It therefore seems useful to define economic
development as a process that produces sustained and widely shared gains in per capita real
GDP.
In recent years, the United Nations has constructed measures incorporating dimensions of
economic development that go beyond the level of per capita GDP. The Human
Development Index (HDI) includes three dimensions—life expectancy, educational
attainment (adult literacy and combined primary, secondary, and post-secondary
enrollment), as well as purchasing-power-adjusted per capita real GDP. The Gender
Development Index (GDI) uses the same variables as the HDI but adjusts them downward to
take into account the extent of gender inequality. A third index, the Human Poverty Index
(HPI), measures human deprivation and includes such indicators as the percentage of people
expected to die before age 40, the percentage of underweight children under age 5, the
percentage of adults who are illiterate, and the percentage of people who live in poverty.

The number reported for the HPI shows the percentage of people in the country who suffer
these deprivations.
Throughout most of history, poverty has been the human condition. For most people life
was, in the words of 17th-century English philosopher Thomas Hobbes, “solitary, poor, nasty,
brutish, and short.” Only within the past 200 years have a handful or so of countries been
able to break the chains of economic deprivation and poverty.
Consider these facts:United Nations Development Program, Human Development Report
2007/2008 (New York: Palgrave Macmillan, 2007).
• Over a third of the world’s people live in countries in which total per capita income in
2005 was less than $610 per year; 85% live in countries in which total per capita
income in 2005 was $2,808 or less. Adjusting for purchasing power, the per capita
income levels would be $2,531 and $7,416, respectively. The latter numbers compare
to per capita income in high-income countries of over $30,000.
• Babies born in poor countries are 16 times more likely to die in their first five years
than are babies born in rich countries.
• About a quarter of the populations of low-income countries is undernourished.
• About 40% (over 50% for women) of the people 15 years old and older in low-income
countries are illiterate.
• Roughly one-fourth of the people in low-income countries do not have access to safe
drinking water.
Clearly, the high standards of living enjoyed by people in the world’s developed economies
are the global exception, not the rule. This chapter looks at the problem of improving the
standard of living in poor countries.
Rich and Poor Nations
The World Bank, an international organization designed to support economic development
by providing financial assistance, advice, and other resources to poor countries, classifies
over 200 countries according to their levels of per capita gross national income. The
categories in its 2008 report, as shown in Table 33.1 "World Incomes, Selected Countries",
were as follows:
• Low-income countries: These countries had per capita incomes of $935 or less in
2007. There were 49 countries in this category. About 20% of the world’s total
population of about 6.5 billion people lived in low-income countries in 2007.
• Middle-income countries: There were 95 countries with per capita incomes of more
than $936 but less than $11,455. Middle-income countries are further subdivided
into lower middle-income and upper middle-income countries. Roughly two-thirds of
the world’s population lived in middle-income countries in 2007. We should note
that the percentage of the world’s population living in middle-income countries
increased dramatically (and the percentage living in low-income countries decreased

dramatically) when China and India moved from being low-income to middle-income
countries.
• High-income countries: There were 65 nations with per capita incomes of $11,456 or
more. Just 16% of the world’s total population lived in high-income countries in 2007.
Countries in the low- and middle-income categories are often called developing countries.
A developing country is thus a country that is not among the high-income nations of the
world.The World Development Report 2006 (New York: Oxford University Press, 2006), xiv,
comments on this usage: “The term developing countries includes low- and middle-income
economies and thus may include economies in transition from central planning, as a matter
of convenience. The term advanced countries may be used as a matter of convenience to
denote high-income economics.” Developing countries are sometimes referred to as third-
world countries.
How does the World Bank compare incomes across countries? The World Bank converts
gross national income (GNI) figures to dollars in two ways. One is to take GNI in a local
currency and convert using the exchange rate, averaged over a three-year period in order to
smooth out the effects of currency fluctuations. This type of comparison can, however, be
misleading. A country could have a relatively high standard of living but, for a variety of
reasons, a low exchange rate. The per capita GNI figure would be quite low; the country
would appear to be poorer than it is.
A better approach to comparing incomes converts currencies to dollars on the basis of
purchasing power. This measure is reported in what are called international dollars. An
international dollar has the same purchasing power as does a U.S. dollar in the United
States. This is reported in the column labeled “2007 International $” in Table 33.1 "World
Incomes, Selected Countries".
Table 33.1 World Incomes, Selected Countries
Gross National Income per Capita, 2007
Low-income countries
Middle-income countries
High-income countries
Countries
200
7 $
2007
Internatio
nal $
Countrie
s
200
7 $
2007
Internatio
nal $
Countri
es
2007
$
2007
Internatio
nal $
Burundi
110
330
India
95
0
2,740
Czech
Republi
c
14,45
0
22,020
Sierra
Leone
260
660
China
2,36
0
5,370
Saudi
Arabia
15,44
0
22,910

Gross National Income per Capita, 2007
Low-income countries
Middle-income countries
High-income countries
Countries
200
7 $
2007
Internatio
nal $
Countrie
s
200
7 $
2007
Internatio
nal $
Countri
es
2007
$
2007
Internatio
nal $
Mozambiq
ue
320
690
Thailand
3,40
0
7,880
Israel
21,90
0
25,930
Banglades
h
470
1,340
Iran
3,47
0
10,800
Greece
29,63
0
32,330
Haiti
560
1,150
Jamaica
3,71
0
6,210
Japan
37,67
0
34,600
Uzbekistan
730
2,430
Costa
Rica
5,56
0
10,700
France
38,50
0
33,600
Vietnam
790
2,550
Brazil
5,91
0
9,370
Canada
39,42
0
35,310
Zambia
800
1,220
Argentin
a
6,05
0
12,990
United
States
46,04
0
45,850
Pakistan
870
2,570
Russian
Federati
on
7,56
0
14,400
Ireland
48,14
0
37,090
Nigeria
930
1,770
Turkey
8,02
0
12,350
Norway
76,45
0
53,320
Average
578
1,494
Average
2,87
2
5,952
Average
37,56
6
36,100
Ave.,
lower
middle
1,88
7
4,543

Gross National Income per Capita, 2007
Low-income countries
Middle-income countries
High-income countries
Countries
200
7 $
2007
Internatio
nal $
Countrie
s
200
7 $
2007
Internatio
nal $
Countri
es
2007
$
2007
Internatio
nal $
Ave.,
upper
middle
6,98
7
11,868
Source: World Development Indicators database, World Bank, revised October 17, 2008.
The international dollar estimates typically show higher incomes than estimates based on an
exchange rate conversion. For example, in 2007 Mozambique’s per capita GNI, based on
exchange rates, was $320. Its per capita GNI based the international dollars was $690.
Ranking of countries, both rich and poor, by per capita GNI differs depending on the
measure used. According to the per capita GNI figures in Table 33.1 "World Incomes,
Selected Countries", which convert data in domestic currencies to dollars using exchange
rates, the United States ranked fifteenth of all countries in 2007. Using the international
dollars method, its rank is tenth. China is ranked at 132 when per capita GNI is based on the
exchange rate conversion method but rises to 122 based on the international dollar method.
Characteristics of Low-Income Countries
Low incomes are often associated with other characteristics: severe inequality, poor health
care and education, high unemployment, heavy reliance on agriculture, and rapid population
growth. We will examine most of these problems in this section. Population growth in low-
income nations is examined later in the chapter.
Inequality
Not only are incomes in low-income countries quite low; income distribution is often highly
unequal. Poverty is far more prevalent than per capita numbers suggest, as illustrated by
Lorenz curves, introduced in the chapter on inequality, that show the cumulative shares of
income received by individuals or groups.
Consider Costa Rica and Panama, two Latin American countries with roughly equivalent
levels of per capita GNI (Costa Rica’s was $5,560 and Panama’s $5,510 in 2007). Panama’s
income distribution is comparatively less equal, while Costa Rica’s is far more equal. Figure
33.1 "Poverty and the Distribution of Income: Costa Rica versus Panama" compares the 2003
Lorenz curves for Costa Rica and Panama, the most recent year for which the information
was available. The 20% of the households with the lowest incomes in Costa Rica had twice as
large a share of their country’s total income as did the bottom 20% of households in

Panama. That means Costa Rica’s poor were about twice as well off, in material terms, as
Panama’s poor.
Figure 33.1 Poverty and the Distribution of Income: Costa Rica versus Panama
Costa Rica had about the same per capita GNI as Panama in 2003, but Panama’s income
distribution was far more unequal. Panama’s poor had much lower living standards than
Costa Rica’s poor, as suggested by the Lorenz curves for the two nations.
Source: World Development Indicators Online (revised October 17, 2008).
In general, the greater the degree of inequality, the more desperate is the condition of
people at the bottom of an income distribution. Given the high degree of inequality in many
low-income countries, it is very important to look at income distributions when we compare
living standards in different countries.
Health and Education
Poor nations are typically characterized by low levels of human capital. Where health-care
facilities are inadequate, that human capital can be reduced further by disease. Where
educational resources are poor, there will be little progress in improving human capital.
One indicator of poor health care appears on the supply side. Low-income countries have
fewer doctors, relative to their populations, than high-income countries. For example, the
UN estimates that in 2006 about 60% of mothers giving birth in developing countries had
access to a skilled health-care provider (doctor, nurse, or midwife). While that is up from
47% in 1990, the lack of access to a health-care provider may explain much of the difference

in maternal death rates between developed and developing countries: about nine maternal
deaths per 100,000 live births in developed countries compared to about 450 per 100,000 in
developing countries.United Nations, The Millennium Development Goals Report 2008, 27.
We can also see the results of poor health care in statistics on health. Among the world’s
developing countries, the infant mortality rate, which reports deaths in the first year of life,
was 57 per 1,000 live births in 2005. There were six infant deaths per 1,000 live births
among the high-income countries that year.United Nations Development Program, Human
Development Report 2007/2008 (New York: Palgrave Macmillan, 2007), 264.
Another health issue facing the world’s low-income countries is malnutrition. Malnutrition
rates in all developing countries in the 2002 to 2004 period averaged 17%, 35% in the least
developed countries.
Still another issue is the spread of HIV/AIDS. Here there is some progress. The number of
people newly infected declined from 3 million in 2001 to 2.7 million in 2005. Antiretroviral
treatments are also leading to a reduction in deaths from 2.2 million in 2005 to 2 million in
2007. Longer survival means that the number of people living with HIV (from just under 30
million in 2001 to about 33 million in 2007) is rising and most of the people living with HIV
are in Sub-Saharan Africa.United Nations, The Millennium Development Goals Report 2008,
30.
Education in poor and middle-income nations is improving. In 1991, about 80% of children in
developing countries were enrolled in primary schools. In 2005, about 85% were. The
comparable numbers in developed countries are about 95%. Enrollment rates taper off for
high school (about 53% in 2005 in developing countries compared to 91% in developed
countries).United Nations Development Program, Human Development Report
2007/2008 (New York: Palgrave Macmillan, 2007), 272.
Unemployment
Unemployment is pervasive in low-income nations. These nations, already faced with low
levels of potential output, are producing well below their potential. Unemployment rates in
low-income countries vary widely, reaching as high as 15% or more in some countries. If we
count discouraged workers, people who have given up looking for work but who would take
it if it were available, and people who work less than full time, not by choice but because
more work is unavailable, then unemployment in low-income countries soars—often to
more than 30%.
Migration within low-income countries often contributes to unemployment in urban areas.
Factors such as ethnic violence, poverty, and drought often force people to move from rural
areas to cities, where unemployment rates are already high.
Reliance on Agriculture
One of the dominant characteristics of poor nations is the concentration of employment in
agriculture. Another is the very low productivity of that employment. Agriculture in low-

income countries often employs a majority of the population but produces less than one-
third of GDP.
One of the primary forces behind income growth in wealthy countries has been the shift of
labor out of agriculture and into more productive sectors such as manufacturing. This shift is
also occurring in low-income nations but has lagged far behind.
The solution to these problems lies in economic development, to which we turn next.
Economic Development: A Definition
If the problems of low-income nations are pervasive, the development that helps to solve
those problems must transform the very nature of their societies. The late Austrian
economist Joseph Schumpeter described economic development as a revolutionary process.
Whereas economic growth implies quantitative change in production processes that are
already familiar to the society, economic development requires qualitative change in
virtually every aspect of life.
Robert Heilbroner, an economist at the New School for Social Research in New York, has
argued,
“Economic development is political and social change on a wrenching and tearing scale. … It
is a process of institutional birth and institutional death. It is a time when power shifts, often
violently and abruptly, a time when old regimes go under and new ones rise in their places.
And these are not just the unpleasant side effects of development. They are part and parcel
of the process, the very driving force of change itself.”Robert Heilbroner, Between Capitalism
and Socialism (New York: Vintage Books, 1970), 53–54.
Economic development transforms a nation at its core. But what, precisely, is development?
Many definitions follow Heilbroner in noting the massive institutional and cultural changes
economic development involves. But whatever the requirements of development, its
primary characteristics are rising incomes and improving standards of living. That means
output must increase—and it must increase relative to population growth. And because
inequality is so serious a problem in low-income nations, development must deliver
widespread improvement in living conditions. It therefore seems useful to define economic
development as a process that produces sustained and widely shared gains in per capita real
GDP.
In recent years, the United Nations has constructed measures incorporating dimensions of
economic development that go beyond the level of per capita GDP. The Human
Development Index (HDI) includes three dimensions—life expectancy, educational
attainment (adult literacy and combined primary, secondary, and post-secondary
enrollment), as well as purchasing-power-adjusted per capita real GDP. The Gender
Development Index (GDI) uses the same variables as the HDI but adjusts them downward to
take into account the extent of gender inequality. A third index, the Human Poverty Index
(HPI), measures human deprivation and includes such indicators as the percentage of people
expected to die before age 40, the percentage of underweight children under age 5, the
percentage of adults who are illiterate, and the percentage of people who live in poverty.

The number reported for the HPI shows the percentage of people in the country who suffer
these deprivations.
Throughout most of history, poverty has been the human condition. For most people life
was, in the words of 17th-century English philosopher Thomas Hobbes, “solitary, poor, nasty,
brutish, and short.” Only within the past 200 years have a handful or so of countries been
able to break the chains of economic deprivation and poverty.
Consider these facts:United Nations Development Program, Human Development Report
2007/2008 (New York: Palgrave Macmillan, 2007).
• Over a third of the world’s people live in countries in which total per capita income in
2005 was less than $610 per year; 85% live in countries in which total per capita
income in 2005 was $2,808 or less. Adjusting for purchasing power, the per capita
income levels would be $2,531 and $7,416, respectively. The latter numbers compare
to per capita income in high-income countries of over $30,000.
• Babies born in poor countries are 16 times more likely to die in their first five years
than are babies born in rich countries.
• About a quarter of the populations of low-income countries is undernourished.
• About 40% (over 50% for women) of the people 15 years old and older in low-income
countries are illiterate.
• Roughly one-fourth of the people in low-income countries do not have access to safe
drinking water.
Clearly, the high standards of living enjoyed by people in the world’s developed economies
are the global exception, not the rule. This chapter looks at the problem of improving the
standard of living in poor countries.
Rich and Poor Nations
The World Bank, an international organization designed to support economic development
by providing financial assistance, advice, and other resources to poor countries, classifies
over 200 countries according to their levels of per capita gross national income. The
categories in its 2008 report, as shown in Table 33.1 "World Incomes, Selected Countries",
were as follows:
• Low-income countries: These countries had per capita incomes of $935 or less in
2007. There were 49 countries in this category. About 20% of the world’s total
population of about 6.5 billion people lived in low-income countries in 2007.
• Middle-income countries: There were 95 countries with per capita incomes of more
than $936 but less than $11,455. Middle-income countries are further subdivided
into lower middle-income and upper middle-income countries. Roughly two-thirds of
the world’s population lived in middle-income countries in 2007. We should note
that the percentage of the world’s population living in middle-income countries
increased dramatically (and the percentage living in low-income countries decreased

dramatically) when China and India moved from being low-income to middle-income
countries.
• High-income countries: There were 65 nations with per capita incomes of $11,456 or
more. Just 16% of the world’s total population lived in high-income countries in 2007.
Countries in the low- and middle-income categories are often called developing countries.
A developing country is thus a country that is not among the high-income nations of the
world.The World Development Report 2006 (New York: Oxford University Press, 2006), xiv,
comments on this usage: “The term developing countries includes low- and middle-income
economies and thus may include economies in transition from central planning, as a matter
of convenience. The term advanced countries may be used as a matter of convenience to
denote high-income economics.” Developing countries are sometimes referred to as third-
world countries.
How does the World Bank compare incomes across countries? The World Bank converts
gross national income (GNI) figures to dollars in two ways. One is to take GNI in a local
currency and convert using the exchange rate, averaged over a three-year period in order to
smooth out the effects of currency fluctuations. This type of comparison can, however, be
misleading. A country could have a relatively high standard of living but, for a variety of
reasons, a low exchange rate. The per capita GNI figure would be quite low; the country
would appear to be poorer than it is.
A better approach to comparing incomes converts currencies to dollars on the basis of
purchasing power. This measure is reported in what are called international dollars. An
international dollar has the same purchasing power as does a U.S. dollar in the United
States. This is reported in the column labeled “2007 International $” in Table 33.1 "World
Incomes, Selected Countries".
Table 33.1 World Incomes, Selected Countries
Gross National Income per Capita, 2007
Low-income countries
Middle-income countries
High-income countries
Countries
200
7 $
2007
Internatio
nal $
Countrie
s
200
7 $
2007
Internatio
nal $
Countri
es
2007
$
2007
Internatio
nal $
Burundi
110
330
India
95
0
2,740
Czech
Republi
c
14,45
0
22,020
Sierra
Leone
260
660
China
2,36
0
5,370
Saudi
Arabia
15,44
0
22,910

Gross National Income per Capita, 2007
Low-income countries
Middle-income countries
High-income countries
Countries
200
7 $
2007
Internatio
nal $
Countrie
s
200
7 $
2007
Internatio
nal $
Countri
es
2007
$
2007
Internatio
nal $
Mozambiq
ue
320
690
Thailand
3,40
0
7,880
Israel
21,90
0
25,930
Banglades
h
470
1,340
Iran
3,47
0
10,800
Greece
29,63
0
32,330
Haiti
560
1,150
Jamaica
3,71
0
6,210
Japan
37,67
0
34,600
Uzbekistan
730
2,430
Costa
Rica
5,56
0
10,700
France
38,50
0
33,600
Vietnam
790
2,550
Brazil
5,91
0
9,370
Canada
39,42
0
35,310
Zambia
800
1,220
Argentin
a
6,05
0
12,990
United
States
46,04
0
45,850
Pakistan
870
2,570
Russian
Federati
on
7,56
0
14,400
Ireland
48,14
0
37,090
Nigeria
930
1,770
Turkey
8,02
0
12,350
Norway
76,45
0
53,320
Average
578
1,494
Average
2,87
2
5,952
Average
37,56
6
36,100
Ave.,
lower
middle
1,88
7
4,543

Gross National Income per Capita, 2007
Low-income countries
Middle-income countries
High-income countries
Countries
200
7 $
2007
Internatio
nal $
Countrie
s
200
7 $
2007
Internatio
nal $
Countri
es
2007
$
2007
Internatio
nal $
Ave.,
upper
middle
6,98
7
11,868
Source: World Development Indicators database, World Bank, revised October 17, 2008.
The international dollar estimates typically show higher incomes than estimates based on an
exchange rate conversion. For example, in 2007 Mozambique’s per capita GNI, based on
exchange rates, was $320. Its per capita GNI based the international dollars was $690.
Ranking of countries, both rich and poor, by per capita GNI differs depending on the
measure used. According to the per capita GNI figures in Table 33.1 "World Incomes,
Selected Countries", which convert data in domestic currencies to dollars using exchange
rates, the United States ranked fifteenth of all countries in 2007. Using the international
dollars method, its rank is tenth. China is ranked at 132 when per capita GNI is based on the
exchange rate conversion method but rises to 122 based on the international dollar method.
Characteristics of Low-Income Countries
Low incomes are often associated with other characteristics: severe inequality, poor health
care and education, high unemployment, heavy reliance on agriculture, and rapid population
growth. We will examine most of these problems in this section. Population growth in low-
income nations is examined later in the chapter.
Inequality
Not only are incomes in low-income countries quite low; income distribution is often highly
unequal. Poverty is far more prevalent than per capita numbers suggest, as illustrated by
Lorenz curves, introduced in the chapter on inequality, that show the cumulative shares of
income received by individuals or groups.
Consider Costa Rica and Panama, two Latin American countries with roughly equivalent
levels of per capita GNI (Costa Rica’s was $5,560 and Panama’s $5,510 in 2007). Panama’s
income distribution is comparatively less equal, while Costa Rica’s is far more equal. Figure
33.1 "Poverty and the Distribution of Income: Costa Rica versus Panama" compares the 2003
Lorenz curves for Costa Rica and Panama, the most recent year for which the information
was available. The 20% of the households with the lowest incomes in Costa Rica had twice as
large a share of their country’s total income as did the bottom 20% of households in

Panama. That means Costa Rica’s poor were about twice as well off, in material terms, as
Panama’s poor.
Figure 33.1 Poverty and the Distribution of Income: Costa Rica versus Panama
Costa Rica had about the same per capita GNI as Panama in 2003, but Panama’s income
distribution was far more unequal. Panama’s poor had much lower living standards than
Costa Rica’s poor, as suggested by the Lorenz curves for the two nations.
Source: World Development Indicators Online (revised October 17, 2008).
In general, the greater the degree of inequality, the more desperate is the condition of
people at the bottom of an income distribution. Given the high degree of inequality in many
low-income countries, it is very important to look at income distributions when we compare
living standards in different countries.
Health and Education
Poor nations are typically characterized by low levels of human capital. Where health-care
facilities are inadequate, that human capital can be reduced further by disease. Where
educational resources are poor, there will be little progress in improving human capital.
One indicator of poor health care appears on the supply side. Low-income countries have
fewer doctors, relative to their populations, than high-income countries. For example, the
UN estimates that in 2006 about 60% of mothers giving birth in developing countries had
access to a skilled health-care provider (doctor, nurse, or midwife). While that is up from
47% in 1990, the lack of access to a health-care provider may explain much of the difference

in maternal death rates between developed and developing countries: about nine maternal
deaths per 100,000 live births in developed countries compared to about 450 per 100,000 in
developing countries.United Nations, The Millennium Development Goals Report 2008, 27.
We can also see the results of poor health care in statistics on health. Among the world’s
developing countries, the infant mortality rate, which reports deaths in the first year of life,
was 57 per 1,000 live births in 2005. There were six infant deaths per 1,000 live births
among the high-income countries that year.United Nations Development Program, Human
Development Report 2007/2008 (New York: Palgrave Macmillan, 2007), 264.
Another health issue facing the world’s low-income countries is malnutrition. Malnutrition
rates in all developing countries in the 2002 to 2004 period averaged 17%, 35% in the least
developed countries.
Still another issue is the spread of HIV/AIDS. Here there is some progress. The number of
people newly infected declined from 3 million in 2001 to 2.7 million in 2005. Antiretroviral
treatments are also leading to a reduction in deaths from 2.2 million in 2005 to 2 million in
2007. Longer survival means that the number of people living with HIV (from just under 30
million in 2001 to about 33 million in 2007) is rising and most of the people living with HIV
are in Sub-Saharan Africa.United Nations, The Millennium Development Goals Report 2008,
30.
Education in poor and middle-income nations is improving. In 1991, about 80% of children in
developing countries were enrolled in primary schools. In 2005, about 85% were. The
comparable numbers in developed countries are about 95%. Enrollment rates taper off for
high school (about 53% in 2005 in developing countries compared to 91% in developed
countries).United Nations Development Program, Human Development Report
2007/2008 (New York: Palgrave Macmillan, 2007), 272.
Unemployment
Unemployment is pervasive in low-income nations. These nations, already faced with low
levels of potential output, are producing well below their potential. Unemployment rates in
low-income countries vary widely, reaching as high as 15% or more in some countries. If we
count discouraged workers, people who have given up looking for work but who would take
it if it were available, and people who work less than full time, not by choice but because
more work is unavailable, then unemployment in low-income countries soars—often to
more than 30%.
Migration within low-income countries often contributes to unemployment in urban areas.
Factors such as ethnic violence, poverty, and drought often force people to move from rural
areas to cities, where unemployment rates are already high.
Reliance on Agriculture
One of the dominant characteristics of poor nations is the concentration of employment in
agriculture. Another is the very low productivity of that employment. Agriculture in low-

income countries often employs a majority of the population but produces less than one-
third of GDP.
One of the primary forces behind income growth in wealthy countries has been the shift of
labor out of agriculture and into more productive sectors such as manufacturing. This shift is
also occurring in low-income nations but has lagged far behind.
The solution to these problems lies in economic development, to which we turn next.
Economic Development: A Definition
If the problems of low-income nations are pervasive, the development that helps to solve
those problems must transform the very nature of their societies. The late Austrian
economist Joseph Schumpeter described economic development as a revolutionary process.
Whereas economic growth implies quantitative change in production processes that are
already familiar to the society, economic development requires qualitative change in
virtually every aspect of life.
Robert Heilbroner, an economist at the New School for Social Research in New York, has
argued,
“Economic development is political and social change on a wrenching and tearing scale. … It
is a process of institutional birth and institutional death. It is a time when power shifts, often
violently and abruptly, a time when old regimes go under and new ones rise in their places.
And these are not just the unpleasant side effects of development. They are part and parcel
of the process, the very driving force of change itself.”Robert Heilbroner, Between Capitalism
and Socialism (New York: Vintage Books, 1970), 53–54.
Economic development transforms a nation at its core. But what, precisely, is development?
Many definitions follow Heilbroner in noting the massive institutional and cultural changes
economic development involves. But whatever the requirements of development, its
primary characteristics are rising incomes and improving standards of living. That means
output must increase—and it must increase relative to population growth. And because
inequality is so serious a problem in low-income nations, development must deliver
widespread improvement in living conditions. It therefore seems useful to define economic
development as a process that produces sustained and widely shared gains in per capita real
GDP.
In recent years, the United Nations has constructed measures incorporating dimensions of
economic development that go beyond the level of per capita GDP. The Human
Development Index (HDI) includes three dimensions—life expectancy, educational
attainment (adult literacy and combined primary, secondary, and post-secondary
enrollment), as well as purchasing-power-adjusted per capita real GDP. The Gender
Development Index (GDI) uses the same variables as the HDI but adjusts them downward to
take into account the extent of gender inequality. A third index, the Human Poverty Index
(HPI), measures human deprivation and includes such indicators as the percentage of people
expected to die before age 40, the percentage of underweight children under age 5, the
percentage of adults who are illiterate, and the percentage of people who live in poverty.

The number reported for the HPI shows the percentage of people in the country who suffer
these deprivations.
The international dollar estimates typically show higher incomes than estimates based on an
exchange rate conversion. For example, in 2007 Mozambique’s per capita GNI, based on
exchange rates, was $320. Its per capita GNI based the international dollars was $690.
Ranking of countries, both rich and poor, by per capita GNI differs depending on the
measure used. According to the per capita GNI figures in Table 33.1 "World Incomes,
Selected Countries", which convert data in domestic currencies to dollars using exchange
rates, the United States ranked fifteenth of all countries in 2007. Using the international
dollars method, its rank is tenth. China is ranked at 132 when per capita GNI is based on the
exchange rate conversion method but rises to 122 based on the international dollar method.
Characteristics of Low-Income Countries
Low incomes are often associated with other characteristics: severe inequality, poor health
care and education, high unemployment, heavy reliance on agriculture, and rapid population
growth. We will examine most of these problems in this section. Population growth in low-
income nations is examined later in the chapter.
Inequality
Not only are incomes in low-income countries quite low; income distribution is often highly
unequal. Poverty is far more prevalent than per capita numbers suggest, as illustrated by
Lorenz curves, introduced in the chapter on inequality, that show the cumulative shares of
income received by individuals or groups.
Consider Costa Rica and Panama, two Latin American countries with roughly equivalent
levels of per capita GNI (Costa Rica’s was $5,560 and Panama’s $5,510 in 2007). Panama’s
income distribution is comparatively less equal, while Costa Rica’s is far more equal. Figure
33.1 "Poverty and the Distribution of Income: Costa Rica versus Panama" compares the 2003
Lorenz curves for Costa Rica and Panama, the most recent year for which the information
was available. The 20% of the households with the lowest incomes in Costa Rica had twice as
large a share of their country’s total income as did the bottom 20% of households in
Panama. That means Costa Rica’s poor were about twice as well off, in material terms, as
Panama’s poor.
Figure 33.1 Poverty and the Distribution of Income: Costa Rica versus Panama
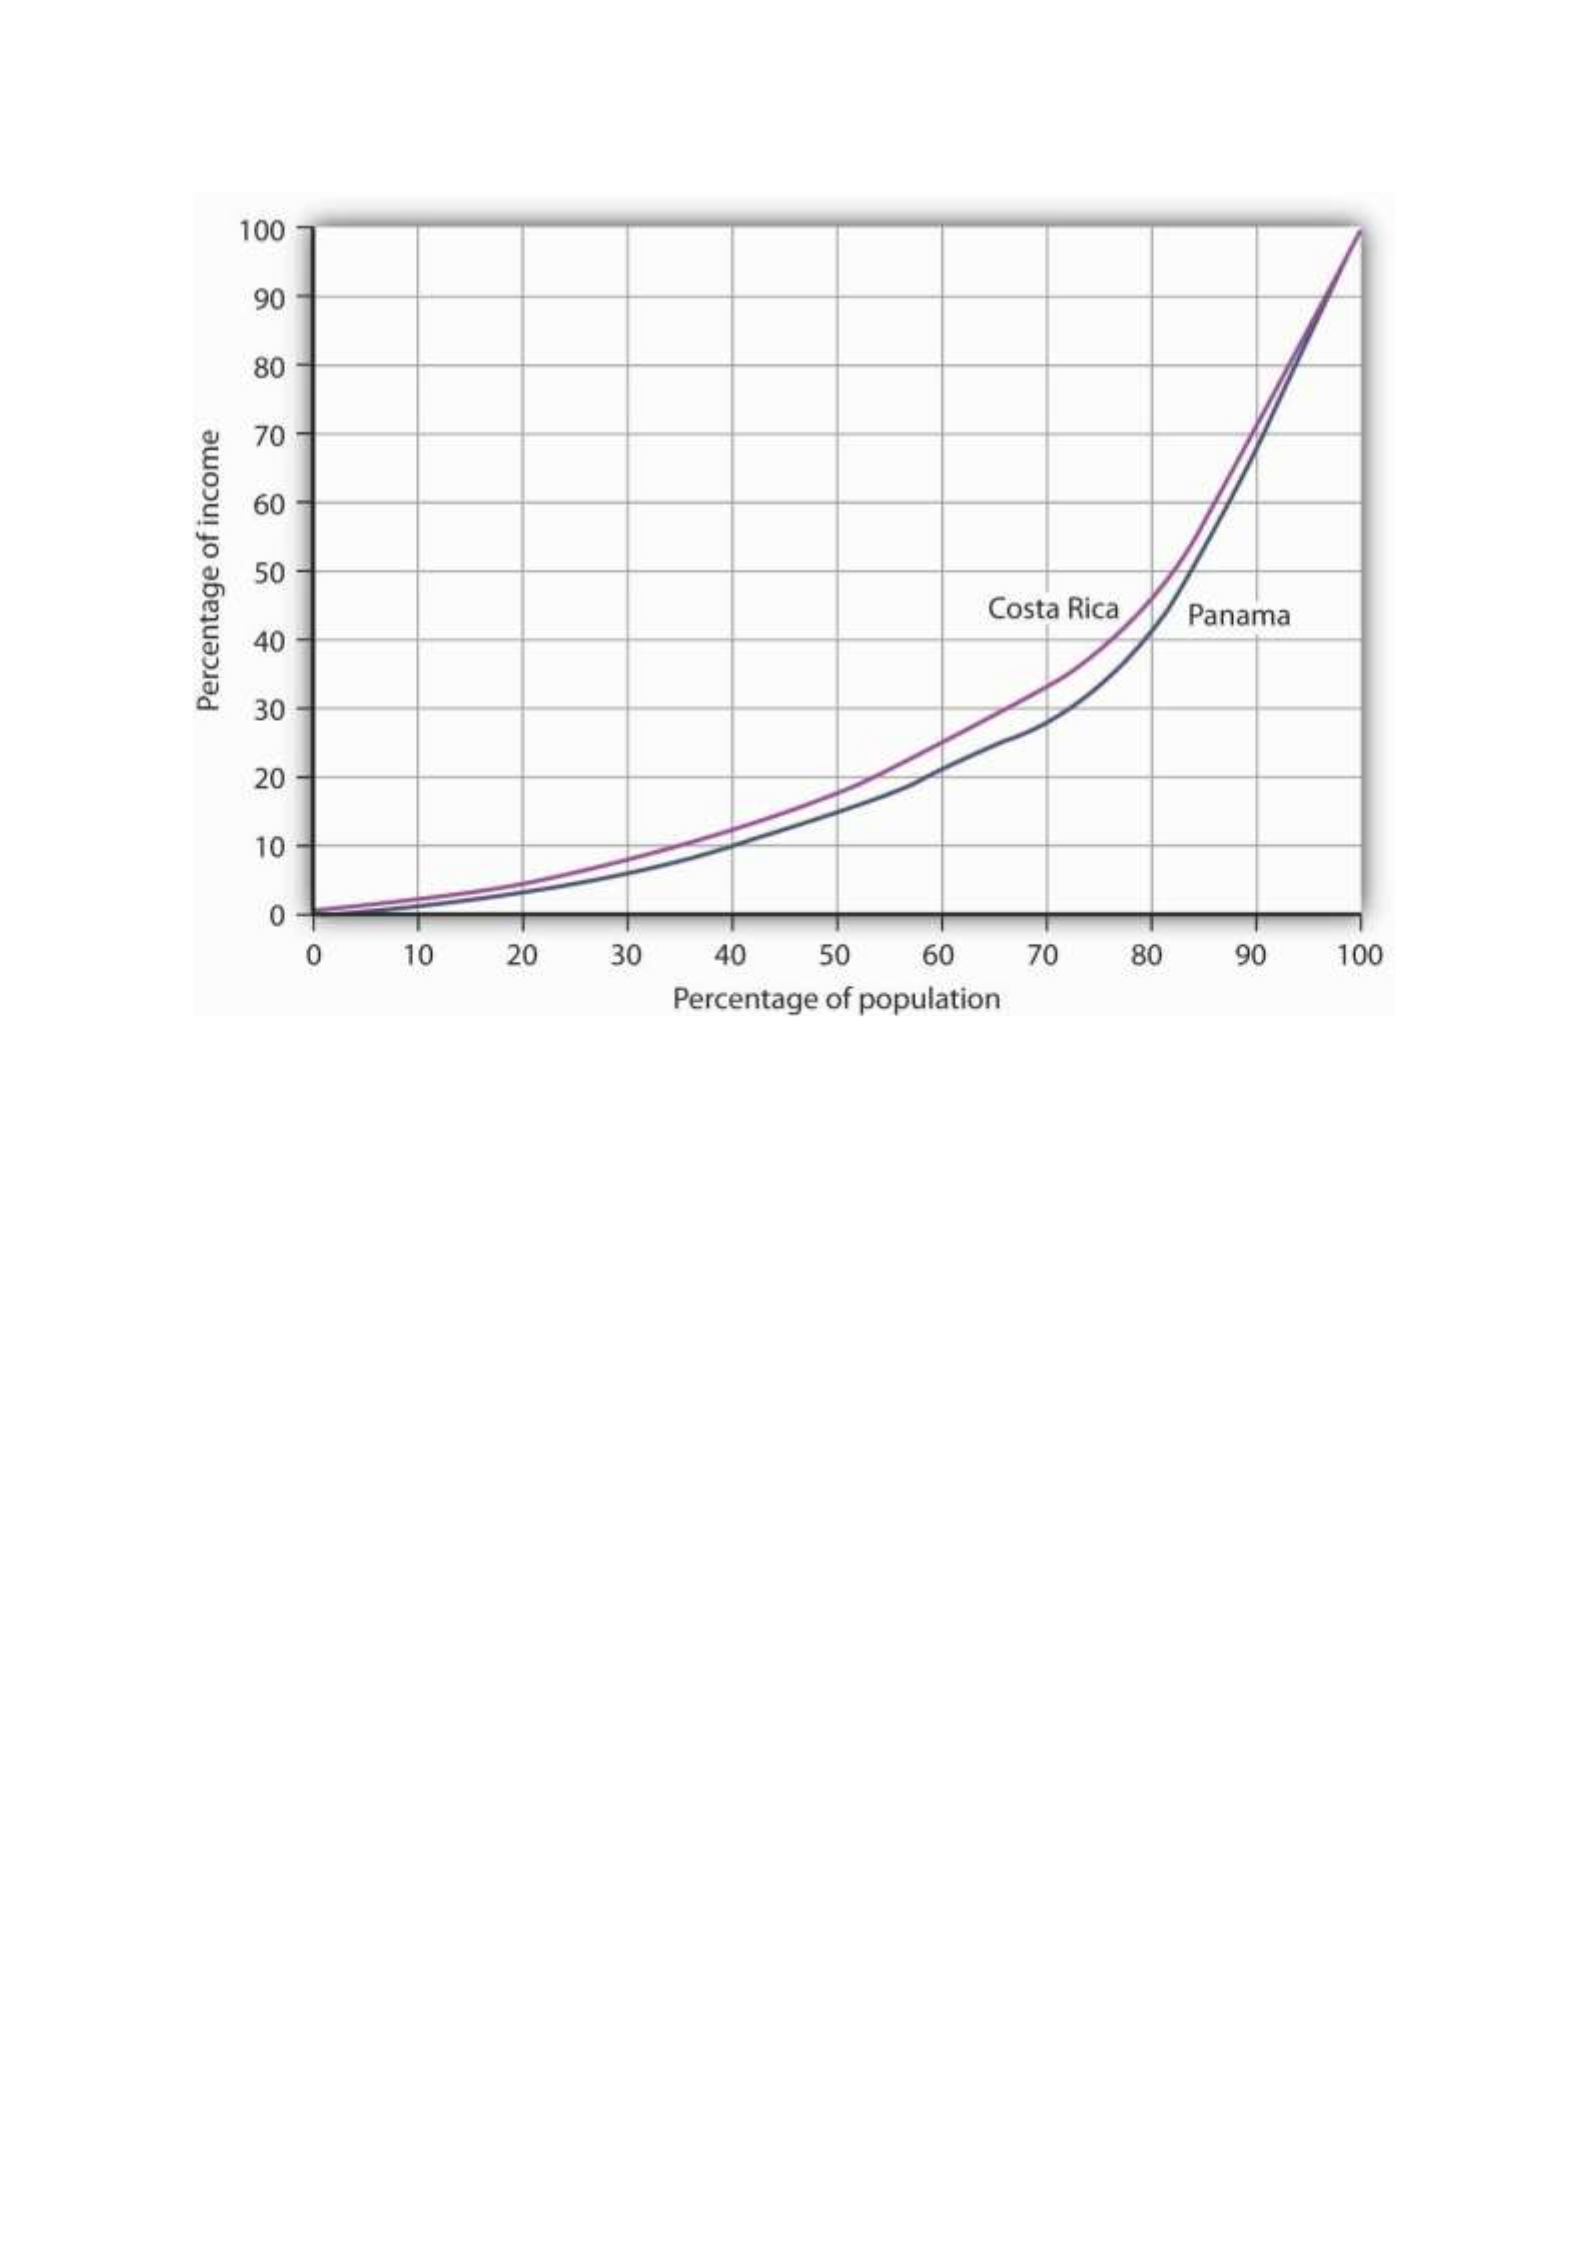
Costa Rica had about the same per capita GNI as Panama in 2003, but Panama’s income
distribution was far more unequal. Panama’s poor had much lower living standards than
Costa Rica’s poor, as suggested by the Lorenz curves for the two nations.
Source: World Development Indicators Online (revised October 17, 2008).
In general, the greater the degree of inequality, the more desperate is the condition of
people at the bottom of an income distribution. Given the high degree of inequality in many
low-income countries, it is very important to look at income distributions when we compare
living standards in different countries.
Health and Education
Poor nations are typically characterized by low levels of human capital. Where health-care
facilities are inadequate, that human capital can be reduced further by disease. Where
educational resources are poor, there will be little progress in improving human capital.
One indicator of poor health care appears on the supply side. Low-income countries have
fewer doctors, relative to their populations, than high-income countries. For example, the
UN estimates that in 2006 about 60% of mothers giving birth in developing countries had
access to a skilled health-care provider (doctor, nurse, or midwife). While that is up from
47% in 1990, the lack of access to a health-care provider may explain much of the difference
in maternal death rates between developed and developing countries: about nine maternal
deaths per 100,000 live births in developed countries compared to about 450 per 100,000 in
developing countries.United Nations, The Millennium Development Goals Report 2008, 27.

We can also see the results of poor health care in statistics on health. Among the world’s
developing countries, the infant mortality rate, which reports deaths in the first year of life,
was 57 per 1,000 live births in 2005. There were six infant deaths per 1,000 live births
among the high-income countries that year.United Nations Development Program, Human
Development Report 2007/2008 (New York: Palgrave Macmillan, 2007), 264.
Another health issue facing the world’s low-income countries is malnutrition. Malnutrition
rates in all developing countries in the 2002 to 2004 period averaged 17%, 35% in the least
developed countries.
Still another issue is the spread of HIV/AIDS. Here there is some progress. The number of
people newly infected declined from 3 million in 2001 to 2.7 million in 2005. Antiretroviral
treatments are also leading to a reduction in deaths from 2.2 million in 2005 to 2 million in
2007. Longer survival means that the number of people living with HIV (from just under 30
million in 2001 to about 33 million in 2007) is rising and most of the people living with HIV
are in Sub-Saharan Africa.United Nations, The Millennium Development Goals Report 2008,
30.
Education in poor and middle-income nations is improving. In 1991, about 80% of children in
developing countries were enrolled in primary schools. In 2005, about 85% were. The
comparable numbers in developed countries are about 95%. Enrollment rates taper off for
high school (about 53% in 2005 in developing countries compared to 91% in developed
countries).United Nations Development Program, Human Development Report
2007/2008 (New York: Palgrave Macmillan, 2007), 272.
Unemployment
Unemployment is pervasive in low-income nations. These nations, already faced with low
levels of potential output, are producing well below their potential. Unemployment rates in
low-income countries vary widely, reaching as high as 15% or more in some countries. If we
count discouraged workers, people who have given up looking for work but who would take
it if it were available, and people who work less than full time, not by choice but because
more work is unavailable, then unemployment in low-income countries soars—often to
more than 30%.
Migration within low-income countries often contributes to unemployment in urban areas.
Factors such as ethnic violence, poverty, and drought often force people to move from rural
areas to cities, where unemployment rates are already high.
Reliance on Agriculture
One of the dominant characteristics of poor nations is the concentration of employment in
agriculture. Another is the very low productivity of that employment. Agriculture in low-
income countries often employs a majority of the population but produces less than one-
third of GDP.

One of the primary forces behind income growth in wealthy countries has been the shift of
labor out of agriculture and into more productive sectors such as manufacturing. This shift is
also occurring in low-income nations but has lagged far behind.
The solution to these problems lies in economic development, to which we turn next.
Economic Development: A Definition
If the problems of low-income nations are pervasive, the development that helps to solve
those problems must transform the very nature of their societies. The late Austrian
economist Joseph Schumpeter described economic development as a revolutionary process.
Whereas economic growth implies quantitative change in production processes that are
already familiar to the society, economic development requires qualitative change in
virtually every aspect of life.
Robert Heilbroner, an economist at the New School for Social Research in New York, has
argued,
“Economic development is political and social change on a wrenching and tearing scale. … It
is a process of institutional birth and institutional death. It is a time when power shifts, often
violently and abruptly, a time when old regimes go under and new ones rise in their places.
And these are not just the unpleasant side effects of development. They are part and parcel
of the process, the very driving force of change itself.”Robert Heilbroner, Between Capitalism
and Socialism (New York: Vintage Books, 1970), 53–54.
Economic development transforms a nation at its core. But what, precisely, is development?
Many definitions follow Heilbroner in noting the massive institutional and cultural changes
economic development involves. But whatever the requirements of development, its
primary characteristics are rising incomes and improving standards of living. That means
output must increase—and it must increase relative to population growth. And because
inequality is so serious a problem in low-income nations, development must deliver
widespread improvement in living conditions. It therefore seems useful to define economic
development as a process that produces sustained and widely shared gains in per capita real
GDP.
In recent years, the United Nations has constructed measures incorporating dimensions of
economic development that go beyond the level of per capita GDP. The Human
Development Index (HDI) includes three dimensions—life expectancy, educational
attainment (adult literacy and combined primary, secondary, and post-secondary
enrollment), as well as purchasing-power-adjusted per capita real GDP. The Gender
Development Index (GDI) uses the same variables as the HDI but adjusts them downward to
take into account the extent of gender inequality. A third index, the Human Poverty Index
(HPI), measures human deprivation and includes such indicators as the percentage of people
expected to die before age 40, the percentage of underweight children under age 5, the
percentage of adults who are illiterate, and the percentage of people who live in poverty.
The number reported for the HPI shows the percentage of people in the country who suffer
these deprivations.

Throughout most of history, poverty has been the human condition. For most people life
was, in the words of 17th-century English philosopher Thomas Hobbes, “solitary, poor, nasty,
brutish, and short.” Only within the past 200 years have a handful or so of countries been
able to break the chains of economic deprivation and poverty.
Consider these facts:United Nations Development Program, Human Development Report
2007/2008 (New York: Palgrave Macmillan, 2007).
• Over a third of the world’s people live in countries in which total per capita income in
2005 was less than $610 per year; 85% live in countries in which total per capita
income in 2005 was $2,808 or less. Adjusting for purchasing power, the per capita
income levels would be $2,531 and $7,416, respectively. The latter numbers compare
to per capita income in high-income countries of over $30,000.
• Babies born in poor countries are 16 times more likely to die in their first five years
than are babies born in rich countries.
• About a quarter of the populations of low-income countries is undernourished.
• About 40% (over 50% for women) of the people 15 years old and older in low-income
countries are illiterate.
• Roughly one-fourth of the people in low-income countries do not have access to safe
drinking water.
Clearly, the high standards of living enjoyed by people in the world’s developed economies
are the global exception, not the rule. This chapter looks at the problem of improving the
standard of living in poor countries.
Rich and Poor Nations
The World Bank, an international organization designed to support economic development
by providing financial assistance, advice, and other resources to poor countries, classifies
over 200 countries according to their levels of per capita gross national income. The
categories in its 2008 report, as shown in Table 33.1 "World Incomes, Selected Countries",
were as follows:
• Low-income countries: These countries had per capita incomes of $935 or less in
2007. There were 49 countries in this category. About 20% of the world’s total
population of about 6.5 billion people lived in low-income countries in 2007.
• Middle-income countries: There were 95 countries with per capita incomes of more
than $936 but less than $11,455. Middle-income countries are further subdivided
into lower middle-income and upper middle-income countries. Roughly two-thirds of
the world’s population lived in middle-income countries in 2007. We should note
that the percentage of the world’s population living in middle-income countries
increased dramatically (and the percentage living in low-income countries decreased
dramatically) when China and India moved from being low-income to middle-income
countries.

• High-income countries: There were 65 nations with per capita incomes of $11,456 or
more. Just 16% of the world’s total population lived in high-income countries in 2007.
Countries in the low- and middle-income categories are often called developing countries.
A developing country is thus a country that is not among the high-income nations of the
world.The World Development Report 2006 (New York: Oxford University Press, 2006), xiv,
comments on this usage: “The term developing countries includes low- and middle-income
economies and thus may include economies in transition from central planning, as a matter
of convenience. The term advanced countries may be used as a matter of convenience to
denote high-income economics.” Developing countries are sometimes referred to as third-
world countries.
How does the World Bank compare incomes across countries? The World Bank converts
gross national income (GNI) figures to dollars in two ways. One is to take GNI in a local
currency and convert using the exchange rate, averaged over a three-year period in order to
smooth out the effects of currency fluctuations. This type of comparison can, however, be
misleading. A country could have a relatively high standard of living but, for a variety of
reasons, a low exchange rate. The per capita GNI figure would be quite low; the country
would appear to be poorer than it is.
A better approach to comparing incomes converts currencies to dollars on the basis of
purchasing power. This measure is reported in what are called international dollars. An
international dollar has the same purchasing power as does a U.S. dollar in the United
States. This is reported in the column labeled “2007 International $” in Table 33.1 "World
Incomes, Selected Countries".
Table 33.1 World Incomes, Selected Countries
Gross National Income per Capita, 2007
Low-income countries
Middle-income countries
High-income countries
Countries
200
7 $
2007
Internatio
nal $
Countrie
s
200
7 $
2007
Internatio
nal $
Countri
es
2007
$
2007
Internatio
nal $
Burundi
110
330
India
95
0
2,740
Czech
Republi
c
14,45
0
22,020
Sierra
Leone
260
660
China
2,36
0
5,370
Saudi
Arabia
15,44
0
22,910
Mozambiq
ue
320
690
Thailand
3,40
0
7,880
Israel
21,90
0
25,930

Gross National Income per Capita, 2007
Low-income countries
Middle-income countries
High-income countries
Countries
200
7 $
2007
Internatio
nal $
Countrie
s
200
7 $
2007
Internatio
nal $
Countri
es
2007
$
2007
Internatio
nal $
Banglades
h
470
1,340
Iran
3,47
0
10,800
Greece
29,63
0
32,330
Haiti
560
1,150
Jamaica
3,71
0
6,210
Japan
37,67
0
34,600
Uzbekistan
730
2,430
Costa
Rica
5,56
0
10,700
France
38,50
0
33,600
Vietnam
790
2,550
Brazil
5,91
0
9,370
Canada
39,42
0
35,310
Zambia
800
1,220
Argentin
a
6,05
0
12,990
United
States
46,04
0
45,850
Pakistan
870
2,570
Russian
Federati
on
7,56
0
14,400
Ireland
48,14
0
37,090
Nigeria
930
1,770
Turkey
8,02
0
12,350
Norway
76,45
0
53,320
Average
578
1,494
Average
2,87
2
5,952
Average
37,56
6
36,100
Ave.,
lower
middle
1,88
7
4,543
Ave.,
upper
middle
6,98
7
11,868
Source: World Development Indicators database, World Bank, revised October 17, 2008.

The international dollar estimates typically show higher incomes than estimates based on an
exchange rate conversion. For example, in 2007 Mozambique’s per capita GNI, based on
exchange rates, was $320. Its per capita GNI based the international dollars was $690.
Ranking of countries, both rich and poor, by per capita GNI differs depending on the
measure used. According to the per capita GNI figures in Table 33.1 "World Incomes,
Selected Countries", which convert data in domestic currencies to dollars using exchange
rates, the United States ranked fifteenth of all countries in 2007. Using the international
dollars method, its rank is tenth. China is ranked at 132 when per capita GNI is based on the
exchange rate conversion method but rises to 122 based on the international dollar method.
Characteristics of Low-Income Countries
Low incomes are often associated with other characteristics: severe inequality, poor health
care and education, high unemployment, heavy reliance on agriculture, and rapid population
growth. We will examine most of these problems in this section. Population growth in low-
income nations is examined later in the chapter.
Inequality
Not only are incomes in low-income countries quite low; income distribution is often highly
unequal. Poverty is far more prevalent than per capita numbers suggest, as illustrated by
Lorenz curves, introduced in the chapter on inequality, that show the cumulative shares of
income received by individuals or groups.
Consider Costa Rica and Panama, two Latin American countries with roughly equivalent
levels of per capita GNI (Costa Rica’s was $5,560 and Panama’s $5,510 in 2007). Panama’s
income distribution is comparatively less equal, while Costa Rica’s is far more equal. Figure
33.1 "Poverty and the Distribution of Income: Costa Rica versus Panama" compares the 2003
Lorenz curves for Costa Rica and Panama, the most recent year for which the information
was available. The 20% of the households with the lowest incomes in Costa Rica had twice as
large a share of their country’s total income as did the bottom 20% of households in
Panama. That means Costa Rica’s poor were about twice as well off, in material terms, as
Panama’s poor.
Figure 33.1 Poverty and the Distribution of Income: Costa Rica versus Panama
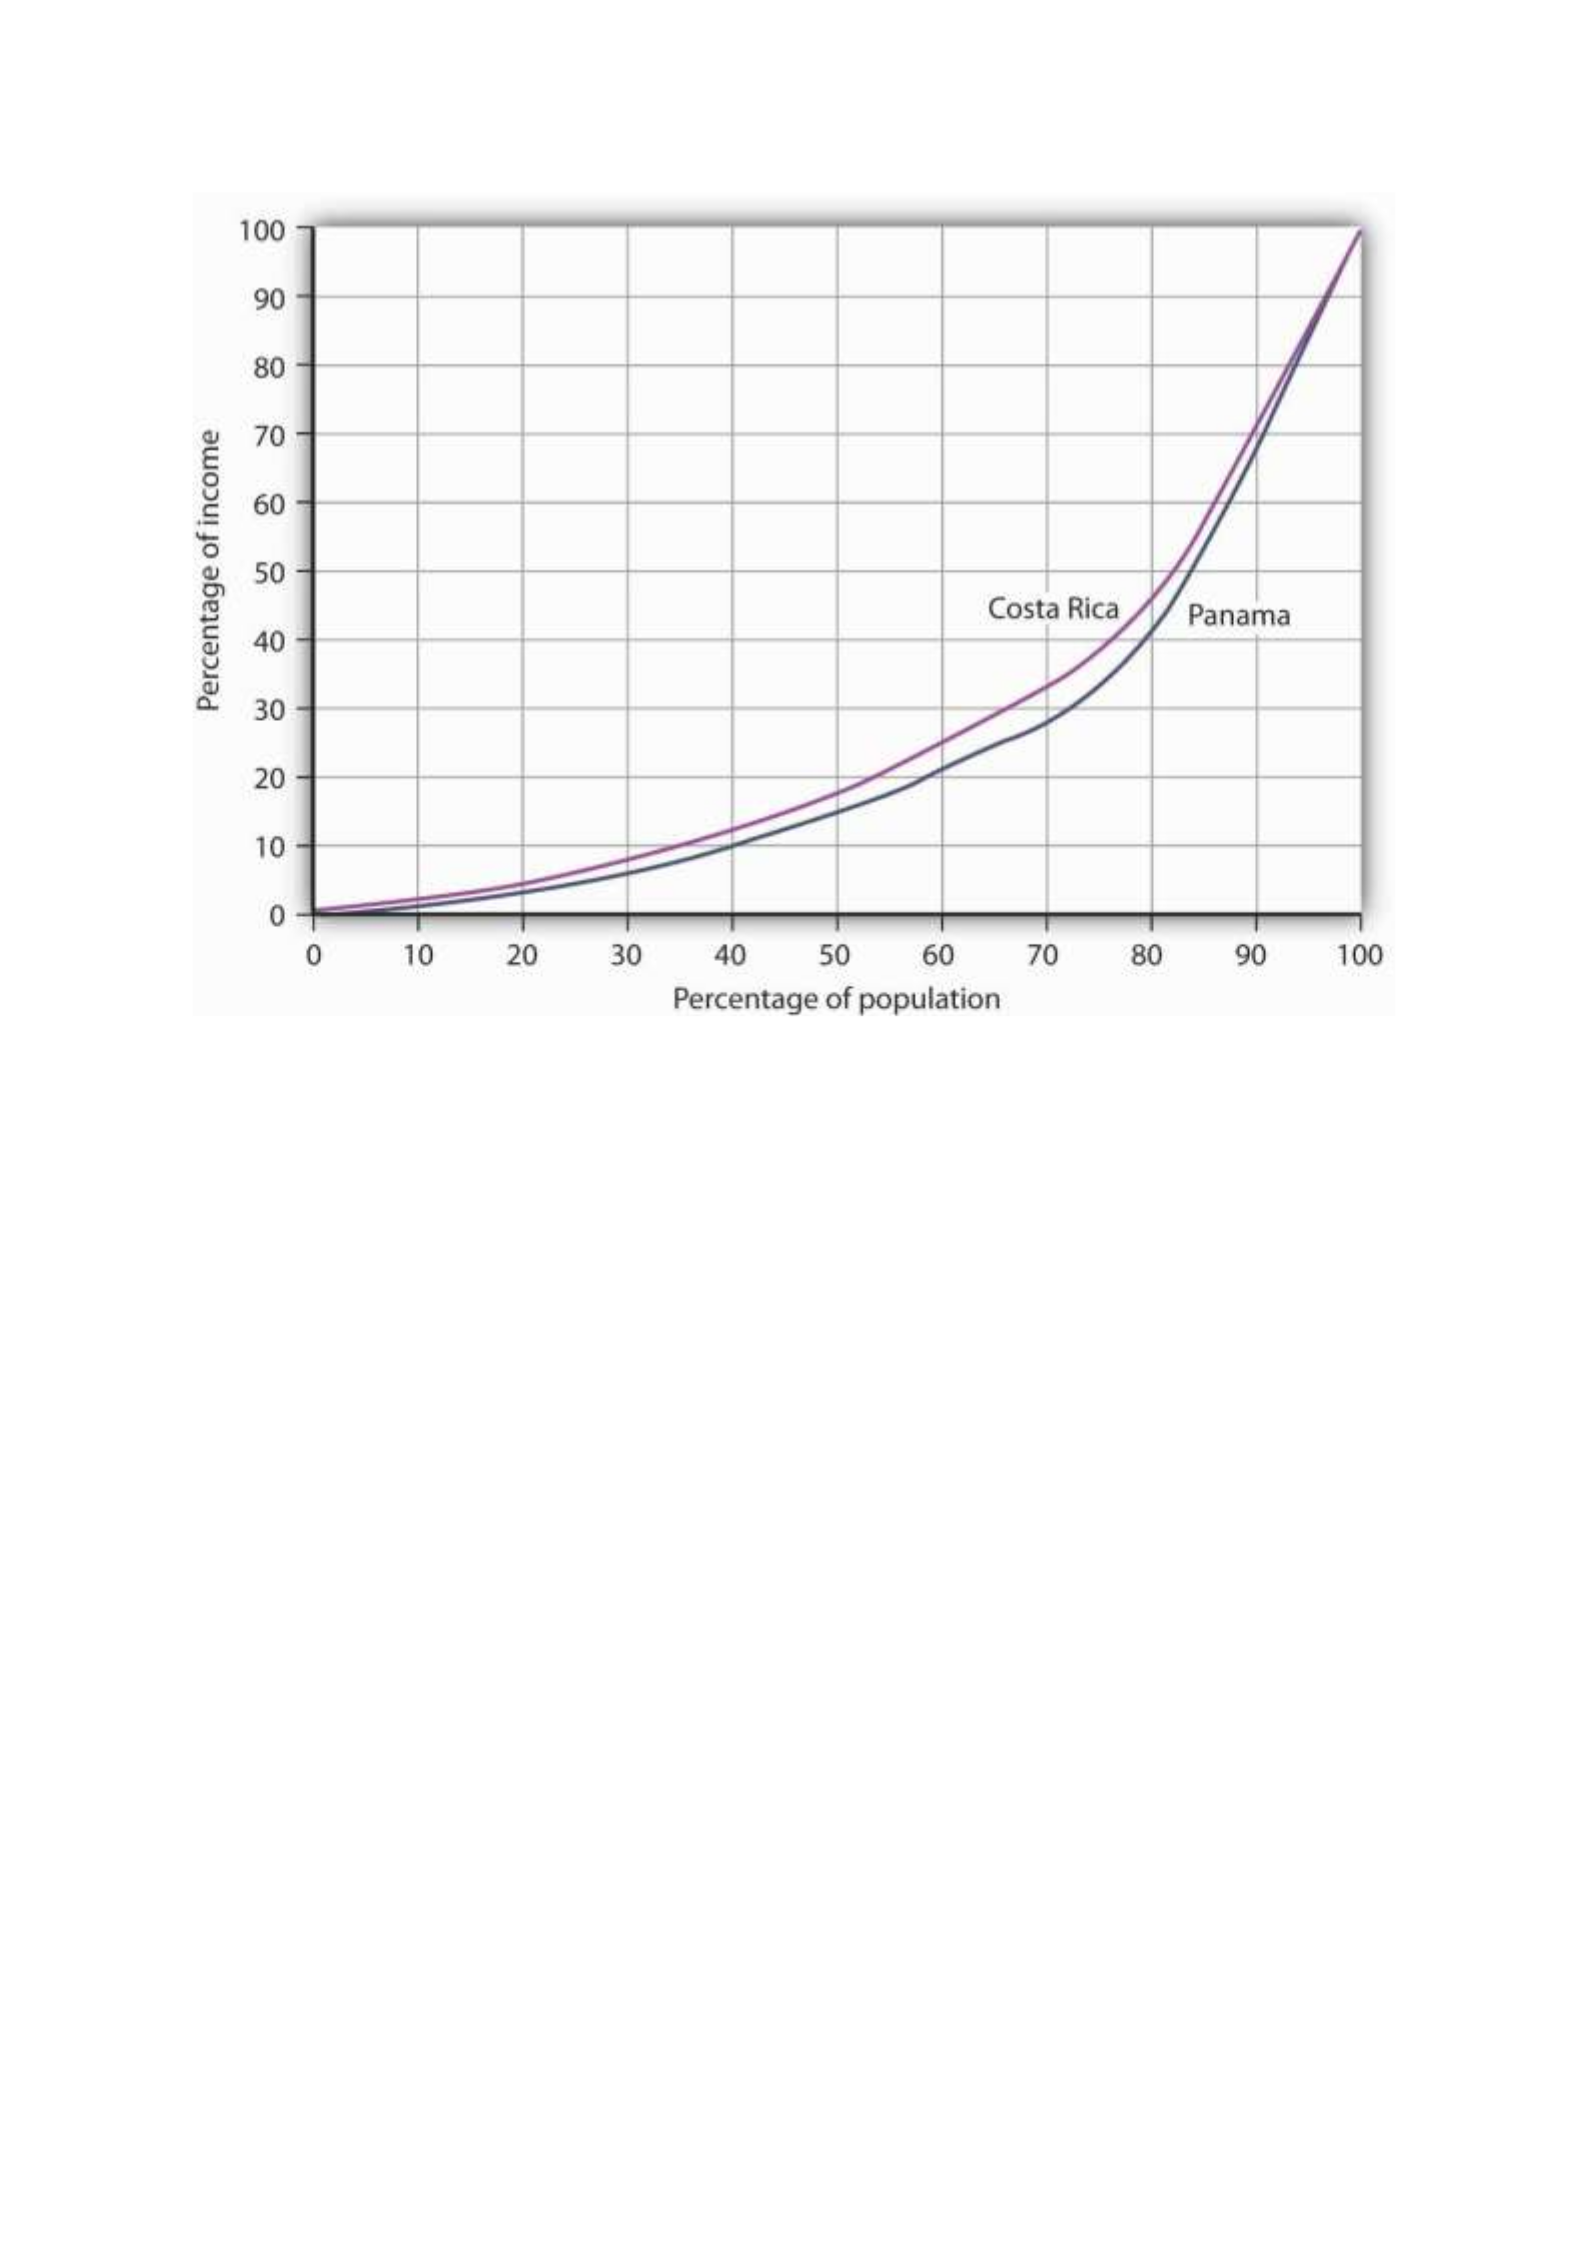
Costa Rica had about the same per capita GNI as Panama in 2003, but Panama’s income
distribution was far more unequal. Panama’s poor had much lower living standards than
Costa Rica’s poor, as suggested by the Lorenz curves for the two nations.
Source: World Development Indicators Online (revised October 17, 2008).
In general, the greater the degree of inequality, the more desperate is the condition of
people at the bottom of an income distribution. Given the high degree of inequality in many
low-income countries, it is very important to look at income distributions when we compare
living standards in different countries.
Health and Education
Poor nations are typically characterized by low levels of human capital. Where health-care
facilities are inadequate, that human capital can be reduced further by disease. Where
educational resources are poor, there will be little progress in improving human capital.
One indicator of poor health care appears on the supply side. Low-income countries have
fewer doctors, relative to their populations, than high-income countries. For example, the
UN estimates that in 2006 about 60% of mothers giving birth in developing countries had
access to a skilled health-care provider (doctor, nurse, or midwife). While that is up from
47% in 1990, the lack of access to a health-care provider may explain much of the difference
in maternal death rates between developed and developing countries: about nine maternal
deaths per 100,000 live births in developed countries compared to about 450 per 100,000 in
developing countries.United Nations, The Millennium Development Goals Report 2008, 27.

We can also see the results of poor health care in statistics on health. Among the world’s
developing countries, the infant mortality rate, which reports deaths in the first year of life,
was 57 per 1,000 live births in 2005. There were six infant deaths per 1,000 live births
among the high-income countries that year.United Nations Development Program, Human
Development Report 2007/2008 (New York: Palgrave Macmillan, 2007), 264.
Another health issue facing the world’s low-income countries is malnutrition. Malnutrition
rates in all developing countries in the 2002 to 2004 period averaged 17%, 35% in the least
developed countries.
Still another issue is the spread of HIV/AIDS. Here there is some progress. The number of
people newly infected declined from 3 million in 2001 to 2.7 million in 2005. Antiretroviral
treatments are also leading to a reduction in deaths from 2.2 million in 2005 to 2 million in
2007. Longer survival means that the number of people living with HIV (from just under 30
million in 2001 to about 33 million in 2007) is rising and most of the people living with HIV
are in Sub-Saharan Africa.United Nations, The Millennium Development Goals Report 2008,
30.
Education in poor and middle-income nations is improving. In 1991, about 80% of children in
developing countries were enrolled in primary schools. In 2005, about 85% were. The
comparable numbers in developed countries are about 95%. Enrollment rates taper off for
high school (about 53% in 2005 in developing countries compared to 91% in developed
countries).United Nations Development Program, Human Development Report
2007/2008 (New York: Palgrave Macmillan, 2007), 272.
Unemployment
Unemployment is pervasive in low-income nations. These nations, already faced with low
levels of potential output, are producing well below their potential. Unemployment rates in
low-income countries vary widely, reaching as high as 15% or more in some countries. If we
count discouraged workers, people who have given up looking for work but who would take
it if it were available, and people who work less than full time, not by choice but because
more work is unavailable, then unemployment in low-income countries soars—often to
more than 30%.
Migration within low-income countries often contributes to unemployment in urban areas.
Factors such as ethnic violence, poverty, and drought often force people to move from rural
areas to cities, where unemployment rates are already high.
Reliance on Agriculture
One of the dominant characteristics of poor nations is the concentration of employment in
agriculture. Another is the very low productivity of that employment. Agriculture in low-
income countries often employs a majority of the population but produces less than one-
third of GDP.

One of the primary forces behind income growth in wealthy countries has been the shift of
labor out of agriculture and into more productive sectors such as manufacturing. This shift is
also occurring in low-income nations but has lagged far behind.
The solution to these problems lies in economic development, to which we turn next.
Economic Development: A Definition
If the problems of low-income nations are pervasive, the development that helps to solve
those problems must transform the very nature of their societies. The late Austrian
economist Joseph Schumpeter described economic development as a revolutionary process.
Whereas economic growth implies quantitative change in production processes that are
already familiar to the society, economic development requires qualitative change in
virtually every aspect of life.
Robert Heilbroner, an economist at the New School for Social Research in New York, has
argued,
“Economic development is political and social change on a wrenching and tearing scale. … It
is a process of institutional birth and institutional death. It is a time when power shifts, often
violently and abruptly, a time when old regimes go under and new ones rise in their places.
And these are not just the unpleasant side effects of development. They are part and parcel
of the process, the very driving force of change itself.”Robert Heilbroner, Between Capitalism
and Socialism (New York: Vintage Books, 1970), 53–54.
Economic development transforms a nation at its core. But what, precisely, is development?
Many definitions follow Heilbroner in noting the massive institutional and cultural changes
economic development involves. But whatever the requirements of development, its
primary characteristics are rising incomes and improving standards of living. That means
output must increase—and it must increase relative to population growth. And because
inequality is so serious a problem in low-income nations, development must deliver
widespread improvement in living conditions. It therefore seems useful to define economic
development as a process that produces sustained and widely shared gains in per capita real
GDP.
In recent years, the United Nations has constructed measures incorporating dimensions of
economic development that go beyond the level of per capita GDP. The Human
Development Index (HDI) includes three dimensions—life expectancy, educational
attainment (adult literacy and combined primary, secondary, and post-secondary
enrollment), as well as purchasing-power-adjusted per capita real GDP. The Gender
Development Index (GDI) uses the same variables as the HDI but adjusts them downward to
take into account the extent of gender inequality. A third index, the Human Poverty Index
(HPI), measures human deprivation and includes such indicators as the percentage of people
expected to die before age 40, the percentage of underweight children under age 5, the
percentage of adults who are illiterate, and the percentage of people who live in poverty.
The number reported for the HPI shows the percentage of people in the country who suffer
these deprivations.

Throughout most of history, poverty has been the human condition. For most people life
was, in the words of 17th-century English philosopher Thomas Hobbes, “solitary, poor, nasty,
brutish, and short.” Only within the past 200 years have a handful or so of countries been
able to break the chains of economic deprivation and poverty.
Consider these facts:United Nations Development Program, Human Development Report
2007/2008 (New York: Palgrave Macmillan, 2007).
• Over a third of the world’s people live in countries in which total per capita income in
2005 was less than $610 per year; 85% live in countries in which total per capita
income in 2005 was $2,808 or less. Adjusting for purchasing power, the per capita
income levels would be $2,531 and $7,416, respectively. The latter numbers compare
to per capita income in high-income countries of over $30,000.
• Babies born in poor countries are 16 times more likely to die in their first five years
than are babies born in rich countries.
• About a quarter of the populations of low-income countries is undernourished.
• About 40% (over 50% for women) of the people 15 years old and older in low-income
countries are illiterate.
• Roughly one-fourth of the people in low-income countries do not have access to safe
drinking water.
Clearly, the high standards of living enjoyed by people in the world’s developed economies
are the global exception, not the rule. This chapter looks at the problem of improving the
standard of living in poor countries.
Rich and Poor Nations
The World Bank, an international organization designed to support economic development
by providing financial assistance, advice, and other resources to poor countries, classifies
over 200 countries according to their levels of per capita gross national income. The
categories in its 2008 report, as shown in Table 33.1 "World Incomes, Selected Countries",
were as follows:
• Low-income countries: These countries had per capita incomes of $935 or less in
2007. There were 49 countries in this category. About 20% of the world’s total
population of about 6.5 billion people lived in low-income countries in 2007.
• Middle-income countries: There were 95 countries with per capita incomes of more
than $936 but less than $11,455. Middle-income countries are further subdivided
into lower middle-income and upper middle-income countries. Roughly two-thirds of
the world’s population lived in middle-income countries in 2007. We should note
that the percentage of the world’s population living in middle-income countries
increased dramatically (and the percentage living in low-income countries decreased
dramatically) when China and India moved from being low-income to middle-income
countries.

• High-income countries: There were 65 nations with per capita incomes of $11,456 or
more. Just 16% of the world’s total population lived in high-income countries in 2007.
Countries in the low- and middle-income categories are often called developing countries.
A developing country is thus a country that is not among the high-income nations of the
world.The World Development Report 2006 (New York: Oxford University Press, 2006), xiv,
comments on this usage: “The term developing countries includes low- and middle-income
economies and thus may include economies in transition from central planning, as a matter
of convenience. The term advanced countries may be used as a matter of convenience to
denote high-income economics.” Developing countries are sometimes referred to as third-
world countries.
How does the World Bank compare incomes across countries? The World Bank converts
gross national income (GNI) figures to dollars in two ways. One is to take GNI in a local
currency and convert using the exchange rate, averaged over a three-year period in order to
smooth out the effects of currency fluctuations. This type of comparison can, however, be
misleading. A country could have a relatively high standard of living but, for a variety of
reasons, a low exchange rate. The per capita GNI figure would be quite low; the country
would appear to be poorer than it is.
A better approach to comparing incomes converts currencies to dollars on the basis of
purchasing power. This measure is reported in what are called international dollars. An
international dollar has the same purchasing power as does a U.S. dollar in the United
States. This is reported in the column labeled “2007 International $” in Table 33.1 "World
Incomes, Selected Countries".
Table 33.1 World Incomes, Selected Countries
Gross National Income per Capita, 2007
Low-income countries
Middle-income countries
High-income countries
Countries
200
7 $
2007
Internatio
nal $
Countrie
s
200
7 $
2007
Internatio
nal $
Countri
es
2007
$
2007
Internatio
nal $
Burundi
110
330
India
95
0
2,740
Czech
Republi
c
14,45
0
22,020
Sierra
Leone
260
660
China
2,36
0
5,370
Saudi
Arabia
15,44
0
22,910
Mozambiq
ue
320
690
Thailand
3,40
0
7,880
Israel
21,90
0
25,930

Gross National Income per Capita, 2007
Low-income countries
Middle-income countries
High-income countries
Countries
200
7 $
2007
Internatio
nal $
Countrie
s
200
7 $
2007
Internatio
nal $
Countri
es
2007
$
2007
Internatio
nal $
Banglades
h
470
1,340
Iran
3,47
0
10,800
Greece
29,63
0
32,330
Haiti
560
1,150
Jamaica
3,71
0
6,210
Japan
37,67
0
34,600
Uzbekistan
730
2,430
Costa
Rica
5,56
0
10,700
France
38,50
0
33,600
Vietnam
790
2,550
Brazil
5,91
0
9,370
Canada
39,42
0
35,310
Zambia
800
1,220
Argentin
a
6,05
0
12,990
United
States
46,04
0
45,850
Pakistan
870
2,570
Russian
Federati
on
7,56
0
14,400
Ireland
48,14
0
37,090
Nigeria
930
1,770
Turkey
8,02
0
12,350
Norway
76,45
0
53,320
Average
578
1,494
Average
2,87
2
5,952
Average
37,56
6
36,100
Ave.,
lower
middle
1,88
7
4,543
Ave.,
upper
middle
6,98
7
11,868
Source: World Development Indicators database, World Bank, revised October 17, 2008.

The international dollar estimates typically show higher incomes than estimates based on an
exchange rate conversion. For example, in 2007 Mozambique’s per capita GNI, based on
exchange rates, was $320. Its per capita GNI based the international dollars was $690.
Ranking of countries, both rich and poor, by per capita GNI differs depending on the
measure used. According to the per capita GNI figures in Table 33.1 "World Incomes,
Selected Countries", which convert data in domestic currencies to dollars using exchange
rates, the United States ranked fifteenth of all countries in 2007. Using the international
dollars method, its rank is tenth. China is ranked at 132 when per capita GNI is based on the
exchange rate conversion method but rises to 122 based on the international dollar method.
Characteristics of Low-Income Countries
Low incomes are often associated with other characteristics: severe inequality, poor health
care and education, high unemployment, heavy reliance on agriculture, and rapid population
growth. We will examine most of these problems in this section. Population growth in low-
income nations is examined later in the chapter.
Inequality
Not only are incomes in low-income countries quite low; income distribution is often highly
unequal. Poverty is far more prevalent than per capita numbers suggest, as illustrated by
Lorenz curves, introduced in the chapter on inequality, that show the cumulative shares of
income received by individuals or groups.
Consider Costa Rica and Panama, two Latin American countries with roughly equivalent
levels of per capita GNI (Costa Rica’s was $5,560 and Panama’s $5,510 in 2007). Panama’s
income distribution is comparatively less equal, while Costa Rica’s is far more equal. Figure
33.1 "Poverty and the Distribution of Income: Costa Rica versus Panama" compares the 2003
Lorenz curves for Costa Rica and Panama, the most recent year for which the information
was available. The 20% of the households with the lowest incomes in Costa Rica had twice as
large a share of their country’s total income as did the bottom 20% of households in
Panama. That means Costa Rica’s poor were about twice as well off, in material terms, as
Panama’s poor.
Figure 33.1 Poverty and the Distribution of Income: Costa Rica versus Panama
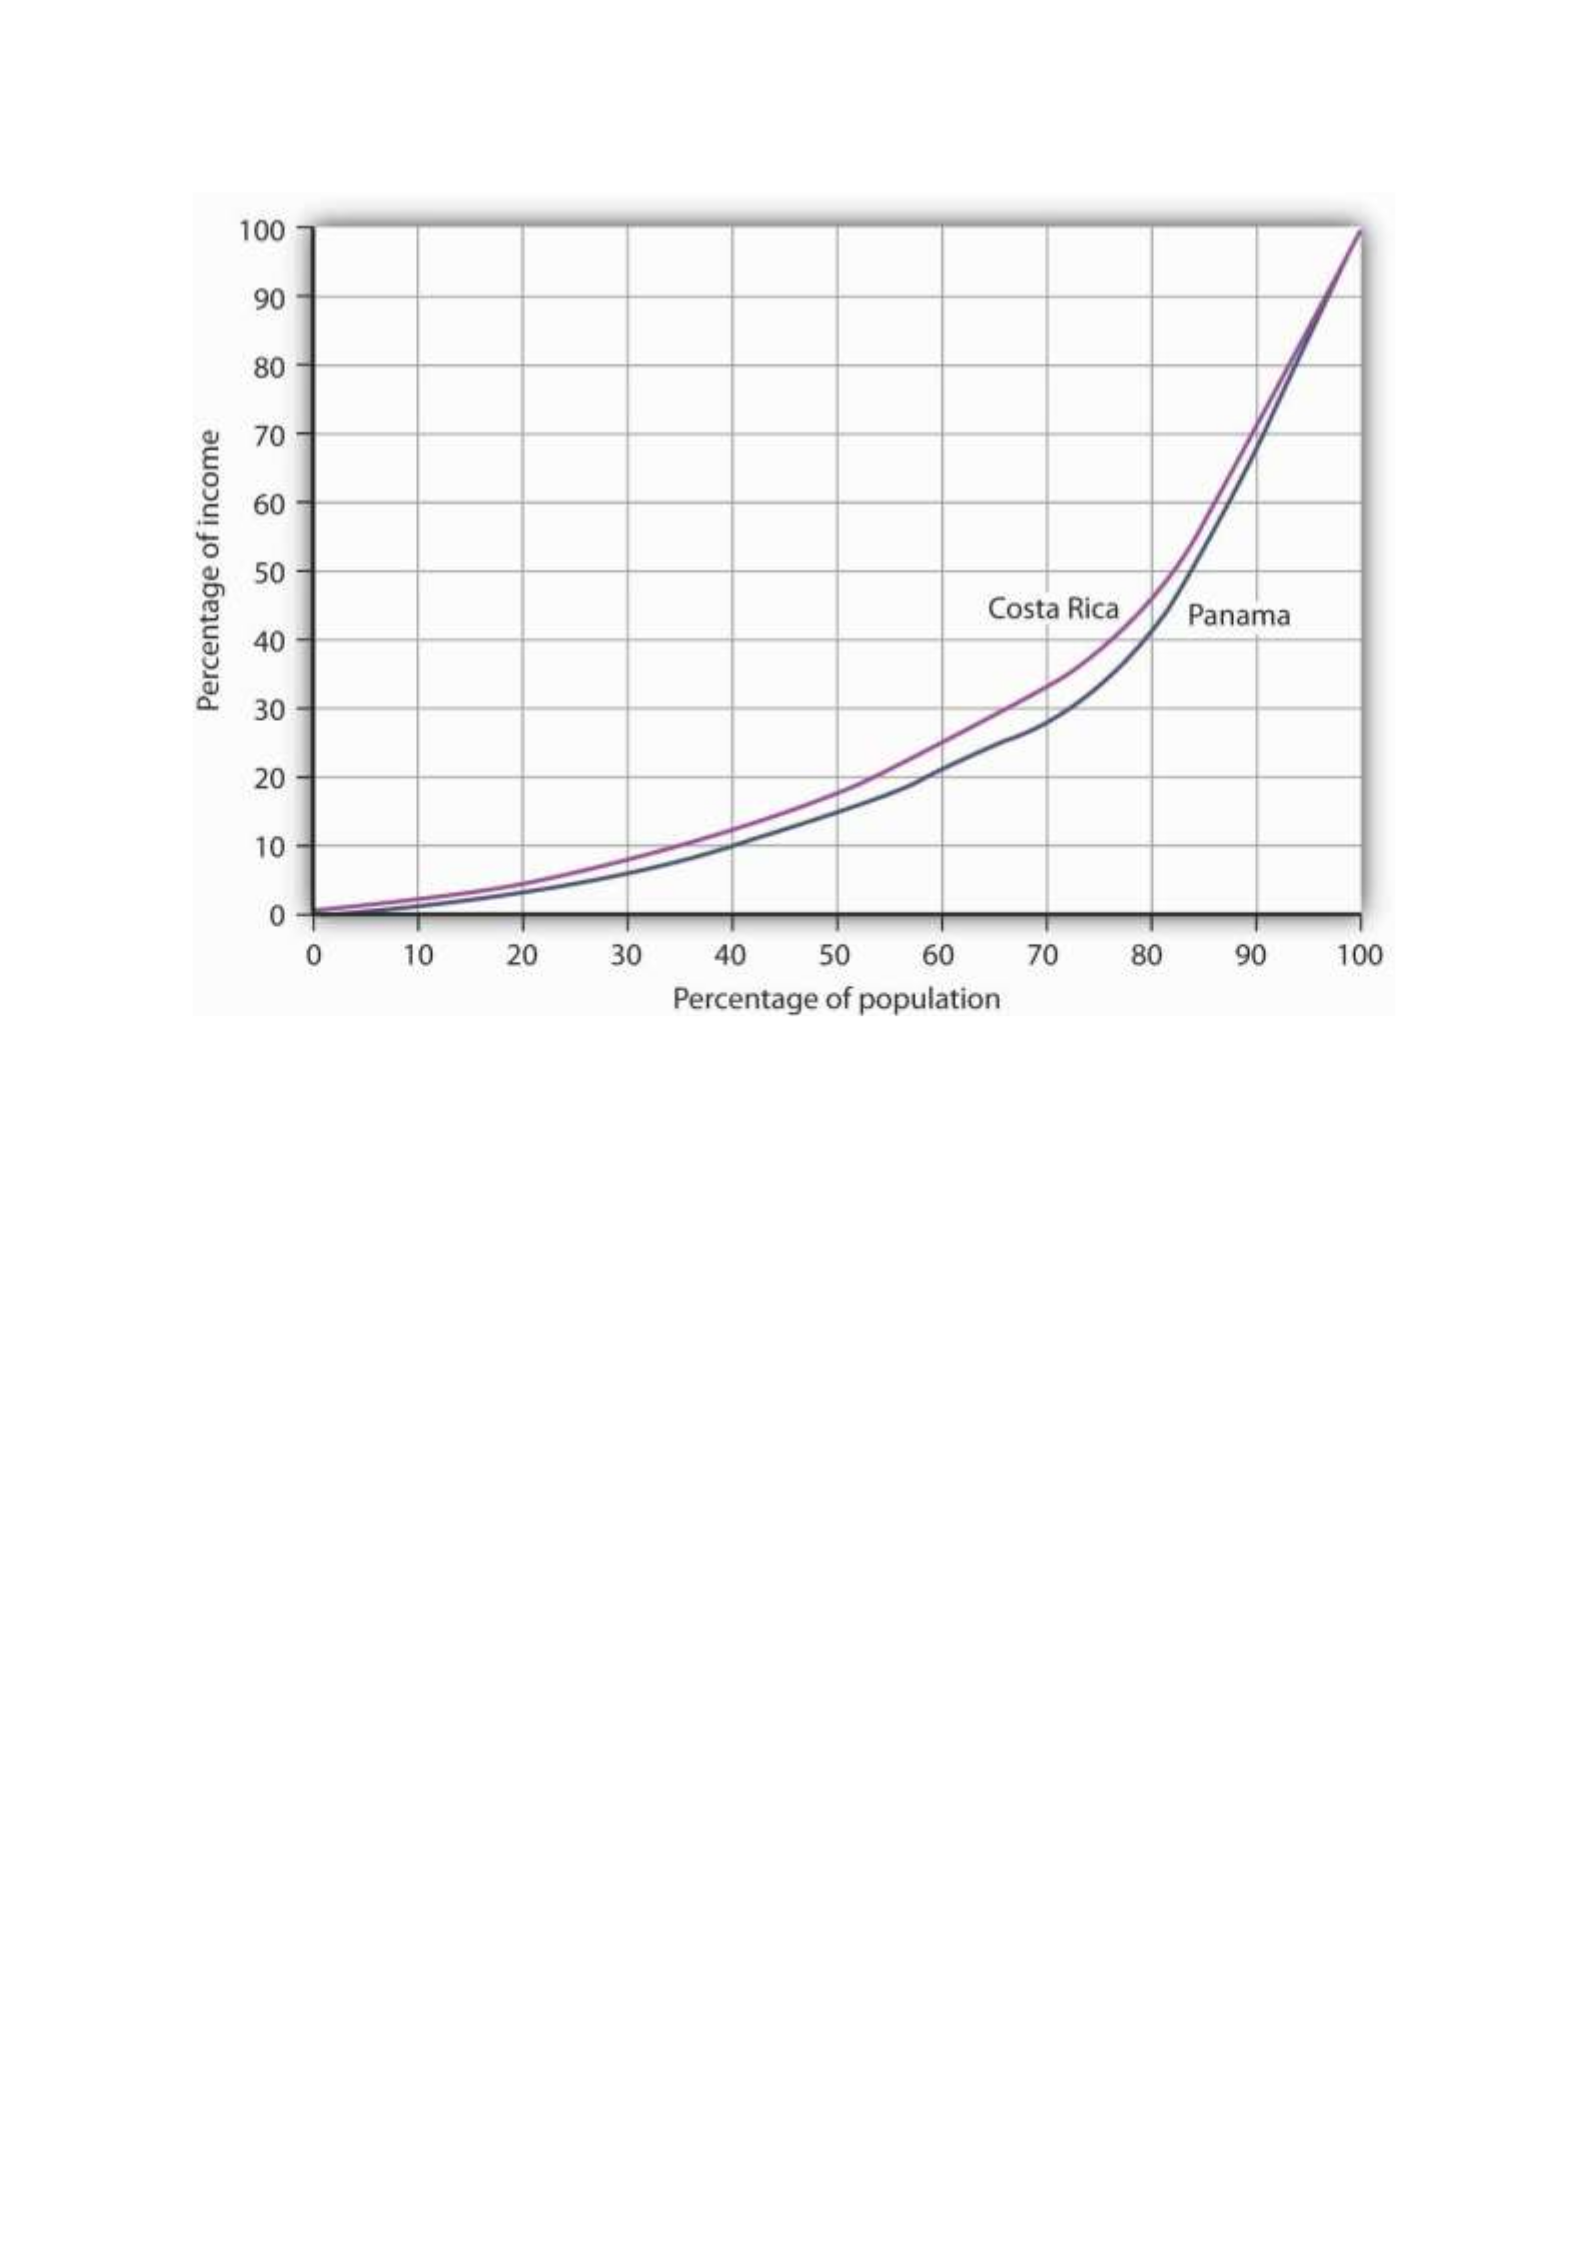
Costa Rica had about the same per capita GNI as Panama in 2003, but Panama’s income
distribution was far more unequal. Panama’s poor had much lower living standards than
Costa Rica’s poor, as suggested by the Lorenz curves for the two nations.
Source: World Development Indicators Online (revised October 17, 2008).
In general, the greater the degree of inequality, the more desperate is the condition of
people at the bottom of an income distribution. Given the high degree of inequality in many
low-income countries, it is very important to look at income distributions when we compare
living standards in different countries.
Health and Education
Poor nations are typically characterized by low levels of human capital. Where health-care
facilities are inadequate, that human capital can be reduced further by disease. Where
educational resources are poor, there will be little progress in improving human capital.
One indicator of poor health care appears on the supply side. Low-income countries have
fewer doctors, relative to their populations, than high-income countries. For example, the
UN estimates that in 2006 about 60% of mothers giving birth in developing countries had
access to a skilled health-care provider (doctor, nurse, or midwife). While that is up from
47% in 1990, the lack of access to a health-care provider may explain much of the difference
in maternal death rates between developed and developing countries: about nine maternal
deaths per 100,000 live births in developed countries compared to about 450 per 100,000 in
developing countries.United Nations, The Millennium Development Goals Report 2008, 27.

We can also see the results of poor health care in statistics on health. Among the world’s
developing countries, the infant mortality rate, which reports deaths in the first year of life,
was 57 per 1,000 live births in 2005. There were six infant deaths per 1,000 live births
among the high-income countries that year.United Nations Development Program, Human
Development Report 2007/2008 (New York: Palgrave Macmillan, 2007), 264.
Another health issue facing the world’s low-income countries is malnutrition. Malnutrition
rates in all developing countries in the 2002 to 2004 period averaged 17%, 35% in the least
developed countries.
Still another issue is the spread of HIV/AIDS. Here there is some progress. The number of
people newly infected declined from 3 million in 2001 to 2.7 million in 2005. Antiretroviral
treatments are also leading to a reduction in deaths from 2.2 million in 2005 to 2 million in
2007. Longer survival means that the number of people living with HIV (from just under 30
million in 2001 to about 33 million in 2007) is rising and most of the people living with HIV
are in Sub-Saharan Africa.United Nations, The Millennium Development Goals Report 2008,
30.
Education in poor and middle-income nations is improving. In 1991, about 80% of children in
developing countries were enrolled in primary schools. In 2005, about 85% were. The
comparable numbers in developed countries are about 95%. Enrollment rates taper off for
high school (about 53% in 2005 in developing countries compared to 91% in developed
countries).United Nations Development Program, Human Development Report
2007/2008 (New York: Palgrave Macmillan, 2007), 272.
Unemployment
Unemployment is pervasive in low-income nations. These nations, already faced with low
levels of potential output, are producing well below their potential. Unemployment rates in
low-income countries vary widely, reaching as high as 15% or more in some countries. If we
count discouraged workers, people who have given up looking for work but who would take
it if it were available, and people who work less than full time, not by choice but because
more work is unavailable, then unemployment in low-income countries soars—often to
more than 30%.
Migration within low-income countries often contributes to unemployment in urban areas.
Factors such as ethnic violence, poverty, and drought often force people to move from rural
areas to cities, where unemployment rates are already high.
Reliance on Agriculture
One of the dominant characteristics of poor nations is the concentration of employment in
agriculture. Another is the very low productivity of that employment. Agriculture in low-
income countries often employs a majority of the population but produces less than one-
third of GDP.

One of the primary forces behind income growth in wealthy countries has been the shift of
labor out of agriculture and into more productive sectors such as manufacturing. This shift is
also occurring in low-income nations but has lagged far behind.
The solution to these problems lies in economic development, to which we turn next.
Economic Development: A Definition
If the problems of low-income nations are pervasive, the development that helps to solve
those problems must transform the very nature of their societies. The late Austrian
economist Joseph Schumpeter described economic development as a revolutionary process.
Whereas economic growth implies quantitative change in production processes that are
already familiar to the society, economic development requires qualitative change in
virtually every aspect of life.
Robert Heilbroner, an economist at the New School for Social Research in New York, has
argued,
“Economic development is political and social change on a wrenching and tearing scale. … It
is a process of institutional birth and institutional death. It is a time when power shifts, often
violently and abruptly, a time when old regimes go under and new ones rise in their places.
And these are not just the unpleasant side effects of development. They are part and parcel
of the process, the very driving force of change itself.”Robert Heilbroner, Between Capitalism
and Socialism (New York: Vintage Books, 1970), 53–54.
Economic development transforms a nation at its core. But what, precisely, is development?
Many definitions follow Heilbroner in noting the massive institutional and cultural changes
economic development involves. But whatever the requirements of development, its
primary characteristics are rising incomes and improving standards of living. That means
output must increase—and it must increase relative to population growth. And because
inequality is so serious a problem in low-income nations, development must deliver
widespread improvement in living conditions. It therefore seems useful to define economic
development as a process that produces sustained and widely shared gains in per capita real
GDP.
In recent years, the United Nations has constructed measures incorporating dimensions of
economic development that go beyond the level of per capita GDP. The Human
Development Index (HDI) includes three dimensions—life expectancy, educational
attainment (adult literacy and combined primary, secondary, and post-secondary
enrollment), as well as purchasing-power-adjusted per capita real GDP. The Gender
Development Index (GDI) uses the same variables as the HDI but adjusts them downward to
take into account the extent of gender inequality. A third index, the Human Poverty Index
(HPI), measures human deprivation and includes such indicators as the percentage of people
expected to die before age 40, the percentage of underweight children under age 5, the
percentage of adults who are illiterate, and the percentage of people who live in poverty.
The number reported for the HPI shows the percentage of people in the country who suffer
these deprivations.

Throughout most of history, poverty has been the human condition. For most people life
was, in the words of 17th-century English philosopher Thomas Hobbes, “solitary, poor, nasty,
brutish, and short.” Only within the past 200 years have a handful or so of countries been
able to break the chains of economic deprivation and poverty.
Consider these facts:United Nations Development Program, Human Development Report
2007/2008 (New York: Palgrave Macmillan, 2007).
• Over a third of the world’s people live in countries in which total per capita income in
2005 was less than $610 per year; 85% live in countries in which total per capita
income in 2005 was $2,808 or less. Adjusting for purchasing power, the per capita
income levels would be $2,531 and $7,416, respectively. The latter numbers compare
to per capita income in high-income countries of over $30,000.
• Babies born in poor countries are 16 times more likely to die in their first five years
than are babies born in rich countries.
• About a quarter of the populations of low-income countries is undernourished.
• About 40% (over 50% for women) of the people 15 years old and older in low-income
countries are illiterate.
• Roughly one-fourth of the people in low-income countries do not have access to safe
drinking water.
Clearly, the high standards of living enjoyed by people in the world’s developed economies
are the global exception, not the rule. This chapter looks at the problem of improving the
standard of living in poor countries.
Rich and Poor Nations
The World Bank, an international organization designed to support economic development
by providing financial assistance, advice, and other resources to poor countries, classifies
over 200 countries according to their levels of per capita gross national income. The
categories in its 2008 report, as shown in Table 33.1 "World Incomes, Selected Countries",
were as follows:
• Low-income countries: These countries had per capita incomes of $935 or less in
2007. There were 49 countries in this category. About 20% of the world’s total
population of about 6.5 billion people lived in low-income countries in 2007.
• Middle-income countries: There were 95 countries with per capita incomes of more
than $936 but less than $11,455. Middle-income countries are further subdivided
into lower middle-income and upper middle-income countries. Roughly two-thirds of
the world’s population lived in middle-income countries in 2007. We should note
that the percentage of the world’s population living in middle-income countries
increased dramatically (and the percentage living in low-income countries decreased
dramatically) when China and India moved from being low-income to middle-income
countries.

• High-income countries: There were 65 nations with per capita incomes of $11,456 or
more. Just 16% of the world’s total population lived in high-income countries in 2007.
Countries in the low- and middle-income categories are often called developing countries.
A developing country is thus a country that is not among the high-income nations of the
world.The World Development Report 2006 (New York: Oxford University Press, 2006), xiv,
comments on this usage: “The term developing countries includes low- and middle-income
economies and thus may include economies in transition from central planning, as a matter
of convenience. The term advanced countries may be used as a matter of convenience to
denote high-income economics.” Developing countries are sometimes referred to as third-
world countries.
How does the World Bank compare incomes across countries? The World Bank converts
gross national income (GNI) figures to dollars in two ways. One is to take GNI in a local
currency and convert using the exchange rate, averaged over a three-year period in order to
smooth out the effects of currency fluctuations. This type of comparison can, however, be
misleading. A country could have a relatively high standard of living but, for a variety of
reasons, a low exchange rate. The per capita GNI figure would be quite low; the country
would appear to be poorer than it is.
A better approach to comparing incomes converts currencies to dollars on the basis of
purchasing power. This measure is reported in what are called international dollars. An
international dollar has the same purchasing power as does a U.S. dollar in the United
States. This is reported in the column labeled “2007 International $” in Table 33.1 "World
Incomes, Selected Countries".
Table 33.1 World Incomes, Selected Countries
Gross National Income per Capita, 2007
Low-income countries
Middle-income countries
High-income countries
Countries
200
7 $
2007
Internatio
nal $
Countrie
s
200
7 $
2007
Internatio
nal $
Countri
es
2007
$
2007
Internatio
nal $
Burundi
110
330
India
95
0
2,740
Czech
Republi
c
14,45
0
22,020
Sierra
Leone
260
660
China
2,36
0
5,370
Saudi
Arabia
15,44
0
22,910
Mozambiq
ue
320
690
Thailand
3,40
0
7,880
Israel
21,90
0
25,930

Gross National Income per Capita, 2007
Low-income countries
Middle-income countries
High-income countries
Countries
200
7 $
2007
Internatio
nal $
Countrie
s
200
7 $
2007
Internatio
nal $
Countri
es
2007
$
2007
Internatio
nal $
Banglades
h
470
1,340
Iran
3,47
0
10,800
Greece
29,63
0
32,330
Haiti
560
1,150
Jamaica
3,71
0
6,210
Japan
37,67
0
34,600
Uzbekistan
730
2,430
Costa
Rica
5,56
0
10,700
France
38,50
0
33,600
Vietnam
790
2,550
Brazil
5,91
0
9,370
Canada
39,42
0
35,310
Zambia
800
1,220
Argentin
a
6,05
0
12,990
United
States
46,04
0
45,850
Pakistan
870
2,570
Russian
Federati
on
7,56
0
14,400
Ireland
48,14
0
37,090
Nigeria
930
1,770
Turkey
8,02
0
12,350
Norway
76,45
0
53,320
Average
578
1,494
Average
2,87
2
5,952
Average
37,56
6
36,100
Ave.,
lower
middle
1,88
7
4,543
Ave.,
upper
middle
6,98
7
11,868
Source: World Development Indicators database, World Bank, revised October 17, 2008.

The international dollar estimates typically show higher incomes than estimates based on an
exchange rate conversion. For example, in 2007 Mozambique’s per capita GNI, based on
exchange rates, was $320. Its per capita GNI based the international dollars was $690.
Ranking of countries, both rich and poor, by per capita GNI differs depending on the
measure used. According to the per capita GNI figures in Table 33.1 "World Incomes,
Selected Countries", which convert data in domestic currencies to dollars using exchange
rates, the United States ranked fifteenth of all countries in 2007. Using the international
dollars method, its rank is tenth. China is ranked at 132 when per capita GNI is based on the
exchange rate conversion method but rises to 122 based on the international dollar method.
Characteristics of Low-Income Countries
Low incomes are often associated with other characteristics: severe inequality, poor health
care and education, high unemployment, heavy reliance on agriculture, and rapid population
growth. We will examine most of these problems in this section. Population growth in low-
income nations is examined later in the chapter.
Inequality
Not only are incomes in low-income countries quite low; income distribution is often highly
unequal. Poverty is far more prevalent than per capita numbers suggest, as illustrated by
Lorenz curves, introduced in the chapter on inequality, that show the cumulative shares of
income received by individuals or groups.
Consider Costa Rica and Panama, two Latin American countries with roughly equivalent
levels of per capita GNI (Costa Rica’s was $5,560 and Panama’s $5,510 in 2007). Panama’s
income distribution is comparatively less equal, while Costa Rica’s is far more equal. Figure
33.1 "Poverty and the Distribution of Income: Costa Rica versus Panama" compares the 2003
Lorenz curves for Costa Rica and Panama, the most recent year for which the information
was available. The 20% of the households with the lowest incomes in Costa Rica had twice as
large a share of their country’s total income as did the bottom 20% of households in
Panama. That means Costa Rica’s poor were about twice as well off, in material terms, as
Panama’s poor.
Figure 33.1 Poverty and the Distribution of Income: Costa Rica versus Panama
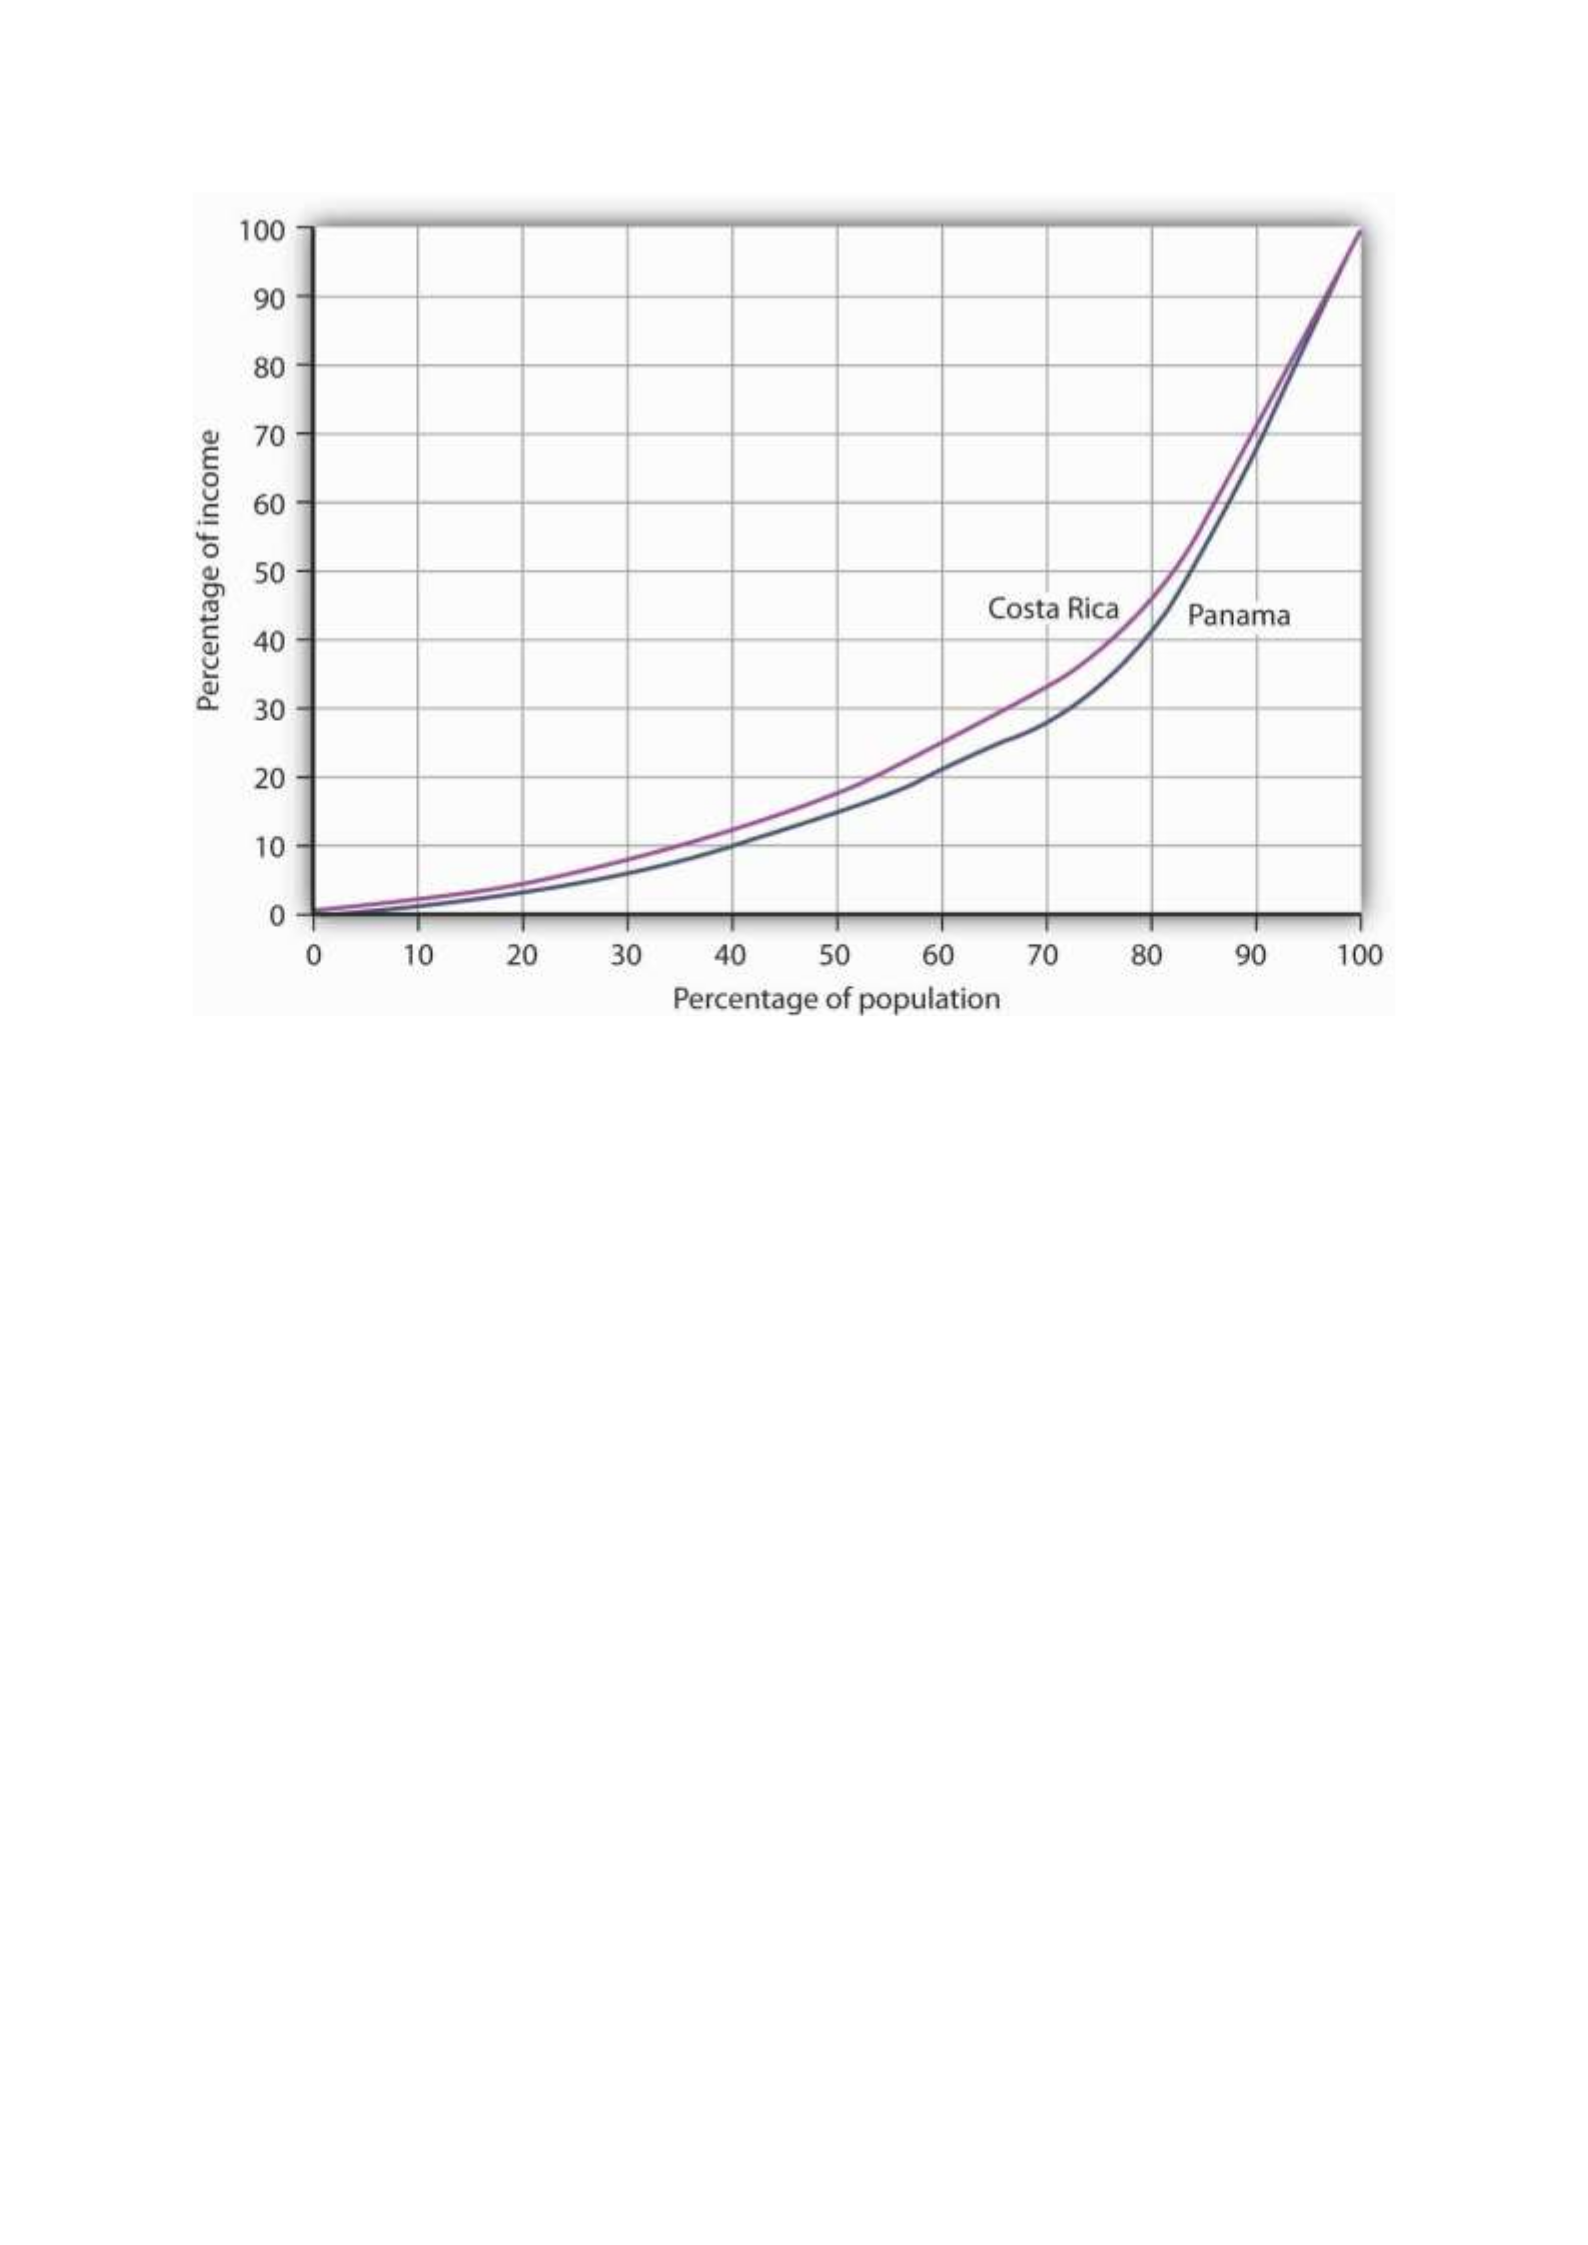
Costa Rica had about the same per capita GNI as Panama in 2003, but Panama’s income
distribution was far more unequal. Panama’s poor had much lower living standards than
Costa Rica’s poor, as suggested by the Lorenz curves for the two nations.
Source: World Development Indicators Online (revised October 17, 2008).
In general, the greater the degree of inequality, the more desperate is the condition of
people at the bottom of an income distribution. Given the high degree of inequality in many
low-income countries, it is very important to look at income distributions when we compare
living standards in different countries.
Health and Education
Poor nations are typically characterized by low levels of human capital. Where health-care
facilities are inadequate, that human capital can be reduced further by disease. Where
educational resources are poor, there will be little progress in improving human capital.
One indicator of poor health care appears on the supply side. Low-income countries have
fewer doctors, relative to their populations, than high-income countries. For example, the
UN estimates that in 2006 about 60% of mothers giving birth in developing countries had
access to a skilled health-care provider (doctor, nurse, or midwife). While that is up from
47% in 1990, the lack of access to a health-care provider may explain much of the difference
in maternal death rates between developed and developing countries: about nine maternal
deaths per 100,000 live births in developed countries compared to about 450 per 100,000 in
developing countries.United Nations, The Millennium Development Goals Report 2008, 27.

We can also see the results of poor health care in statistics on health. Among the world’s
developing countries, the infant mortality rate, which reports deaths in the first year of life,
was 57 per 1,000 live births in 2005. There were six infant deaths per 1,000 live births
among the high-income countries that year.United Nations Development Program, Human
Development Report 2007/2008 (New York: Palgrave Macmillan, 2007), 264.
Another health issue facing the world’s low-income countries is malnutrition. Malnutrition
rates in all developing countries in the 2002 to 2004 period averaged 17%, 35% in the least
developed countries.
Still another issue is the spread of HIV/AIDS. Here there is some progress. The number of
people newly infected declined from 3 million in 2001 to 2.7 million in 2005. Antiretroviral
treatments are also leading to a reduction in deaths from 2.2 million in 2005 to 2 million in
2007. Longer survival means that the number of people living with HIV (from just under 30
million in 2001 to about 33 million in 2007) is rising and most of the people living with HIV
are in Sub-Saharan Africa.United Nations, The Millennium Development Goals Report 2008,
30.
Education in poor and middle-income nations is improving. In 1991, about 80% of children in
developing countries were enrolled in primary schools. In 2005, about 85% were. The
comparable numbers in developed countries are about 95%. Enrollment rates taper off for
high school (about 53% in 2005 in developing countries compared to 91% in developed
countries).United Nations Development Program, Human Development Report
2007/2008 (New York: Palgrave Macmillan, 2007), 272.
Unemployment
Unemployment is pervasive in low-income nations. These nations, already faced with low
levels of potential output, are producing well below their potential. Unemployment rates in
low-income countries vary widely, reaching as high as 15% or more in some countries. If we
count discouraged workers, people who have given up looking for work but who would take
it if it were available, and people who work less than full time, not by choice but because
more work is unavailable, then unemployment in low-income countries soars—often to
more than 30%.
Migration within low-income countries often contributes to unemployment in urban areas.
Factors such as ethnic violence, poverty, and drought often force people to move from rural
areas to cities, where unemployment rates are already high.
Reliance on Agriculture
One of the dominant characteristics of poor nations is the concentration of employment in
agriculture. Another is the very low productivity of that employment. Agriculture in low-
income countries often employs a majority of the population but produces less than one-
third of GDP.

One of the primary forces behind income growth in wealthy countries has been the shift of
labor out of agriculture and into more productive sectors such as manufacturing. This shift is
also occurring in low-income nations but has lagged far behind.
The solution to these problems lies in economic development, to which we turn next.
Economic Development: A Definition
If the problems of low-income nations are pervasive, the development that helps to solve
those problems must transform the very nature of their societies. The late Austrian
economist Joseph Schumpeter described economic development as a revolutionary process.
Whereas economic growth implies quantitative change in production processes that are
already familiar to the society, economic development requires qualitative change in
virtually every aspect of life.
Robert Heilbroner, an economist at the New School for Social Research in New York, has
argued,
“Economic development is political and social change on a wrenching and tearing scale. … It
is a process of institutional birth and institutional death. It is a time when power shifts, often
violently and abruptly, a time when old regimes go under and new ones rise in their places.
And these are not just the unpleasant side effects of development. They are part and parcel
of the process, the very driving force of change itself.”Robert Heilbroner, Between Capitalism
and Socialism (New York: Vintage Books, 1970), 53–54.
Economic development transforms a nation at its core. But what, precisely, is development?
Many definitions follow Heilbroner in noting the massive institutional and cultural changes
economic development involves. But whatever the requirements of development, its
primary characteristics are rising incomes and improving standards of living. That means
output must increase—and it must increase relative to population growth. And because
inequality is so serious a problem in low-income nations, development must deliver
widespread improvement in living conditions. It therefore seems useful to define economic
development as a process that produces sustained and widely shared gains in per capita real
GDP.
In recent years, the United Nations has constructed measures incorporating dimensions of
economic development that go beyond the level of per capita GDP. The Human
Development Index (HDI) includes three dimensions—life expectancy, educational
attainment (adult literacy and combined primary, secondary, and post-secondary
enrollment), as well as purchasing-power-adjusted per capita real GDP. The Gender
Development Index (GDI) uses the same variables as the HDI but adjusts them downward to
take into account the extent of gender inequality. A third index, the Human Poverty Index
(HPI), measures human deprivation and includes such indicators as the percentage of people
expected to die before age 40, the percentage of underweight children under age 5, the
percentage of adults who are illiterate, and the percentage of people who live in poverty.
The number reported for the HPI shows the percentage of people in the country who suffer
these deprivations.

Throughout most of history, poverty has been the human condition. For most people life
was, in the words of 17th-century English philosopher Thomas Hobbes, “solitary, poor, nasty,
brutish, and short.” Only within the past 200 years have a handful or so of countries been
able to break the chains of economic deprivation and poverty.
Consider these facts:United Nations Development Program, Human Development Report
2007/2008 (New York: Palgrave Macmillan, 2007).
• Over a third of the world’s people live in countries in which total per capita income in
2005 was less than $610 per year; 85% live in countries in which total per capita
income in 2005 was $2,808 or less. Adjusting for purchasing power, the per capita
income levels would be $2,531 and $7,416, respectively. The latter numbers compare
to per capita income in high-income countries of over $30,000.
• Babies born in poor countries are 16 times more likely to die in their first five years
than are babies born in rich countries.
• About a quarter of the populations of low-income countries is undernourished.
• About 40% (over 50% for women) of the people 15 years old and older in low-income
countries are illiterate.
• Roughly one-fourth of the people in low-income countries do not have access to safe
drinking water.
Clearly, the high standards of living enjoyed by people in the world’s developed economies
are the global exception, not the rule. This chapter looks at the problem of improving the
standard of living in poor countries.
Rich and Poor Nations
The World Bank, an international organization designed to support economic development
by providing financial assistance, advice, and other resources to poor countries, classifies
over 200 countries according to their levels of per capita gross national income. The
categories in its 2008 report, as shown in Table 33.1 "World Incomes, Selected Countries",
were as follows:
• Low-income countries: These countries had per capita incomes of $935 or less in
2007. There were 49 countries in this category. About 20% of the world’s total
population of about 6.5 billion people lived in low-income countries in 2007.
• Middle-income countries: There were 95 countries with per capita incomes of more
than $936 but less than $11,455. Middle-income countries are further subdivided
into lower middle-income and upper middle-income countries. Roughly two-thirds of
the world’s population lived in middle-income countries in 2007. We should note
that the percentage of the world’s population living in middle-income countries
increased dramatically (and the percentage living in low-income countries decreased
dramatically) when China and India moved from being low-income to middle-income
countries.

• High-income countries: There were 65 nations with per capita incomes of $11,456 or
more. Just 16% of the world’s total population lived in high-income countries in 2007.
Countries in the low- and middle-income categories are often called developing countries.
A developing country is thus a country that is not among the high-income nations of the
world.The World Development Report 2006 (New York: Oxford University Press, 2006), xiv,
comments on this usage: “The term developing countries includes low- and middle-income
economies and thus may include economies in transition from central planning, as a matter
of convenience. The term advanced countries may be used as a matter of convenience to
denote high-income economics.” Developing countries are sometimes referred to as third-
world countries.
How does the World Bank compare incomes across countries? The World Bank converts
gross national income (GNI) figures to dollars in two ways. One is to take GNI in a local
currency and convert using the exchange rate, averaged over a three-year period in order to
smooth out the effects of currency fluctuations. This type of comparison can, however, be
misleading. A country could have a relatively high standard of living but, for a variety of
reasons, a low exchange rate. The per capita GNI figure would be quite low; the country
would appear to be poorer than it is.
A better approach to comparing incomes converts currencies to dollars on the basis of
purchasing power. This measure is reported in what are called international dollars. An
international dollar has the same purchasing power as does a U.S. dollar in the United
States. This is reported in the column labeled “2007 International $” in Table 33.1 "World
Incomes, Selected Countries".
Table 33.1 World Incomes, Selected Countries
Gross National Income per Capita, 2007
Low-income countries
Middle-income countries
High-income countries
Countries
200
7 $
2007
Internatio
nal $
Countrie
s
200
7 $
2007
Internatio
nal $
Countri
es
2007
$
2007
Internatio
nal $
Burundi
110
330
India
95
0
2,740
Czech
Republi
c
14,45
0
22,020
Sierra
Leone
260
660
China
2,36
0
5,370
Saudi
Arabia
15,44
0
22,910
Mozambiq
ue
320
690
Thailand
3,40
0
7,880
Israel
21,90
0
25,930

Gross National Income per Capita, 2007
Low-income countries
Middle-income countries
High-income countries
Countries
200
7 $
2007
Internatio
nal $
Countrie
s
200
7 $
2007
Internatio
nal $
Countri
es
2007
$
2007
Internatio
nal $
Banglades
h
470
1,340
Iran
3,47
0
10,800
Greece
29,63
0
32,330
Haiti
560
1,150
Jamaica
3,71
0
6,210
Japan
37,67
0
34,600
Uzbekistan
730
2,430
Costa
Rica
5,56
0
10,700
France
38,50
0
33,600
Vietnam
790
2,550
Brazil
5,91
0
9,370
Canada
39,42
0
35,310
Zambia
800
1,220
Argentin
a
6,05
0
12,990
United
States
46,04
0
45,850
Pakistan
870
2,570
Russian
Federati
on
7,56
0
14,400
Ireland
48,14
0
37,090
Nigeria
930
1,770
Turkey
8,02
0
12,350
Norway
76,45
0
53,320
Average
578
1,494
Average
2,87
2
5,952
Average
37,56
6
36,100
Ave.,
lower
middle
1,88
7
4,543
Ave.,
upper
middle
6,98
7
11,868
Source: World Development Indicators database, World Bank, revised October 17, 2008.

The international dollar estimates typically show higher incomes than estimates based on an
exchange rate conversion. For example, in 2007 Mozambique’s per capita GNI, based on
exchange rates, was $320. Its per capita GNI based the international dollars was $690.
Ranking of countries, both rich and poor, by per capita GNI differs depending on the
measure used. According to the per capita GNI figures in Table 33.1 "World Incomes,
Selected Countries", which convert data in domestic currencies to dollars using exchange
rates, the United States ranked fifteenth of all countries in 2007. Using the international
dollars method, its rank is tenth. China is ranked at 132 when per capita GNI is based on the
exchange rate conversion method but rises to 122 based on the international dollar method.
Characteristics of Low-Income Countries
Low incomes are often associated with other characteristics: severe inequality, poor health
care and education, high unemployment, heavy reliance on agriculture, and rapid population
growth. We will examine most of these problems in this section. Population growth in low-
income nations is examined later in the chapter.
Inequality
Not only are incomes in low-income countries quite low; income distribution is often highly
unequal. Poverty is far more prevalent than per capita numbers suggest, as illustrated by
Lorenz curves, introduced in the chapter on inequality, that show the cumulative shares of
income received by individuals or groups.
Consider Costa Rica and Panama, two Latin American countries with roughly equivalent
levels of per capita GNI (Costa Rica’s was $5,560 and Panama’s $5,510 in 2007). Panama’s
income distribution is comparatively less equal, while Costa Rica’s is far more equal. Figure
33.1 "Poverty and the Distribution of Income: Costa Rica versus Panama" compares the 2003
Lorenz curves for Costa Rica and Panama, the most recent year for which the information
was available. The 20% of the households with the lowest incomes in Costa Rica had twice as
large a share of their country’s total income as did the bottom 20% of households in
Panama. That means Costa Rica’s poor were about twice as well off, in material terms, as
Panama’s poor.
Figure 33.1 Poverty and the Distribution of Income: Costa Rica versus Panama

Costa Rica had about the same per capita GNI as Panama in 2003, but Panama’s income
distribution was far more unequal. Panama’s poor had much lower living standards than
Costa Rica’s poor, as suggested by the Lorenz curves for the two nations.
Source: World Development Indicators Online (revised October 17, 2008).
In general, the greater the degree of inequality, the more desperate is the condition of
people at the bottom of an income distribution. Given the high degree of inequality in many
low-income countries, it is very important to look at income distributions when we compare
living standards in different countries.
Health and Education
Poor nations are typically characterized by low levels of human capital. Where health-care
facilities are inadequate, that human capital can be reduced further by disease. Where
educational resources are poor, there will be little progress in improving human capital.
One indicator of poor health care appears on the supply side. Low-income countries have
fewer doctors, relative to their populations, than high-income countries. For example, the
UN estimates that in 2006 about 60% of mothers giving birth in developing countries had
access to a skilled health-care provider (doctor, nurse, or midwife). While that is up from
47% in 1990, the lack of access to a health-care provider may explain much of the difference
in maternal death rates between developed and developing countries: about nine maternal
deaths per 100,000 live births in developed countries compared to about 450 per 100,000 in
developing countries.United Nations, The Millennium Development Goals Report 2008, 27.

We can also see the results of poor health care in statistics on health. Among the world’s
developing countries, the infant mortality rate, which reports deaths in the first year of life,
was 57 per 1,000 live births in 2005. There were six infant deaths per 1,000 live births
among the high-income countries that year.United Nations Development Program, Human
Development Report 2007/2008 (New York: Palgrave Macmillan, 2007), 264.
Another health issue facing the world’s low-income countries is malnutrition. Malnutrition
rates in all developing countries in the 2002 to 2004 period averaged 17%, 35% in the least
developed countries.
Still another issue is the spread of HIV/AIDS. Here there is some progress. The number of
people newly infected declined from 3 million in 2001 to 2.7 million in 2005. Antiretroviral
treatments are also leading to a reduction in deaths from 2.2 million in 2005 to 2 million in
2007. Longer survival means that the number of people living with HIV (from just under 30
million in 2001 to about 33 million in 2007) is rising and most of the people living with HIV
are in Sub-Saharan Africa.United Nations, The Millennium Development Goals Report 2008,
30.
Education in poor and middle-income nations is improving. In 1991, about 80% of children in
developing countries were enrolled in primary schools. In 2005, about 85% were. The
comparable numbers in developed countries are about 95%. Enrollment rates taper off for
high school (about 53% in 2005 in developing countries compared to 91% in developed
countries).United Nations Development Program, Human Development Report
2007/2008 (New York: Palgrave Macmillan, 2007), 272.
Unemployment
Unemployment is pervasive in low-income nations. These nations, already faced with low
levels of potential output, are producing well below their potential. Unemployment rates in
low-income countries vary widely, reaching as high as 15% or more in some countries. If we
count discouraged workers, people who have given up looking for work but who would take
it if it were available, and people who work less than full time, not by choice but because
more work is unavailable, then unemployment in low-income countries soars—often to
more than 30%.
Migration within low-income countries often contributes to unemployment in urban areas.
Factors such as ethnic violence, poverty, and drought often force people to move from rural
areas to cities, where unemployment rates are already high.
Reliance on Agriculture
One of the dominant characteristics of poor nations is the concentration of employment in
agriculture. Another is the very low productivity of that employment. Agriculture in low-
income countries often employs a majority of the population but produces less than one-
third of GDP.

One of the primary forces behind income growth in wealthy countries has been the shift of
labor out of agriculture and into more productive sectors such as manufacturing. This shift is
also occurring in low-income nations but has lagged far behind.
The solution to these problems lies in economic development, to which we turn next.
Economic Development: A Definition
If the problems of low-income nations are pervasive, the development that helps to solve
those problems must transform the very nature of their societies. The late Austrian
economist Joseph Schumpeter described economic development as a revolutionary process.
Whereas economic growth implies quantitative change in production processes that are
already familiar to the society, economic development requires qualitative change in
virtually every aspect of life.
Robert Heilbroner, an economist at the New School for Social Research in New York, has
argued,
“Economic development is political and social change on a wrenching and tearing scale. … It
is a process of institutional birth and institutional death. It is a time when power shifts, often
violently and abruptly, a time when old regimes go under and new ones rise in their places.
And these are not just the unpleasant side effects of development. They are part and parcel
of the process, the very driving force of change itself.”Robert Heilbroner, Between Capitalism
and Socialism (New York: Vintage Books, 1970), 53–54.
Economic development transforms a nation at its core. But what, precisely, is development?
Many definitions follow Heilbroner in noting the massive institutional and cultural changes
economic development involves. But whatever the requirements of development, its
primary characteristics are rising incomes and improving standards of living. That means
output must increase—and it must increase relative to population growth. And because
inequality is so serious a problem in low-income nations, development must deliver
widespread improvement in living conditions. It therefore seems useful to define economic
development as a process that produces sustained and widely shared gains in per capita real
GDP.
In recent years, the United Nations has constructed measures incorporating dimensions of
economic development that go beyond the level of per capita GDP. The Human
Development Index (HDI) includes three dimensions—life expectancy, educational
attainment (adult literacy and combined primary, secondary, and post-secondary
enrollment), as well as purchasing-power-adjusted per capita real GDP. The Gender
Development Index (GDI) uses the same variables as the HDI but adjusts them downward to
take into account the extent of gender inequality. A third index, the Human Poverty Index
(HPI), measures human deprivation and includes such indicators as the percentage of people
expected to die before age 40, the percentage of underweight children under age 5, the
percentage of adults who are illiterate, and the percentage of people who live in poverty.
The number reported for the HPI shows the percentage of people in the country who suffer
these deprivations.

Throughout most of history, poverty has been the human condition. For most people life
was, in the words of 17th-century English philosopher Thomas Hobbes, “solitary, poor, nasty,
brutish, and short.” Only within the past 200 years have a handful or so of countries been
able to break the chains of economic deprivation and poverty.
Consider these facts:United Nations Development Program, Human Development Report
2007/2008 (New York: Palgrave Macmillan, 2007).
• Over a third of the world’s people live in countries in which total per capita income in
2005 was less than $610 per year; 85% live in countries in which total per capita
income in 2005 was $2,808 or less. Adjusting for purchasing power, the per capita
income levels would be $2,531 and $7,416, respectively. The latter numbers compare
to per capita income in high-income countries of over $30,000.
• Babies born in poor countries are 16 times more likely to die in their first five years
than are babies born in rich countries.
• About a quarter of the populations of low-income countries is undernourished.
• About 40% (over 50% for women) of the people 15 years old and older in low-income
countries are illiterate.
• Roughly one-fourth of the people in low-income countries do not have access to safe
drinking water.
Clearly, the high standards of living enjoyed by people in the world’s developed economies
are the global exception, not the rule. This chapter looks at the problem of improving the
standard of living in poor countries.
Rich and Poor Nations
The World Bank, an international organization designed to support economic development
by providing financial assistance, advice, and other resources to poor countries, classifies
over 200 countries according to their levels of per capita gross national income. The
categories in its 2008 report, as shown in Table 33.1 "World Incomes, Selected Countries",
were as follows:
• Low-income countries: These countries had per capita incomes of $935 or less in
2007. There were 49 countries in this category. About 20% of the world’s total
population of about 6.5 billion people lived in low-income countries in 2007.
• Middle-income countries: There were 95 countries with per capita incomes of more
than $936 but less than $11,455. Middle-income countries are further subdivided
into lower middle-income and upper middle-income countries. Roughly two-thirds of
the world’s population lived in middle-income countries in 2007. We should note
that the percentage of the world’s population living in middle-income countries
increased dramatically (and the percentage living in low-income countries decreased
dramatically) when China and India moved from being low-income to middle-income
countries.

• High-income countries: There were 65 nations with per capita incomes of $11,456 or
more. Just 16% of the world’s total population lived in high-income countries in 2007.
Countries in the low- and middle-income categories are often called developing countries.
A developing country is thus a country that is not among the high-income nations of the
world.The World Development Report 2006 (New York: Oxford University Press, 2006), xiv,
comments on this usage: “The term developing countries includes low- and middle-income
economies and thus may include economies in transition from central planning, as a matter
of convenience. The term advanced countries may be used as a matter of convenience to
denote high-income economics.” Developing countries are sometimes referred to as third-
world countries.
How does the World Bank compare incomes across countries? The World Bank converts
gross national income (GNI) figures to dollars in two ways. One is to take GNI in a local
currency and convert using the exchange rate, averaged over a three-year period in order to
smooth out the effects of currency fluctuations. This type of comparison can, however, be
misleading. A country could have a relatively high standard of living but, for a variety of
reasons, a low exchange rate. The per capita GNI figure would be quite low; the country
would appear to be poorer than it is.
A better approach to comparing incomes converts currencies to dollars on the basis of
purchasing power. This measure is reported in what are called international dollars. An
international dollar has the same purchasing power as does a U.S. dollar in the United
States. This is reported in the column labeled “2007 International $” in Table 33.1 "World
Incomes, Selected Countries".
Table 33.1 World Incomes, Selected Countries
Gross National Income per Capita, 2007
Low-income countries
Middle-income countries
High-income countries
Countries
200
7 $
2007
Internatio
nal $
Countrie
s
200
7 $
2007
Internatio
nal $
Countri
es
2007
$
2007
Internatio
nal $
Burundi
110
330
India
95
0
2,740
Czech
Republi
c
14,45
0
22,020
Sierra
Leone
260
660
China
2,36
0
5,370
Saudi
Arabia
15,44
0
22,910
Mozambiq
ue
320
690
Thailand
3,40
0
7,880
Israel
21,90
0
25,930

Gross National Income per Capita, 2007
Low-income countries
Middle-income countries
High-income countries
Countries
200
7 $
2007
Internatio
nal $
Countrie
s
200
7 $
2007
Internatio
nal $
Countri
es
2007
$
2007
Internatio
nal $
Banglades
h
470
1,340
Iran
3,47
0
10,800
Greece
29,63
0
32,330
Haiti
560
1,150
Jamaica
3,71
0
6,210
Japan
37,67
0
34,600
Uzbekistan
730
2,430
Costa
Rica
5,56
0
10,700
France
38,50
0
33,600
Vietnam
790
2,550
Brazil
5,91
0
9,370
Canada
39,42
0
35,310
Zambia
800
1,220
Argentin
a
6,05
0
12,990
United
States
46,04
0
45,850
Pakistan
870
2,570
Russian
Federati
on
7,56
0
14,400
Ireland
48,14
0
37,090
Nigeria
930
1,770
Turkey
8,02
0
12,350
Norway
76,45
0
53,320
Average
578
1,494
Average
2,87
2
5,952
Average
37,56
6
36,100
Ave.,
lower
middle
1,88
7
4,543
Ave.,
upper
middle
6,98
7
11,868
Source: World Development Indicators database, World Bank, revised October 17, 2008.

The international dollar estimates typically show higher incomes than estimates based on an
exchange rate conversion. For example, in 2007 Mozambique’s per capita GNI, based on
exchange rates, was $320. Its per capita GNI based the international dollars was $690.
Ranking of countries, both rich and poor, by per capita GNI differs depending on the
measure used. According to the per capita GNI figures in Table 33.1 "World Incomes,
Selected Countries", which convert data in domestic currencies to dollars using exchange
rates, the United States ranked fifteenth of all countries in 2007. Using the international
dollars method, its rank is tenth. China is ranked at 132 when per capita GNI is based on the
exchange rate conversion method but rises to 122 based on the international dollar method.
Characteristics of Low-Income Countries
Low incomes are often associated with other characteristics: severe inequality, poor health
care and education, high unemployment, heavy reliance on agriculture, and rapid population
growth. We will examine most of these problems in this section. Population growth in low-
income nations is examined later in the chapter.
Inequality
Not only are incomes in low-income countries quite low; income distribution is often highly
unequal. Poverty is far more prevalent than per capita numbers suggest, as illustrated by
Lorenz curves, introduced in the chapter on inequality, that show the cumulative shares of
income received by individuals or groups.
Consider Costa Rica and Panama, two Latin American countries with roughly equivalent
levels of per capita GNI (Costa Rica’s was $5,560 and Panama’s $5,510 in 2007). Panama’s
income distribution is comparatively less equal, while Costa Rica’s is far more equal. Figure
33.1 "Poverty and the Distribution of Income: Costa Rica versus Panama" compares the 2003
Lorenz curves for Costa Rica and Panama, the most recent year for which the information
was available. The 20% of the households with the lowest incomes in Costa Rica had twice as
large a share of their country’s total income as did the bottom 20% of households in
Panama. That means Costa Rica’s poor were about twice as well off, in material terms, as
Panama’s poor.
Figure 33.1 Poverty and the Distribution of Income: Costa Rica versus Panama
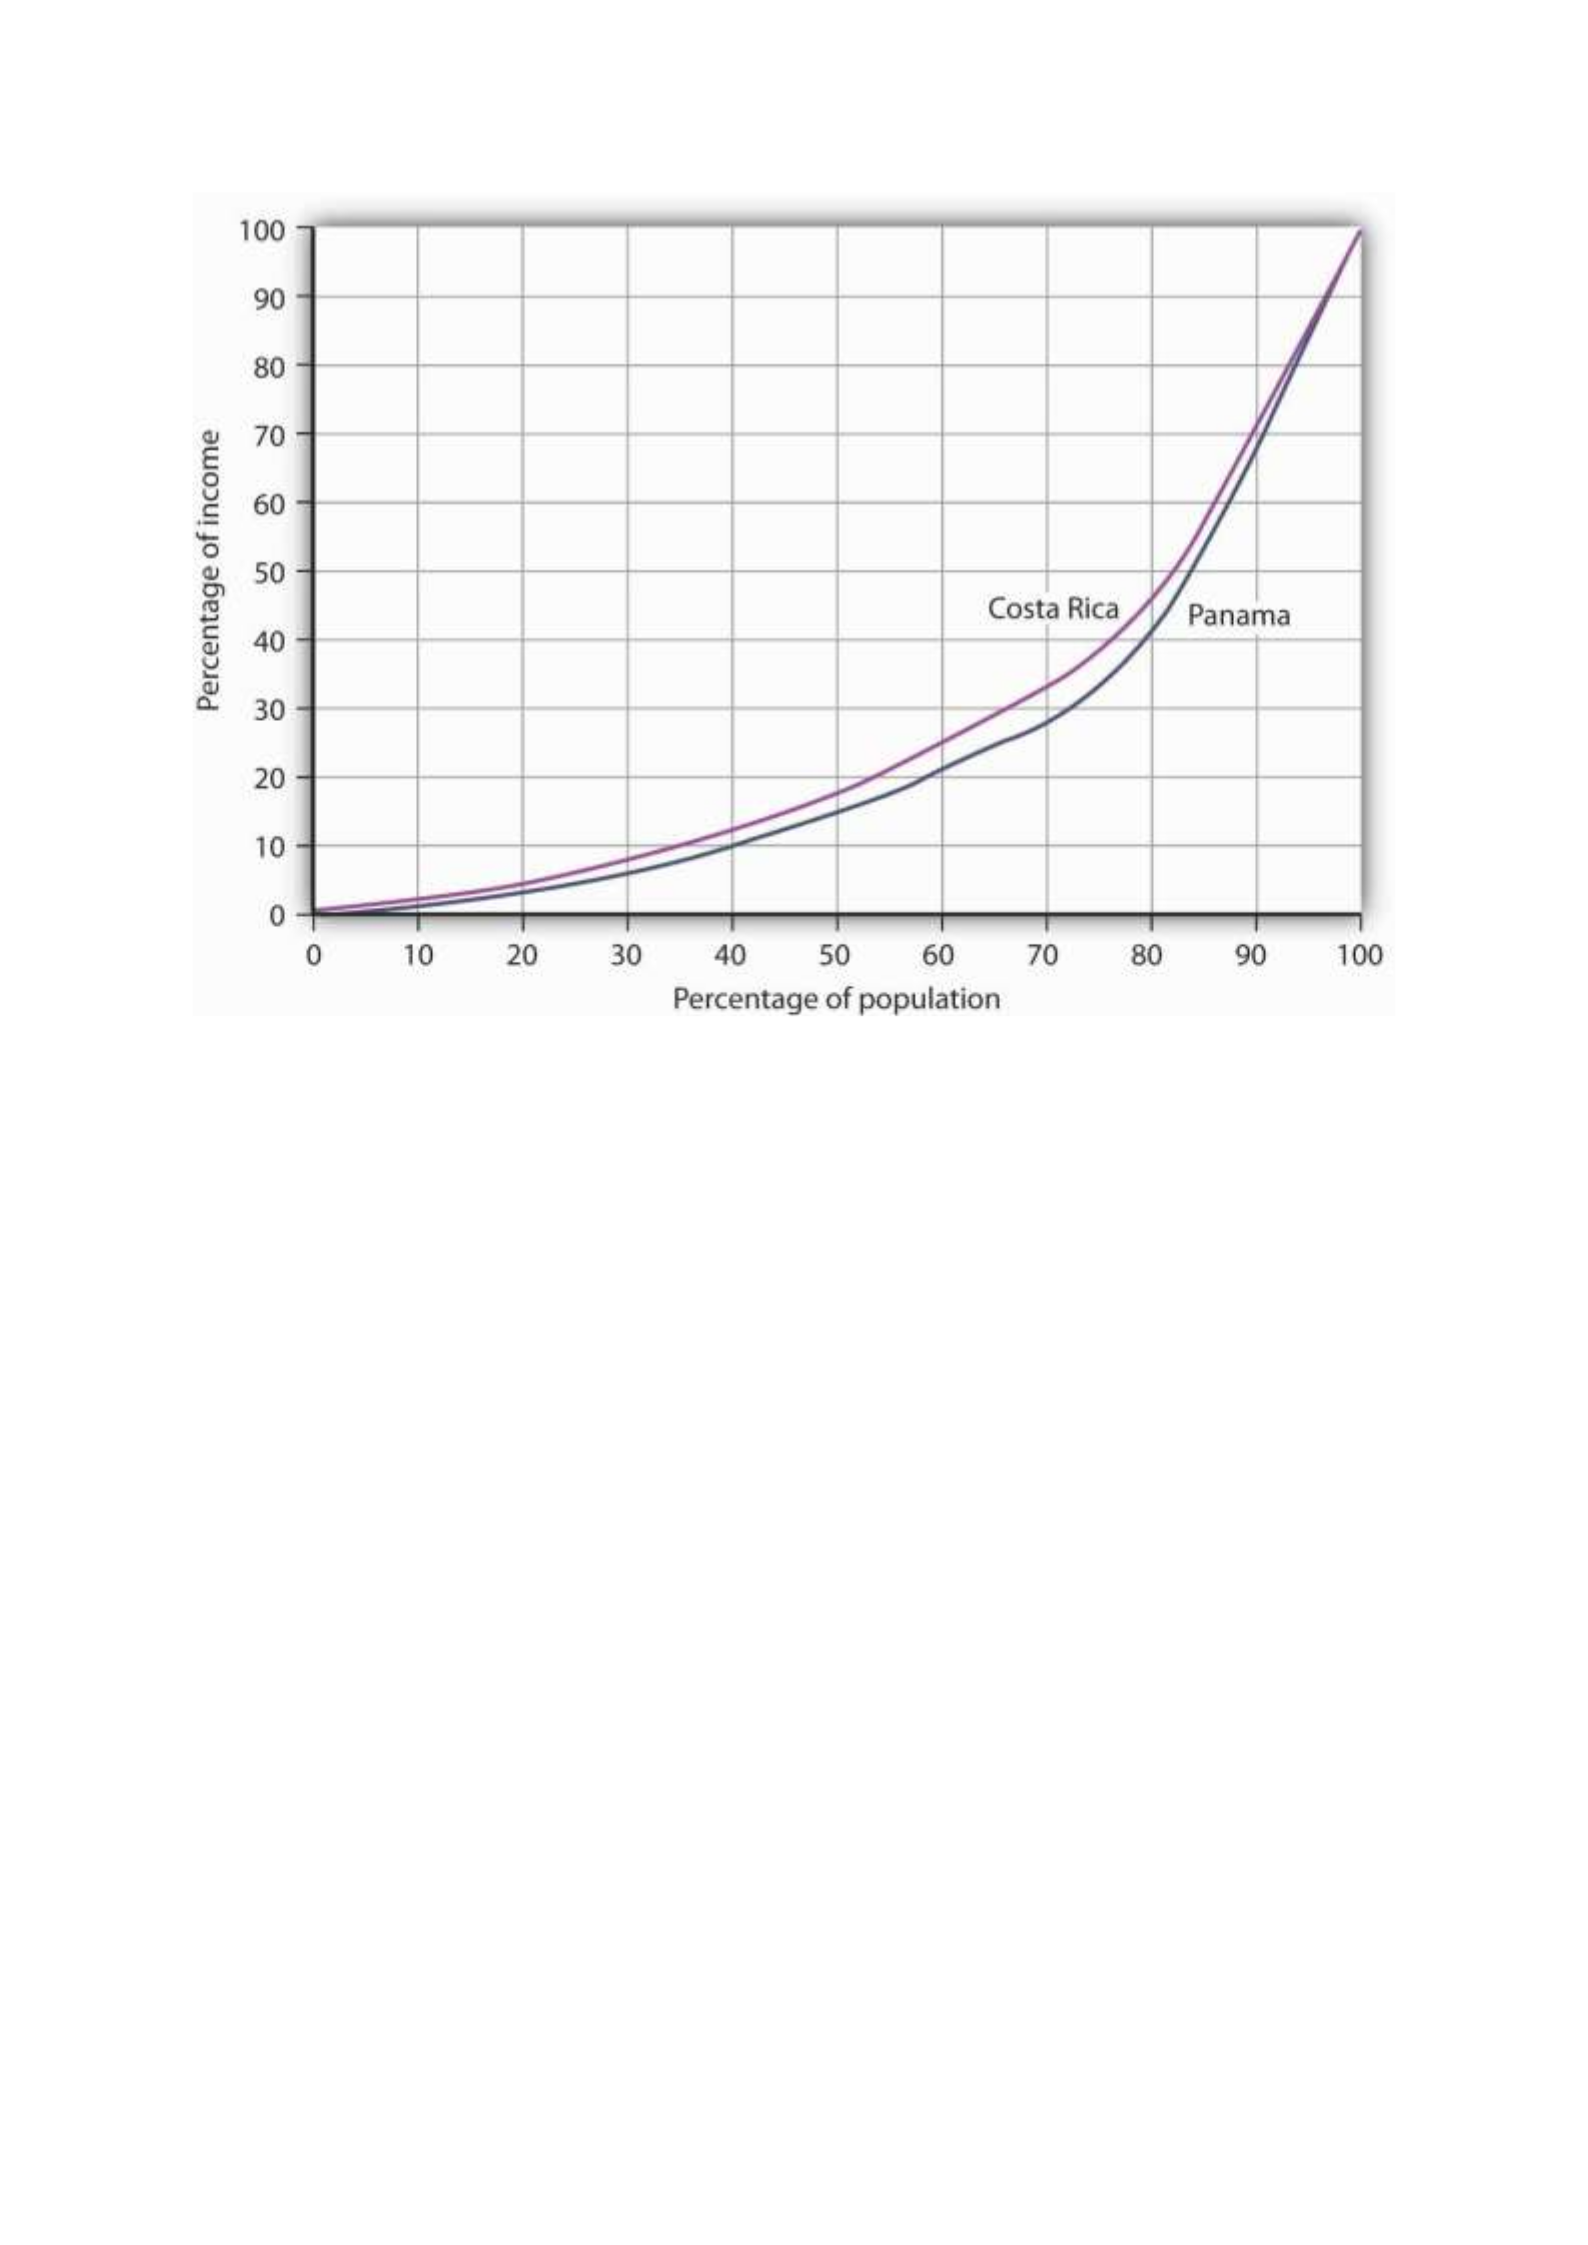
Costa Rica had about the same per capita GNI as Panama in 2003, but Panama’s income
distribution was far more unequal. Panama’s poor had much lower living standards than
Costa Rica’s poor, as suggested by the Lorenz curves for the two nations.
Source: World Development Indicators Online (revised October 17, 2008).
In general, the greater the degree of inequality, the more desperate is the condition of
people at the bottom of an income distribution. Given the high degree of inequality in many
low-income countries, it is very important to look at income distributions when we compare
living standards in different countries.
Health and Education
Poor nations are typically characterized by low levels of human capital. Where health-care
facilities are inadequate, that human capital can be reduced further by disease. Where
educational resources are poor, there will be little progress in improving human capital.
One indicator of poor health care appears on the supply side. Low-income countries have
fewer doctors, relative to their populations, than high-income countries. For example, the
UN estimates that in 2006 about 60% of mothers giving birth in developing countries had
access to a skilled health-care provider (doctor, nurse, or midwife). While that is up from
47% in 1990, the lack of access to a health-care provider may explain much of the difference
in maternal death rates between developed and developing countries: about nine maternal
deaths per 100,000 live births in developed countries compared to about 450 per 100,000 in
developing countries.United Nations, The Millennium Development Goals Report 2008, 27.

We can also see the results of poor health care in statistics on health. Among the world’s
developing countries, the infant mortality rate, which reports deaths in the first year of life,
was 57 per 1,000 live births in 2005. There were six infant deaths per 1,000 live births
among the high-income countries that year.United Nations Development Program, Human
Development Report 2007/2008 (New York: Palgrave Macmillan, 2007), 264.
Another health issue facing the world’s low-income countries is malnutrition. Malnutrition
rates in all developing countries in the 2002 to 2004 period averaged 17%, 35% in the least
developed countries.
Still another issue is the spread of HIV/AIDS. Here there is some progress. The number of
people newly infected declined from 3 million in 2001 to 2.7 million in 2005. Antiretroviral
treatments are also leading to a reduction in deaths from 2.2 million in 2005 to 2 million in
2007. Longer survival means that the number of people living with HIV (from just under 30
million in 2001 to about 33 million in 2007) is rising and most of the people living with HIV
are in Sub-Saharan Africa.United Nations, The Millennium Development Goals Report 2008,
30.
Education in poor and middle-income nations is improving. In 1991, about 80% of children in
developing countries were enrolled in primary schools. In 2005, about 85% were. The
comparable numbers in developed countries are about 95%. Enrollment rates taper off for
high school (about 53% in 2005 in developing countries compared to 91% in developed
countries).United Nations Development Program, Human Development Report
2007/2008 (New York: Palgrave Macmillan, 2007), 272.
Unemployment
Unemployment is pervasive in low-income nations. These nations, already faced with low
levels of potential output, are producing well below their potential. Unemployment rates in
low-income countries vary widely, reaching as high as 15% or more in some countries. If we
count discouraged workers, people who have given up looking for work but who would take
it if it were available, and people who work less than full time, not by choice but because
more work is unavailable, then unemployment in low-income countries soars—often to
more than 30%.
Migration within low-income countries often contributes to unemployment in urban areas.
Factors such as ethnic violence, poverty, and drought often force people to move from rural
areas to cities, where unemployment rates are already high.
Reliance on Agriculture
One of the dominant characteristics of poor nations is the concentration of employment in
agriculture. Another is the very low productivity of that employment. Agriculture in low-
income countries often employs a majority of the population but produces less than one-
third of GDP.

One of the primary forces behind income growth in wealthy countries has been the shift of
labor out of agriculture and into more productive sectors such as manufacturing. This shift is
also occurring in low-income nations but has lagged far behind.
The solution to these problems lies in economic development, to which we turn next.
Economic Development: A Definition
If the problems of low-income nations are pervasive, the development that helps to solve
those problems must transform the very nature of their societies. The late Austrian
economist Joseph Schumpeter described economic development as a revolutionary process.
Whereas economic growth implies quantitative change in production processes that are
already familiar to the society, economic development requires qualitative change in
virtually every aspect of life.
Robert Heilbroner, an economist at the New School for Social Research in New York, has
argued,
“Economic development is political and social change on a wrenching and tearing scale. … It
is a process of institutional birth and institutional death. It is a time when power shifts, often
violently and abruptly, a time when old regimes go under and new ones rise in their places.
And these are not just the unpleasant side effects of development. They are part and parcel
of the process, the very driving force of change itself.”Robert Heilbroner, Between Capitalism
and Socialism (New York: Vintage Books, 1970), 53–54.
Economic development transforms a nation at its core. But what, precisely, is development?
Many definitions follow Heilbroner in noting the massive institutional and cultural changes
economic development involves. But whatever the requirements of development, its
primary characteristics are rising incomes and improving standards of living. That means
output must increase—and it must increase relative to population growth. And because
inequality is so serious a problem in low-income nations, development must deliver
widespread improvement in living conditions. It therefore seems useful to define economic
development as a process that produces sustained and widely shared gains in per capita real
GDP.
In recent years, the United Nations has constructed measures incorporating dimensions of
economic development that go beyond the level of per capita GDP. The Human
Development Index (HDI) includes three dimensions—life expectancy, educational
attainment (adult literacy and combined primary, secondary, and post-secondary
enrollment), as well as purchasing-power-adjusted per capita real GDP. The Gender
Development Index (GDI) uses the same variables as the HDI but adjusts them downward to
take into account the extent of gender inequality. A third index, the Human Poverty Index
(HPI), measures human deprivation and includes such indicators as the percentage of people
expected to die before age 40, the percentage of underweight children under age 5, the
percentage of adults who are illiterate, and the percentage of people who live in poverty.
The number reported for the HPI shows the percentage of people in the country who suffer
these deprivations.

The international dollar estimates typically show higher incomes than estimates based on an
exchange rate conversion. For example, in 2007 Mozambique’s per capita GNI, based on
exchange rates, was $320. Its per capita GNI based the international dollars was $690.
Ranking of countries, both rich and poor, by per capita GNI differs depending on the
measure used. According to the per capita GNI figures in Table 33.1 "World Incomes,
Selected Countries", which convert data in domestic currencies to dollars using exchange
rates, the United States ranked fifteenth of all countries in 2007. Using the international
dollars method, its rank is tenth. China is ranked at 132 when per capita GNI is based on the
exchange rate conversion method but rises to 122 based on the international dollar method.
Characteristics of Low-Income Countries
Low incomes are often associated with other characteristics: severe inequality, poor health
care and education, high unemployment, heavy reliance on agriculture, and rapid population
growth. We will examine most of these problems in this section. Population growth in low-
income nations is examined later in the chapter.
Inequality
Not only are incomes in low-income countries quite low; income distribution is often highly
unequal. Poverty is far more prevalent than per capita numbers suggest, as illustrated by
Lorenz curves, introduced in the chapter on inequality, that show the cumulative shares of
income received by individuals or groups.
Consider Costa Rica and Panama, two Latin American countries with roughly equivalent
levels of per capita GNI (Costa Rica’s was $5,560 and Panama’s $5,510 in 2007). Panama’s
income distribution is comparatively less equal, while Costa Rica’s is far more equal. Figure
33.1 "Poverty and the Distribution of Income: Costa Rica versus Panama" compares the 2003
Lorenz curves for Costa Rica and Panama, the most recent year for which the information
was available. The 20% of the households with the lowest incomes in Costa Rica had twice as
large a share of their country’s total income as did the bottom 20% of households in
Panama. That means Costa Rica’s poor were about twice as well off, in material terms, as
Panama’s poor.
Figure 33.1 Poverty and the Distribution of Income: Costa Rica versus Panama

Costa Rica had about the same per capita GNI as Panama in 2003, but Panama’s income
distribution was far more unequal. Panama’s poor had much lower living standards than
Costa Rica’s poor, as suggested by the Lorenz curves for the two nations.
Source: World Development Indicators Online (revised October 17, 2008).
In general, the greater the degree of inequality, the more desperate is the condition of
people at the bottom of an income distribution. Given the high degree of inequality in many
low-income countries, it is very important to look at income distributions when we compare
living standards in different countries.
Health and Education
Poor nations are typically characterized by low levels of human capital. Where health-care
facilities are inadequate, that human capital can be reduced further by disease. Where
educational resources are poor, there will be little progress in improving human capital.
One indicator of poor health care appears on the supply side. Low-income countries have
fewer doctors, relative to their populations, than high-income countries. For example, the
UN estimates that in 2006 about 60% of mothers giving birth in developing countries had
access to a skilled health-care provider (doctor, nurse, or midwife). While that is up from
47% in 1990, the lack of access to a health-care provider may explain much of the difference
in maternal death rates between developed and developing countries: about nine maternal
deaths per 100,000 live births in developed countries compared to about 450 per 100,000 in
developing countries.United Nations, The Millennium Development Goals Report 2008, 27.

We can also see the results of poor health care in statistics on health. Among the world’s
developing countries, the infant mortality rate, which reports deaths in the first year of life,
was 57 per 1,000 live births in 2005. There were six infant deaths per 1,000 live births
among the high-income countries that year.United Nations Development Program, Human
Development Report 2007/2008 (New York: Palgrave Macmillan, 2007), 264.
Another health issue facing the world’s low-income countries is malnutrition. Malnutrition
rates in all developing countries in the 2002 to 2004 period averaged 17%, 35% in the least
developed countries.
Still another issue is the spread of HIV/AIDS. Here there is some progress. The number of
people newly infected declined from 3 million in 2001 to 2.7 million in 2005. Antiretroviral
treatments are also leading to a reduction in deaths from 2.2 million in 2005 to 2 million in
2007. Longer survival means that the number of people living with HIV (from just under 30
million in 2001 to about 33 million in 2007) is rising and most of the people living with HIV
are in Sub-Saharan Africa.United Nations, The Millennium Development Goals Report 2008,
30.
Education in poor and middle-income nations is improving. In 1991, about 80% of children in
developing countries were enrolled in primary schools. In 2005, about 85% were. The
comparable numbers in developed countries are about 95%. Enrollment rates taper off for
high school (about 53% in 2005 in developing countries compared to 91% in developed
countries).United Nations Development Program, Human Development Report
2007/2008 (New York: Palgrave Macmillan, 2007), 272.
Unemployment
Unemployment is pervasive in low-income nations. These nations, already faced with low
levels of potential output, are producing well below their potential. Unemployment rates in
low-income countries vary widely, reaching as high as 15% or more in some countries. If we
count discouraged workers, people who have given up looking for work but who would take
it if it were available, and people who work less than full time, not by choice but because
more work is unavailable, then unemployment in low-income countries soars—often to
more than 30%.
Migration within low-income countries often contributes to unemployment in urban areas.
Factors such as ethnic violence, poverty, and drought often force people to move from rural
areas to cities, where unemployment rates are already high.
Reliance on Agriculture
One of the dominant characteristics of poor nations is the concentration of employment in
agriculture. Another is the very low productivity of that employment. Agriculture in low-
income countries often employs a majority of the population but produces less than one-
third of GDP.

One of the primary forces behind income growth in wealthy countries has been the shift of
labor out of agriculture and into more productive sectors such as manufacturing. This shift is
also occurring in low-income nations but has lagged far behind.
The solution to these problems lies in economic development, to which we turn next.
Economic Development: A Definition
If the problems of low-income nations are pervasive, the development that helps to solve
those problems must transform the very nature of their societies. The late Austrian
economist Joseph Schumpeter described economic development as a revolutionary process.
Whereas economic growth implies quantitative change in production processes that are
already familiar to the society, economic development requires qualitative change in
virtually every aspect of life.
Robert Heilbroner, an economist at the New School for Social Research in New York, has
argued,
“Economic development is political and social change on a wrenching and tearing scale. … It
is a process of institutional birth and institutional death. It is a time when power shifts, often
violently and abruptly, a time when old regimes go under and new ones rise in their places.
And these are not just the unpleasant side effects of development. They are part and parcel
of the process, the very driving force of change itself.”Robert Heilbroner, Between Capitalism
and Socialism (New York: Vintage Books, 1970), 53–54.
Economic development transforms a nation at its core. But what, precisely, is development?
Many definitions follow Heilbroner in noting the massive institutional and cultural changes
economic development involves. But whatever the requirements of development, its
primary characteristics are rising incomes and improving standards of living. That means
output must increase—and it must increase relative to population growth. And because
inequality is so serious a problem in low-income nations, development must deliver
widespread improvement in living conditions. It therefore seems useful to define economic
development as a process that produces sustained and widely shared gains in per capita real
GDP.
In recent years, the United Nations has constructed measures incorporating dimensions of
economic development that go beyond the level of per capita GDP. The Human
Development Index (HDI) includes three dimensions—life expectancy, educational
attainment (adult literacy and combined primary, secondary, and post-secondary
enrollment), as well as purchasing-power-adjusted per capita real GDP. The Gender
Development Index (GDI) uses the same variables as the HDI but adjusts them downward to
take into account the extent of gender inequality. A third index, the Human Poverty Index
(HPI), measures human deprivation and includes such indicators as the percentage of people
expected to die before age 40, the percentage of underweight children under age 5, the
percentage of adults who are illiterate, and the percentage of people who live in poverty.
The number reported for the HPI shows the percentage of people in the country who suffer
these deprivations.

Throughout most of history, poverty has been the human condition. For most people life
was, in the words of 17th-century English philosopher Thomas Hobbes, “solitary, poor, nasty,
brutish, and short.” Only within the past 200 years have a handful or so of countries been
able to break the chains of economic deprivation and poverty.
Consider these facts:United Nations Development Program, Human Development Report
2007/2008 (New York: Palgrave Macmillan, 2007).
• Over a third of the world’s people live in countries in which total per capita income in
2005 was less than $610 per year; 85% live in countries in which total per capita
income in 2005 was $2,808 or less. Adjusting for purchasing power, the per capita
income levels would be $2,531 and $7,416, respectively. The latter numbers compare
to per capita income in high-income countries of over $30,000.
• Babies born in poor countries are 16 times more likely to die in their first five years
than are babies born in rich countries.
• About a quarter of the populations of low-income countries is undernourished.
• About 40% (over 50% for women) of the people 15 years old and older in low-income
countries are illiterate.
• Roughly one-fourth of the people in low-income countries do not have access to safe
drinking water.
Clearly, the high standards of living enjoyed by people in the world’s developed economies
are the global exception, not the rule. This chapter looks at the problem of improving the
standard of living in poor countries.
Rich and Poor Nations
The World Bank, an international organization designed to support economic development
by providing financial assistance, advice, and other resources to poor countries, classifies
over 200 countries according to their levels of per capita gross national income. The
categories in its 2008 report, as shown in Table 33.1 "World Incomes, Selected Countries",
were as follows:
• Low-income countries: These countries had per capita incomes of $935 or less in
2007. There were 49 countries in this category. About 20% of the world’s total
population of about 6.5 billion people lived in low-income countries in 2007.
• Middle-income countries: There were 95 countries with per capita incomes of more
than $936 but less than $11,455. Middle-income countries are further subdivided
into lower middle-income and upper middle-income countries. Roughly two-thirds of
the world’s population lived in middle-income countries in 2007. We should note
that the percentage of the world’s population living in middle-income countries
increased dramatically (and the percentage living in low-income countries decreased
dramatically) when China and India moved from being low-income to middle-income
countries.

• High-income countries: There were 65 nations with per capita incomes of $11,456 or
more. Just 16% of the world’s total population lived in high-income countries in 2007.
Countries in the low- and middle-income categories are often called developing countries.
A developing country is thus a country that is not among the high-income nations of the
world.The World Development Report 2006 (New York: Oxford University Press, 2006), xiv,
comments on this usage: “The term developing countries includes low- and middle-income
economies and thus may include economies in transition from central planning, as a matter
of convenience. The term advanced countries may be used as a matter of convenience to
denote high-income economics.” Developing countries are sometimes referred to as third-
world countries.
How does the World Bank compare incomes across countries? The World Bank converts
gross national income (GNI) figures to dollars in two ways. One is to take GNI in a local
currency and convert using the exchange rate, averaged over a three-year period in order to
smooth out the effects of currency fluctuations. This type of comparison can, however, be
misleading. A country could have a relatively high standard of living but, for a variety of
reasons, a low exchange rate. The per capita GNI figure would be quite low; the country
would appear to be poorer than it is.
A better approach to comparing incomes converts currencies to dollars on the basis of
purchasing power. This measure is reported in what are called international dollars. An
international dollar has the same purchasing power as does a U.S. dollar in the United
States. This is reported in the column labeled “2007 International $” in Table 33.1 "World
Incomes, Selected Countries".
Table 33.1 World Incomes, Selected Countries
Gross National Income per Capita, 2007
Low-income countries
Middle-income countries
High-income countries
Countries
200
7 $
2007
Internatio
nal $
Countrie
s
200
7 $
2007
Internatio
nal $
Countri
es
2007
$
2007
Internatio
nal $
Burundi
110
330
India
95
0
2,740
Czech
Republi
c
14,45
0
22,020
Sierra
Leone
260
660
China
2,36
0
5,370
Saudi
Arabia
15,44
0
22,910
Mozambiq
ue
320
690
Thailand
3,40
0
7,880
Israel
21,90
0
25,930

Gross National Income per Capita, 2007
Low-income countries
Middle-income countries
High-income countries
Countries
200
7 $
2007
Internatio
nal $
Countrie
s
200
7 $
2007
Internatio
nal $
Countri
es
2007
$
2007
Internatio
nal $
Banglades
h
470
1,340
Iran
3,47
0
10,800
Greece
29,63
0
32,330
Haiti
560
1,150
Jamaica
3,71
0
6,210
Japan
37,67
0
34,600
Uzbekistan
730
2,430
Costa
Rica
5,56
0
10,700
France
38,50
0
33,600
Vietnam
790
2,550
Brazil
5,91
0
9,370
Canada
39,42
0
35,310
Zambia
800
1,220
Argentin
a
6,05
0
12,990
United
States
46,04
0
45,850
Pakistan
870
2,570
Russian
Federati
on
7,56
0
14,400
Ireland
48,14
0
37,090
Nigeria
930
1,770
Turkey
8,02
0
12,350
Norway
76,45
0
53,320
Average
578
1,494
Average
2,87
2
5,952
Average
37,56
6
36,100
Ave.,
lower
middle
1,88
7
4,543
Ave.,
upper
middle
6,98
7
11,868
Source: World Development Indicators database, World Bank, revised October 17, 2008.

The international dollar estimates typically show higher incomes than estimates based on an
exchange rate conversion. For example, in 2007 Mozambique’s per capita GNI, based on
exchange rates, was $320. Its per capita GNI based the international dollars was $690.
Ranking of countries, both rich and poor, by per capita GNI differs depending on the
measure used. According to the per capita GNI figures in Table 33.1 "World Incomes,
Selected Countries", which convert data in domestic currencies to dollars using exchange
rates, the United States ranked fifteenth of all countries in 2007. Using the international
dollars method, its rank is tenth. China is ranked at 132 when per capita GNI is based on the
exchange rate conversion method but rises to 122 based on the international dollar method.
Characteristics of Low-Income Countries
Low incomes are often associated with other characteristics: severe inequality, poor health
care and education, high unemployment, heavy reliance on agriculture, and rapid population
growth. We will examine most of these problems in this section. Population growth in low-
income nations is examined later in the chapter.
Inequality
Not only are incomes in low-income countries quite low; income distribution is often highly
unequal. Poverty is far more prevalent than per capita numbers suggest, as illustrated by
Lorenz curves, introduced in the chapter on inequality, that show the cumulative shares of
income received by individuals or groups.
Consider Costa Rica and Panama, two Latin American countries with roughly equivalent
levels of per capita GNI (Costa Rica’s was $5,560 and Panama’s $5,510 in 2007). Panama’s
income distribution is comparatively less equal, while Costa Rica’s is far more equal. Figure
33.1 "Poverty and the Distribution of Income: Costa Rica versus Panama" compares the 2003
Lorenz curves for Costa Rica and Panama, the most recent year for which the information
was available. The 20% of the households with the lowest incomes in Costa Rica had twice as
large a share of their country’s total income as did the bottom 20% of households in
Panama. That means Costa Rica’s poor were about twice as well off, in material terms, as
Panama’s poor.
Figure 33.1 Poverty and the Distribution of Income: Costa Rica versus Panama
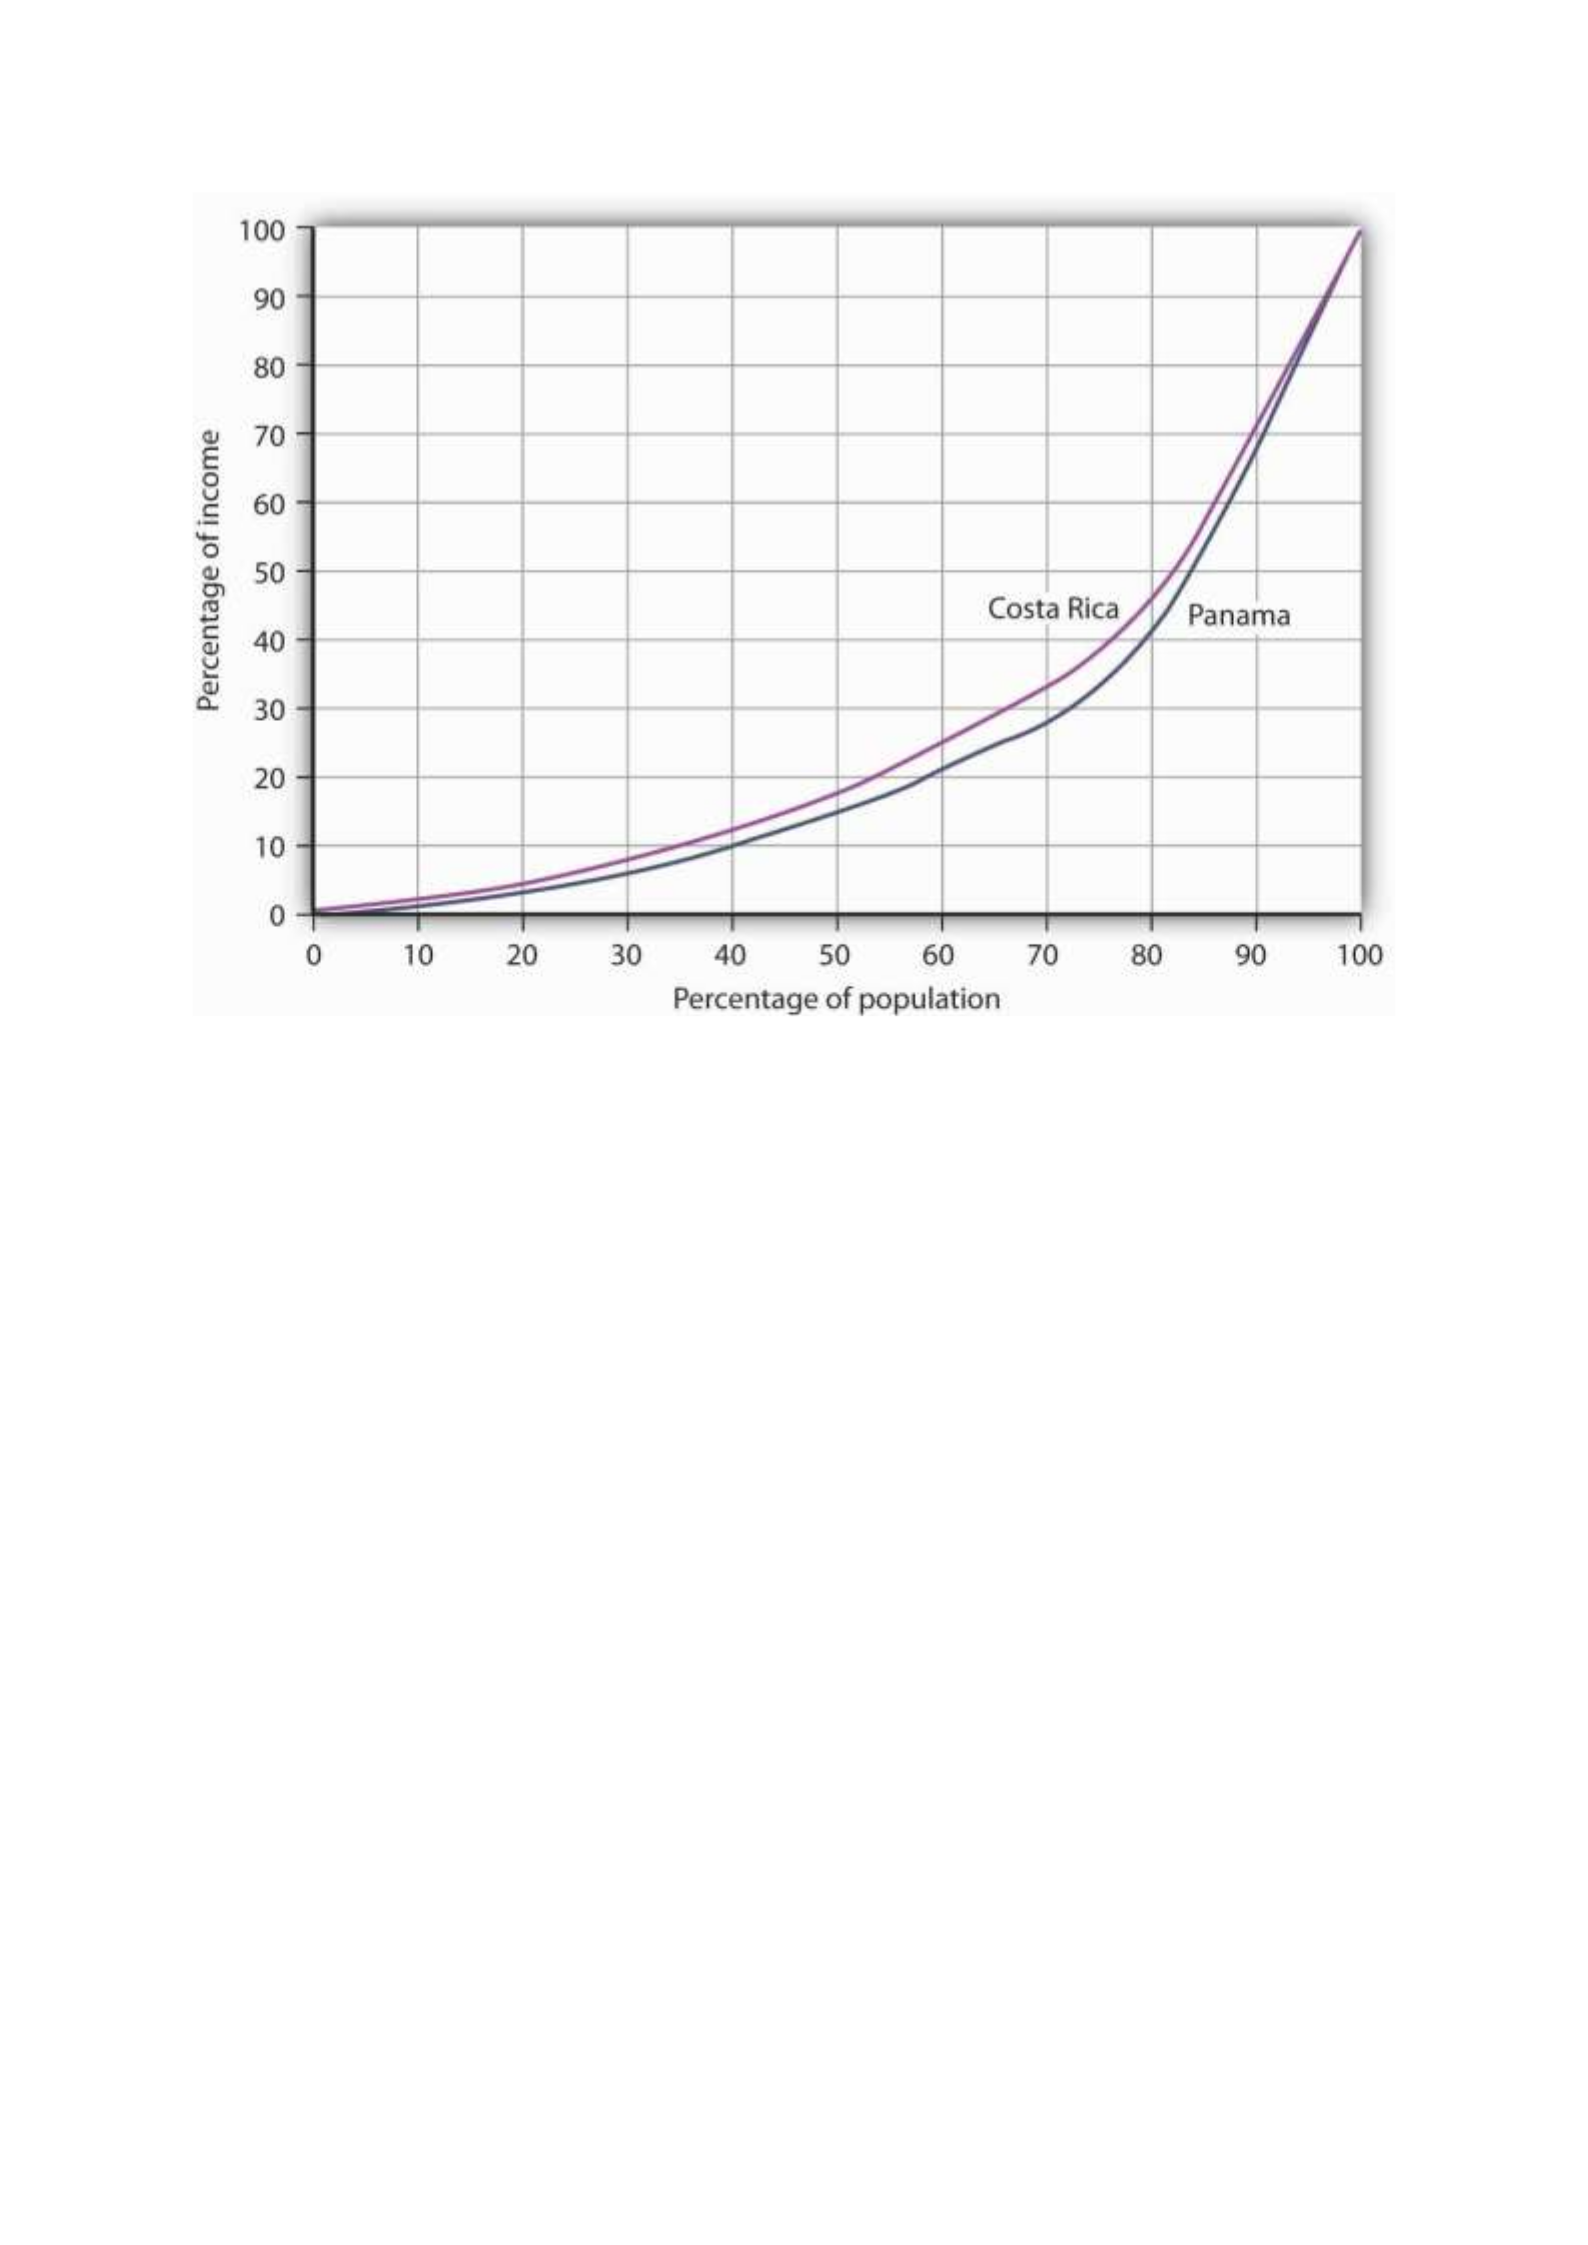
Costa Rica had about the same per capita GNI as Panama in 2003, but Panama’s income
distribution was far more unequal. Panama’s poor had much lower living standards than
Costa Rica’s poor, as suggested by the Lorenz curves for the two nations.
Source: World Development Indicators Online (revised October 17, 2008).
In general, the greater the degree of inequality, the more desperate is the condition of
people at the bottom of an income distribution. Given the high degree of inequality in many
low-income countries, it is very important to look at income distributions when we compare
living standards in different countries.
Health and Education
Poor nations are typically characterized by low levels of human capital. Where health-care
facilities are inadequate, that human capital can be reduced further by disease. Where
educational resources are poor, there will be little progress in improving human capital.
One indicator of poor health care appears on the supply side. Low-income countries have
fewer doctors, relative to their populations, than high-income countries. For example, the
UN estimates that in 2006 about 60% of mothers giving birth in developing countries had
access to a skilled health-care provider (doctor, nurse, or midwife). While that is up from
47% in 1990, the lack of access to a health-care provider may explain much of the difference
in maternal death rates between developed and developing countries: about nine maternal
deaths per 100,000 live births in developed countries compared to about 450 per 100,000 in
developing countries.United Nations, The Millennium Development Goals Report 2008, 27.

We can also see the results of poor health care in statistics on health. Among the world’s
developing countries, the infant mortality rate, which reports deaths in the first year of life,
was 57 per 1,000 live births in 2005. There were six infant deaths per 1,000 live births
among the high-income countries that year.United Nations Development Program, Human
Development Report 2007/2008 (New York: Palgrave Macmillan, 2007), 264.
Another health issue facing the world’s low-income countries is malnutrition. Malnutrition
rates in all developing countries in the 2002 to 2004 period averaged 17%, 35% in the least
developed countries.
Still another issue is the spread of HIV/AIDS. Here there is some progress. The number of
people newly infected declined from 3 million in 2001 to 2.7 million in 2005. Antiretroviral
treatments are also leading to a reduction in deaths from 2.2 million in 2005 to 2 million in
2007. Longer survival means that the number of people living with HIV (from just under 30
million in 2001 to about 33 million in 2007) is rising and most of the people living with HIV
are in Sub-Saharan Africa.United Nations, The Millennium Development Goals Report 2008,
30.
Education in poor and middle-income nations is improving. In 1991, about 80% of children in
developing countries were enrolled in primary schools. In 2005, about 85% were. The
comparable numbers in developed countries are about 95%. Enrollment rates taper off for
high school (about 53% in 2005 in developing countries compared to 91% in developed
countries).United Nations Development Program, Human Development Report
2007/2008 (New York: Palgrave Macmillan, 2007), 272.
Unemployment
Unemployment is pervasive in low-income nations. These nations, already faced with low
levels of potential output, are producing well below their potential. Unemployment rates in
low-income countries vary widely, reaching as high as 15% or more in some countries. If we
count discouraged workers, people who have given up looking for work but who would take
it if it were available, and people who work less than full time, not by choice but because
more work is unavailable, then unemployment in low-income countries soars—often to
more than 30%.
Migration within low-income countries often contributes to unemployment in urban areas.
Factors such as ethnic violence, poverty, and drought often force people to move from rural
areas to cities, where unemployment rates are already high.
Reliance on Agriculture
One of the dominant characteristics of poor nations is the concentration of employment in
agriculture. Another is the very low productivity of that employment. Agriculture in low-
income countries often employs a majority of the population but produces less than one-
third of GDP.

One of the primary forces behind income growth in wealthy countries has been the shift of
labor out of agriculture and into more productive sectors such as manufacturing. This shift is
also occurring in low-income nations but has lagged far behind.
The solution to these problems lies in economic development, to which we turn next.
Economic Development: A Definition
If the problems of low-income nations are pervasive, the development that helps to solve
those problems must transform the very nature of their societies. The late Austrian
economist Joseph Schumpeter described economic development as a revolutionary process.
Whereas economic growth implies quantitative change in production processes that are
already familiar to the society, economic development requires qualitative change in
virtually every aspect of life.
Robert Heilbroner, an economist at the New School for Social Research in New York, has
argued,
“Economic development is political and social change on a wrenching and tearing scale. … It
is a process of institutional birth and institutional death. It is a time when power shifts, often
violently and abruptly, a time when old regimes go under and new ones rise in their places.
And these are not just the unpleasant side effects of development. They are part and parcel
of the process, the very driving force of change itself.”Robert Heilbroner, Between Capitalism
and Socialism (New York: Vintage Books, 1970), 53–54.
Economic development transforms a nation at its core. But what, precisely, is development?
Many definitions follow Heilbroner in noting the massive institutional and cultural changes
economic development involves. But whatever the requirements of development, its
primary characteristics are rising incomes and improving standards of living. That means
output must increase—and it must increase relative to population growth. And because
inequality is so serious a problem in low-income nations, development must deliver
widespread improvement in living conditions. It therefore seems useful to define economic
development as a process that produces sustained and widely shared gains in per capita real
GDP.
In recent years, the United Nations has constructed measures incorporating dimensions of
economic development that go beyond the level of per capita GDP. The Human
Development Index (HDI) includes three dimensions—life expectancy, educational
attainment (adult literacy and combined primary, secondary, and post-secondary
enrollment), as well as purchasing-power-adjusted per capita real GDP. The Gender
Development Index (GDI) uses the same variables as the HDI but adjusts them downward to
take into account the extent of gender inequality. A third index, the Human Poverty Index
(HPI), measures human deprivation and includes such indicators as the percentage of people
expected to die before age 40, the percentage of underweight children under age 5, the
percentage of adults who are illiterate, and the percentage of people who live in poverty.
The number reported for the HPI shows the percentage of people in the country who suffer
these deprivations.

Throughout most of history, poverty has been the human condition. For most people life
was, in the words of 17th-century English philosopher Thomas Hobbes, “solitary, poor, nasty,
brutish, and short.” Only within the past 200 years have a handful or so of countries been
able to break the chains of economic deprivation and poverty.
Consider these facts:United Nations Development Program, Human Development Report
2007/2008 (New York: Palgrave Macmillan, 2007).
• Over a third of the world’s people live in countries in which total per capita income in
2005 was less than $610 per year; 85% live in countries in which total per capita
income in 2005 was $2,808 or less. Adjusting for purchasing power, the per capita
income levels would be $2,531 and $7,416, respectively. The latter numbers compare
to per capita income in high-income countries of over $30,000.
• Babies born in poor countries are 16 times more likely to die in their first five years
than are babies born in rich countries.
• About a quarter of the populations of low-income countries is undernourished.
• About 40% (over 50% for women) of the people 15 years old and older in low-income
countries are illiterate.
• Roughly one-fourth of the people in low-income countries do not have access to safe
drinking water.
Clearly, the high standards of living enjoyed by people in the world’s developed economies
are the global exception, not the rule. This chapter looks at the problem of improving the
standard of living in poor countries.
Rich and Poor Nations
The World Bank, an international organization designed to support economic development
by providing financial assistance, advice, and other resources to poor countries, classifies
over 200 countries according to their levels of per capita gross national income. The
categories in its 2008 report, as shown in Table 33.1 "World Incomes, Selected Countries",
were as follows:
• Low-income countries: These countries had per capita incomes of $935 or less in
2007. There were 49 countries in this category. About 20% of the world’s total
population of about 6.5 billion people lived in low-income countries in 2007.
• Middle-income countries: There were 95 countries with per capita incomes of more
than $936 but less than $11,455. Middle-income countries are further subdivided
into lower middle-income and upper middle-income countries. Roughly two-thirds of
the world’s population lived in middle-income countries in 2007. We should note
that the percentage of the world’s population living in middle-income countries
increased dramatically (and the percentage living in low-income countries decreased
dramatically) when China and India moved from being low-income to middle-income
countries.

• High-income countries: There were 65 nations with per capita incomes of $11,456 or
more. Just 16% of the world’s total population lived in high-income countries in 2007.
Countries in the low- and middle-income categories are often called developing countries.
A developing country is thus a country that is not among the high-income nations of the
world.The World Development Report 2006 (New York: Oxford University Press, 2006), xiv,
comments on this usage: “The term developing countries includes low- and middle-income
economies and thus may include economies in transition from central planning, as a matter
of convenience. The term advanced countries may be used as a matter of convenience to
denote high-income economics.” Developing countries are sometimes referred to as third-
world countries.
How does the World Bank compare incomes across countries? The World Bank converts
gross national income (GNI) figures to dollars in two ways. One is to take GNI in a local
currency and convert using the exchange rate, averaged over a three-year period in order to
smooth out the effects of currency fluctuations. This type of comparison can, however, be
misleading. A country could have a relatively high standard of living but, for a variety of
reasons, a low exchange rate. The per capita GNI figure would be quite low; the country
would appear to be poorer than it is.
A better approach to comparing incomes converts currencies to dollars on the basis of
purchasing power. This measure is reported in what are called international dollars. An
international dollar has the same purchasing power as does a U.S. dollar in the United
States. This is reported in the column labeled “2007 International $” in Table 33.1 "World
Incomes, Selected Countries".
Table 33.1 World Incomes, Selected Countries
Gross National Income per Capita, 2007
Low-income countries
Middle-income countries
High-income countries
Countries
200
7 $
2007
Internatio
nal $
Countrie
s
200
7 $
2007
Internatio
nal $
Countri
es
2007
$
2007
Internatio
nal $
Burundi
110
330
India
95
0
2,740
Czech
Republi
c
14,45
0
22,020
Sierra
Leone
260
660
China
2,36
0
5,370
Saudi
Arabia
15,44
0
22,910
Mozambiq
ue
320
690
Thailand
3,40
0
7,880
Israel
21,90
0
25,930

Gross National Income per Capita, 2007
Low-income countries
Middle-income countries
High-income countries
Countries
200
7 $
2007
Internatio
nal $
Countrie
s
200
7 $
2007
Internatio
nal $
Countri
es
2007
$
2007
Internatio
nal $
Banglades
h
470
1,340
Iran
3,47
0
10,800
Greece
29,63
0
32,330
Haiti
560
1,150
Jamaica
3,71
0
6,210
Japan
37,67
0
34,600
Uzbekistan
730
2,430
Costa
Rica
5,56
0
10,700
France
38,50
0
33,600
Vietnam
790
2,550
Brazil
5,91
0
9,370
Canada
39,42
0
35,310
Zambia
800
1,220
Argentin
a
6,05
0
12,990
United
States
46,04
0
45,850
Pakistan
870
2,570
Russian
Federati
on
7,56
0
14,400
Ireland
48,14
0
37,090
Nigeria
930
1,770
Turkey
8,02
0
12,350
Norway
76,45
0
53,320
Average
578
1,494
Average
2,87
2
5,952
Average
37,56
6
36,100
Ave.,
lower
middle
1,88
7
4,543
Ave.,
upper
middle
6,98
7
11,868
Source: World Development Indicators database, World Bank, revised October 17, 2008.

The international dollar estimates typically show higher incomes than estimates based on an
exchange rate conversion. For example, in 2007 Mozambique’s per capita GNI, based on
exchange rates, was $320. Its per capita GNI based the international dollars was $690.
Ranking of countries, both rich and poor, by per capita GNI differs depending on the
measure used. According to the per capita GNI figures in Table 33.1 "World Incomes,
Selected Countries", which convert data in domestic currencies to dollars using exchange
rates, the United States ranked fifteenth of all countries in 2007. Using the international
dollars method, its rank is tenth. China is ranked at 132 when per capita GNI is based on the
exchange rate conversion method but rises to 122 based on the international dollar method.
Characteristics of Low-Income Countries
Low incomes are often associated with other characteristics: severe inequality, poor health
care and education, high unemployment, heavy reliance on agriculture, and rapid population
growth. We will examine most of these problems in this section. Population growth in low-
income nations is examined later in the chapter.
Inequality
Not only are incomes in low-income countries quite low; income distribution is often highly
unequal. Poverty is far more prevalent than per capita numbers suggest, as illustrated by
Lorenz curves, introduced in the chapter on inequality, that show the cumulative shares of
income received by individuals or groups.
Consider Costa Rica and Panama, two Latin American countries with roughly equivalent
levels of per capita GNI (Costa Rica’s was $5,560 and Panama’s $5,510 in 2007). Panama’s
income distribution is comparatively less equal, while Costa Rica’s is far more equal. Figure
33.1 "Poverty and the Distribution of Income: Costa Rica versus Panama" compares the 2003
Lorenz curves for Costa Rica and Panama, the most recent year for which the information
was available. The 20% of the households with the lowest incomes in Costa Rica had twice as
large a share of their country’s total income as did the bottom 20% of households in
Panama. That means Costa Rica’s poor were about twice as well off, in material terms, as
Panama’s poor.
Figure 33.1 Poverty and the Distribution of Income: Costa Rica versus Panama
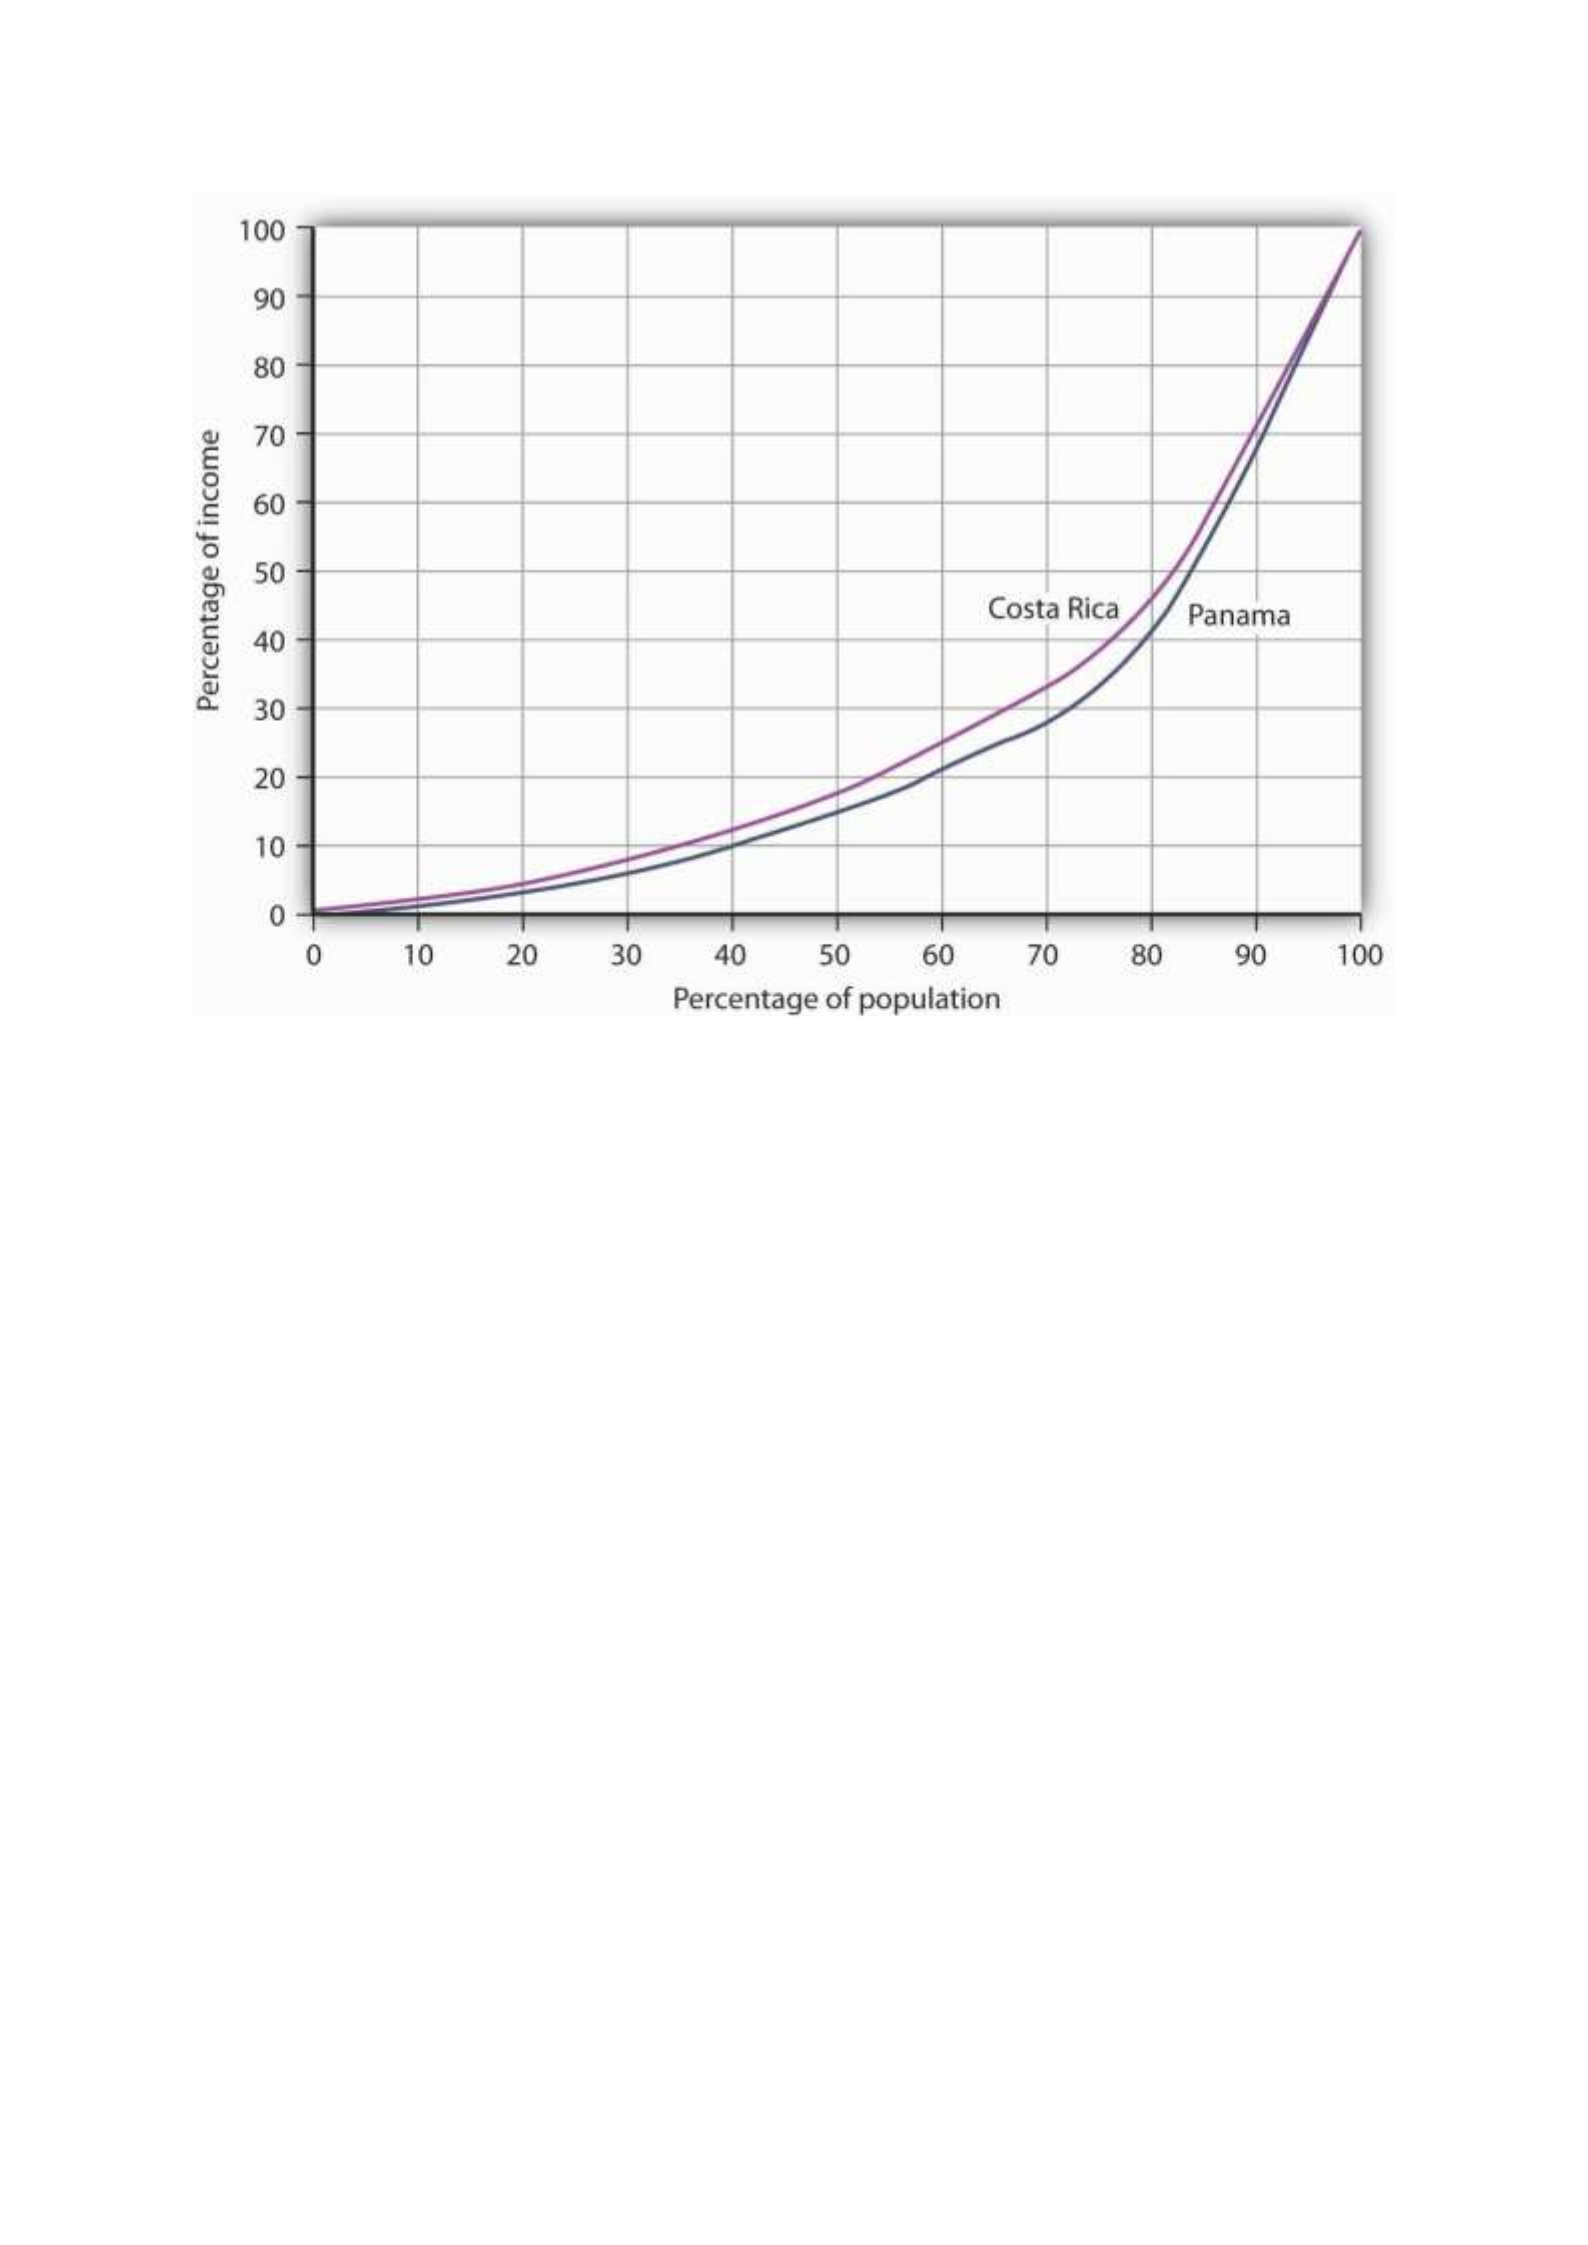
Costa Rica had about the same per capita GNI as Panama in 2003, but Panama’s income
distribution was far more unequal. Panama’s poor had much lower living standards than
Costa Rica’s poor, as suggested by the Lorenz curves for the two nations.
Source: World Development Indicators Online (revised October 17, 2008).
In general, the greater the degree of inequality, the more desperate is the condition of
people at the bottom of an income distribution. Given the high degree of inequality in many
low-income countries, it is very important to look at income distributions when we compare
living standards in different countries.
Health and Education
Poor nations are typically characterized by low levels of human capital. Where health-care
facilities are inadequate, that human capital can be reduced further by disease. Where
educational resources are poor, there will be little progress in improving human capital.
One indicator of poor health care appears on the supply side. Low-income countries have
fewer doctors, relative to their populations, than high-income countries. For example, the
UN estimates that in 2006 about 60% of mothers giving birth in developing countries had
access to a skilled health-care provider (doctor, nurse, or midwife). While that is up from
47% in 1990, the lack of access to a health-care provider may explain much of the difference
in maternal death rates between developed and developing countries: about nine maternal
deaths per 100,000 live births in developed countries compared to about 450 per 100,000 in
developing countries.United Nations, The Millennium Development Goals Report 2008, 27.

We can also see the results of poor health care in statistics on health. Among the world’s
developing countries, the infant mortality rate, which reports deaths in the first year of life,
was 57 per 1,000 live births in 2005. There were six infant deaths per 1,000 live births
among the high-income countries that year.United Nations Development Program, Human
Development Report 2007/2008 (New York: Palgrave Macmillan, 2007), 264.
Another health issue facing the world’s low-income countries is malnutrition. Malnutrition
rates in all developing countries in the 2002 to 2004 period averaged 17%, 35% in the least
developed countries.
Still another issue is the spread of HIV/AIDS. Here there is some progress. The number of
people newly infected declined from 3 million in 2001 to 2.7 million in 2005. Antiretroviral
treatments are also leading to a reduction in deaths from 2.2 million in 2005 to 2 million in
2007. Longer survival means that the number of people living with HIV (from just under 30
million in 2001 to about 33 million in 2007) is rising and most of the people living with HIV
are in Sub-Saharan Africa.United Nations, The Millennium Development Goals Report 2008,
30.
Education in poor and middle-income nations is improving. In 1991, about 80% of children in
developing countries were enrolled in primary schools. In 2005, about 85% were. The
comparable numbers in developed countries are about 95%. Enrollment rates taper off for
high school (about 53% in 2005 in developing countries compared to 91% in developed
countries).United Nations Development Program, Human Development Report
2007/2008 (New York: Palgrave Macmillan, 2007), 272.
Unemployment
Unemployment is pervasive in low-income nations. These nations, already faced with low
levels of potential output, are producing well below their potential. Unemployment rates in
low-income countries vary widely, reaching as high as 15% or more in some countries. If we
count discouraged workers, people who have given up looking for work but who would take
it if it were available, and people who work less than full time, not by choice but because
more work is unavailable, then unemployment in low-income countries soars—often to
more than 30%.
Migration within low-income countries often contributes to unemployment in urban areas.
Factors such as ethnic violence, poverty, and drought often force people to move from rural
areas to cities, where unemployment rates are already high.
Reliance on Agriculture
One of the dominant characteristics of poor nations is the concentration of employment in
agriculture. Another is the very low productivity of that employment. Agriculture in low-
income countries often employs a majority of the population but produces less than one-
third of GDP.

One of the primary forces behind income growth in wealthy countries has been the shift of
labor out of agriculture and into more productive sectors such as manufacturing. This shift is
also occurring in low-income nations but has lagged far behind.
The solution to these problems lies in economic development, to which we turn next.
Economic Development: A Definition
If the problems of low-income nations are pervasive, the development that helps to solve
those problems must transform the very nature of their societies. The late Austrian
economist Joseph Schumpeter described economic development as a revolutionary process.
Whereas economic growth implies quantitative change in production processes that are
already familiar to the society, economic development requires qualitative change in
virtually every aspect of life.
Robert Heilbroner, an economist at the New School for Social Research in New York, has
argued,
“Economic development is political and social change on a wrenching and tearing scale. … It
is a process of institutional birth and institutional death. It is a time when power shifts, often
violently and abruptly, a time when old regimes go under and new ones rise in their places.
And these are not just the unpleasant side effects of development. They are part and parcel
of the process, the very driving force of change itself.”Robert Heilbroner, Between Capitalism
and Socialism (New York: Vintage Books, 1970), 53–54.
Economic development transforms a nation at its core. But what, precisely, is development?
Many definitions follow Heilbroner in noting the massive institutional and cultural changes
economic development involves. But whatever the requirements of development, its
primary characteristics are rising incomes and improving standards of living. That means
output must increase—and it must increase relative to population growth. And because
inequality is so serious a problem in low-income nations, development must deliver
widespread improvement in living conditions. It therefore seems useful to define economic
development as a process that produces sustained and widely shared gains in per capita real
GDP.
In recent years, the United Nations has constructed measures incorporating dimensions of
economic development that go beyond the level of per capita GDP. The Human
Development Index (HDI) includes three dimensions—life expectancy, educational
attainment (adult literacy and combined primary, secondary, and post-secondary
enrollment), as well as purchasing-power-adjusted per capita real GDP. The Gender
Development Index (GDI) uses the same variables as the HDI but adjusts them downward to
take into account the extent of gender inequality. A third index, the Human Poverty Index
(HPI), measures human deprivation and includes such indicators as the percentage of people
expected to die before age 40, the percentage of underweight children under age 5, the
percentage of adults who are illiterate, and the percentage of people who live in poverty.
The number reported for the HPI shows the percentage of people in the country who suffer
these deprivations.

Throughout most of history, poverty has been the human condition. For most people life
was, in the words of 17th-century English philosopher Thomas Hobbes, “solitary, poor, nasty,
brutish, and short.” Only within the past 200 years have a handful or so of countries been
able to break the chains of economic deprivation and poverty.
Consider these facts:United Nations Development Program, Human Development Report
2007/2008 (New York: Palgrave Macmillan, 2007).
• Over a third of the world’s people live in countries in which total per capita income in
2005 was less than $610 per year; 85% live in countries in which total per capita
income in 2005 was $2,808 or less. Adjusting for purchasing power, the per capita
income levels would be $2,531 and $7,416, respectively. The latter numbers compare
to per capita income in high-income countries of over $30,000.
• Babies born in poor countries are 16 times more likely to die in their first five years
than are babies born in rich countries.
• About a quarter of the populations of low-income countries is undernourished.
• About 40% (over 50% for women) of the people 15 years old and older in low-income
countries are illiterate.
• Roughly one-fourth of the people in low-income countries do not have access to safe
drinking water.
Clearly, the high standards of living enjoyed by people in the world’s developed economies
are the global exception, not the rule. This chapter looks at the problem of improving the
standard of living in poor countries.
Rich and Poor Nations
The World Bank, an international organization designed to support economic development
by providing financial assistance, advice, and other resources to poor countries, classifies
over 200 countries according to their levels of per capita gross national income. The
categories in its 2008 report, as shown in Table 33.1 "World Incomes, Selected Countries",
were as follows:
• Low-income countries: These countries had per capita incomes of $935 or less in
2007. There were 49 countries in this category. About 20% of the world’s total
population of about 6.5 billion people lived in low-income countries in 2007.
• Middle-income countries: There were 95 countries with per capita incomes of more
than $936 but less than $11,455. Middle-income countries are further subdivided
into lower middle-income and upper middle-income countries. Roughly two-thirds of
the world’s population lived in middle-income countries in 2007. We should note
that the percentage of the world’s population living in middle-income countries
increased dramatically (and the percentage living in low-income countries decreased
dramatically) when China and India moved from being low-income to middle-income
countries.

• High-income countries: There were 65 nations with per capita incomes of $11,456 or
more. Just 16% of the world’s total population lived in high-income countries in 2007.
Countries in the low- and middle-income categories are often called developing countries.
A developing country is thus a country that is not among the high-income nations of the
world.The World Development Report 2006 (New York: Oxford University Press, 2006), xiv,
comments on this usage: “The term developing countries includes low- and middle-income
economies and thus may include economies in transition from central planning, as a matter
of convenience. The term advanced countries may be used as a matter of convenience to
denote high-income economics.” Developing countries are sometimes referred to as third-
world countries.
How does the World Bank compare incomes across countries? The World Bank converts
gross national income (GNI) figures to dollars in two ways. One is to take GNI in a local
currency and convert using the exchange rate, averaged over a three-year period in order to
smooth out the effects of currency fluctuations. This type of comparison can, however, be
misleading. A country could have a relatively high standard of living but, for a variety of
reasons, a low exchange rate. The per capita GNI figure would be quite low; the country
would appear to be poorer than it is.
A better approach to comparing incomes converts currencies to dollars on the basis of
purchasing power. This measure is reported in what are called international dollars. An
international dollar has the same purchasing power as does a U.S. dollar in the United
States. This is reported in the column labeled “2007 International $” in Table 33.1 "World
Incomes, Selected Countries".
Table 33.1 World Incomes, Selected Countries
Gross National Income per Capita, 2007
Low-income countries
Middle-income countries
High-income countries
Countries
200
7 $
2007
Internatio
nal $
Countrie
s
200
7 $
2007
Internatio
nal $
Countri
es
2007
$
2007
Internatio
nal $
Burundi
110
330
India
95
0
2,740
Czech
Republi
c
14,45
0
22,020
Sierra
Leone
260
660
China
2,36
0
5,370
Saudi
Arabia
15,44
0
22,910
Mozambiq
ue
320
690
Thailand
3,40
0
7,880
Israel
21,90
0
25,930

Gross National Income per Capita, 2007
Low-income countries
Middle-income countries
High-income countries
Countries
200
7 $
2007
Internatio
nal $
Countrie
s
200
7 $
2007
Internatio
nal $
Countri
es
2007
$
2007
Internatio
nal $
Banglades
h
470
1,340
Iran
3,47
0
10,800
Greece
29,63
0
32,330
Haiti
560
1,150
Jamaica
3,71
0
6,210
Japan
37,67
0
34,600
Uzbekistan
730
2,430
Costa
Rica
5,56
0
10,700
France
38,50
0
33,600
Vietnam
790
2,550
Brazil
5,91
0
9,370
Canada
39,42
0
35,310
Zambia
800
1,220
Argentin
a
6,05
0
12,990
United
States
46,04
0
45,850
Pakistan
870
2,570
Russian
Federati
on
7,56
0
14,400
Ireland
48,14
0
37,090
Nigeria
930
1,770
Turkey
8,02
0
12,350
Norway
76,45
0
53,320
Average
578
1,494
Average
2,87
2
5,952
Average
37,56
6
36,100
Ave.,
lower
middle
1,88
7
4,543
Ave.,
upper
middle
6,98
7
11,868
Source: World Development Indicators database, World Bank, revised October 17, 2008.

The international dollar estimates typically show higher incomes than estimates based on an
exchange rate conversion. For example, in 2007 Mozambique’s per capita GNI, based on
exchange rates, was $320. Its per capita GNI based the international dollars was $690.
Ranking of countries, both rich and poor, by per capita GNI differs depending on the
measure used. According to the per capita GNI figures in Table 33.1 "World Incomes,
Selected Countries", which convert data in domestic currencies to dollars using exchange
rates, the United States ranked fifteenth of all countries in 2007. Using the international
dollars method, its rank is tenth. China is ranked at 132 when per capita GNI is based on the
exchange rate conversion method but rises to 122 based on the international dollar method.
Characteristics of Low-Income Countries
Low incomes are often associated with other characteristics: severe inequality, poor health
care and education, high unemployment, heavy reliance on agriculture, and rapid population
growth. We will examine most of these problems in this section. Population growth in low-
income nations is examined later in the chapter.
Inequality
Not only are incomes in low-income countries quite low; income distribution is often highly
unequal. Poverty is far more prevalent than per capita numbers suggest, as illustrated by
Lorenz curves, introduced in the chapter on inequality, that show the cumulative shares of
income received by individuals or groups.
Consider Costa Rica and Panama, two Latin American countries with roughly equivalent
levels of per capita GNI (Costa Rica’s was $5,560 and Panama’s $5,510 in 2007). Panama’s
income distribution is comparatively less equal, while Costa Rica’s is far more equal. Figure
33.1 "Poverty and the Distribution of Income: Costa Rica versus Panama" compares the 2003
Lorenz curves for Costa Rica and Panama, the most recent year for which the information
was available. The 20% of the households with the lowest incomes in Costa Rica had twice as
large a share of their country’s total income as did the bottom 20% of households in
Panama. That means Costa Rica’s poor were about twice as well off, in material terms, as
Panama’s poor.
Figure 33.1 Poverty and the Distribution of Income: Costa Rica versus Panama
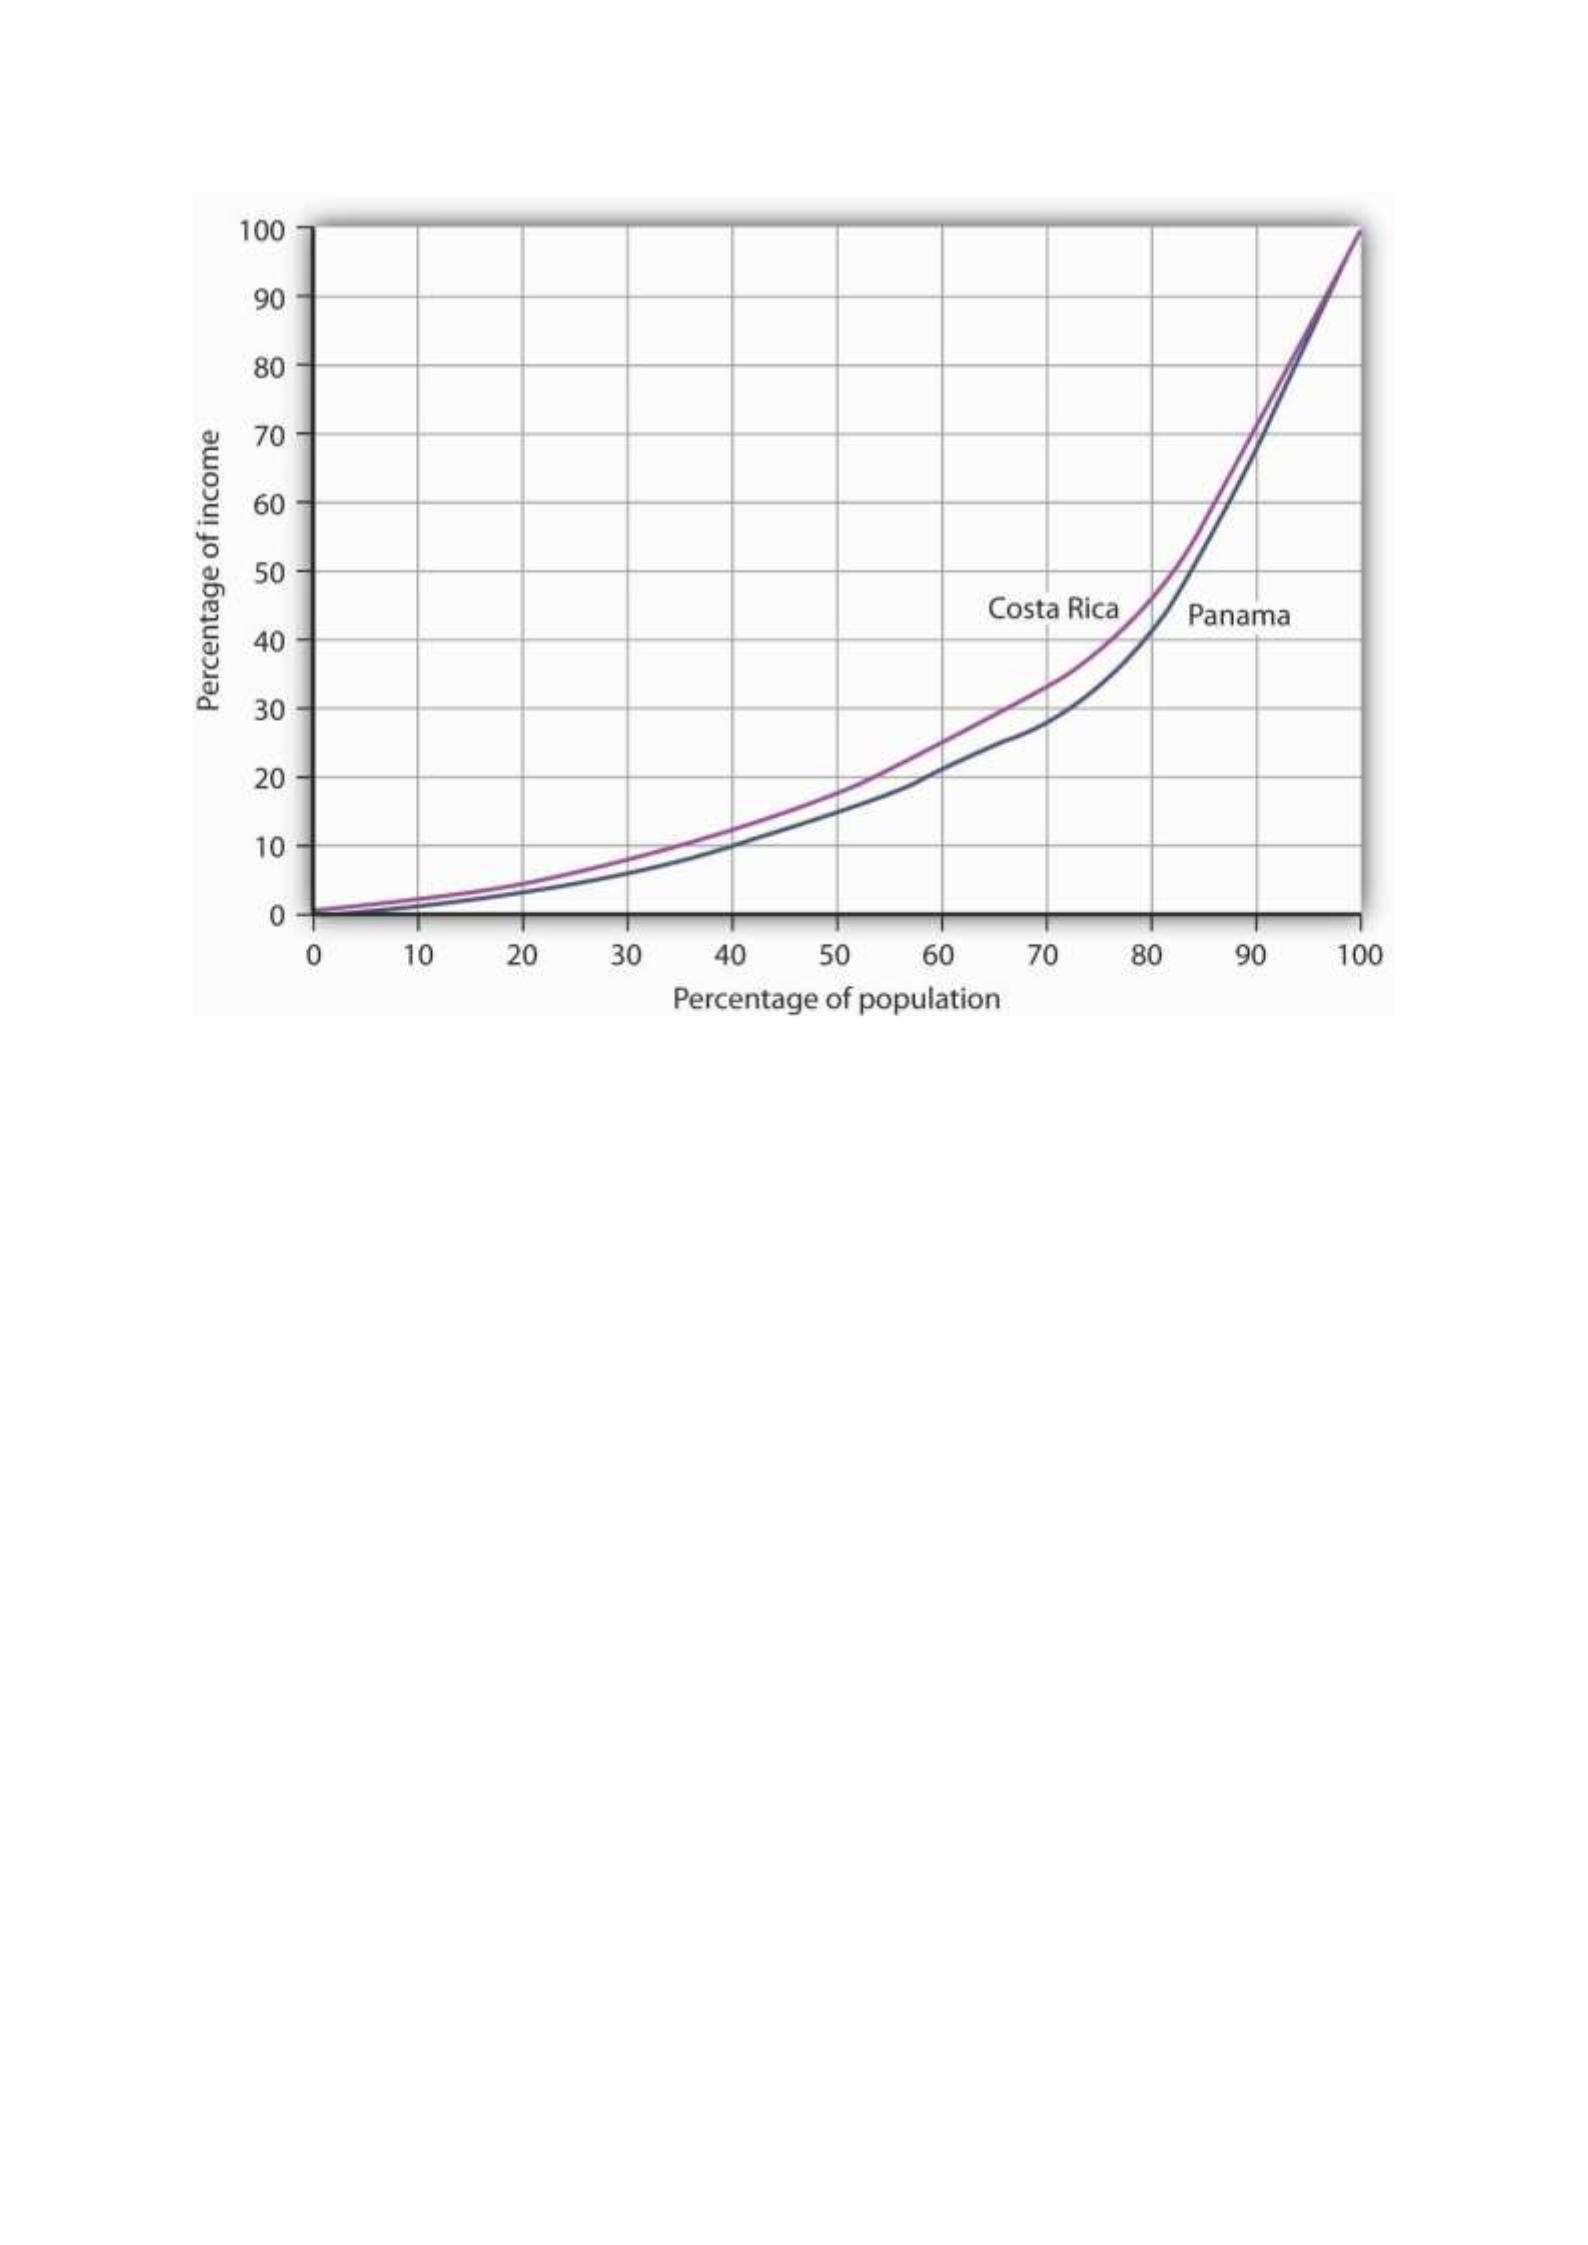
Costa Rica had about the same per capita GNI as Panama in 2003, but Panama’s income
distribution was far more unequal. Panama’s poor had much lower living standards than
Costa Rica’s poor, as suggested by the Lorenz curves for the two nations.
Source: World Development Indicators Online (revised October 17, 2008).
In general, the greater the degree of inequality, the more desperate is the condition of
people at the bottom of an income distribution. Given the high degree of inequality in many
low-income countries, it is very important to look at income distributions when we compare
living standards in different countries.
Health and Education
Poor nations are typically characterized by low levels of human capital. Where health-care
facilities are inadequate, that human capital can be reduced further by disease. Where
educational resources are poor, there will be little progress in improving human capital.
One indicator of poor health care appears on the supply side. Low-income countries have
fewer doctors, relative to their populations, than high-income countries. For example, the
UN estimates that in 2006 about 60% of mothers giving birth in developing countries had
access to a skilled health-care provider (doctor, nurse, or midwife). While that is up from
47% in 1990, the lack of access to a health-care provider may explain much of the difference
in maternal death rates between developed and developing countries: about nine maternal
deaths per 100,000 live births in developed countries compared to about 450 per 100,000 in
developing countries.United Nations, The Millennium Development Goals Report 2008, 27.

We can also see the results of poor health care in statistics on health. Among the world’s
developing countries, the infant mortality rate, which reports deaths in the first year of life,
was 57 per 1,000 live births in 2005. There were six infant deaths per 1,000 live births
among the high-income countries that year.United Nations Development Program, Human
Development Report 2007/2008 (New York: Palgrave Macmillan, 2007), 264.
Another health issue facing the world’s low-income countries is malnutrition. Malnutrition
rates in all developing countries in the 2002 to 2004 period averaged 17%, 35% in the least
developed countries.
Still another issue is the spread of HIV/AIDS. Here there is some progress. The number of
people newly infected declined from 3 million in 2001 to 2.7 million in 2005. Antiretroviral
treatments are also leading to a reduction in deaths from 2.2 million in 2005 to 2 million in
2007. Longer survival means that the number of people living with HIV (from just under 30
million in 2001 to about 33 million in 2007) is rising and most of the people living with HIV
are in Sub-Saharan Africa.United Nations, The Millennium Development Goals Report 2008,
30.
Education in poor and middle-income nations is improving. In 1991, about 80% of children in
developing countries were enrolled in primary schools. In 2005, about 85% were. The
comparable numbers in developed countries are about 95%. Enrollment rates taper off for
high school (about 53% in 2005 in developing countries compared to 91% in developed
countries).United Nations Development Program, Human Development Report
2007/2008 (New York: Palgrave Macmillan, 2007), 272.
Unemployment
Unemployment is pervasive in low-income nations. These nations, already faced with low
levels of potential output, are producing well below their potential. Unemployment rates in
low-income countries vary widely, reaching as high as 15% or more in some countries. If we
count discouraged workers, people who have given up looking for work but who would take
it if it were available, and people who work less than full time, not by choice but because
more work is unavailable, then unemployment in low-income countries soars—often to
more than 30%.
Migration within low-income countries often contributes to unemployment in urban areas.
Factors such as ethnic violence, poverty, and drought often force people to move from rural
areas to cities, where unemployment rates are already high.
Reliance on Agriculture
One of the dominant characteristics of poor nations is the concentration of employment in
agriculture. Another is the very low productivity of that employment. Agriculture in low-
income countries often employs a majority of the population but produces less than one-
third of GDP.

One of the primary forces behind income growth in wealthy countries has been the shift of
labor out of agriculture and into more productive sectors such as manufacturing. This shift is
also occurring in low-income nations but has lagged far behind.
The solution to these problems lies in economic development, to which we turn next.
Economic Development: A Definition
If the problems of low-income nations are pervasive, the development that helps to solve
those problems must transform the very nature of their societies. The late Austrian
economist Joseph Schumpeter described economic development as a revolutionary process.
Whereas economic growth implies quantitative change in production processes that are
already familiar to the society, economic development requires qualitative change in
virtually every aspect of life.
Robert Heilbroner, an economist at the New School for Social Research in New York, has
argued,
“Economic development is political and social change on a wrenching and tearing scale. … It
is a process of institutional birth and institutional death. It is a time when power shifts, often
violently and abruptly, a time when old regimes go under and new ones rise in their places.
And these are not just the unpleasant side effects of development. They are part and parcel
of the process, the very driving force of change itself.”Robert Heilbroner, Between Capitalism
and Socialism (New York: Vintage Books, 1970), 53–54.
Economic development transforms a nation at its core. But what, precisely, is development?
Many definitions follow Heilbroner in noting the massive institutional and cultural changes
economic development involves. But whatever the requirements of development, its
primary characteristics are rising incomes and improving standards of living. That means
output must increase—and it must increase relative to population growth. And because
inequality is so serious a problem in low-income nations, development must deliver
widespread improvement in living conditions. It therefore seems useful to define economic
development as a process that produces sustained and widely shared gains in per capita real
GDP.
In recent years, the United Nations has constructed measures incorporating dimensions of
economic development that go beyond the level of per capita GDP. The Human
Development Index (HDI) includes three dimensions—life expectancy, educational
attainment (adult literacy and combined primary, secondary, and post-secondary
enrollment), as well as purchasing-power-adjusted per capita real GDP. The Gender
Development Index (GDI) uses the same variables as the HDI but adjusts them downward to
take into account the extent of gender inequality. A third index, the Human Poverty Index
(HPI), measures human deprivation and includes such indicators as the percentage of people
expected to die before age 40, the percentage of underweight children under age 5, the
percentage of adults who are illiterate, and the percentage of people who live in poverty.
The number reported for the HPI shows the percentage of people in the country who suffer
these deprivations.

Throughout most of history, poverty has been the human condition. For most people life
was, in the words of 17th-century English philosopher Thomas Hobbes, “solitary, poor, nasty,
brutish, and short.” Only within the past 200 years have a handful or so of countries been
able to break the chains of economic deprivation and poverty.
Consider these facts:United Nations Development Program, Human Development Report
2007/2008 (New York: Palgrave Macmillan, 2007).
• Over a third of the world’s people live in countries in which total per capita income in
2005 was less than $610 per year; 85% live in countries in which total per capita
income in 2005 was $2,808 or less. Adjusting for purchasing power, the per capita
income levels would be $2,531 and $7,416, respectively. The latter numbers compare
to per capita income in high-income countries of over $30,000.
• Babies born in poor countries are 16 times more likely to die in their first five years
than are babies born in rich countries.
• About a quarter of the populations of low-income countries is undernourished.
• About 40% (over 50% for women) of the people 15 years old and older in low-income
countries are illiterate.
• Roughly one-fourth of the people in low-income countries do not have access to safe
drinking water.
Clearly, the high standards of living enjoyed by people in the world’s developed economies
are the global exception, not the rule. This chapter looks at the problem of improving the
standard of living in poor countries.
Rich and Poor Nations
The World Bank, an international organization designed to support economic development
by providing financial assistance, advice, and other resources to poor countries, classifies
over 200 countries according to their levels of per capita gross national income. The
categories in its 2008 report, as shown in Table 33.1 "World Incomes, Selected Countries",
were as follows:
• Low-income countries: These countries had per capita incomes of $935 or less in
2007. There were 49 countries in this category. About 20% of the world’s total
population of about 6.5 billion people lived in low-income countries in 2007.
• Middle-income countries: There were 95 countries with per capita incomes of more
than $936 but less than $11,455. Middle-income countries are further subdivided
into lower middle-income and upper middle-income countries. Roughly two-thirds of
the world’s population lived in middle-income countries in 2007. We should note
that the percentage of the world’s population living in middle-income countries
increased dramatically (and the percentage living in low-income countries decreased
dramatically) when China and India moved from being low-income to middle-income
countries.

• High-income countries: There were 65 nations with per capita incomes of $11,456 or
more. Just 16% of the world’s total population lived in high-income countries in 2007.
Countries in the low- and middle-income categories are often called developing countries.
A developing country is thus a country that is not among the high-income nations of the
world.The World Development Report 2006 (New York: Oxford University Press, 2006), xiv,
comments on this usage: “The term developing countries includes low- and middle-income
economies and thus may include economies in transition from central planning, as a matter
of convenience. The term advanced countries may be used as a matter of convenience to
denote high-income economics.” Developing countries are sometimes referred to as third-
world countries.
How does the World Bank compare incomes across countries? The World Bank converts
gross national income (GNI) figures to dollars in two ways. One is to take GNI in a local
currency and convert using the exchange rate, averaged over a three-year period in order to
smooth out the effects of currency fluctuations. This type of comparison can, however, be
misleading. A country could have a relatively high standard of living but, for a variety of
reasons, a low exchange rate. The per capita GNI figure would be quite low; the country
would appear to be poorer than it is.
A better approach to comparing incomes converts currencies to dollars on the basis of
purchasing power. This measure is reported in what are called international dollars. An
international dollar has the same purchasing power as does a U.S. dollar in the United
States. This is reported in the column labeled “2007 International $” in Table 33.1 "World
Incomes, Selected Countries".
Table 33.1 World Incomes, Selected Countries
Gross National Income per Capita, 2007
Low-income countries
Middle-income countries
High-income countries
Countries
200
7 $
2007
Internatio
nal $
Countrie
s
200
7 $
2007
Internatio
nal $
Countri
es
2007
$
2007
Internatio
nal $
Burundi
110
330
India
95
0
2,740
Czech
Republi
c
14,45
0
22,020
Sierra
Leone
260
660
China
2,36
0
5,370
Saudi
Arabia
15,44
0
22,910
Mozambiq
ue
320
690
Thailand
3,40
0
7,880
Israel
21,90
0
25,930

Gross National Income per Capita, 2007
Low-income countries
Middle-income countries
High-income countries
Countries
200
7 $
2007
Internatio
nal $
Countrie
s
200
7 $
2007
Internatio
nal $
Countri
es
2007
$
2007
Internatio
nal $
Banglades
h
470
1,340
Iran
3,47
0
10,800
Greece
29,63
0
32,330
Haiti
560
1,150
Jamaica
3,71
0
6,210
Japan
37,67
0
34,600
Uzbekistan
730
2,430
Costa
Rica
5,56
0
10,700
France
38,50
0
33,600
Vietnam
790
2,550
Brazil
5,91
0
9,370
Canada
39,42
0
35,310
Zambia
800
1,220
Argentin
a
6,05
0
12,990
United
States
46,04
0
45,850
Pakistan
870
2,570
Russian
Federati
on
7,56
0
14,400
Ireland
48,14
0
37,090
Nigeria
930
1,770
Turkey
8,02
0
12,350
Norway
76,45
0
53,320
Average
578
1,494
Average
2,87
2
5,952
Average
37,56
6
36,100
Ave.,
lower
middle
1,88
7
4,543
Ave.,
upper
middle
6,98
7
11,868
Source: World Development Indicators database, World Bank, revised October 17, 2008.

The international dollar estimates typically show higher incomes than estimates based on an
exchange rate conversion. For example, in 2007 Mozambique’s per capita GNI, based on
exchange rates, was $320. Its per capita GNI based the international dollars was $690.
Ranking of countries, both rich and poor, by per capita GNI differs depending on the
measure used. According to the per capita GNI figures in Table 33.1 "World Incomes,
Selected Countries", which convert data in domestic currencies to dollars using exchange
rates, the United States ranked fifteenth of all countries in 2007. Using the international
dollars method, its rank is tenth. China is ranked at 132 when per capita GNI is based on the
exchange rate conversion method but rises to 122 based on the international dollar method.
Characteristics of Low-Income Countries
Low incomes are often associated with other characteristics: severe inequality, poor health
care and education, high unemployment, heavy reliance on agriculture, and rapid population
growth. We will examine most of these problems in this section. Population growth in low-
income nations is examined later in the chapter.
Inequality
Not only are incomes in low-income countries quite low; income distribution is often highly
unequal. Poverty is far more prevalent than per capita numbers suggest, as illustrated by
Lorenz curves, introduced in the chapter on inequality, that show the cumulative shares of
income received by individuals or groups.
Consider Costa Rica and Panama, two Latin American countries with roughly equivalent
levels of per capita GNI (Costa Rica’s was $5,560 and Panama’s $5,510 in 2007). Panama’s
income distribution is comparatively less equal, while Costa Rica’s is far more equal. Figure
33.1 "Poverty and the Distribution of Income: Costa Rica versus Panama" compares the 2003
Lorenz curves for Costa Rica and Panama, the most recent year for which the information
was available. The 20% of the households with the lowest incomes in Costa Rica had twice as
large a share of their country’s total income as did the bottom 20% of households in
Panama. That means Costa Rica’s poor were about twice as well off, in material terms, as
Panama’s poor.
Figure 33.1 Poverty and the Distribution of Income: Costa Rica versus Panama
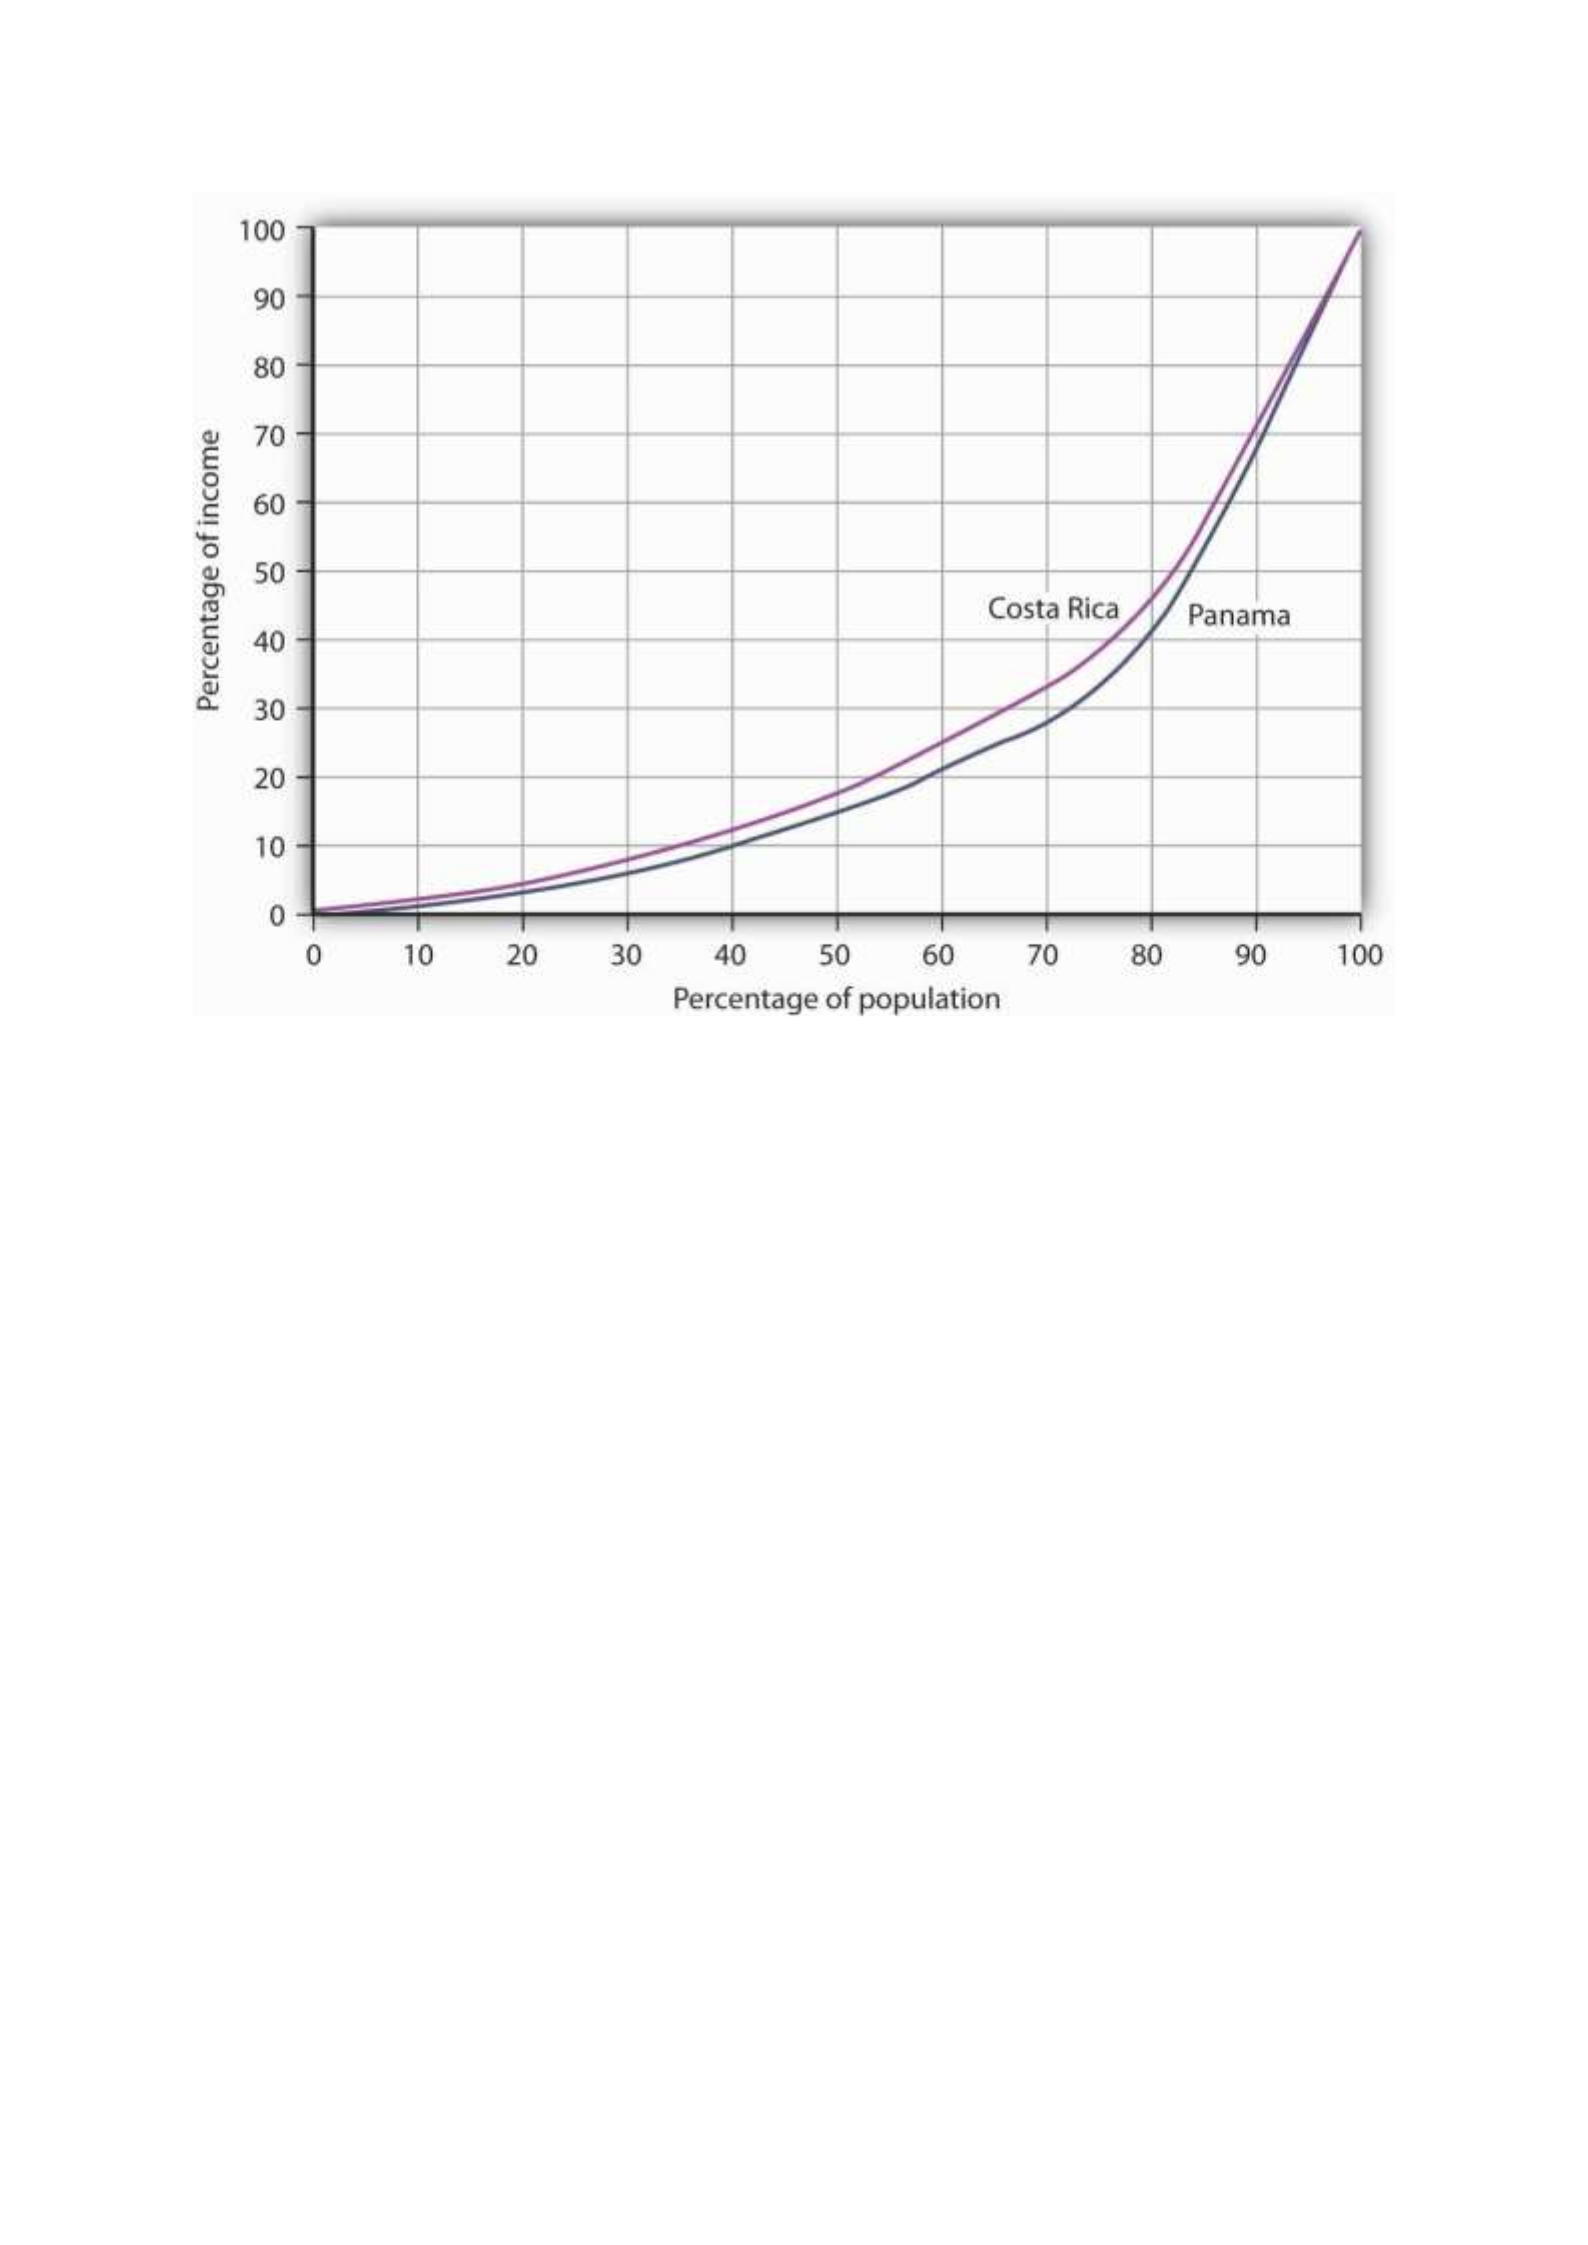
Costa Rica had about the same per capita GNI as Panama in 2003, but Panama’s income
distribution was far more unequal. Panama’s poor had much lower living standards than
Costa Rica’s poor, as suggested by the Lorenz curves for the two nations.
Source: World Development Indicators Online (revised October 17, 2008).
In general, the greater the degree of inequality, the more desperate is the condition of
people at the bottom of an income distribution. Given the high degree of inequality in many
low-income countries, it is very important to look at income distributions when we compare
living standards in different countries.
Health and Education
Poor nations are typically characterized by low levels of human capital. Where health-care
facilities are inadequate, that human capital can be reduced further by disease. Where
educational resources are poor, there will be little progress in improving human capital.
One indicator of poor health care appears on the supply side. Low-income countries have
fewer doctors, relative to their populations, than high-income countries. For example, the
UN estimates that in 2006 about 60% of mothers giving birth in developing countries had
access to a skilled health-care provider (doctor, nurse, or midwife). While that is up from
47% in 1990, the lack of access to a health-care provider may explain much of the difference
in maternal death rates between developed and developing countries: about nine maternal
deaths per 100,000 live births in developed countries compared to about 450 per 100,000 in
developing countries.United Nations, The Millennium Development Goals Report 2008, 27.

We can also see the results of poor health care in statistics on health. Among the world’s
developing countries, the infant mortality rate, which reports deaths in the first year of life,
was 57 per 1,000 live births in 2005. There were six infant deaths per 1,000 live births
among the high-income countries that year.United Nations Development Program, Human
Development Report 2007/2008 (New York: Palgrave Macmillan, 2007), 264.
Another health issue facing the world’s low-income countries is malnutrition. Malnutrition
rates in all developing countries in the 2002 to 2004 period averaged 17%, 35% in the least
developed countries.
Still another issue is the spread of HIV/AIDS. Here there is some progress. The number of
people newly infected declined from 3 million in 2001 to 2.7 million in 2005. Antiretroviral
treatments are also leading to a reduction in deaths from 2.2 million in 2005 to 2 million in
2007. Longer survival means that the number of people living with HIV (from just under 30
million in 2001 to about 33 million in 2007) is rising and most of the people living with HIV
are in Sub-Saharan Africa.United Nations, The Millennium Development Goals Report 2008,
30.
Education in poor and middle-income nations is improving. In 1991, about 80% of children in
developing countries were enrolled in primary schools. In 2005, about 85% were. The
comparable numbers in developed countries are about 95%. Enrollment rates taper off for
high school (about 53% in 2005 in developing countries compared to 91% in developed
countries).United Nations Development Program, Human Development Report
2007/2008 (New York: Palgrave Macmillan, 2007), 272.
Unemployment
Unemployment is pervasive in low-income nations. These nations, already faced with low
levels of potential output, are producing well below their potential. Unemployment rates in
low-income countries vary widely, reaching as high as 15% or more in some countries. If we
count discouraged workers, people who have given up looking for work but who would take
it if it were available, and people who work less than full time, not by choice but because
more work is unavailable, then unemployment in low-income countries soars—often to
more than 30%.
Migration within low-income countries often contributes to unemployment in urban areas.
Factors such as ethnic violence, poverty, and drought often force people to move from rural
areas to cities, where unemployment rates are already high.
Reliance on Agriculture
One of the dominant characteristics of poor nations is the concentration of employment in
agriculture. Another is the very low productivity of that employment. Agriculture in low-
income countries often employs a majority of the population but produces less than one-
third of GDP.

One of the primary forces behind income growth in wealthy countries has been the shift of
labor out of agriculture and into more productive sectors such as manufacturing. This shift is
also occurring in low-income nations but has lagged far behind.
The solution to these problems lies in economic development, to which we turn next.
Economic Development: A Definition
If the problems of low-income nations are pervasive, the development that helps to solve
those problems must transform the very nature of their societies. The late Austrian
economist Joseph Schumpeter described economic development as a revolutionary process.
Whereas economic growth implies quantitative change in production processes that are
already familiar to the society, economic development requires qualitative change in
virtually every aspect of life.
Robert Heilbroner, an economist at the New School for Social Research in New York, has
argued,
“Economic development is political and social change on a wrenching and tearing scale. … It
is a process of institutional birth and institutional death. It is a time when power shifts, often
violently and abruptly, a time when old regimes go under and new ones rise in their places.
And these are not just the unpleasant side effects of development. They are part and parcel
of the process, the very driving force of change itself.”Robert Heilbroner, Between Capitalism
and Socialism (New York: Vintage Books, 1970), 53–54.
Economic development transforms a nation at its core. But what, precisely, is development?
Many definitions follow Heilbroner in noting the massive institutional and cultural changes
economic development involves. But whatever the requirements of development, its
primary characteristics are rising incomes and improving standards of living. That means
output must increase—and it must increase relative to population growth. And because
inequality is so serious a problem in low-income nations, development must deliver
widespread improvement in living conditions. It therefore seems useful to define economic
development as a process that produces sustained and widely shared gains in per capita real
GDP.
In recent years, the United Nations has constructed measures incorporating dimensions of
economic development that go beyond the level of per capita GDP. The Human
Development Index (HDI) includes three dimensions—life expectancy, educational
attainment (adult literacy and combined primary, secondary, and post-secondary
enrollment), as well as purchasing-power-adjusted per capita real GDP. The Gender
Development Index (GDI) uses the same variables as the HDI but adjusts them downward to
take into account the extent of gender inequality. A third index, the Human Poverty Index
(HPI), measures human deprivation and includes such indicators as the percentage of people
expected to die before age 40, the percentage of underweight children under age 5, the
percentage of adults who are illiterate, and the percentage of people who live in poverty.
The number reported for the HPI shows the percentage of people in the country who suffer
these deprivations.

Throughout most of history, poverty has been the human condition. For most people life
was, in the words of 17th-century English philosopher Thomas Hobbes, “solitary, poor, nasty,
brutish, and short.” Only within the past 200 years have a handful or so of countries been
able to break the chains of economic deprivation and poverty.
Consider these facts:United Nations Development Program, Human Development Report
2007/2008 (New York: Palgrave Macmillan, 2007).
• Over a third of the world’s people live in countries in which total per capita income in
2005 was less than $610 per year; 85% live in countries in which total per capita
income in 2005 was $2,808 or less. Adjusting for purchasing power, the per capita
income levels would be $2,531 and $7,416, respectively. The latter numbers compare
to per capita income in high-income countries of over $30,000.
• Babies born in poor countries are 16 times more likely to die in their first five years
than are babies born in rich countries.
• About a quarter of the populations of low-income countries is undernourished.
• About 40% (over 50% for women) of the people 15 years old and older in low-income
countries are illiterate.
• Roughly one-fourth of the people in low-income countries do not have access to safe
drinking water.
Clearly, the high standards of living enjoyed by people in the world’s developed economies
are the global exception, not the rule. This chapter looks at the problem of improving the
standard of living in poor countries.
Rich and Poor Nations
The World Bank, an international organization designed to support economic development
by providing financial assistance, advice, and other resources to poor countries, classifies
over 200 countries according to their levels of per capita gross national income. The
categories in its 2008 report, as shown in Table 33.1 "World Incomes, Selected Countries",
were as follows:
• Low-income countries: These countries had per capita incomes of $935 or less in
2007. There were 49 countries in this category. About 20% of the world’s total
population of about 6.5 billion people lived in low-income countries in 2007.
• Middle-income countries: There were 95 countries with per capita incomes of more
than $936 but less than $11,455. Middle-income countries are further subdivided
into lower middle-income and upper middle-income countries. Roughly two-thirds of
the world’s population lived in middle-income countries in 2007. We should note
that the percentage of the world’s population living in middle-income countries
increased dramatically (and the percentage living in low-income countries decreased
dramatically) when China and India moved from being low-income to middle-income
countries.

• High-income countries: There were 65 nations with per capita incomes of $11,456 or
more. Just 16% of the world’s total population lived in high-income countries in 2007.
Countries in the low- and middle-income categories are often called developing countries.
A developing country is thus a country that is not among the high-income nations of the
world.The World Development Report 2006 (New York: Oxford University Press, 2006), xiv,
comments on this usage: “The term developing countries includes low- and middle-income
economies and thus may include economies in transition from central planning, as a matter
of convenience. The term advanced countries may be used as a matter of convenience to
denote high-income economics.” Developing countries are sometimes referred to as third-
world countries.
How does the World Bank compare incomes across countries? The World Bank converts
gross national income (GNI) figures to dollars in two ways. One is to take GNI in a local
currency and convert using the exchange rate, averaged over a three-year period in order to
smooth out the effects of currency fluctuations. This type of comparison can, however, be
misleading. A country could have a relatively high standard of living but, for a variety of
reasons, a low exchange rate. The per capita GNI figure would be quite low; the country
would appear to be poorer than it is.
A better approach to comparing incomes converts currencies to dollars on the basis of
purchasing power. This measure is reported in what are called international dollars. An
international dollar has the same purchasing power as does a U.S. dollar in the United
States. This is reported in the column labeled “2007 International $” in Table 33.1 "World
Incomes, Selected Countries".
Table 33.1 World Incomes, Selected Countries
Gross National Income per Capita, 2007
Low-income countries
Middle-income countries
High-income countries
Countries
200
7 $
2007
Internatio
nal $
Countrie
s
200
7 $
2007
Internatio
nal $
Countri
es
2007
$
2007
Internatio
nal $
Burundi
110
330
India
95
0
2,740
Czech
Republi
c
14,45
0
22,020
Sierra
Leone
260
660
China
2,36
0
5,370
Saudi
Arabia
15,44
0
22,910
Mozambiq
ue
320
690
Thailand
3,40
0
7,880
Israel
21,90
0
25,930

Gross National Income per Capita, 2007
Low-income countries
Middle-income countries
High-income countries
Countries
200
7 $
2007
Internatio
nal $
Countrie
s
200
7 $
2007
Internatio
nal $
Countri
es
2007
$
2007
Internatio
nal $
Banglades
h
470
1,340
Iran
3,47
0
10,800
Greece
29,63
0
32,330
Haiti
560
1,150
Jamaica
3,71
0
6,210
Japan
37,67
0
34,600
Uzbekistan
730
2,430
Costa
Rica
5,56
0
10,700
France
38,50
0
33,600
Vietnam
790
2,550
Brazil
5,91
0
9,370
Canada
39,42
0
35,310
Zambia
800
1,220
Argentin
a
6,05
0
12,990
United
States
46,04
0
45,850
Pakistan
870
2,570
Russian
Federati
on
7,56
0
14,400
Ireland
48,14
0
37,090
Nigeria
930
1,770
Turkey
8,02
0
12,350
Norway
76,45
0
53,320
Average
578
1,494
Average
2,87
2
5,952
Average
37,56
6
36,100
Ave.,
lower
middle
1,88
7
4,543
Ave.,
upper
middle
6,98
7
11,868
Source: World Development Indicators database, World Bank, revised October 17, 2008.

The international dollar estimates typically show higher incomes than estimates based on an
exchange rate conversion. For example, in 2007 Mozambique’s per capita GNI, based on
exchange rates, was $320. Its per capita GNI based the international dollars was $690.
Ranking of countries, both rich and poor, by per capita GNI differs depending on the
measure used. According to the per capita GNI figures in Table 33.1 "World Incomes,
Selected Countries", which convert data in domestic currencies to dollars using exchange
rates, the United States ranked fifteenth of all countries in 2007. Using the international
dollars method, its rank is tenth. China is ranked at 132 when per capita GNI is based on the
exchange rate conversion method but rises to 122 based on the international dollar method.
Characteristics of Low-Income Countries
Low incomes are often associated with other characteristics: severe inequality, poor health
care and education, high unemployment, heavy reliance on agriculture, and rapid population
growth. We will examine most of these problems in this section. Population growth in low-
income nations is examined later in the chapter.
Inequality
Not only are incomes in low-income countries quite low; income distribution is often highly
unequal. Poverty is far more prevalent than per capita numbers suggest, as illustrated by
Lorenz curves, introduced in the chapter on inequality, that show the cumulative shares of
income received by individuals or groups.
Consider Costa Rica and Panama, two Latin American countries with roughly equivalent
levels of per capita GNI (Costa Rica’s was $5,560 and Panama’s $5,510 in 2007). Panama’s
income distribution is comparatively less equal, while Costa Rica’s is far more equal. Figure
33.1 "Poverty and the Distribution of Income: Costa Rica versus Panama" compares the 2003
Lorenz curves for Costa Rica and Panama, the most recent year for which the information
was available. The 20% of the households with the lowest incomes in Costa Rica had twice as
large a share of their country’s total income as did the bottom 20% of households in
Panama. That means Costa Rica’s poor were about twice as well off, in material terms, as
Panama’s poor.
Figure 33.1 Poverty and the Distribution of Income: Costa Rica versus Panama
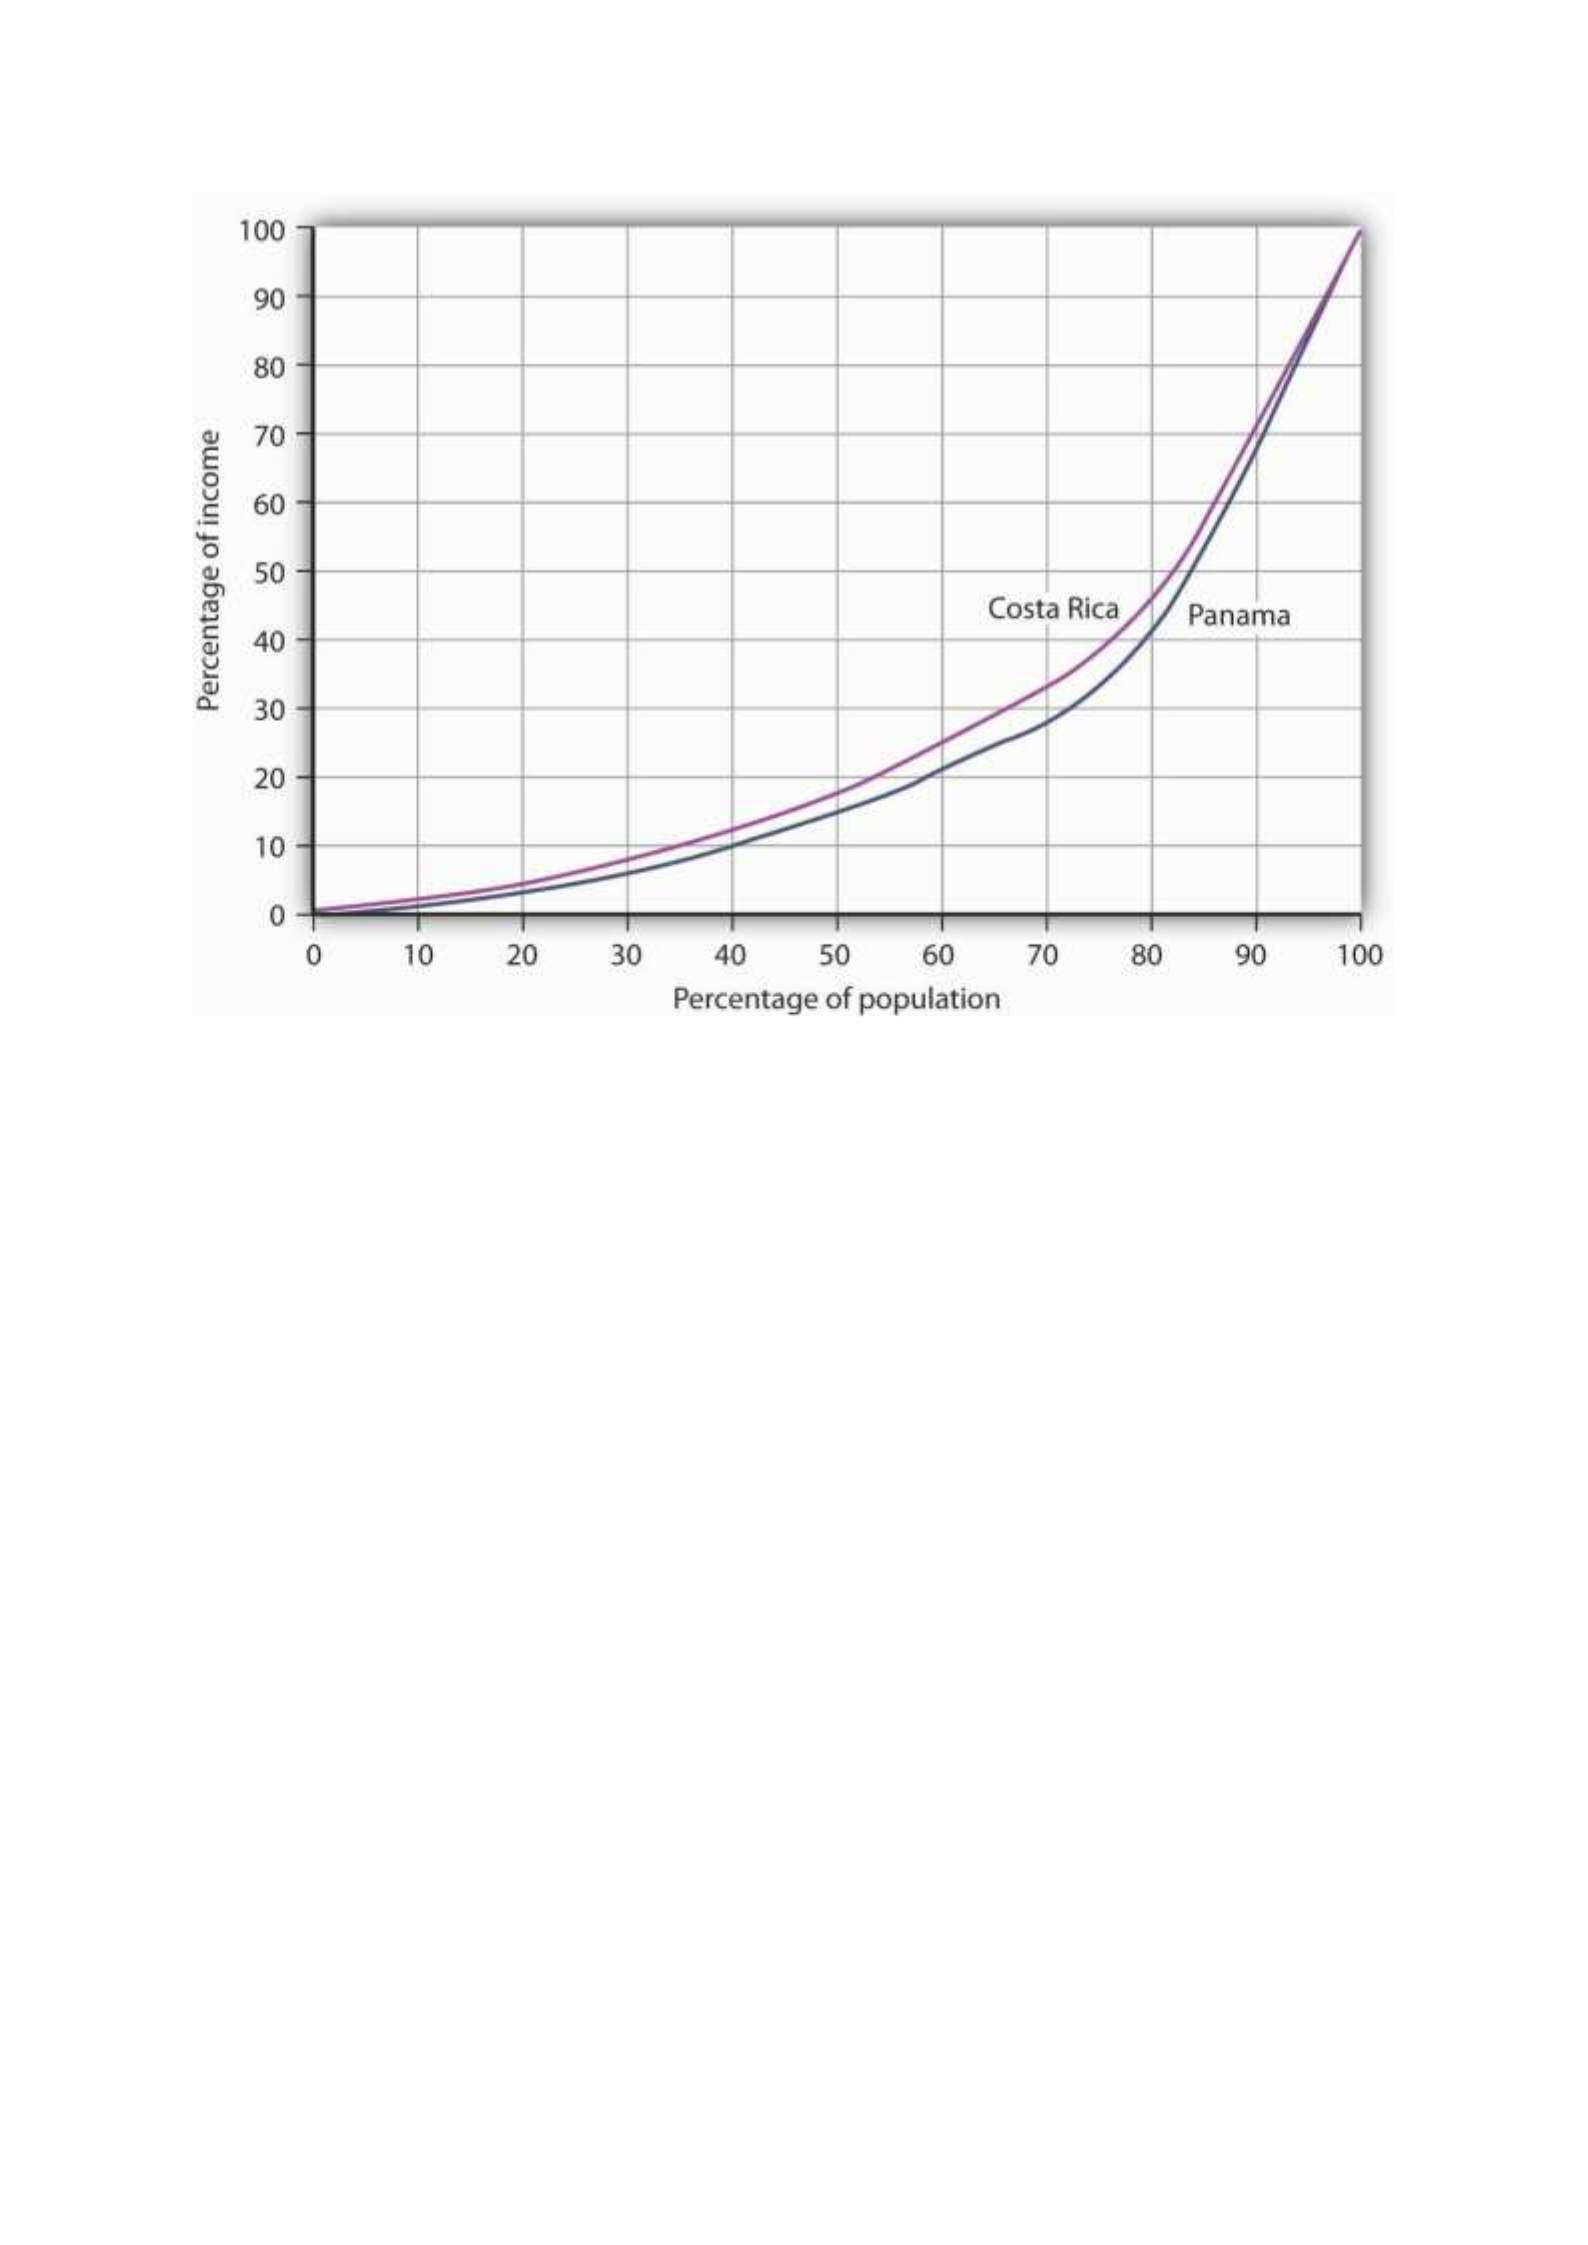
Costa Rica had about the same per capita GNI as Panama in 2003, but Panama’s income
distribution was far more unequal. Panama’s poor had much lower living standards than
Costa Rica’s poor, as suggested by the Lorenz curves for the two nations.
Source: World Development Indicators Online (revised October 17, 2008).
In general, the greater the degree of inequality, the more desperate is the condition of
people at the bottom of an income distribution. Given the high degree of inequality in many
low-income countries, it is very important to look at income distributions when we compare
living standards in different countries.
Health and Education
Poor nations are typically characterized by low levels of human capital. Where health-care
facilities are inadequate, that human capital can be reduced further by disease. Where
educational resources are poor, there will be little progress in improving human capital.
One indicator of poor health care appears on the supply side. Low-income countries have
fewer doctors, relative to their populations, than high-income countries. For example, the
UN estimates that in 2006 about 60% of mothers giving birth in developing countries had
access to a skilled health-care provider (doctor, nurse, or midwife). While that is up from
47% in 1990, the lack of access to a health-care provider may explain much of the difference
in maternal death rates between developed and developing countries: about nine maternal
deaths per 100,000 live births in developed countries compared to about 450 per 100,000 in
developing countries.United Nations, The Millennium Development Goals Report 2008, 27.

We can also see the results of poor health care in statistics on health. Among the world’s
developing countries, the infant mortality rate, which reports deaths in the first year of life,
was 57 per 1,000 live births in 2005. There were six infant deaths per 1,000 live births
among the high-income countries that year.United Nations Development Program, Human
Development Report 2007/2008 (New York: Palgrave Macmillan, 2007), 264.
Another health issue facing the world’s low-income countries is malnutrition. Malnutrition
rates in all developing countries in the 2002 to 2004 period averaged 17%, 35% in the least
developed countries.
Still another issue is the spread of HIV/AIDS. Here there is some progress. The number of
people newly infected declined from 3 million in 2001 to 2.7 million in 2005. Antiretroviral
treatments are also leading to a reduction in deaths from 2.2 million in 2005 to 2 million in
2007. Longer survival means that the number of people living with HIV (from just under 30
million in 2001 to about 33 million in 2007) is rising and most of the people living with HIV
are in Sub-Saharan Africa.United Nations, The Millennium Development Goals Report 2008,
30.
Education in poor and middle-income nations is improving. In 1991, about 80% of children in
developing countries were enrolled in primary schools. In 2005, about 85% were. The
comparable numbers in developed countries are about 95%. Enrollment rates taper off for
high school (about 53% in 2005 in developing countries compared to 91% in developed
countries).United Nations Development Program, Human Development Report
2007/2008 (New York: Palgrave Macmillan, 2007), 272.
Unemployment
Unemployment is pervasive in low-income nations. These nations, already faced with low
levels of potential output, are producing well below their potential. Unemployment rates in
low-income countries vary widely, reaching as high as 15% or more in some countries. If we
count discouraged workers, people who have given up looking for work but who would take
it if it were available, and people who work less than full time, not by choice but because
more work is unavailable, then unemployment in low-income countries soars—often to
more than 30%.
Migration within low-income countries often contributes to unemployment in urban areas.
Factors such as ethnic violence, poverty, and drought often force people to move from rural
areas to cities, where unemployment rates are already high.
Reliance on Agriculture
One of the dominant characteristics of poor nations is the concentration of employment in
agriculture. Another is the very low productivity of that employment. Agriculture in low-
income countries often employs a majority of the population but produces less than one-
third of GDP.

One of the primary forces behind income growth in wealthy countries has been the shift of
labor out of agriculture and into more productive sectors such as manufacturing. This shift is
also occurring in low-income nations but has lagged far behind.
The solution to these problems lies in economic development, to which we turn next.
Economic Development: A Definition
If the problems of low-income nations are pervasive, the development that helps to solve
those problems must transform the very nature of their societies. The late Austrian
economist Joseph Schumpeter described economic development as a revolutionary process.
Whereas economic growth implies quantitative change in production processes that are
already familiar to the society, economic development requires qualitative change in
virtually every aspect of life.
Robert Heilbroner, an economist at the New School for Social Research in New York, has
argued,
“Economic development is political and social change on a wrenching and tearing scale. … It
is a process of institutional birth and institutional death. It is a time when power shifts, often
violently and abruptly, a time when old regimes go under and new ones rise in their places.
And these are not just the unpleasant side effects of development. They are part and parcel
of the process, the very driving force of change itself.”Robert Heilbroner, Between Capitalism
and Socialism (New York: Vintage Books, 1970), 53–54.
Economic development transforms a nation at its core. But what, precisely, is development?
Many definitions follow Heilbroner in noting the massive institutional and cultural changes
economic development involves. But whatever the requirements of development, its
primary characteristics are rising incomes and improving standards of living. That means
output must increase—and it must increase relative to population growth. And because
inequality is so serious a problem in low-income nations, development must deliver
widespread improvement in living conditions. It therefore seems useful to define economic
development as a process that produces sustained and widely shared gains in per capita real
GDP.
In recent years, the United Nations has constructed measures incorporating dimensions of
economic development that go beyond the level of per capita GDP. The Human
Development Index (HDI) includes three dimensions—life expectancy, educational
attainment (adult literacy and combined primary, secondary, and post-secondary
enrollment), as well as purchasing-power-adjusted per capita real GDP. The Gender
Development Index (GDI) uses the same variables as the HDI but adjusts them downward to
take into account the extent of gender inequality. A third index, the Human Poverty Index
(HPI), measures human deprivation and includes such indicators as the percentage of people
expected to die before age 40, the percentage of underweight children under age 5, the
percentage of adults who are illiterate, and the percentage of people who live in poverty.
The number reported for the HPI shows the percentage of people in the country who suffer
these deprivations.

The international dollar estimates typically show higher incomes than estimates based on an
exchange rate conversion. For example, in 2007 Mozambique’s per capita GNI, based on
exchange rates, was $320. Its per capita GNI based the international dollars was $690.
Ranking of countries, both rich and poor, by per capita GNI differs depending on the
measure used. According to the per capita GNI figures in Table 33.1 "World Incomes,
Selected Countries", which convert data in domestic currencies to dollars using exchange
rates, the United States ranked fifteenth of all countries in 2007. Using the international
dollars method, its rank is tenth. China is ranked at 132 when per capita GNI is based on the
exchange rate conversion method but rises to 122 based on the international dollar method.
Characteristics of Low-Income Countries
Low incomes are often associated with other characteristics: severe inequality, poor health
care and education, high unemployment, heavy reliance on agriculture, and rapid population
growth. We will examine most of these problems in this section. Population growth in low-
income nations is examined later in the chapter.
Inequality
Not only are incomes in low-income countries quite low; income distribution is often highly
unequal. Poverty is far more prevalent than per capita numbers suggest, as illustrated by
Lorenz curves, introduced in the chapter on inequality, that show the cumulative shares of
income received by individuals or groups.
Consider Costa Rica and Panama, two Latin American countries with roughly equivalent
levels of per capita GNI (Costa Rica’s was $5,560 and Panama’s $5,510 in 2007). Panama’s
income distribution is comparatively less equal, while Costa Rica’s is far more equal. Figure
33.1 "Poverty and the Distribution of Income: Costa Rica versus Panama" compares the 2003
Lorenz curves for Costa Rica and Panama, the most recent year for which the information
was available. The 20% of the households with the lowest incomes in Costa Rica had twice as
large a share of their country’s total income as did the bottom 20% of households in
Panama. That means Costa Rica’s poor were about twice as well off, in material terms, as
Panama’s poor.
Figure 33.1 Poverty and the Distribution of Income: Costa Rica versus Panama
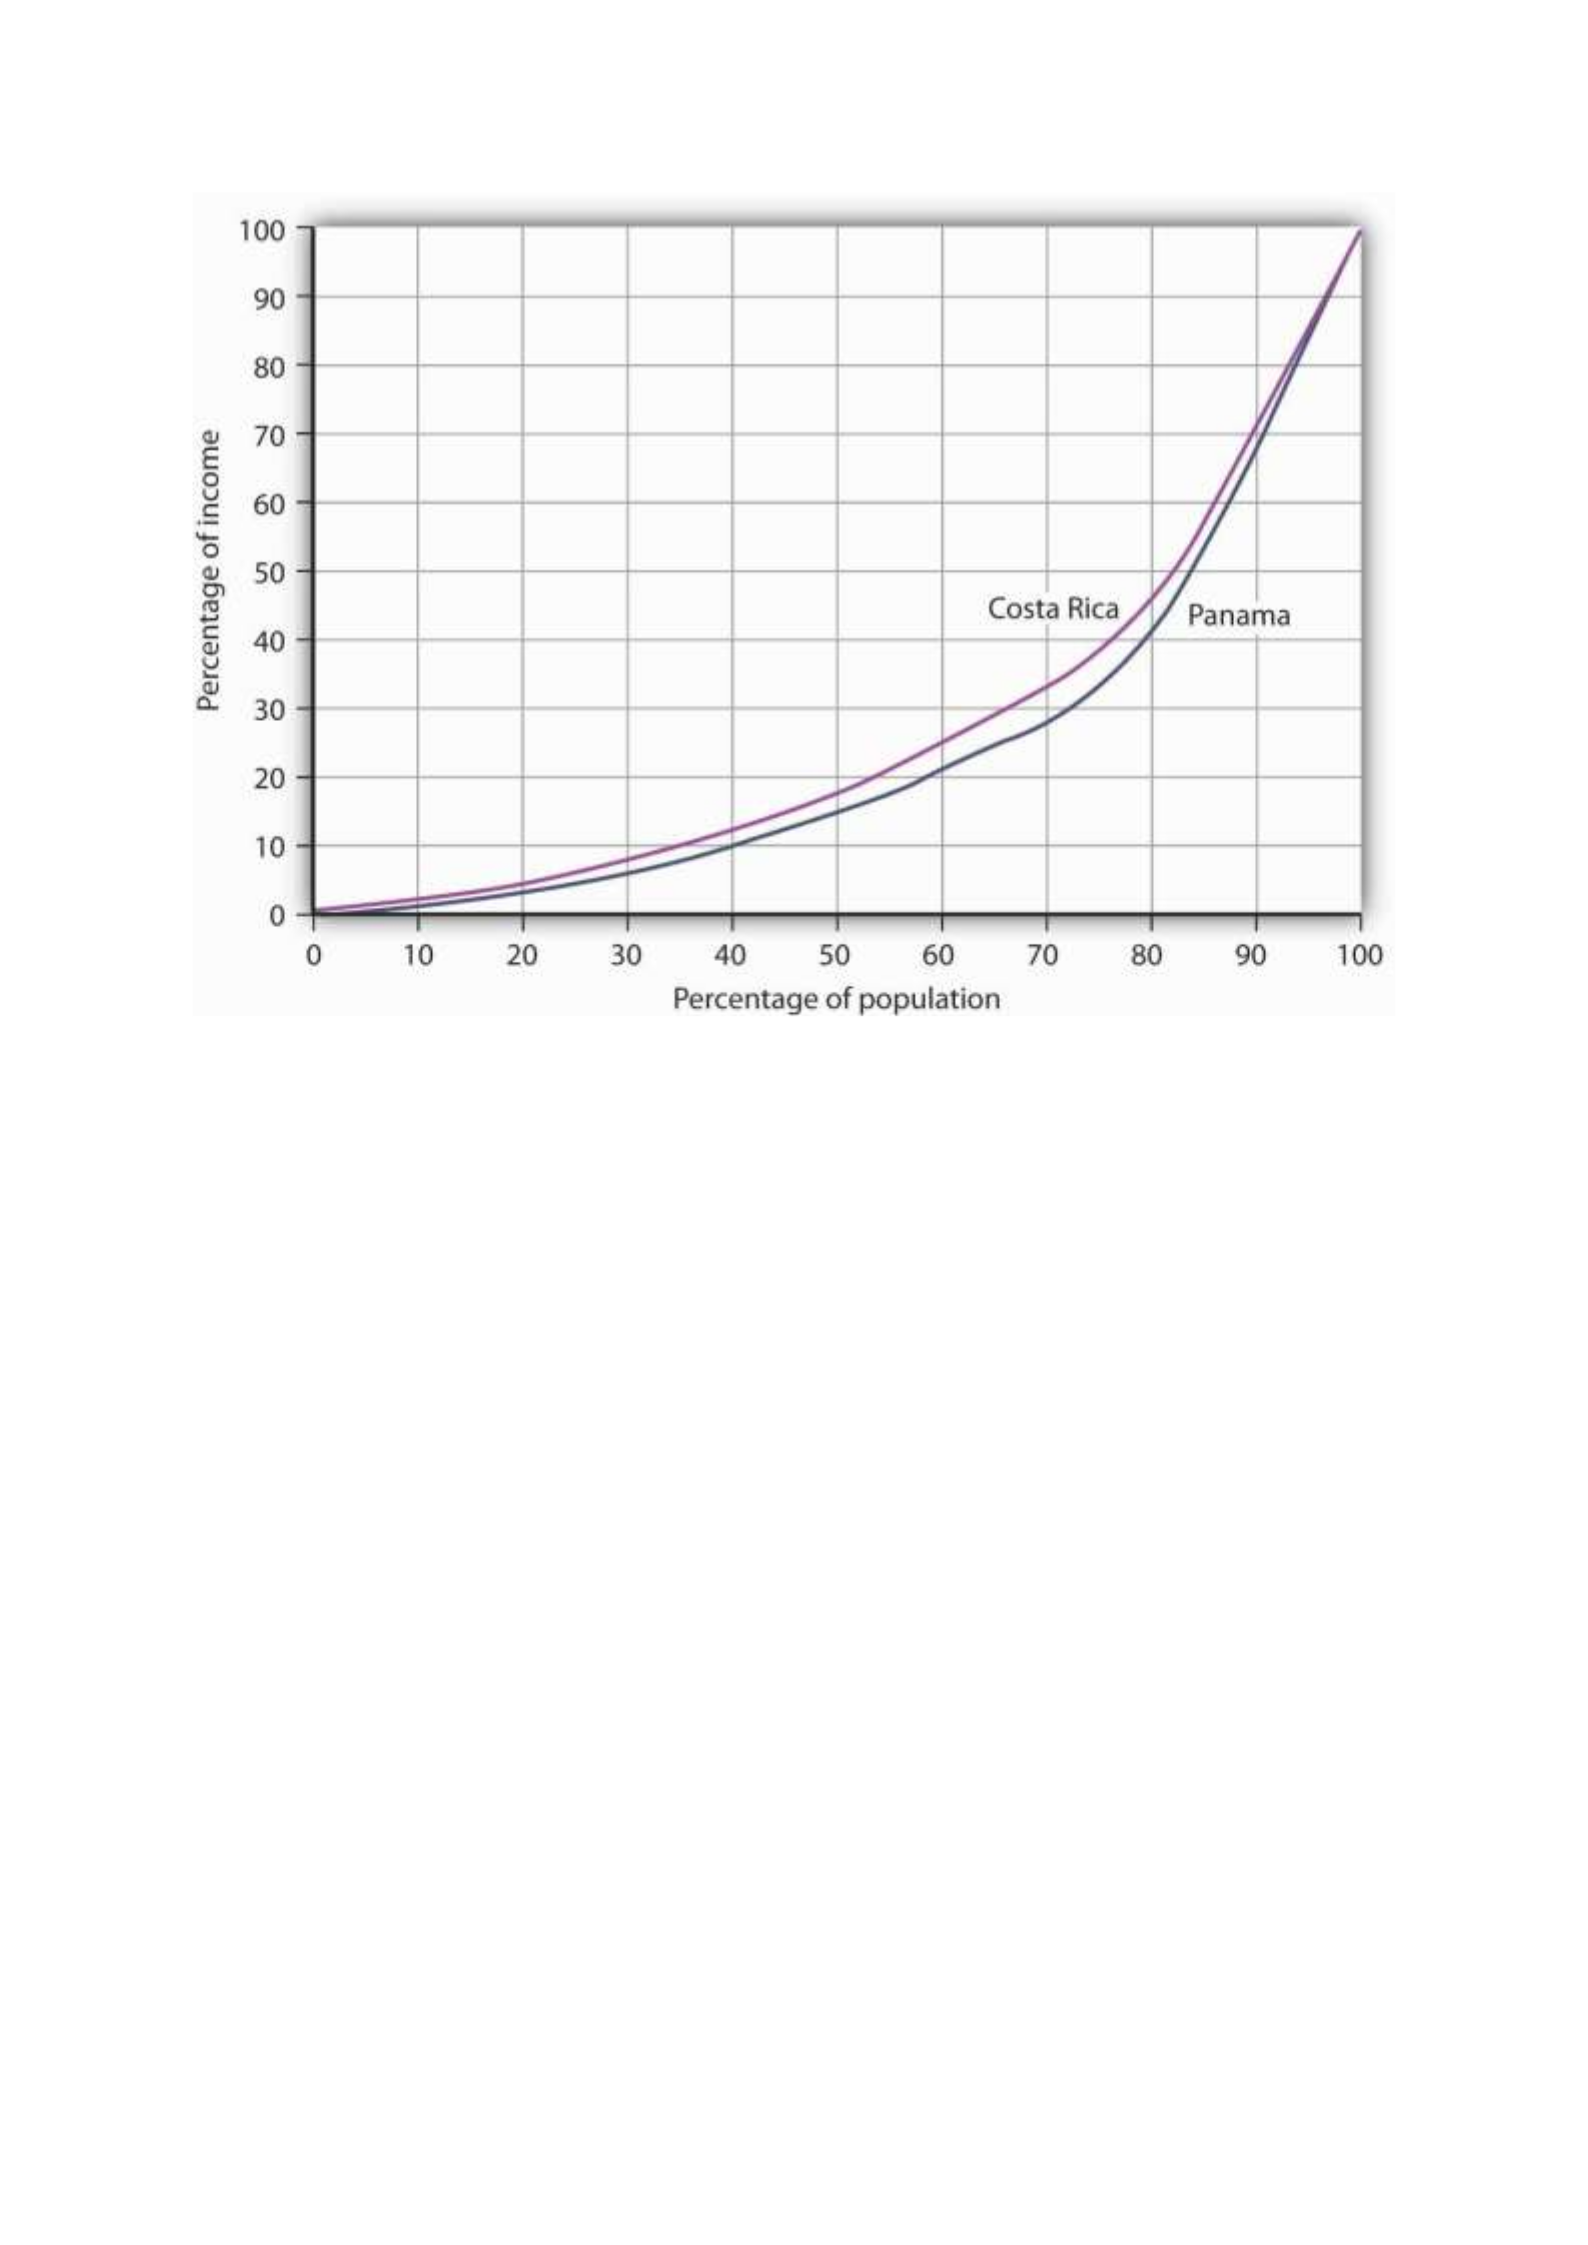
Costa Rica had about the same per capita GNI as Panama in 2003, but Panama’s income
distribution was far more unequal. Panama’s poor had much lower living standards than
Costa Rica’s poor, as suggested by the Lorenz curves for the two nations.
Source: World Development Indicators Online (revised October 17, 2008).
In general, the greater the degree of inequality, the more desperate is the condition of
people at the bottom of an income distribution. Given the high degree of inequality in many
low-income countries, it is very important to look at income distributions when we compare
living standards in different countries.
Health and Education
Poor nations are typically characterized by low levels of human capital. Where health-care
facilities are inadequate, that human capital can be reduced further by disease. Where
educational resources are poor, there will be little progress in improving human capital.
One indicator of poor health care appears on the supply side. Low-income countries have
fewer doctors, relative to their populations, than high-income countries. For example, the
UN estimates that in 2006 about 60% of mothers giving birth in developing countries had
access to a skilled health-care provider (doctor, nurse, or midwife). While that is up from
47% in 1990, the lack of access to a health-care provider may explain much of the difference
in maternal death rates between developed and developing countries: about nine maternal
deaths per 100,000 live births in developed countries compared to about 450 per 100,000 in
developing countries.United Nations, The Millennium Development Goals Report 2008, 27.

We can also see the results of poor health care in statistics on health. Among the world’s
developing countries, the infant mortality rate, which reports deaths in the first year of life,
was 57 per 1,000 live births in 2005. There were six infant deaths per 1,000 live births
among the high-income countries that year.United Nations Development Program, Human
Development Report 2007/2008 (New York: Palgrave Macmillan, 2007), 264.
Another health issue facing the world’s low-income countries is malnutrition. Malnutrition
rates in all developing countries in the 2002 to 2004 period averaged 17%, 35% in the least
developed countries.
Still another issue is the spread of HIV/AIDS. Here there is some progress. The number of
people newly infected declined from 3 million in 2001 to 2.7 million in 2005. Antiretroviral
treatments are also leading to a reduction in deaths from 2.2 million in 2005 to 2 million in
2007. Longer survival means that the number of people living with HIV (from just under 30
million in 2001 to about 33 million in 2007) is rising and most of the people living with HIV
are in Sub-Saharan Africa.United Nations, The Millennium Development Goals Report 2008,
30.
Education in poor and middle-income nations is improving. In 1991, about 80% of children in
developing countries were enrolled in primary schools. In 2005, about 85% were. The
comparable numbers in developed countries are about 95%. Enrollment rates taper off for
high school (about 53% in 2005 in developing countries compared to 91% in developed
countries).United Nations Development Program, Human Development Report
2007/2008 (New York: Palgrave Macmillan, 2007), 272.
Unemployment
Unemployment is pervasive in low-income nations. These nations, already faced with low
levels of potential output, are producing well below their potential. Unemployment rates in
low-income countries vary widely, reaching as high as 15% or more in some countries. If we
count discouraged workers, people who have given up looking for work but who would take
it if it were available, and people who work less than full time, not by choice but because
more work is unavailable, then unemployment in low-income countries soars—often to
more than 30%.
Migration within low-income countries often contributes to unemployment in urban areas.
Factors such as ethnic violence, poverty, and drought often force people to move from rural
areas to cities, where unemployment rates are already high.
Reliance on Agriculture
One of the dominant characteristics of poor nations is the concentration of employment in
agriculture. Another is the very low productivity of that employment. Agriculture in low-
income countries often employs a majority of the population but produces less than one-
third of GDP.

One of the primary forces behind income growth in wealthy countries has been the shift of
labor out of agriculture and into more productive sectors such as manufacturing. This shift is
also occurring in low-income nations but has lagged far behind.
The solution to these problems lies in economic development, to which we turn next.
Economic Development: A Definition
If the problems of low-income nations are pervasive, the development that helps to solve
those problems must transform the very nature of their societies. The late Austrian
economist Joseph Schumpeter described economic development as a revolutionary process.
Whereas economic growth implies quantitative change in production processes that are
already familiar to the society, economic development requires qualitative change in
virtually every aspect of life.
Robert Heilbroner, an economist at the New School for Social Research in New York, has
argued,
“Economic development is political and social change on a wrenching and tearing scale. … It
is a process of institutional birth and institutional death. It is a time when power shifts, often
violently and abruptly, a time when old regimes go under and new ones rise in their places.
And these are not just the unpleasant side effects of development. They are part and parcel
of the process, the very driving force of change itself.”Robert Heilbroner, Between Capitalism
and Socialism (New York: Vintage Books, 1970), 53–54.
Economic development transforms a nation at its core. But what, precisely, is development?
Many definitions follow Heilbroner in noting the massive institutional and cultural changes
economic development involves. But whatever the requirements of development, its
primary characteristics are rising incomes and improving standards of living. That means
output must increase—and it must increase relative to population growth. And because
inequality is so serious a problem in low-income nations, development must deliver
widespread improvement in living conditions. It therefore seems useful to define economic
development as a process that produces sustained and widely shared gains in per capita real
GDP.
In recent years, the United Nations has constructed measures incorporating dimensions of
economic development that go beyond the level of per capita GDP. The Human
Development Index (HDI) includes three dimensions—life expectancy, educational
attainment (adult literacy and combined primary, secondary, and post-secondary
enrollment), as well as purchasing-power-adjusted per capita real GDP. The Gender
Development Index (GDI) uses the same variables as the HDI but adjusts them downward to
take into account the extent of gender inequality. A third index, the Human Poverty Index
(HPI), measures human deprivation and includes such indicators as the percentage of people
expected to die before age 40, the percentage of underweight children under age 5, the
percentage of adults who are illiterate, and the percentage of people who live in poverty.
The number reported for the HPI shows the percentage of people in the country who suffer
these deprivations.

Throughout most of history, poverty has been the human condition. For most people life
was, in the words of 17th-century English philosopher Thomas Hobbes, “solitary, poor, nasty,
brutish, and short.” Only within the past 200 years have a handful or so of countries been
able to break the chains of economic deprivation and poverty.
Consider these facts:United Nations Development Program, Human Development Report
2007/2008 (New York: Palgrave Macmillan, 2007).
• Over a third of the world’s people live in countries in which total per capita income in
2005 was less than $610 per year; 85% live in countries in which total per capita
income in 2005 was $2,808 or less. Adjusting for purchasing power, the per capita
income levels would be $2,531 and $7,416, respectively. The latter numbers compare
to per capita income in high-income countries of over $30,000.
• Babies born in poor countries are 16 times more likely to die in their first five years
than are babies born in rich countries.
• About a quarter of the populations of low-income countries is undernourished.
• About 40% (over 50% for women) of the people 15 years old and older in low-income
countries are illiterate.
• Roughly one-fourth of the people in low-income countries do not have access to safe
drinking water.
Clearly, the high standards of living enjoyed by people in the world’s developed economies
are the global exception, not the rule. This chapter looks at the problem of improving the
standard of living in poor countries.
Rich and Poor Nations
The World Bank, an international organization designed to support economic development
by providing financial assistance, advice, and other resources to poor countries, classifies
over 200 countries according to their levels of per capita gross national income. The
categories in its 2008 report, as shown in Table 33.1 "World Incomes, Selected Countries",
were as follows:
• Low-income countries: These countries had per capita incomes of $935 or less in
2007. There were 49 countries in this category. About 20% of the world’s total
population of about 6.5 billion people lived in low-income countries in 2007.
• Middle-income countries: There were 95 countries with per capita incomes of more
than $936 but less than $11,455. Middle-income countries are further subdivided
into lower middle-income and upper middle-income countries. Roughly two-thirds of
the world’s population lived in middle-income countries in 2007. We should note
that the percentage of the world’s population living in middle-income countries
increased dramatically (and the percentage living in low-income countries decreased
dramatically) when China and India moved from being low-income to middle-income
countries.

• High-income countries: There were 65 nations with per capita incomes of $11,456 or
more. Just 16% of the world’s total population lived in high-income countries in 2007.
Countries in the low- and middle-income categories are often called developing countries.
A developing country is thus a country that is not among the high-income nations of the
world.The World Development Report 2006 (New York: Oxford University Press, 2006), xiv,
comments on this usage: “The term developing countries includes low- and middle-income
economies and thus may include economies in transition from central planning, as a matter
of convenience. The term advanced countries may be used as a matter of convenience to
denote high-income economics.” Developing countries are sometimes referred to as third-
world countries.
How does the World Bank compare incomes across countries? The World Bank converts
gross national income (GNI) figures to dollars in two ways. One is to take GNI in a local
currency and convert using the exchange rate, averaged over a three-year period in order to
smooth out the effects of currency fluctuations. This type of comparison can, however, be
misleading. A country could have a relatively high standard of living but, for a variety of
reasons, a low exchange rate. The per capita GNI figure would be quite low; the country
would appear to be poorer than it is.
A better approach to comparing incomes converts currencies to dollars on the basis of
purchasing power. This measure is reported in what are called international dollars. An
international dollar has the same purchasing power as does a U.S. dollar in the United
States. This is reported in the column labeled “2007 International $” in Table 33.1 "World
Incomes, Selected Countries".
Table 33.1 World Incomes, Selected Countries
Gross National Income per Capita, 2007
Low-income countries
Middle-income countries
High-income countries
Countries
200
7 $
2007
Internatio
nal $
Countrie
s
200
7 $
2007
Internatio
nal $
Countri
es
2007
$
2007
Internatio
nal $
Burundi
110
330
India
95
0
2,740
Czech
Republi
c
14,45
0
22,020
Sierra
Leone
260
660
China
2,36
0
5,370
Saudi
Arabia
15,44
0
22,910
Mozambiq
ue
320
690
Thailand
3,40
0
7,880
Israel
21,90
0
25,930

Gross National Income per Capita, 2007
Low-income countries
Middle-income countries
High-income countries
Countries
200
7 $
2007
Internatio
nal $
Countrie
s
200
7 $
2007
Internatio
nal $
Countri
es
2007
$
2007
Internatio
nal $
Banglades
h
470
1,340
Iran
3,47
0
10,800
Greece
29,63
0
32,330
Haiti
560
1,150
Jamaica
3,71
0
6,210
Japan
37,67
0
34,600
Uzbekistan
730
2,430
Costa
Rica
5,56
0
10,700
France
38,50
0
33,600
Vietnam
790
2,550
Brazil
5,91
0
9,370
Canada
39,42
0
35,310
Zambia
800
1,220
Argentin
a
6,05
0
12,990
United
States
46,04
0
45,850
Pakistan
870
2,570
Russian
Federati
on
7,56
0
14,400
Ireland
48,14
0
37,090
Nigeria
930
1,770
Turkey
8,02
0
12,350
Norway
76,45
0
53,320
Average
578
1,494
Average
2,87
2
5,952
Average
37,56
6
36,100
Ave.,
lower
middle
1,88
7
4,543
Ave.,
upper
middle
6,98
7
11,868
Source: World Development Indicators database, World Bank, revised October 17, 2008.

The international dollar estimates typically show higher incomes than estimates based on an
exchange rate conversion. For example, in 2007 Mozambique’s per capita GNI, based on
exchange rates, was $320. Its per capita GNI based the international dollars was $690.
Ranking of countries, both rich and poor, by per capita GNI differs depending on the
measure used. According to the per capita GNI figures in Table 33.1 "World Incomes,
Selected Countries", which convert data in domestic currencies to dollars using exchange
rates, the United States ranked fifteenth of all countries in 2007. Using the international
dollars method, its rank is tenth. China is ranked at 132 when per capita GNI is based on the
exchange rate conversion method but rises to 122 based on the international dollar method.
Characteristics of Low-Income Countries
Low incomes are often associated with other characteristics: severe inequality, poor health
care and education, high unemployment, heavy reliance on agriculture, and rapid population
growth. We will examine most of these problems in this section. Population growth in low-
income nations is examined later in the chapter.
Inequality
Not only are incomes in low-income countries quite low; income distribution is often highly
unequal. Poverty is far more prevalent than per capita numbers suggest, as illustrated by
Lorenz curves, introduced in the chapter on inequality, that show the cumulative shares of
income received by individuals or groups.
Consider Costa Rica and Panama, two Latin American countries with roughly equivalent
levels of per capita GNI (Costa Rica’s was $5,560 and Panama’s $5,510 in 2007). Panama’s
income distribution is comparatively less equal, while Costa Rica’s is far more equal. Figure
33.1 "Poverty and the Distribution of Income: Costa Rica versus Panama" compares the 2003
Lorenz curves for Costa Rica and Panama, the most recent year for which the information
was available. The 20% of the households with the lowest incomes in Costa Rica had twice as
large a share of their country’s total income as did the bottom 20% of households in
Panama. That means Costa Rica’s poor were about twice as well off, in material terms, as
Panama’s poor.
Figure 33.1 Poverty and the Distribution of Income: Costa Rica versus Panama
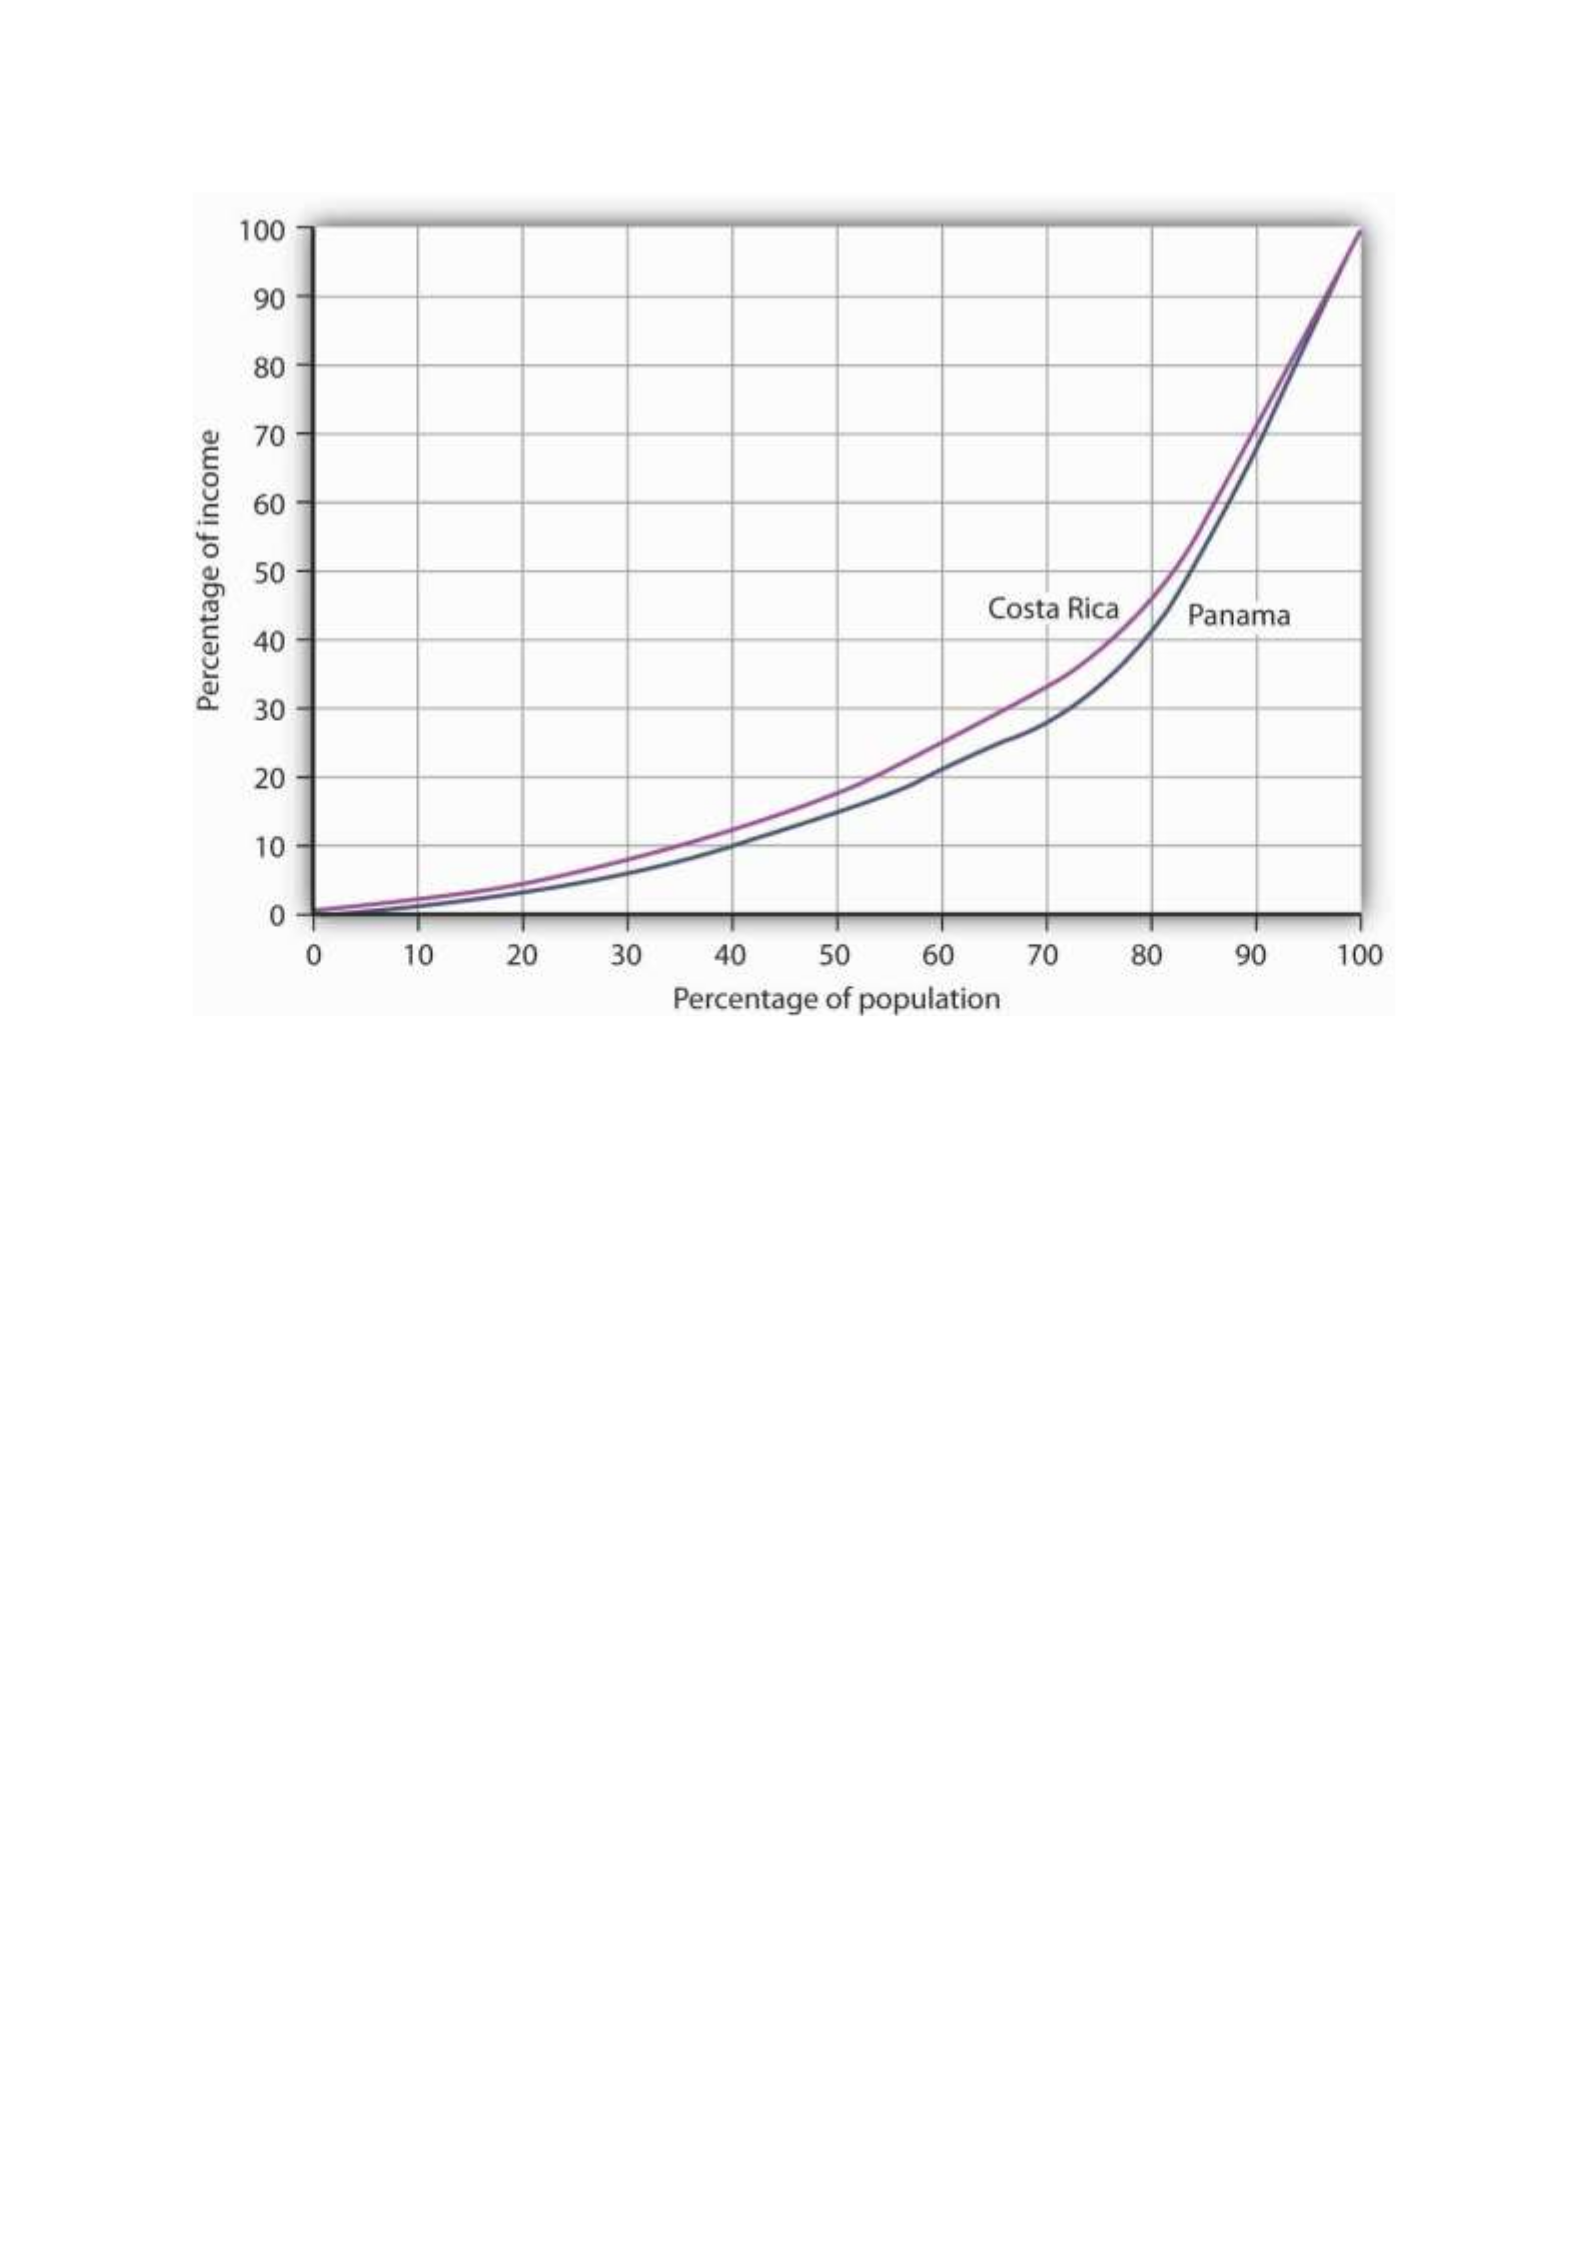
Costa Rica had about the same per capita GNI as Panama in 2003, but Panama’s income
distribution was far more unequal. Panama’s poor had much lower living standards than
Costa Rica’s poor, as suggested by the Lorenz curves for the two nations.
Source: World Development Indicators Online (revised October 17, 2008).
In general, the greater the degree of inequality, the more desperate is the condition of
people at the bottom of an income distribution. Given the high degree of inequality in many
low-income countries, it is very important to look at income distributions when we compare
living standards in different countries.
Health and Education
Poor nations are typically characterized by low levels of human capital. Where health-care
facilities are inadequate, that human capital can be reduced further by disease. Where
educational resources are poor, there will be little progress in improving human capital.
One indicator of poor health care appears on the supply side. Low-income countries have
fewer doctors, relative to their populations, than high-income countries. For example, the
UN estimates that in 2006 about 60% of mothers giving birth in developing countries had
access to a skilled health-care provider (doctor, nurse, or midwife). While that is up from
47% in 1990, the lack of access to a health-care provider may explain much of the difference
in maternal death rates between developed and developing countries: about nine maternal
deaths per 100,000 live births in developed countries compared to about 450 per 100,000 in
developing countries.United Nations, The Millennium Development Goals Report 2008, 27.

We can also see the results of poor health care in statistics on health. Among the world’s
developing countries, the infant mortality rate, which reports deaths in the first year of life,
was 57 per 1,000 live births in 2005. There were six infant deaths per 1,000 live births
among the high-income countries that year.United Nations Development Program, Human
Development Report 2007/2008 (New York: Palgrave Macmillan, 2007), 264.
Another health issue facing the world’s low-income countries is malnutrition. Malnutrition
rates in all developing countries in the 2002 to 2004 period averaged 17%, 35% in the least
developed countries.
Still another issue is the spread of HIV/AIDS. Here there is some progress. The number of
people newly infected declined from 3 million in 2001 to 2.7 million in 2005. Antiretroviral
treatments are also leading to a reduction in deaths from 2.2 million in 2005 to 2 million in
2007. Longer survival means that the number of people living with HIV (from just under 30
million in 2001 to about 33 million in 2007) is rising and most of the people living with HIV
are in Sub-Saharan Africa.United Nations, The Millennium Development Goals Report 2008,
30.
Education in poor and middle-income nations is improving. In 1991, about 80% of children in
developing countries were enrolled in primary schools. In 2005, about 85% were. The
comparable numbers in developed countries are about 95%. Enrollment rates taper off for
high school (about 53% in 2005 in developing countries compared to 91% in developed
countries).United Nations Development Program, Human Development Report
2007/2008 (New York: Palgrave Macmillan, 2007), 272.
Unemployment
Unemployment is pervasive in low-income nations. These nations, already faced with low
levels of potential output, are producing well below their potential. Unemployment rates in
low-income countries vary widely, reaching as high as 15% or more in some countries. If we
count discouraged workers, people who have given up looking for work but who would take
it if it were available, and people who work less than full time, not by choice but because
more work is unavailable, then unemployment in low-income countries soars—often to
more than 30%.
Migration within low-income countries often contributes to unemployment in urban areas.
Factors such as ethnic violence, poverty, and drought often force people to move from rural
areas to cities, where unemployment rates are already high.
Reliance on Agriculture
One of the dominant characteristics of poor nations is the concentration of employment in
agriculture. Another is the very low productivity of that employment. Agriculture in low-
income countries often employs a majority of the population but produces less than one-
third of GDP.

One of the primary forces behind income growth in wealthy countries has been the shift of
labor out of agriculture and into more productive sectors such as manufacturing. This shift is
also occurring in low-income nations but has lagged far behind.
The solution to these problems lies in economic development, to which we turn next.
Economic Development: A Definition
If the problems of low-income nations are pervasive, the development that helps to solve
those problems must transform the very nature of their societies. The late Austrian
economist Joseph Schumpeter described economic development as a revolutionary process.
Whereas economic growth implies quantitative change in production processes that are
already familiar to the society, economic development requires qualitative change in
virtually every aspect of life.
Robert Heilbroner, an economist at the New School for Social Research in New York, has
argued,
“Economic development is political and social change on a wrenching and tearing scale. … It
is a process of institutional birth and institutional death. It is a time when power shifts, often
violently and abruptly, a time when old regimes go under and new ones rise in their places.
And these are not just the unpleasant side effects of development. They are part and parcel
of the process, the very driving force of change itself.”Robert Heilbroner, Between Capitalism
and Socialism (New York: Vintage Books, 1970), 53–54.
Economic development transforms a nation at its core. But what, precisely, is development?
Many definitions follow Heilbroner in noting the massive institutional and cultural changes
economic development involves. But whatever the requirements of development, its
primary characteristics are rising incomes and improving standards of living. That means
output must increase—and it must increase relative to population growth. And because
inequality is so serious a problem in low-income nations, development must deliver
widespread improvement in living conditions. It therefore seems useful to define economic
development as a process that produces sustained and widely shared gains in per capita real
GDP.
In recent years, the United Nations has constructed measures incorporating dimensions of
economic development that go beyond the level of per capita GDP. The Human
Development Index (HDI) includes three dimensions—life expectancy, educational
attainment (adult literacy and combined primary, secondary, and post-secondary
enrollment), as well as purchasing-power-adjusted per capita real GDP. The Gender
Development Index (GDI) uses the same variables as the HDI but adjusts them downward to
take into account the extent of gender inequality. A third index, the Human Poverty Index
(HPI), measures human deprivation and includes such indicators as the percentage of people
expected to die before age 40, the percentage of underweight children under age 5, the
percentage of adults who are illiterate, and the percentage of people who live in poverty.
The number reported for the HPI shows the percentage of people in the country who suffer
these deprivations.

Throughout most of history, poverty has been the human condition. For most people life
was, in the words of 17th-century English philosopher Thomas Hobbes, “solitary, poor, nasty,
brutish, and short.” Only within the past 200 years have a handful or so of countries been
able to break the chains of economic deprivation and poverty.
Consider these facts:United Nations Development Program, Human Development Report
2007/2008 (New York: Palgrave Macmillan, 2007).
• Over a third of the world’s people live in countries in which total per capita income in
2005 was less than $610 per year; 85% live in countries in which total per capita
income in 2005 was $2,808 or less. Adjusting for purchasing power, the per capita
income levels would be $2,531 and $7,416, respectively. The latter numbers compare
to per capita income in high-income countries of over $30,000.
• Babies born in poor countries are 16 times more likely to die in their first five years
than are babies born in rich countries.
• About a quarter of the populations of low-income countries is undernourished.
• About 40% (over 50% for women) of the people 15 years old and older in low-income
countries are illiterate.
• Roughly one-fourth of the people in low-income countries do not have access to safe
drinking water.
Clearly, the high standards of living enjoyed by people in the world’s developed economies
are the global exception, not the rule. This chapter looks at the problem of improving the
standard of living in poor countries.
Rich and Poor Nations
The World Bank, an international organization designed to support economic development
by providing financial assistance, advice, and other resources to poor countries, classifies
over 200 countries according to their levels of per capita gross national income. The
categories in its 2008 report, as shown in Table 33.1 "World Incomes, Selected Countries",
were as follows:
• Low-income countries: These countries had per capita incomes of $935 or less in
2007. There were 49 countries in this category. About 20% of the world’s total
population of about 6.5 billion people lived in low-income countries in 2007.
• Middle-income countries: There were 95 countries with per capita incomes of more
than $936 but less than $11,455. Middle-income countries are further subdivided
into lower middle-income and upper middle-income countries. Roughly two-thirds of
the world’s population lived in middle-income countries in 2007. We should note
that the percentage of the world’s population living in middle-income countries
increased dramatically (and the percentage living in low-income countries decreased
dramatically) when China and India moved from being low-income to middle-income
countries.

• High-income countries: There were 65 nations with per capita incomes of $11,456 or
more. Just 16% of the world’s total population lived in high-income countries in 2007.
Countries in the low- and middle-income categories are often called developing countries.
A developing country is thus a country that is not among the high-income nations of the
world.The World Development Report 2006 (New York: Oxford University Press, 2006), xiv,
comments on this usage: “The term developing countries includes low- and middle-income
economies and thus may include economies in transition from central planning, as a matter
of convenience. The term advanced countries may be used as a matter of convenience to
denote high-income economics.” Developing countries are sometimes referred to as third-
world countries.
How does the World Bank compare incomes across countries? The World Bank converts
gross national income (GNI) figures to dollars in two ways. One is to take GNI in a local
currency and convert using the exchange rate, averaged over a three-year period in order to
smooth out the effects of currency fluctuations. This type of comparison can, however, be
misleading. A country could have a relatively high standard of living but, for a variety of
reasons, a low exchange rate. The per capita GNI figure would be quite low; the country
would appear to be poorer than it is.
A better approach to comparing incomes converts currencies to dollars on the basis of
purchasing power. This measure is reported in what are called international dollars. An
international dollar has the same purchasing power as does a U.S. dollar in the United
States. This is reported in the column labeled “2007 International $” in Table 33.1 "World
Incomes, Selected Countries".
Table 33.1 World Incomes, Selected Countries
Gross National Income per Capita, 2007
Low-income countries
Middle-income countries
High-income countries
Countries
200
7 $
2007
Internatio
nal $
Countrie
s
200
7 $
2007
Internatio
nal $
Countri
es
2007
$
2007
Internatio
nal $
Burundi
110
330
India
95
0
2,740
Czech
Republi
c
14,45
0
22,020
Sierra
Leone
260
660
China
2,36
0
5,370
Saudi
Arabia
15,44
0
22,910
Mozambiq
ue
320
690
Thailand
3,40
0
7,880
Israel
21,90
0
25,930

Gross National Income per Capita, 2007
Low-income countries
Middle-income countries
High-income countries
Countries
200
7 $
2007
Internatio
nal $
Countrie
s
200
7 $
2007
Internatio
nal $
Countri
es
2007
$
2007
Internatio
nal $
Banglades
h
470
1,340
Iran
3,47
0
10,800
Greece
29,63
0
32,330
Haiti
560
1,150
Jamaica
3,71
0
6,210
Japan
37,67
0
34,600
Uzbekistan
730
2,430
Costa
Rica
5,56
0
10,700
France
38,50
0
33,600
Vietnam
790
2,550
Brazil
5,91
0
9,370
Canada
39,42
0
35,310
Zambia
800
1,220
Argentin
a
6,05
0
12,990
United
States
46,04
0
45,850
Pakistan
870
2,570
Russian
Federati
on
7,56
0
14,400
Ireland
48,14
0
37,090
Nigeria
930
1,770
Turkey
8,02
0
12,350
Norway
76,45
0
53,320
Average
578
1,494
Average
2,87
2
5,952
Average
37,56
6
36,100
Ave.,
lower
middle
1,88
7
4,543
Ave.,
upper
middle
6,98
7
11,868
Source: World Development Indicators database, World Bank, revised October 17, 2008.

The international dollar estimates typically show higher incomes than estimates based on an
exchange rate conversion. For example, in 2007 Mozambique’s per capita GNI, based on
exchange rates, was $320. Its per capita GNI based the international dollars was $690.
Ranking of countries, both rich and poor, by per capita GNI differs depending on the
measure used. According to the per capita GNI figures in Table 33.1 "World Incomes,
Selected Countries", which convert data in domestic currencies to dollars using exchange
rates, the United States ranked fifteenth of all countries in 2007. Using the international
dollars method, its rank is tenth. China is ranked at 132 when per capita GNI is based on the
exchange rate conversion method but rises to 122 based on the international dollar method.
Characteristics of Low-Income Countries
Low incomes are often associated with other characteristics: severe inequality, poor health
care and education, high unemployment, heavy reliance on agriculture, and rapid population
growth. We will examine most of these problems in this section. Population growth in low-
income nations is examined later in the chapter.
Inequality
Not only are incomes in low-income countries quite low; income distribution is often highly
unequal. Poverty is far more prevalent than per capita numbers suggest, as illustrated by
Lorenz curves, introduced in the chapter on inequality, that show the cumulative shares of
income received by individuals or groups.
Consider Costa Rica and Panama, two Latin American countries with roughly equivalent
levels of per capita GNI (Costa Rica’s was $5,560 and Panama’s $5,510 in 2007). Panama’s
income distribution is comparatively less equal, while Costa Rica’s is far more equal. Figure
33.1 "Poverty and the Distribution of Income: Costa Rica versus Panama" compares the 2003
Lorenz curves for Costa Rica and Panama, the most recent year for which the information
was available. The 20% of the households with the lowest incomes in Costa Rica had twice as
large a share of their country’s total income as did the bottom 20% of households in
Panama. That means Costa Rica’s poor were about twice as well off, in material terms, as
Panama’s poor.
Figure 33.1 Poverty and the Distribution of Income: Costa Rica versus Panama
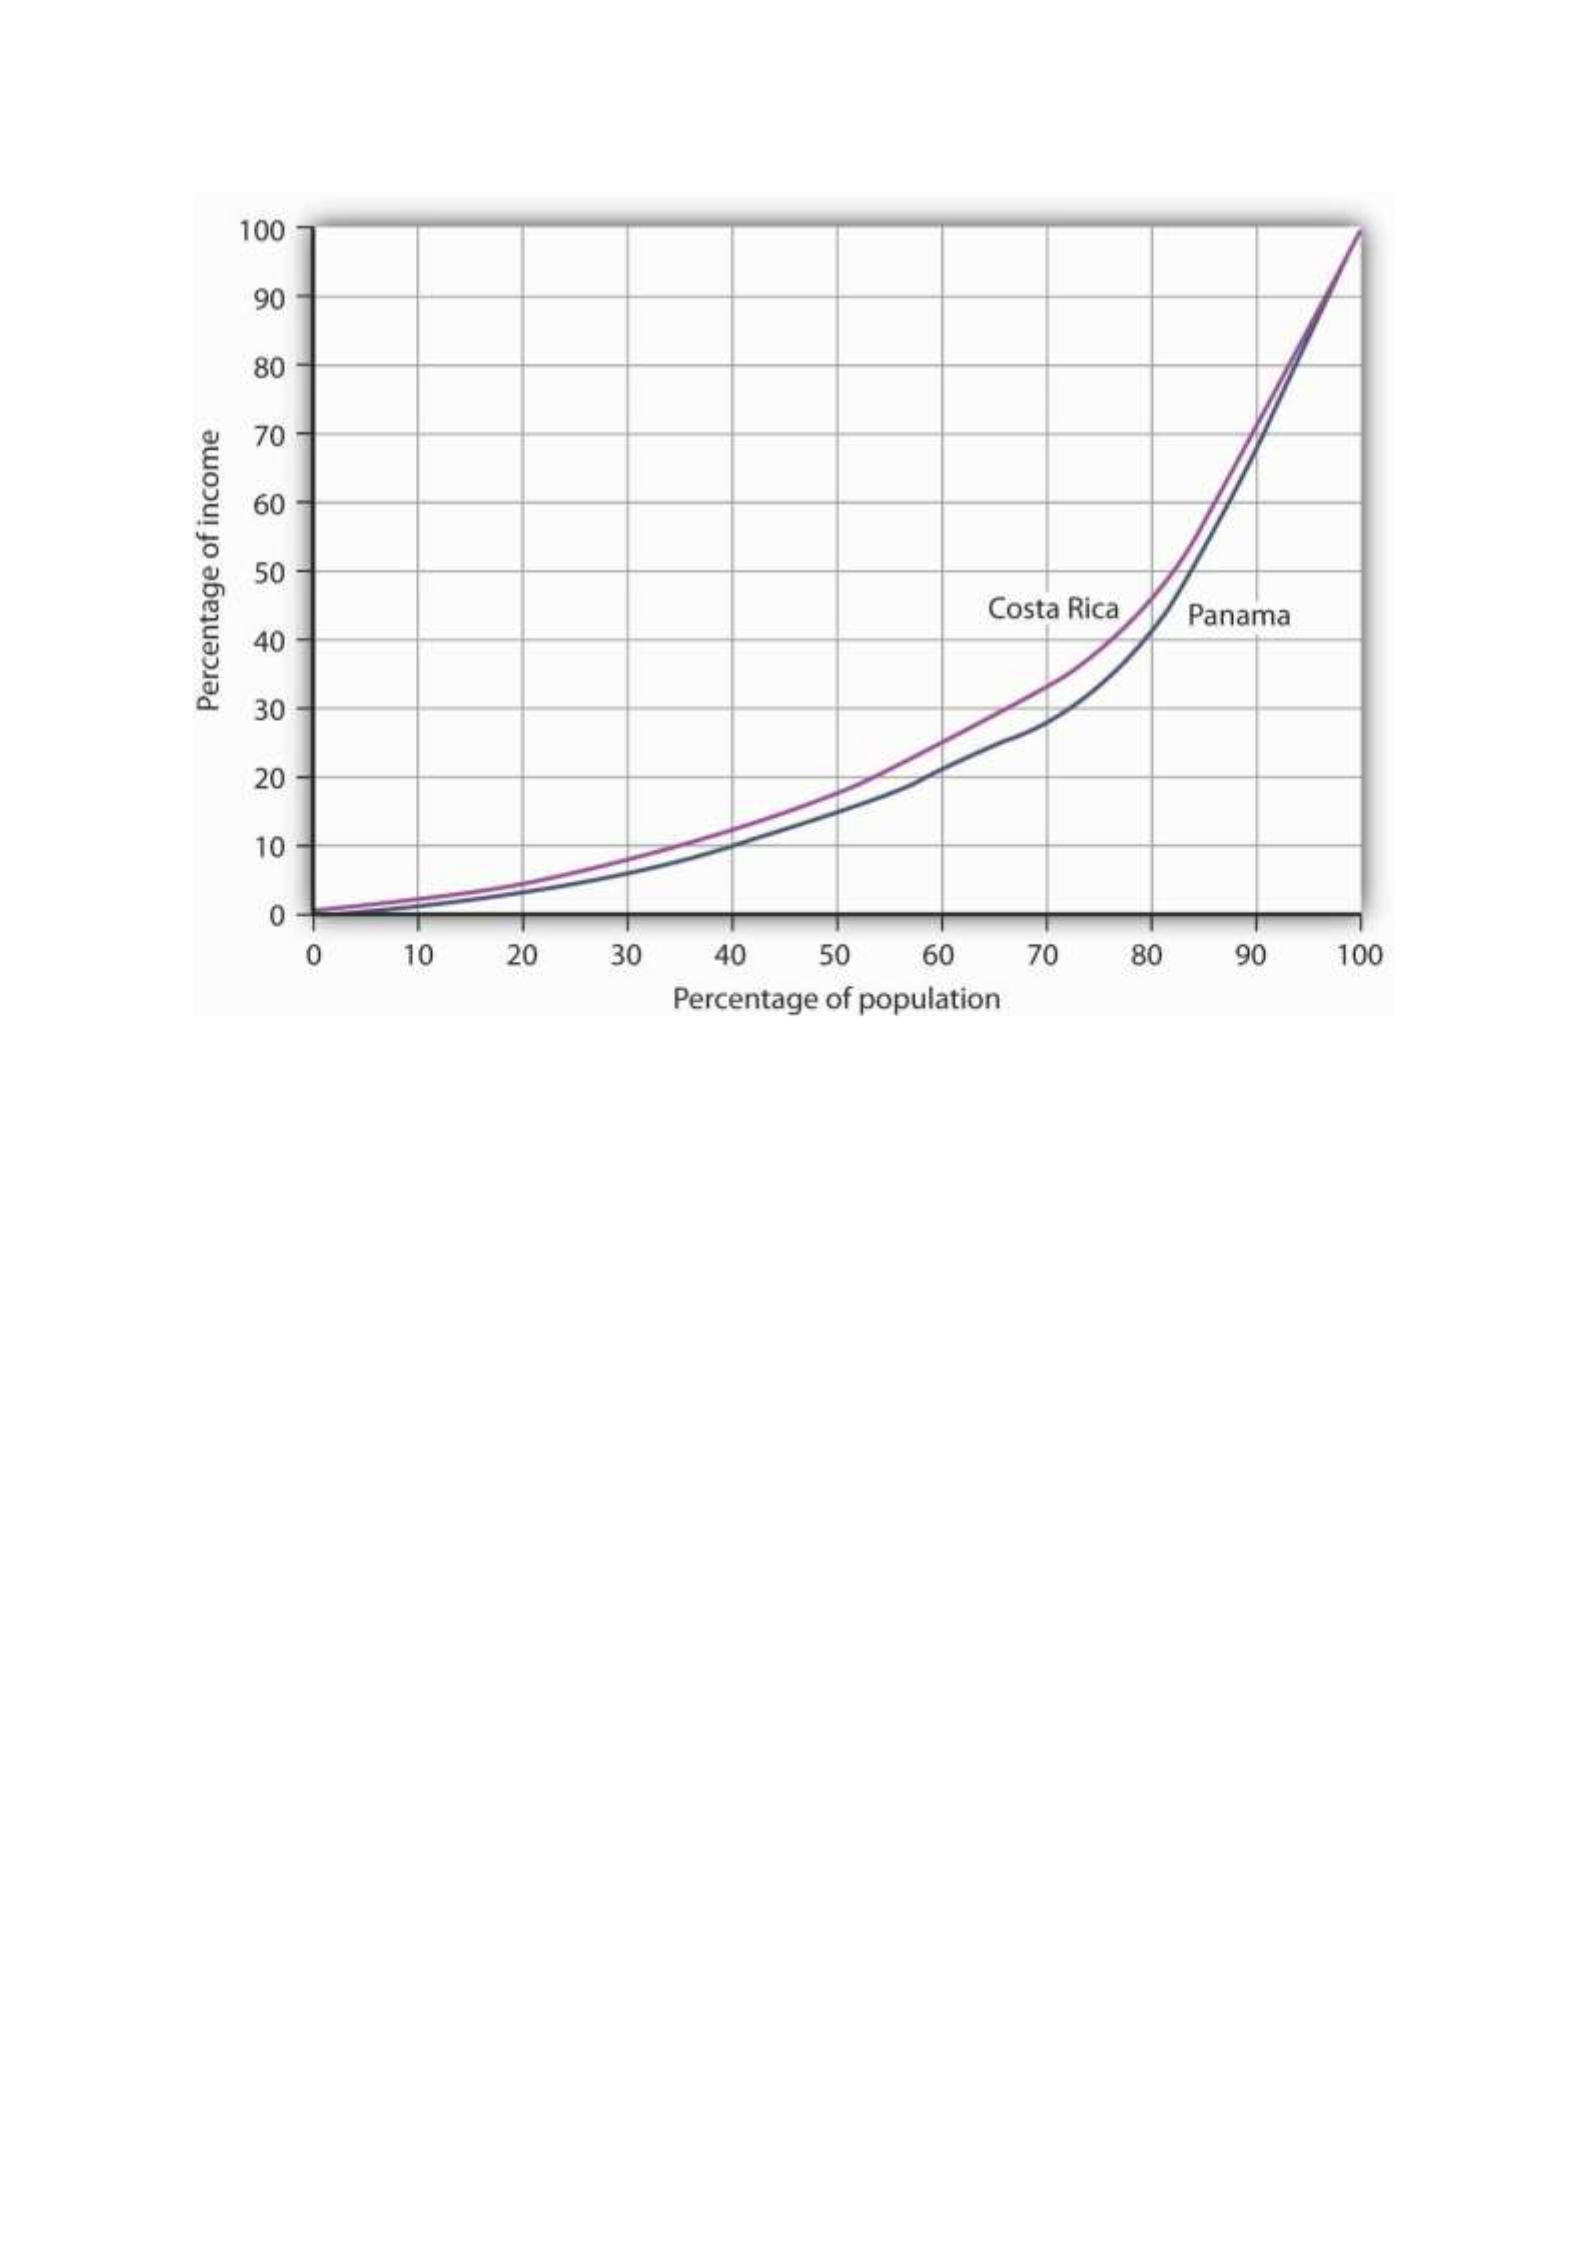
Costa Rica had about the same per capita GNI as Panama in 2003, but Panama’s income
distribution was far more unequal. Panama’s poor had much lower living standards than
Costa Rica’s poor, as suggested by the Lorenz curves for the two nations.
Source: World Development Indicators Online (revised October 17, 2008).
In general, the greater the degree of inequality, the more desperate is the condition of
people at the bottom of an income distribution. Given the high degree of inequality in many
low-income countries, it is very important to look at income distributions when we compare
living standards in different countries.
Health and Education
Poor nations are typically characterized by low levels of human capital. Where health-care
facilities are inadequate, that human capital can be reduced further by disease. Where
educational resources are poor, there will be little progress in improving human capital.
One indicator of poor health care appears on the supply side. Low-income countries have
fewer doctors, relative to their populations, than high-income countries. For example, the
UN estimates that in 2006 about 60% of mothers giving birth in developing countries had
access to a skilled health-care provider (doctor, nurse, or midwife). While that is up from
47% in 1990, the lack of access to a health-care provider may explain much of the difference
in maternal death rates between developed and developing countries: about nine maternal
deaths per 100,000 live births in developed countries compared to about 450 per 100,000 in
developing countries.United Nations, The Millennium Development Goals Report 2008, 27.

We can also see the results of poor health care in statistics on health. Among the world’s
developing countries, the infant mortality rate, which reports deaths in the first year of life,
was 57 per 1,000 live births in 2005. There were six infant deaths per 1,000 live births
among the high-income countries that year.United Nations Development Program, Human
Development Report 2007/2008 (New York: Palgrave Macmillan, 2007), 264.
Another health issue facing the world’s low-income countries is malnutrition. Malnutrition
rates in all developing countries in the 2002 to 2004 period averaged 17%, 35% in the least
developed countries.
Still another issue is the spread of HIV/AIDS. Here there is some progress. The number of
people newly infected declined from 3 million in 2001 to 2.7 million in 2005. Antiretroviral
treatments are also leading to a reduction in deaths from 2.2 million in 2005 to 2 million in
2007. Longer survival means that the number of people living with HIV (from just under 30
million in 2001 to about 33 million in 2007) is rising and most of the people living with HIV
are in Sub-Saharan Africa.United Nations, The Millennium Development Goals Report 2008,
30.
Education in poor and middle-income nations is improving. In 1991, about 80% of children in
developing countries were enrolled in primary schools. In 2005, about 85% were. The
comparable numbers in developed countries are about 95%. Enrollment rates taper off for
high school (about 53% in 2005 in developing countries compared to 91% in developed
countries).United Nations Development Program, Human Development Report
2007/2008 (New York: Palgrave Macmillan, 2007), 272.
Unemployment
Unemployment is pervasive in low-income nations. These nations, already faced with low
levels of potential output, are producing well below their potential. Unemployment rates in
low-income countries vary widely, reaching as high as 15% or more in some countries. If we
count discouraged workers, people who have given up looking for work but who would take
it if it were available, and people who work less than full time, not by choice but because
more work is unavailable, then unemployment in low-income countries soars—often to
more than 30%.
Migration within low-income countries often contributes to unemployment in urban areas.
Factors such as ethnic violence, poverty, and drought often force people to move from rural
areas to cities, where unemployment rates are already high.
Reliance on Agriculture
One of the dominant characteristics of poor nations is the concentration of employment in
agriculture. Another is the very low productivity of that employment. Agriculture in low-
income countries often employs a majority of the population but produces less than one-
third of GDP.

One of the primary forces behind income growth in wealthy countries has been the shift of
labor out of agriculture and into more productive sectors such as manufacturing. This shift is
also occurring in low-income nations but has lagged far behind.
The solution to these problems lies in economic development, to which we turn next.
Economic Development: A Definition
If the problems of low-income nations are pervasive, the development that helps to solve
those problems must transform the very nature of their societies. The late Austrian
economist Joseph Schumpeter described economic development as a revolutionary process.
Whereas economic growth implies quantitative change in production processes that are
already familiar to the society, economic development requires qualitative change in
virtually every aspect of life.
Robert Heilbroner, an economist at the New School for Social Research in New York, has
argued,
“Economic development is political and social change on a wrenching and tearing scale. … It
is a process of institutional birth and institutional death. It is a time when power shifts, often
violently and abruptly, a time when old regimes go under and new ones rise in their places.
And these are not just the unpleasant side effects of development. They are part and parcel
of the process, the very driving force of change itself.”Robert Heilbroner, Between Capitalism
and Socialism (New York: Vintage Books, 1970), 53–54.
Economic development transforms a nation at its core. But what, precisely, is development?
Many definitions follow Heilbroner in noting the massive institutional and cultural changes
economic development involves. But whatever the requirements of development, its
primary characteristics are rising incomes and improving standards of living. That means
output must increase—and it must increase relative to population growth. And because
inequality is so serious a problem in low-income nations, development must deliver
widespread improvement in living conditions. It therefore seems useful to define economic
development as a process that produces sustained and widely shared gains in per capita real
GDP.
In recent years, the United Nations has constructed measures incorporating dimensions of
economic development that go beyond the level of per capita GDP. The Human
Development Index (HDI) includes three dimensions—life expectancy, educational
attainment (adult literacy and combined primary, secondary, and post-secondary
enrollment), as well as purchasing-power-adjusted per capita real GDP. The Gender
Development Index (GDI) uses the same variables as the HDI but adjusts them downward to
take into account the extent of gender inequality. A third index, the Human Poverty Index
(HPI), measures human deprivation and includes such indicators as the percentage of people
expected to die before age 40, the percentage of underweight children under age 5, the
percentage of adults who are illiterate, and the percentage of people who live in poverty.
The number reported for the HPI shows the percentage of people in the country who suffer
these deprivations.

Throughout most of history, poverty has been the human condition. For most people life
was, in the words of 17th-century English philosopher Thomas Hobbes, “solitary, poor, nasty,
brutish, and short.” Only within the past 200 years have a handful or so of countries been
able to break the chains of economic deprivation and poverty.
Consider these facts:United Nations Development Program, Human Development Report
2007/2008 (New York: Palgrave Macmillan, 2007).
• Over a third of the world’s people live in countries in which total per capita income in
2005 was less than $610 per year; 85% live in countries in which total per capita
income in 2005 was $2,808 or less. Adjusting for purchasing power, the per capita
income levels would be $2,531 and $7,416, respectively. The latter numbers compare
to per capita income in high-income countries of over $30,000.
• Babies born in poor countries are 16 times more likely to die in their first five years
than are babies born in rich countries.
• About a quarter of the populations of low-income countries is undernourished.
• About 40% (over 50% for women) of the people 15 years old and older in low-income
countries are illiterate.
• Roughly one-fourth of the people in low-income countries do not have access to safe
drinking water.
Clearly, the high standards of living enjoyed by people in the world’s developed economies
are the global exception, not the rule. This chapter looks at the problem of improving the
standard of living in poor countries.
Rich and Poor Nations
The World Bank, an international organization designed to support economic development
by providing financial assistance, advice, and other resources to poor countries, classifies
over 200 countries according to their levels of per capita gross national income. The
categories in its 2008 report, as shown in Table 33.1 "World Incomes, Selected Countries",
were as follows:
• Low-income countries: These countries had per capita incomes of $935 or less in
2007. There were 49 countries in this category. About 20% of the world’s total
population of about 6.5 billion people lived in low-income countries in 2007.
• Middle-income countries: There were 95 countries with per capita incomes of more
than $936 but less than $11,455. Middle-income countries are further subdivided
into lower middle-income and upper middle-income countries. Roughly two-thirds of
the world’s population lived in middle-income countries in 2007. We should note
that the percentage of the world’s population living in middle-income countries
increased dramatically (and the percentage living in low-income countries decreased
dramatically) when China and India moved from being low-income to middle-income
countries.

• High-income countries: There were 65 nations with per capita incomes of $11,456 or
more. Just 16% of the world’s total population lived in high-income countries in 2007.
Countries in the low- and middle-income categories are often called developing countries.
A developing country is thus a country that is not among the high-income nations of the
world.The World Development Report 2006 (New York: Oxford University Press, 2006), xiv,
comments on this usage: “The term developing countries includes low- and middle-income
economies and thus may include economies in transition from central planning, as a matter
of convenience. The term advanced countries may be used as a matter of convenience to
denote high-income economics.” Developing countries are sometimes referred to as third-
world countries.
How does the World Bank compare incomes across countries? The World Bank converts
gross national income (GNI) figures to dollars in two ways. One is to take GNI in a local
currency and convert using the exchange rate, averaged over a three-year period in order to
smooth out the effects of currency fluctuations. This type of comparison can, however, be
misleading. A country could have a relatively high standard of living but, for a variety of
reasons, a low exchange rate. The per capita GNI figure would be quite low; the country
would appear to be poorer than it is.
A better approach to comparing incomes converts currencies to dollars on the basis of
purchasing power. This measure is reported in what are called international dollars. An
international dollar has the same purchasing power as does a U.S. dollar in the United
States. This is reported in the column labeled “2007 International $” in Table 33.1 "World
Incomes, Selected Countries".
Table 33.1 World Incomes, Selected Countries
Gross National Income per Capita, 2007
Low-income countries
Middle-income countries
High-income countries
Countries
200
7 $
2007
Internatio
nal $
Countrie
s
200
7 $
2007
Internatio
nal $
Countri
es
2007
$
2007
Internatio
nal $
Burundi
110
330
India
95
0
2,740
Czech
Republi
c
14,45
0
22,020
Sierra
Leone
260
660
China
2,36
0
5,370
Saudi
Arabia
15,44
0
22,910
Mozambiq
ue
320
690
Thailand
3,40
0
7,880
Israel
21,90
0
25,930

Gross National Income per Capita, 2007
Low-income countries
Middle-income countries
High-income countries
Countries
200
7 $
2007
Internatio
nal $
Countrie
s
200
7 $
2007
Internatio
nal $
Countri
es
2007
$
2007
Internatio
nal $
Banglades
h
470
1,340
Iran
3,47
0
10,800
Greece
29,63
0
32,330
Haiti
560
1,150
Jamaica
3,71
0
6,210
Japan
37,67
0
34,600
Uzbekistan
730
2,430
Costa
Rica
5,56
0
10,700
France
38,50
0
33,600
Vietnam
790
2,550
Brazil
5,91
0
9,370
Canada
39,42
0
35,310
Zambia
800
1,220
Argentin
a
6,05
0
12,990
United
States
46,04
0
45,850
Pakistan
870
2,570
Russian
Federati
on
7,56
0
14,400
Ireland
48,14
0
37,090
Nigeria
930
1,770
Turkey
8,02
0
12,350
Norway
76,45
0
53,320
Average
578
1,494
Average
2,87
2
5,952
Average
37,56
6
36,100
Ave.,
lower
middle
1,88
7
4,543
Ave.,
upper
middle
6,98
7
11,868
Source: World Development Indicators database, World Bank, revised October 17, 2008.

The international dollar estimates typically show higher incomes than estimates based on an
exchange rate conversion. For example, in 2007 Mozambique’s per capita GNI, based on
exchange rates, was $320. Its per capita GNI based the international dollars was $690.
Ranking of countries, both rich and poor, by per capita GNI differs depending on the
measure used. According to the per capita GNI figures in Table 33.1 "World Incomes,
Selected Countries", which convert data in domestic currencies to dollars using exchange
rates, the United States ranked fifteenth of all countries in 2007. Using the international
dollars method, its rank is tenth. China is ranked at 132 when per capita GNI is based on the
exchange rate conversion method but rises to 122 based on the international dollar method.
Characteristics of Low-Income Countries
Low incomes are often associated with other characteristics: severe inequality, poor health
care and education, high unemployment, heavy reliance on agriculture, and rapid population
growth. We will examine most of these problems in this section. Population growth in low-
income nations is examined later in the chapter.
Inequality
Not only are incomes in low-income countries quite low; income distribution is often highly
unequal. Poverty is far more prevalent than per capita numbers suggest, as illustrated by
Lorenz curves, introduced in the chapter on inequality, that show the cumulative shares of
income received by individuals or groups.
Consider Costa Rica and Panama, two Latin American countries with roughly equivalent
levels of per capita GNI (Costa Rica’s was $5,560 and Panama’s $5,510 in 2007). Panama’s
income distribution is comparatively less equal, while Costa Rica’s is far more equal. Figure
33.1 "Poverty and the Distribution of Income: Costa Rica versus Panama" compares the 2003
Lorenz curves for Costa Rica and Panama, the most recent year for which the information
was available. The 20% of the households with the lowest incomes in Costa Rica had twice as
large a share of their country’s total income as did the bottom 20% of households in
Panama. That means Costa Rica’s poor were about twice as well off, in material terms, as
Panama’s poor.
Figure 33.1 Poverty and the Distribution of Income: Costa Rica versus Panama

Costa Rica had about the same per capita GNI as Panama in 2003, but Panama’s income
distribution was far more unequal. Panama’s poor had much lower living standards than
Costa Rica’s poor, as suggested by the Lorenz curves for the two nations.
Source: World Development Indicators Online (revised October 17, 2008).
In general, the greater the degree of inequality, the more desperate is the condition of
people at the bottom of an income distribution. Given the high degree of inequality in many
low-income countries, it is very important to look at income distributions when we compare
living standards in different countries.
Health and Education
Poor nations are typically characterized by low levels of human capital. Where health-care
facilities are inadequate, that human capital can be reduced further by disease. Where
educational resources are poor, there will be little progress in improving human capital.
One indicator of poor health care appears on the supply side. Low-income countries have
fewer doctors, relative to their populations, than high-income countries. For example, the
UN estimates that in 2006 about 60% of mothers giving birth in developing countries had
access to a skilled health-care provider (doctor, nurse, or midwife). While that is up from
47% in 1990, the lack of access to a health-care provider may explain much of the difference
in maternal death rates between developed and developing countries: about nine maternal
deaths per 100,000 live births in developed countries compared to about 450 per 100,000 in
developing countries.United Nations, The Millennium Development Goals Report 2008, 27.

We can also see the results of poor health care in statistics on health. Among the world’s
developing countries, the infant mortality rate, which reports deaths in the first year of life,
was 57 per 1,000 live births in 2005. There were six infant deaths per 1,000 live births
among the high-income countries that year.United Nations Development Program, Human
Development Report 2007/2008 (New York: Palgrave Macmillan, 2007), 264.
Another health issue facing the world’s low-income countries is malnutrition. Malnutrition
rates in all developing countries in the 2002 to 2004 period averaged 17%, 35% in the least
developed countries.
Still another issue is the spread of HIV/AIDS. Here there is some progress. The number of
people newly infected declined from 3 million in 2001 to 2.7 million in 2005. Antiretroviral
treatments are also leading to a reduction in deaths from 2.2 million in 2005 to 2 million in
2007. Longer survival means that the number of people living with HIV (from just under 30
million in 2001 to about 33 million in 2007) is rising and most of the people living with HIV
are in Sub-Saharan Africa.United Nations, The Millennium Development Goals Report 2008,
30.
Education in poor and middle-income nations is improving. In 1991, about 80% of children in
developing countries were enrolled in primary schools. In 2005, about 85% were. The
comparable numbers in developed countries are about 95%. Enrollment rates taper off for
high school (about 53% in 2005 in developing countries compared to 91% in developed
countries).United Nations Development Program, Human Development Report
2007/2008 (New York: Palgrave Macmillan, 2007), 272.
Unemployment
Unemployment is pervasive in low-income nations. These nations, already faced with low
levels of potential output, are producing well below their potential. Unemployment rates in
low-income countries vary widely, reaching as high as 15% or more in some countries. If we
count discouraged workers, people who have given up looking for work but who would take
it if it were available, and people who work less than full time, not by choice but because
more work is unavailable, then unemployment in low-income countries soars—often to
more than 30%.
Migration within low-income countries often contributes to unemployment in urban areas.
Factors such as ethnic violence, poverty, and drought often force people to move from rural
areas to cities, where unemployment rates are already high.
Reliance on Agriculture
One of the dominant characteristics of poor nations is the concentration of employment in
agriculture. Another is the very low productivity of that employment. Agriculture in low-
income countries often employs a majority of the population but produces less than one-
third of GDP.

One of the primary forces behind income growth in wealthy countries has been the shift of
labor out of agriculture and into more productive sectors such as manufacturing. This shift is
also occurring in low-income nations but has lagged far behind.
The solution to these problems lies in economic development, to which we turn next.
Economic Development: A Definition
If the problems of low-income nations are pervasive, the development that helps to solve
those problems must transform the very nature of their societies. The late Austrian
economist Joseph Schumpeter described economic development as a revolutionary process.
Whereas economic growth implies quantitative change in production processes that are
already familiar to the society, economic development requires qualitative change in
virtually every aspect of life.
Robert Heilbroner, an economist at the New School for Social Research in New York, has
argued,
“Economic development is political and social change on a wrenching and tearing scale. … It
is a process of institutional birth and institutional death. It is a time when power shifts, often
violently and abruptly, a time when old regimes go under and new ones rise in their places.
And these are not just the unpleasant side effects of development. They are part and parcel
of the process, the very driving force of change itself.”Robert Heilbroner, Between Capitalism
and Socialism (New York: Vintage Books, 1970), 53–54.
Economic development transforms a nation at its core. But what, precisely, is development?
Many definitions follow Heilbroner in noting the massive institutional and cultural changes
economic development involves. But whatever the requirements of development, its
primary characteristics are rising incomes and improving standards of living. That means
output must increase—and it must increase relative to population growth. And because
inequality is so serious a problem in low-income nations, development must deliver
widespread improvement in living conditions. It therefore seems useful to define economic
development as a process that produces sustained and widely shared gains in per capita real
GDP.
In recent years, the United Nations has constructed measures incorporating dimensions of
economic development that go beyond the level of per capita GDP. The Human
Development Index (HDI) includes three dimensions—life expectancy, educational
attainment (adult literacy and combined primary, secondary, and post-secondary
enrollment), as well as purchasing-power-adjusted per capita real GDP. The Gender
Development Index (GDI) uses the same variables as the HDI but adjusts them downward to
take into account the extent of gender inequality. A third index, the Human Poverty Index
(HPI), measures human deprivation and includes such indicators as the percentage of people
expected to die before age 40, the percentage of underweight children under age 5, the
percentage of adults who are illiterate, and the percentage of people who live in poverty.
The number reported for the HPI shows the percentage of people in the country who suffer
these deprivations.

Throughout most of history, poverty has been the human condition. For most people life
was, in the words of 17th-century English philosopher Thomas Hobbes, “solitary, poor, nasty,
brutish, and short.” Only within the past 200 years have a handful or so of countries been
able to break the chains of economic deprivation and poverty.
Consider these facts:United Nations Development Program, Human Development Report
2007/2008 (New York: Palgrave Macmillan, 2007).
• Over a third of the world’s people live in countries in which total per capita income in
2005 was less than $610 per year; 85% live in countries in which total per capita
income in 2005 was $2,808 or less. Adjusting for purchasing power, the per capita
income levels would be $2,531 and $7,416, respectively. The latter numbers compare
to per capita income in high-income countries of over $30,000.
• Babies born in poor countries are 16 times more likely to die in their first five years
than are babies born in rich countries.
• About a quarter of the populations of low-income countries is undernourished.
• About 40% (over 50% for women) of the people 15 years old and older in low-income
countries are illiterate.
• Roughly one-fourth of the people in low-income countries do not have access to safe
drinking water.
Clearly, the high standards of living enjoyed by people in the world’s developed economies
are the global exception, not the rule. This chapter looks at the problem of improving the
standard of living in poor countries.
Rich and Poor Nations
The World Bank, an international organization designed to support economic development
by providing financial assistance, advice, and other resources to poor countries, classifies
over 200 countries according to their levels of per capita gross national income. The
categories in its 2008 report, as shown in Table 33.1 "World Incomes, Selected Countries",
were as follows:
• Low-income countries: These countries had per capita incomes of $935 or less in
2007. There were 49 countries in this category. About 20% of the world’s total
population of about 6.5 billion people lived in low-income countries in 2007.
• Middle-income countries: There were 95 countries with per capita incomes of more
than $936 but less than $11,455. Middle-income countries are further subdivided
into lower middle-income and upper middle-income countries. Roughly two-thirds of
the world’s population lived in middle-income countries in 2007. We should note
that the percentage of the world’s population living in middle-income countries
increased dramatically (and the percentage living in low-income countries decreased
dramatically) when China and India moved from being low-income to middle-income
countries.

• High-income countries: There were 65 nations with per capita incomes of $11,456 or
more. Just 16% of the world’s total population lived in high-income countries in 2007.
Countries in the low- and middle-income categories are often called developing countries.
A developing country is thus a country that is not among the high-income nations of the
world.The World Development Report 2006 (New York: Oxford University Press, 2006), xiv,
comments on this usage: “The term developing countries includes low- and middle-income
economies and thus may include economies in transition from central planning, as a matter
of convenience. The term advanced countries may be used as a matter of convenience to
denote high-income economics.” Developing countries are sometimes referred to as third-
world countries.
How does the World Bank compare incomes across countries? The World Bank converts
gross national income (GNI) figures to dollars in two ways. One is to take GNI in a local
currency and convert using the exchange rate, averaged over a three-year period in order to
smooth out the effects of currency fluctuations. This type of comparison can, however, be
misleading. A country could have a relatively high standard of living but, for a variety of
reasons, a low exchange rate. The per capita GNI figure would be quite low; the country
would appear to be poorer than it is.
A better approach to comparing incomes converts currencies to dollars on the basis of
purchasing power. This measure is reported in what are called international dollars. An
international dollar has the same purchasing power as does a U.S. dollar in the United
States. This is reported in the column labeled “2007 International $” in Table 33.1 "World
Incomes, Selected Countries".
Table 33.1 World Incomes, Selected Countries
Gross National Income per Capita, 2007
Low-income countries
Middle-income countries
High-income countries
Countries
200
7 $
2007
Internatio
nal $
Countrie
s
200
7 $
2007
Internatio
nal $
Countri
es
2007
$
2007
Internatio
nal $
Burundi
110
330
India
95
0
2,740
Czech
Republi
c
14,45
0
22,020
Sierra
Leone
260
660
China
2,36
0
5,370
Saudi
Arabia
15,44
0
22,910
Mozambiq
ue
320
690
Thailand
3,40
0
7,880
Israel
21,90
0
25,930

Gross National Income per Capita, 2007
Low-income countries
Middle-income countries
High-income countries
Countries
200
7 $
2007
Internatio
nal $
Countrie
s
200
7 $
2007
Internatio
nal $
Countri
es
2007
$
2007
Internatio
nal $
Banglades
h
470
1,340
Iran
3,47
0
10,800
Greece
29,63
0
32,330
Haiti
560
1,150
Jamaica
3,71
0
6,210
Japan
37,67
0
34,600
Uzbekistan
730
2,430
Costa
Rica
5,56
0
10,700
France
38,50
0
33,600
Vietnam
790
2,550
Brazil
5,91
0
9,370
Canada
39,42
0
35,310
Zambia
800
1,220
Argentin
a
6,05
0
12,990
United
States
46,04
0
45,850
Pakistan
870
2,570
Russian
Federati
on
7,56
0
14,400
Ireland
48,14
0
37,090
Nigeria
930
1,770
Turkey
8,02
0
12,350
Norway
76,45
0
53,320
Average
578
1,494
Average
2,87
2
5,952
Average
37,56
6
36,100
Ave.,
lower
middle
1,88
7
4,543
Ave.,
upper
middle
6,98
7
11,868
Source: World Development Indicators database, World Bank, revised October 17, 2008.

The international dollar estimates typically show higher incomes than estimates based on an
exchange rate conversion. For example, in 2007 Mozambique’s per capita GNI, based on
exchange rates, was $320. Its per capita GNI based the international dollars was $690.
Ranking of countries, both rich and poor, by per capita GNI differs depending on the
measure used. According to the per capita GNI figures in Table 33.1 "World Incomes,
Selected Countries", which convert data in domestic currencies to dollars using exchange
rates, the United States ranked fifteenth of all countries in 2007. Using the international
dollars method, its rank is tenth. China is ranked at 132 when per capita GNI is based on the
exchange rate conversion method but rises to 122 based on the international dollar method.
Characteristics of Low-Income Countries
Low incomes are often associated with other characteristics: severe inequality, poor health
care and education, high unemployment, heavy reliance on agriculture, and rapid population
growth. We will examine most of these problems in this section. Population growth in low-
income nations is examined later in the chapter.
Inequality
Not only are incomes in low-income countries quite low; income distribution is often highly
unequal. Poverty is far more prevalent than per capita numbers suggest, as illustrated by
Lorenz curves, introduced in the chapter on inequality, that show the cumulative shares of
income received by individuals or groups.
Consider Costa Rica and Panama, two Latin American countries with roughly equivalent
levels of per capita GNI (Costa Rica’s was $5,560 and Panama’s $5,510 in 2007). Panama’s
income distribution is comparatively less equal, while Costa Rica’s is far more equal. Figure
33.1 "Poverty and the Distribution of Income: Costa Rica versus Panama" compares the 2003
Lorenz curves for Costa Rica and Panama, the most recent year for which the information
was available. The 20% of the households with the lowest incomes in Costa Rica had twice as
large a share of their country’s total income as did the bottom 20% of households in
Panama. That means Costa Rica’s poor were about twice as well off, in material terms, as
Panama’s poor.
Figure 33.1 Poverty and the Distribution of Income: Costa Rica versus Panama
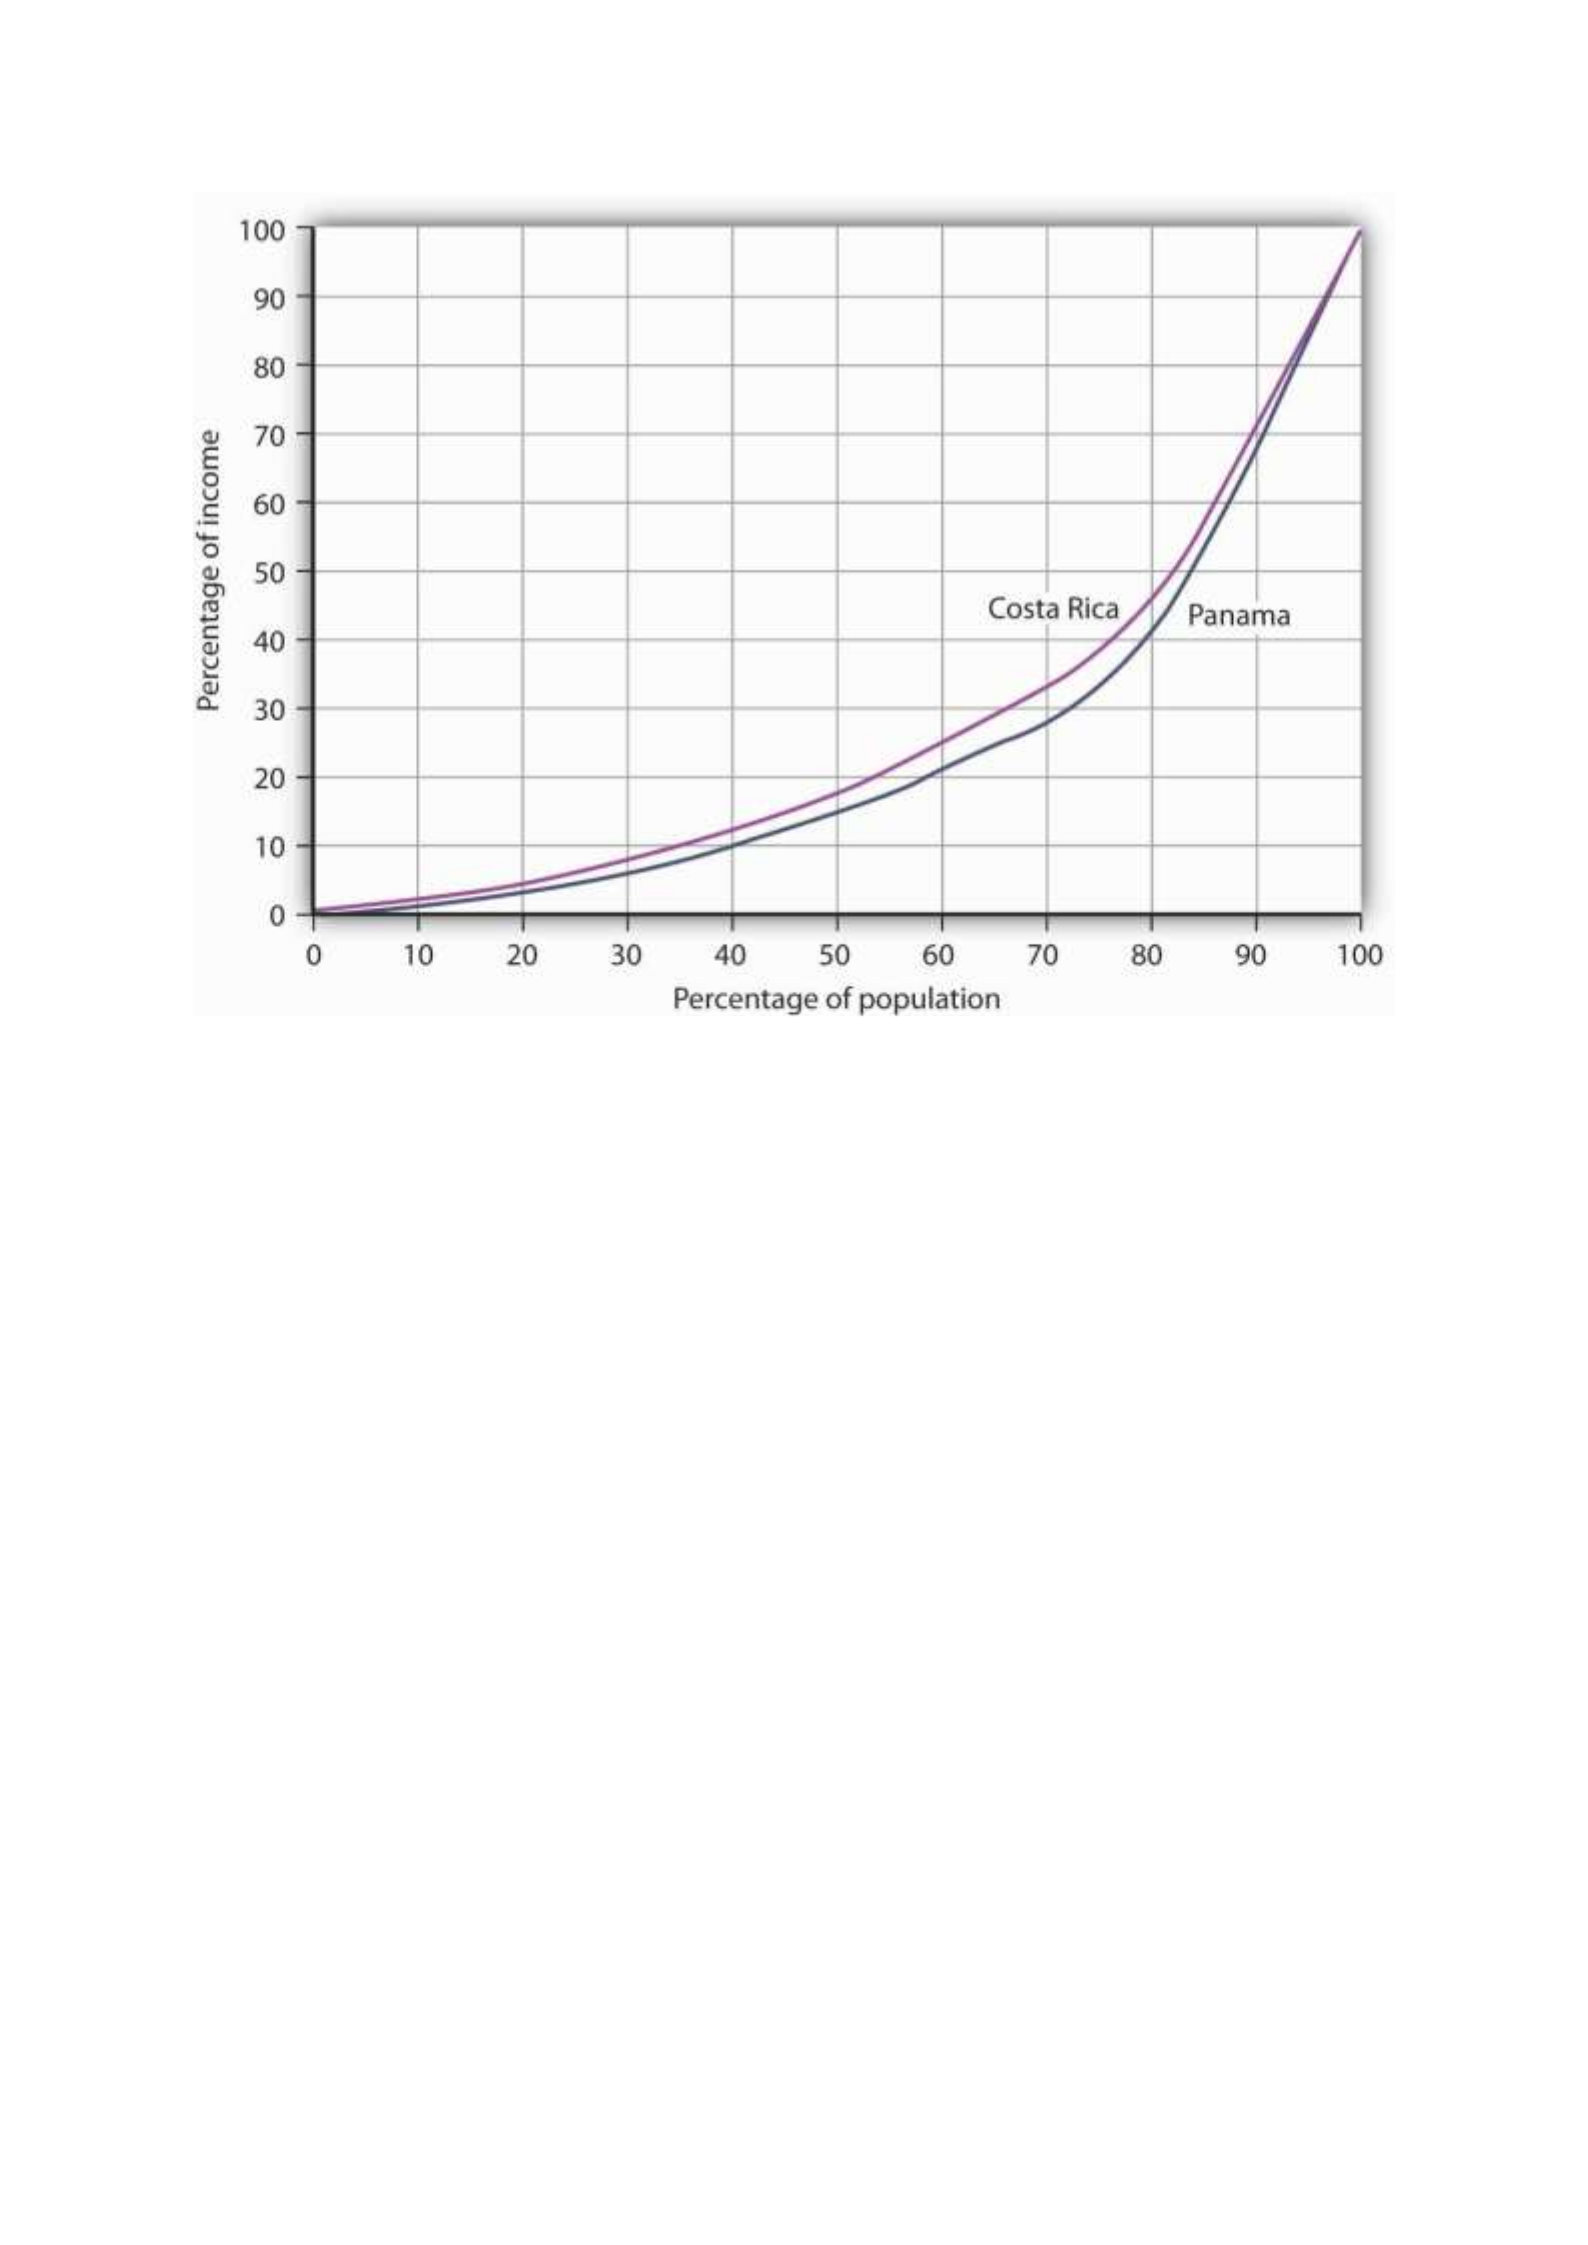
Costa Rica had about the same per capita GNI as Panama in 2003, but Panama’s income
distribution was far more unequal. Panama’s poor had much lower living standards than
Costa Rica’s poor, as suggested by the Lorenz curves for the two nations.
Source: World Development Indicators Online (revised October 17, 2008).
In general, the greater the degree of inequality, the more desperate is the condition of
people at the bottom of an income distribution. Given the high degree of inequality in many
low-income countries, it is very important to look at income distributions when we compare
living standards in different countries.
Health and Education
Poor nations are typically characterized by low levels of human capital. Where health-care
facilities are inadequate, that human capital can be reduced further by disease. Where
educational resources are poor, there will be little progress in improving human capital.
One indicator of poor health care appears on the supply side. Low-income countries have
fewer doctors, relative to their populations, than high-income countries. For example, the
UN estimates that in 2006 about 60% of mothers giving birth in developing countries had
access to a skilled health-care provider (doctor, nurse, or midwife). While that is up from
47% in 1990, the lack of access to a health-care provider may explain much of the difference
in maternal death rates between developed and developing countries: about nine maternal
deaths per 100,000 live births in developed countries compared to about 450 per 100,000 in
developing countries.United Nations, The Millennium Development Goals Report 2008, 27.

We can also see the results of poor health care in statistics on health. Among the world’s
developing countries, the infant mortality rate, which reports deaths in the first year of life,
was 57 per 1,000 live births in 2005. There were six infant deaths per 1,000 live births
among the high-income countries that year.United Nations Development Program, Human
Development Report 2007/2008 (New York: Palgrave Macmillan, 2007), 264.
Another health issue facing the world’s low-income countries is malnutrition. Malnutrition
rates in all developing countries in the 2002 to 2004 period averaged 17%, 35% in the least
developed countries.
Still another issue is the spread of HIV/AIDS. Here there is some progress. The number of
people newly infected declined from 3 million in 2001 to 2.7 million in 2005. Antiretroviral
treatments are also leading to a reduction in deaths from 2.2 million in 2005 to 2 million in
2007. Longer survival means that the number of people living with HIV (from just under 30
million in 2001 to about 33 million in 2007) is rising and most of the people living with HIV
are in Sub-Saharan Africa.United Nations, The Millennium Development Goals Report 2008,
30.
Education in poor and middle-income nations is improving. In 1991, about 80% of children in
developing countries were enrolled in primary schools. In 2005, about 85% were. The
comparable numbers in developed countries are about 95%. Enrollment rates taper off for
high school (about 53% in 2005 in developing countries compared to 91% in developed
countries).United Nations Development Program, Human Development Report
2007/2008 (New York: Palgrave Macmillan, 2007), 272.
Unemployment
Unemployment is pervasive in low-income nations. These nations, already faced with low
levels of potential output, are producing well below their potential. Unemployment rates in
low-income countries vary widely, reaching as high as 15% or more in some countries. If we
count discouraged workers, people who have given up looking for work but who would take
it if it were available, and people who work less than full time, not by choice but because
more work is unavailable, then unemployment in low-income countries soars—often to
more than 30%.
Migration within low-income countries often contributes to unemployment in urban areas.
Factors such as ethnic violence, poverty, and drought often force people to move from rural
areas to cities, where unemployment rates are already high.
Reliance on Agriculture
One of the dominant characteristics of poor nations is the concentration of employment in
agriculture. Another is the very low productivity of that employment. Agriculture in low-
income countries often employs a majority of the population but produces less than one-
third of GDP.

One of the primary forces behind income growth in wealthy countries has been the shift of
labor out of agriculture and into more productive sectors such as manufacturing. This shift is
also occurring in low-income nations but has lagged far behind.
The solution to these problems lies in economic development, to which we turn next.
Economic Development: A Definition
If the problems of low-income nations are pervasive, the development that helps to solve
those problems must transform the very nature of their societies. The late Austrian
economist Joseph Schumpeter described economic development as a revolutionary process.
Whereas economic growth implies quantitative change in production processes that are
already familiar to the society, economic development requires qualitative change in
virtually every aspect of life.
Robert Heilbroner, an economist at the New School for Social Research in New York, has
argued,
“Economic development is political and social change on a wrenching and tearing scale. … It
is a process of institutional birth and institutional death. It is a time when power shifts, often
violently and abruptly, a time when old regimes go under and new ones rise in their places.
And these are not just the unpleasant side effects of development. They are part and parcel
of the process, the very driving force of change itself.”Robert Heilbroner, Between Capitalism
and Socialism (New York: Vintage Books, 1970), 53–54.
Economic development transforms a nation at its core. But what, precisely, is development?
Many definitions follow Heilbroner in noting the massive institutional and cultural changes
economic development involves. But whatever the requirements of development, its
primary characteristics are rising incomes and improving standards of living. That means
output must increase—and it must increase relative to population growth. And because
inequality is so serious a problem in low-income nations, development must deliver
widespread improvement in living conditions. It therefore seems useful to define economic
development as a process that produces sustained and widely shared gains in per capita real
GDP.
In recent years, the United Nations has constructed measures incorporating dimensions of
economic development that go beyond the level of per capita GDP. The Human
Development Index (HDI) includes three dimensions—life expectancy, educational
attainment (adult literacy and combined primary, secondary, and post-secondary
enrollment), as well as purchasing-power-adjusted per capita real GDP. The Gender
Development Index (GDI) uses the same variables as the HDI but adjusts them downward to
take into account the extent of gender inequality. A third index, the Human Poverty Index
(HPI), measures human deprivation and includes such indicators as the percentage of people
expected to die before age 40, the percentage of underweight children under age 5, the
percentage of adults who are illiterate, and the percentage of people who live in poverty.
The number reported for the HPI shows the percentage of people in the country who suffer
these deprivations.

Throughout most of history, poverty has been the human condition. For most people life
was, in the words of 17th-century English philosopher Thomas Hobbes, “solitary, poor, nasty,
brutish, and short.” Only within the past 200 years have a handful or so of countries been
able to break the chains of economic deprivation and poverty.
Consider these facts:United Nations Development Program, Human Development Report
2007/2008 (New York: Palgrave Macmillan, 2007).
• Over a third of the world’s people live in countries in which total per capita income in
2005 was less than $610 per year; 85% live in countries in which total per capita
income in 2005 was $2,808 or less. Adjusting for purchasing power, the per capita
income levels would be $2,531 and $7,416, respectively. The latter numbers compare
to per capita income in high-income countries of over $30,000.
• Babies born in poor countries are 16 times more likely to die in their first five years
than are babies born in rich countries.
• About a quarter of the populations of low-income countries is undernourished.
• About 40% (over 50% for women) of the people 15 years old and older in low-income
countries are illiterate.
• Roughly one-fourth of the people in low-income countries do not have access to safe
drinking water.
Clearly, the high standards of living enjoyed by people in the world’s developed economies
are the global exception, not the rule. This chapter looks at the problem of improving the
standard of living in poor countries.
Rich and Poor Nations
The World Bank, an international organization designed to support economic development
by providing financial assistance, advice, and other resources to poor countries, classifies
over 200 countries according to their levels of per capita gross national income. The
categories in its 2008 report, as shown in Table 33.1 "World Incomes, Selected Countries",
were as follows:
• Low-income countries: These countries had per capita incomes of $935 or less in
2007. There were 49 countries in this category. About 20% of the world’s total
population of about 6.5 billion people lived in low-income countries in 2007.
• Middle-income countries: There were 95 countries with per capita incomes of more
than $936 but less than $11,455. Middle-income countries are further subdivided
into lower middle-income and upper middle-income countries. Roughly two-thirds of
the world’s population lived in middle-income countries in 2007. We should note
that the percentage of the world’s population living in middle-income countries
increased dramatically (and the percentage living in low-income countries decreased
dramatically) when China and India moved from being low-income to middle-income
countries.

• High-income countries: There were 65 nations with per capita incomes of $11,456 or
more. Just 16% of the world’s total population lived in high-income countries in 2007.
Countries in the low- and middle-income categories are often called developing countries.
A developing country is thus a country that is not among the high-income nations of the
world.The World Development Report 2006 (New York: Oxford University Press, 2006), xiv,
comments on this usage: “The term developing countries includes low- and middle-income
economies and thus may include economies in transition from central planning, as a matter
of convenience. The term advanced countries may be used as a matter of convenience to
denote high-income economics.” Developing countries are sometimes referred to as third-
world countries.
How does the World Bank compare incomes across countries? The World Bank converts
gross national income (GNI) figures to dollars in two ways. One is to take GNI in a local
currency and convert using the exchange rate, averaged over a three-year period in order to
smooth out the effects of currency fluctuations. This type of comparison can, however, be
misleading. A country could have a relatively high standard of living but, for a variety of
reasons, a low exchange rate. The per capita GNI figure would be quite low; the country
would appear to be poorer than it is.
A better approach to comparing incomes converts currencies to dollars on the basis of
purchasing power. This measure is reported in what are called international dollars. An
international dollar has the same purchasing power as does a U.S. dollar in the United
States. This is reported in the column labeled “2007 International $” in Table 33.1 "World
Incomes, Selected Countries".
Table 33.1 World Incomes, Selected Countries
Gross National Income per Capita, 2007
Low-income countries
Middle-income countries
High-income countries
Countries
200
7 $
2007
Internatio
nal $
Countrie
s
200
7 $
2007
Internatio
nal $
Countri
es
2007
$
2007
Internatio
nal $
Burundi
110
330
India
95
0
2,740
Czech
Republi
c
14,45
0
22,020
Sierra
Leone
260
660
China
2,36
0
5,370
Saudi
Arabia
15,44
0
22,910
Mozambiq
ue
320
690
Thailand
3,40
0
7,880
Israel
21,90
0
25,930

Gross National Income per Capita, 2007
Low-income countries
Middle-income countries
High-income countries
Countries
200
7 $
2007
Internatio
nal $
Countrie
s
200
7 $
2007
Internatio
nal $
Countri
es
2007
$
2007
Internatio
nal $
Banglades
h
470
1,340
Iran
3,47
0
10,800
Greece
29,63
0
32,330
Haiti
560
1,150
Jamaica
3,71
0
6,210
Japan
37,67
0
34,600
Uzbekistan
730
2,430
Costa
Rica
5,56
0
10,700
France
38,50
0
33,600
Vietnam
790
2,550
Brazil
5,91
0
9,370
Canada
39,42
0
35,310
Zambia
800
1,220
Argentin
a
6,05
0
12,990
United
States
46,04
0
45,850
Pakistan
870
2,570
Russian
Federati
on
7,56
0
14,400
Ireland
48,14
0
37,090
Nigeria
930
1,770
Turkey
8,02
0
12,350
Norway
76,45
0
53,320
Average
578
1,494
Average
2,87
2
5,952
Average
37,56
6
36,100
Ave.,
lower
middle
1,88
7
4,543
Ave.,
upper
middle
6,98
7
11,868
Source: World Development Indicators database, World Bank, revised October 17, 2008.

The international dollar estimates typically show higher incomes than estimates based on an
exchange rate conversion. For example, in 2007 Mozambique’s per capita GNI, based on
exchange rates, was $320. Its per capita GNI based the international dollars was $690.
Ranking of countries, both rich and poor, by per capita GNI differs depending on the
measure used. According to the per capita GNI figures in Table 33.1 "World Incomes,
Selected Countries", which convert data in domestic currencies to dollars using exchange
rates, the United States ranked fifteenth of all countries in 2007. Using the international
dollars method, its rank is tenth. China is ranked at 132 when per capita GNI is based on the
exchange rate conversion method but rises to 122 based on the international dollar method.
Characteristics of Low-Income Countries
Low incomes are often associated with other characteristics: severe inequality, poor health
care and education, high unemployment, heavy reliance on agriculture, and rapid population
growth. We will examine most of these problems in this section. Population growth in low-
income nations is examined later in the chapter.
Inequality
Not only are incomes in low-income countries quite low; income distribution is often highly
unequal. Poverty is far more prevalent than per capita numbers suggest, as illustrated by
Lorenz curves, introduced in the chapter on inequality, that show the cumulative shares of
income received by individuals or groups.
Consider Costa Rica and Panama, two Latin American countries with roughly equivalent
levels of per capita GNI (Costa Rica’s was $5,560 and Panama’s $5,510 in 2007). Panama’s
income distribution is comparatively less equal, while Costa Rica’s is far more equal. Figure
33.1 "Poverty and the Distribution of Income: Costa Rica versus Panama" compares the 2003
Lorenz curves for Costa Rica and Panama, the most recent year for which the information
was available. The 20% of the households with the lowest incomes in Costa Rica had twice as
large a share of their country’s total income as did the bottom 20% of households in
Panama. That means Costa Rica’s poor were about twice as well off, in material terms, as
Panama’s poor.
Figure 33.1 Poverty and the Distribution of Income: Costa Rica versus Panama
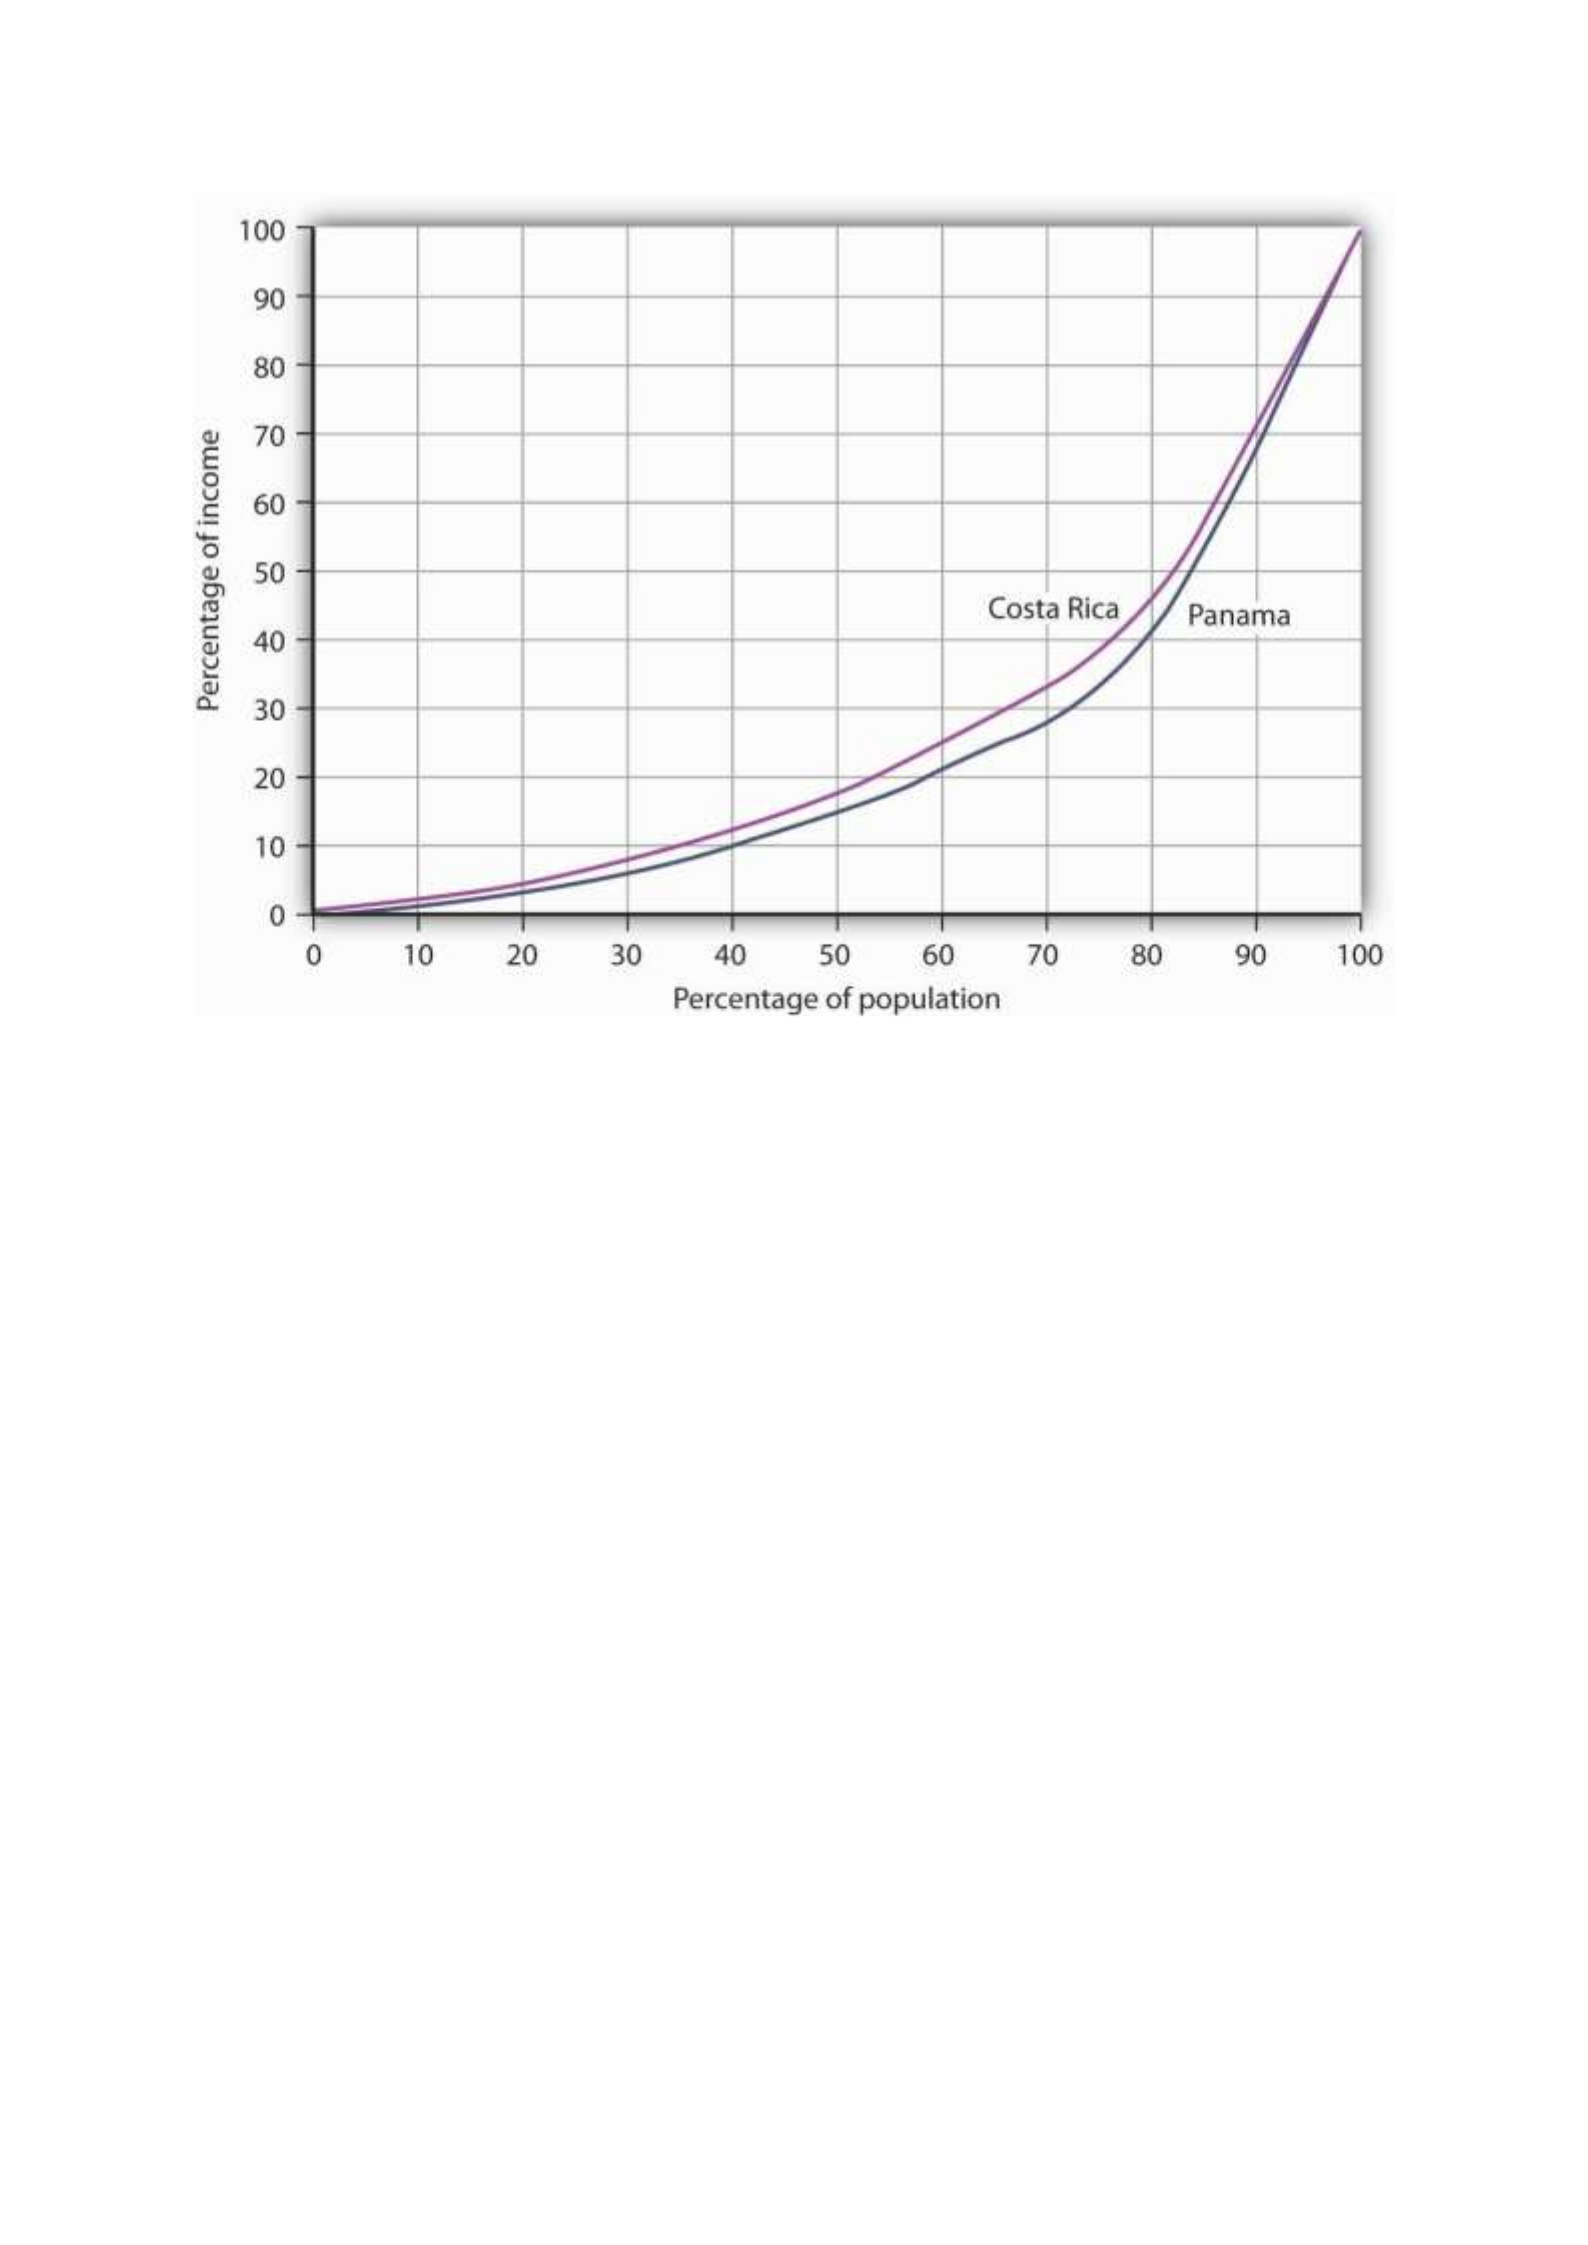
Costa Rica had about the same per capita GNI as Panama in 2003, but Panama’s income
distribution was far more unequal. Panama’s poor had much lower living standards than
Costa Rica’s poor, as suggested by the Lorenz curves for the two nations.
Source: World Development Indicators Online (revised October 17, 2008).
In general, the greater the degree of inequality, the more desperate is the condition of
people at the bottom of an income distribution. Given the high degree of inequality in many
low-income countries, it is very important to look at income distributions when we compare
living standards in different countries.
Health and Education
Poor nations are typically characterized by low levels of human capital. Where health-care
facilities are inadequate, that human capital can be reduced further by disease. Where
educational resources are poor, there will be little progress in improving human capital.
One indicator of poor health care appears on the supply side. Low-income countries have
fewer doctors, relative to their populations, than high-income countries. For example, the
UN estimates that in 2006 about 60% of mothers giving birth in developing countries had
access to a skilled health-care provider (doctor, nurse, or midwife). While that is up from
47% in 1990, the lack of access to a health-care provider may explain much of the difference
in maternal death rates between developed and developing countries: about nine maternal
deaths per 100,000 live births in developed countries compared to about 450 per 100,000 in
developing countries.United Nations, The Millennium Development Goals Report 2008, 27.

We can also see the results of poor health care in statistics on health. Among the world’s
developing countries, the infant mortality rate, which reports deaths in the first year of life,
was 57 per 1,000 live births in 2005. There were six infant deaths per 1,000 live births
among the high-income countries that year.United Nations Development Program, Human
Development Report 2007/2008 (New York: Palgrave Macmillan, 2007), 264.
Another health issue facing the world’s low-income countries is malnutrition. Malnutrition
rates in all developing countries in the 2002 to 2004 period averaged 17%, 35% in the least
developed countries.
Still another issue is the spread of HIV/AIDS. Here there is some progress. The number of
people newly infected declined from 3 million in 2001 to 2.7 million in 2005. Antiretroviral
treatments are also leading to a reduction in deaths from 2.2 million in 2005 to 2 million in
2007. Longer survival means that the number of people living with HIV (from just under 30
million in 2001 to about 33 million in 2007) is rising and most of the people living with HIV
are in Sub-Saharan Africa.United Nations, The Millennium Development Goals Report 2008,
30.
Education in poor and middle-income nations is improving. In 1991, about 80% of children in
developing countries were enrolled in primary schools. In 2005, about 85% were. The
comparable numbers in developed countries are about 95%. Enrollment rates taper off for
high school (about 53% in 2005 in developing countries compared to 91% in developed
countries).United Nations Development Program, Human Development Report
2007/2008 (New York: Palgrave Macmillan, 2007), 272.
Unemployment
Unemployment is pervasive in low-income nations. These nations, already faced with low
levels of potential output, are producing well below their potential. Unemployment rates in
low-income countries vary widely, reaching as high as 15% or more in some countries. If we
count discouraged workers, people who have given up looking for work but who would take
it if it were available, and people who work less than full time, not by choice but because
more work is unavailable, then unemployment in low-income countries soars—often to
more than 30%.
Migration within low-income countries often contributes to unemployment in urban areas.
Factors such as ethnic violence, poverty, and drought often force people to move from rural
areas to cities, where unemployment rates are already high.
Reliance on Agriculture
One of the dominant characteristics of poor nations is the concentration of employment in
agriculture. Another is the very low productivity of that employment. Agriculture in low-
income countries often employs a majority of the population but produces less than one-
third of GDP.

One of the primary forces behind income growth in wealthy countries has been the shift of
labor out of agriculture and into more productive sectors such as manufacturing. This shift is
also occurring in low-income nations but has lagged far behind.
The solution to these problems lies in economic development, to which we turn next.
Economic Development: A Definition
If the problems of low-income nations are pervasive, the development that helps to solve
those problems must transform the very nature of their societies. The late Austrian
economist Joseph Schumpeter described economic development as a revolutionary process.
Whereas economic growth implies quantitative change in production processes that are
already familiar to the society, economic development requires qualitative change in
virtually every aspect of life.
Robert Heilbroner, an economist at the New School for Social Research in New York, has
argued,
“Economic development is political and social change on a wrenching and tearing scale. … It
is a process of institutional birth and institutional death. It is a time when power shifts, often
violently and abruptly, a time when old regimes go under and new ones rise in their places.
And these are not just the unpleasant side effects of development. They are part and parcel
of the process, the very driving force of change itself.”Robert Heilbroner, Between Capitalism
and Socialism (New York: Vintage Books, 1970), 53–54.
Economic development transforms a nation at its core. But what, precisely, is development?
Many definitions follow Heilbroner in noting the massive institutional and cultural changes
economic development involves. But whatever the requirements of development, its
primary characteristics are rising incomes and improving standards of living. That means
output must increase—and it must increase relative to population growth. And because
inequality is so serious a problem in low-income nations, development must deliver
widespread improvement in living conditions. It therefore seems useful to define economic
development as a process that produces sustained and widely shared gains in per capita real
GDP.
In recent years, the United Nations has constructed measures incorporating dimensions of
economic development that go beyond the level of per capita GDP. The Human
Development Index (HDI) includes three dimensions—life expectancy, educational
attainment (adult literacy and combined primary, secondary, and post-secondary
enrollment), as well as purchasing-power-adjusted per capita real GDP. The Gender
Development Index (GDI) uses the same variables as the HDI but adjusts them downward to
take into account the extent of gender inequality. A third index, the Human Poverty Index
(HPI), measures human deprivation and includes such indicators as the percentage of people
expected to die before age 40, the percentage of underweight children under age 5, the
percentage of adults who are illiterate, and the percentage of people who live in poverty.
The number reported for the HPI shows the percentage of people in the country who suffer
these deprivations.


