


Supplement to Lecture 32: Zewail Wavepacket
Experiment
Ahmed Zewail was awarded the 1999 Nobel Prize in Chemistry for “Femtosecond Transition
State (FTS) Spectroscopy.” These experiments were described as the first time that the
mechanisms of real intramolecular dynamics were ”clocked” in real time. In a pump/probe
scheme, a femtosecond pump pulse creates a wavepacket on a repulsive or predissociated
electronically excited V1 potential energy surface at t = 0 by excitation from the v = 0 level of
the electronic ground state, V0 (ability to tune center energy of wavepacket by a small
amount). After each excitation pulse, the time-evolving wavepacket is probed by a
femtosecond pulse with a chosen center wavelength at a time-delay t = τ. This delay time is
scanned, pulse-by-pulse, to determine the time at which the center of the wavepacket
crosses through the “Optically Coupled Region (OCR).” The probe pulse excites a portion of
the wavepacket from the V1 potential surface to a higher energy repulsive potential surface,
V2. The V2 potential surface is repulsive, dissociating to an electronically excited fragment.
The detected signal is the time-integrated ∼ 10 nanosecond lifetime fluorescence from this
excited fragment. The dynamically relevant information is encoded in the intensity vs. τ of
this time-integrated fluorescence, which samples the femtosecond passage of the
wavepacket through the OCR that is selected by the center wavelength of the probe pulse.
The ICN photodissociation experiment shows the effect of the presence of the I atom on the
frequency of the CN B2Σ+ − X2Σ+ electronic transition. As the I atom moves away from the CN
molecule, the energy of the CN electronic excitation increases from its value in the ICN
molecule to that of the free CN molecule. Did we know this before doing the experiment? As
the ICN bond stretches, the electronic structure of the CN moiety changes. This is
mechanism!
The photodissociation of NaI is mediated by a covalent-to-ionic curve crossing. The diabatic
(crossing) potential energy curves (solid lines) are the ones for which the electronic
character does not change rapidly as the molecule traverses the internuclear distance of the
curve crossing. The adiabatic curves (dashed lines), which are what “clamped nuclei”
quantum chemical calculations generate, exhibit a rapid change of electronic character at
the internuclear distance of the avoided crossing. As the molecule moves through the curve-
crossing region, it must decide whether it is going to follow the diabatic or the adiabatic
potential. Landau-Zener theory tells us the velocity-dependence of the probability of
jumping across the energy gap between the ionic and the covalent adiabatic curves. If you
drive too fast, you will be unable to stay on the road on a sharp curve. The sharpness of the
curve is determined by the magnitude of the interaction matrix element between the
diabatic potential curves. A very gentle curvature is the signature of a very large interaction
matrix element. In the Zewail experiments, the velocity in the curve-crossing region can be
systematically slightly adjusted by the choice of the center wavelength of the pump pulse.

At an NaI energy far above that of the curve-crossing, the velocity in the crossing region is
very large and the molecule stays on one of the diabatic potentials, in effect jumping the gap
between adiabatic curves. At an energy near that of the curve crossing, the molecule would
go through the crossing region slowly and stay on one of the adiabatic curves, with the result
that the wave packet that is born covalent, is nearly 100% converted to ionic at the
internuclear distance of the crossing. Zewail’s NaI experiments provide a direct
experimental determination of the internuclear distance of the curve crossing and an
explicit illustration of Landau-Zener theory.
Figure 1: Pump/Probe Scheme for Photodissociation of ICN (Figure 1 of Ref. 24). This is a reduced
dimension representation of three singlet potential energy surfaces of ICN: the bound ground electronic state,
V0 with minimum at Re, an excited unbound state, V1, which dissociates to CN(X2Σ+) and I(2P3/2), and a higher
energy unbound state, which dissociates to CN(B2Σ+) and I(2P3/2). A t = 0 pulse from the pump laser, with center
wavelength λ1, excites a vertical turning-point-to-turning-point (P0 = 0, P1 = 0) transition at R = R0 > Re to the
V1 potential surface. The wavepacket on the V1 potential surface experiences a force in the increasing RI-CN
direction, which causes the PI-CN momentum to increase monotonically with time. At t = τ , a pulse from the
probe laser, with center wavelength probes for the arrival of the wavepacket at RI-CN = R? or R∞ . The
energy of the vertical (ΔR=0) and momentumconserving (ΔP=0) transition also increases monotonically with
time as the wavepacket travels outward on V1. This V2−V1 transition is essentially an excitation of the CN B−X
electronic transition in the presence of the departing I atom. The R= RI-CN = R? Optically Coupled Region (OCR)
is interrogated by a probe pulse with center wavelength , where is the wavelength of the free CN
B−X v0 = 0 − v00 = 0 band. The detected signal is CN B-X spontaneous fluorescence. Reproduced with permission
from Figure 1 in M. J. Rosker, M. Dantus, and A. H. Zewail, “Femtosecond real-time probing of reactions. I. The
technique,”
J. Chem. Phys. 89, 6113–6127 (1988). Copyright 1988, AIP Publishing LLC.
Internuclear Separation

Figure 2: Wavepacket Transit through an Ionic∼Covalent Potential Energy Curve Crossing in NaI
(Figure 1 of Ref. 26). The diabatic (solid lines) Na+,I− and Na,I potential energy curves cross at Rx = 6.93A.˚ The
avoided crossing between the adiabatic potential curves is shown as dashed lines. At t = t0 the 310 nm pump
pulse creates a wavepacket at the inner turning point of the covalent (Na 2S, I2P3/2) potential curve at
R≈Re(X1Σ+) and P= 0. By adjusting the center wavelength of the pump pulse, the center total-energy (electronic
plus vibrational) of the wavepacket can be adjusted between 30,000 and 34,000 cm−1 . The excitation energy
of the ionic∼covalent curve crossing is ∼ 26, 000 cm−1 . The wavepacket is accelerated outward, passes through
the curve-crossing region at t?, and bifurcates, one part traveling on the bound ionic potential and the other
part traveling irreversibly outward on the unbound covalent potential. The ionic part is reflected at tR at the
outer turning point of the ionic potential, passes with P< 0 through the R= 6.93 ˚A curve crossing region where
it bifurcates again, and the resultant ionic and covalent parts are reflected outward at the inner turning points
of the ionic and covalent potential curves, respectively. Each outward passage of a wavepacket through the
curve crossing region results in a wavepacket traveling irreversibly outward on the unbound covalent
potential, eventually forming free Na(2S) and I(2P3/2) atoms. The probe pulse (not shown) interrogates the
dynamics by exciting Na(2S),I(2P3/2) weakly-bound molecules to a higher energy repulsive electronic state that
dissociates to Na(2P) + I(2P3/2) atoms. Excitation at centerwavelength longer than 589 nm samples NaI
molecules en route to full dissociation. Excitation centered at 589 nm provides what is essentially a time-
integrated sample of the accumulation of the free Na(2S) atoms. Reproduced with permission from Figure 1 in
T. S. Rose, M. J. Rosker, and A. H. Zewail, “Femtosecond real-time observations of wave packet oscillations
(resonance) in dissociation reactions,” J. Chem. Phys. 88, 6672–6673 (1988). Copyright 1988, AIP Publishing
LLC.
0
4
R
x
= 6.93Å
COVALENT Na +I
IONIC Na
+
+I
–
t
0
t
*
t
R
R(Å)
10
15
0
2
5
0
5
10
15
20
25
30
35
Energy (10
3
cm
–1
)
FS
pump (
λ
)
FS
probe (t,
λ
)
Na I*
Na
[
…
I]
‡
*
Na
[
……
I]
‡
*
Na + I + E
tr

Figure 3: Clocking of the Photodissociation of NaI (and NaBr) as the Nuclear Wavepacket Repeatedly
Traverses the Ionic/Covalent Curve Crossing (Figure 2 of Ref. 26). The wavepacket, illustrated in Fig. 6.5, is
created at t = t0 at the inner turning point on the covalent excited electronic state. At each outward-bound
traversal of the curve-crossing region, part of the wavepacket follows the covalent adiabatic curve irreversibly
outward to separated Na(2S)+I(2P3/2) atoms. If the probe laser centerwavelength is tuned slightly to the red of
the 589 nm free Na atom 2P←2S transition, each time a wavepacket of incompletely separated Na,I molecules
passes through the Optically Coupled Region, some not quite free Na atoms are excited to the 2P state, from
which spontaneous fluorescence is detected. The series of Na atom fluorescence pulses shown in Spectrum I
samples each outward passage of a wavepacket through the curve-crossing region. The temporal spacing of
the pulses corresponds to a 36 cm−1 vibrational frequency. When the center-wavelength of the probe laser is
tuned to 589 nm, the arrivals of free Na atom wavepackets are displayed in Spectrum II as a periodic series of
upward steps. Spectrum III shows that the (upper) adiabatic potential curve for NaBr is shallower and “leakier”
than that for NaI. Reproduced with permission from Figure 2 in T. S. Rose, M. J. Rosker, and A. H. Zewail,
“Femtosecond real-time observations of wave packet oscillations (resonance) in dissociation reactions,” J.
Chem. Phys. 88, 6672–6673 (1988). Copyright 1988, AIP Publishing LLC. Ahmed Zewail was awarded the
1999 Nobel Prize in Chemistry for “Femtosecond Transition State (FTS) Spectroscopy.”
These experiments were described as the first time that the mechanisms of real
intramolecular dynamics were ”clocked” in real time. In a pump/probe scheme, a
femtosecond pump pulse creates a wavepacket on a repulsive or predissociated
electronically excited V1 potential energy surface at t = 0 by excitation from the v = 0 level of
the electronic ground state, V0 (ability to tune center energy of wavepacket by a small
500
fs
∆t (fs)
III
II

amount). After each excitation pulse, the time-evolving wavepacket is probed by a
femtosecond pulse with a chosen center wavelength at a time-delay t = τ. This delay time is
scanned, pulse-by-pulse, to determine the time at which the center of the wavepacket
crosses through the “Optically Coupled Region (OCR).” The probe pulse excites a portion of
the wavepacket from the V1 potential surface to a higher energy repulsive potential surface,
V2. The V2 potential surface is repulsive, dissociating to an electronically excited fragment.
The detected signal is the time-integrated ∼ 10 nanosecond lifetime fluorescence from this
excited fragment. The dynamically relevant information is encoded in the intensity vs. τ of
this time-integrated fluorescence, which samples the femtosecond passage of the
wavepacket through the OCR that is selected by the center wavelength of the probe pulse.
The ICN photodissociation experiment shows the effect of the presence of the I atom on the
frequency of the CN B2Σ+ − X2Σ+ electronic transition. As the I atom moves away from the CN
molecule, the energy of the CN electronic excitation increases from its value in the ICN
molecule to that of the free CN molecule. Did we know this before doing the experiment? As
the ICN bond stretches, the electronic structure of the CN moiety changes. This is
mechanism!
The photodissociation of NaI is mediated by a covalent-to-ionic curve crossing. The diabatic
(crossing) potential energy curves (solid lines) are the ones for which the electronic
character does not change rapidly as the molecule traverses the internuclear distance of the
curve crossing. The adiabatic curves (dashed lines), which are what “clamped nuclei”
quantum chemical calculations generate, exhibit a rapid change of electronic character at
the internuclear distance of the avoided crossing. As the molecule moves through the curve-
crossing region, it must decide whether it is going to follow the diabatic or the adiabatic
potential. Landau-Zener theory tells us the velocity-dependence of the probability of
jumping across the energy gap between the ionic and the covalent adiabatic curves. If you
drive too fast, you will be unable to stay on the road on a sharp curve. The sharpness of the
curve is determined by the magnitude of the interaction matrix element between the
diabatic potential curves. A very gentle curvature is the signature of a very large interaction
matrix element. In the Zewail experiments, the velocity in the curve-crossing region can be
systematically slightly adjusted by the choice of the center wavelength of the pump pulse.
At an NaI energy far above that of the curve-crossing, the velocity in the crossing region is
very large and the molecule stays on one of the diabatic potentials, in effect jumping the gap
between adiabatic curves. At an energy near that of the curve crossing, the molecule would
go through the crossing region slowly and stay on one of the adiabatic curves, with the result
that the wave packet that is born covalent, is nearly 100% converted to ionic at the
internuclear distance of the crossing. Zewail’s NaI experiments provide a direct
experimental determination of the internuclear distance of the curve crossing and an
explicit illustration of Landau-Zener theory.

Figure 1: Pump/Probe Scheme for Photodissociation of ICN (Figure 1 of Ref. 24). This is a reduced
dimension representation of three singlet potential energy surfaces of ICN: the bound ground electronic state,
V0 with minimum at Re, an excited unbound state, V1, which dissociates to CN(X2Σ+) and I(2P3/2), and a higher
energy unbound state, which dissociates to CN(B2Σ+) and I(2P3/2). A t = 0 pulse from the pump laser, with center
wavelength λ1, excites a vertical turning-point-to-turning-point (P0 = 0, P1 = 0) transition at R = R0 > Re to the
V1 potential surface. The wavepacket on the V1 potential surface experiences a force in the increasing RI-CN
direction, which causes the PI-CN momentum to increase monotonically with time. At t = τ , a pulse from the
probe laser, with center wavelength probes for the arrival of the wavepacket at RI-CN = R? or R∞ . The
energy of the vertical (ΔR=0) and momentumconserving (ΔP=0) transition also increases monotonically with
time as the wavepacket travels outward on V1. This V2−V1 transition is essentially an excitation of the CN B−X
electronic transition in the presence of the departing I atom. The R= RI-CN = R? Optically Coupled Region (OCR)
is interrogated by a probe pulse with center wavelength , where is the wavelength of the free CN
B−X v0 = 0 − v00 = 0 band. The detected signal is CN B-X spontaneous fluorescence. Reproduced with permission
from Figure 1 in M. J. Rosker, M. Dantus, and A. H. Zewail, “Femtosecond real-time probing of reactions. I. The
technique,”
J. Chem. Phys. 89, 6113–6127 (1988). Copyright 1988, AIP Publishing LLC.
Internuclear Separation

Figure 2: Wavepacket Transit through an Ionic∼Covalent Potential Energy Curve Crossing in NaI
(Figure 1 of Ref. 26). The diabatic (solid lines) Na+,I− and Na,I potential energy curves cross at Rx = 6.93A.˚ The
avoided crossing between the adiabatic potential curves is shown as dashed lines. At t = t0 the 310 nm pump
pulse creates a wavepacket at the inner turning point of the covalent (Na 2S, I2P3/2) potential curve at
R≈Re(X1Σ+) and P= 0. By adjusting the center wavelength of the pump pulse, the center total-energy (electronic
plus vibrational) of the wavepacket can be adjusted between 30,000 and 34,000 cm−1 . The excitation energy
of the ionic∼covalent curve crossing is ∼ 26, 000 cm−1 . The wavepacket is accelerated outward, passes through
the curve-crossing region at t?, and bifurcates, one part traveling on the bound ionic potential and the other
part traveling irreversibly outward on the unbound covalent potential. The ionic part is reflected at tR at the
outer turning point of the ionic potential, passes with P< 0 through the R= 6.93 ˚A curve crossing region where
it bifurcates again, and the resultant ionic and covalent parts are reflected outward at the inner turning points
of the ionic and covalent potential curves, respectively. Each outward passage of a wavepacket through the
curve crossing region results in a wavepacket traveling irreversibly outward on the unbound covalent
potential, eventually forming free Na(2S) and I(2P3/2) atoms. The probe pulse (not shown) interrogates the
dynamics by exciting Na(2S),I(2P3/2) weakly-bound molecules to a higher energy repulsive electronic state that
dissociates to Na(2P) + I(2P3/2) atoms. Excitation at centerwavelength longer than 589 nm samples NaI
molecules en route to full dissociation. Excitation centered at 589 nm provides what is essentially a time-
integrated sample of the accumulation of the free Na(2S) atoms. Reproduced with permission from Figure 1 in
T. S. Rose, M. J. Rosker, and A. H. Zewail, “Femtosecond real-time observations of wave packet oscillations
(resonance) in dissociation reactions,” J. Chem. Phys. 88, 6672–6673 (1988). Copyright 1988, AIP Publishing
LLC.
0
4
R
x
= 6.93Å
COVALENT Na +I
IONIC Na
+
+I
–
t
0
t
*
t
R
R(Å)
10
15
0
2
5
0
5
10
15
20
25
30
35
Energy (10
3
cm
–1
)
FS
pump (
λ
)
FS
probe (t,
λ
)
Na I*
Na
[
…
I]
‡
*
Na
[
……
I]
‡
*
Na + I + E
tr

Figure 3: Clocking of the Photodissociation of NaI (and NaBr) as the Nuclear Wavepacket Repeatedly
Traverses the Ionic/Covalent Curve Crossing (Figure 2 of Ref. 26). The wavepacket, illustrated in Fig. 6.5, is
created at t = t0 at the inner turning point on the covalent excited electronic state. At each outward-bound
traversal of the curve-crossing region, part of the wavepacket follows the covalent adiabatic curve irreversibly
outward to separated Na(2S)+I(2P3/2) atoms. If the probe laser centerwavelength is tuned slightly to the red of
the 589 nm free Na atom 2P←2S transition, each time a wavepacket of incompletely separated Na,I molecules
passes through the Optically Coupled Region, some not quite free Na atoms are excited to the 2P state, from
which spontaneous fluorescence is detected. The series of Na atom fluorescence pulses shown in Spectrum I
samples each outward passage of a wavepacket through the curve-crossing region. The temporal spacing of
the pulses corresponds to a 36 cm−1 vibrational frequency. When the center-wavelength of the probe laser is
tuned to 589 nm, the arrivals of free Na atom wavepackets are displayed in Spectrum II as a periodic series of
upward steps. Spectrum III shows that the (upper) adiabatic potential curve for NaBr is shallower and “leakier”
than that for NaI. Reproduced with permission from Figure 2 in T. S. Rose, M. J. Rosker, and A. H. Zewail,
“Femtosecond real-time observations of wave packet oscillations (resonance) in dissociation reactions,” J.
Chem. Phys. 88, 6672–6673 (1988). Copyright 1988, AIP Publishing LLC.
Ahmed Zewail was awarded the 1999 Nobel Prize in Chemistry for “Femtosecond Transition
State (FTS) Spectroscopy.” These experiments were described as the first time that the
mechanisms of real intramolecular dynamics were ”clocked” in real time. In a pump/probe
scheme, a femtosecond pump pulse creates a wavepacket on a repulsive or predissociated
electronically excited V1 potential energy surface at t = 0 by excitation from the v = 0 level of
the electronic ground state, V0 (ability to tune center energy of wavepacket by a small
500
fs
∆t (fs)
III
II

amount). After each excitation pulse, the time-evolving wavepacket is probed by a
femtosecond pulse with a chosen center wavelength at a time-delay t = τ. This delay time is
scanned, pulse-by-pulse, to determine the time at which the center of the wavepacket
crosses through the “Optically Coupled Region (OCR).” The probe pulse excites a portion of
the wavepacket from the V1 potential surface to a higher energy repulsive potential surface,
V2. The V2 potential surface is repulsive, dissociating to an electronically excited fragment.
The detected signal is the time-integrated ∼ 10 nanosecond lifetime fluorescence from this
excited fragment. The dynamically relevant information is encoded in the intensity vs. τ of
this time-integrated fluorescence, which samples the femtosecond passage of the
wavepacket through the OCR that is selected by the center wavelength of the probe pulse.
The ICN photodissociation experiment shows the effect of the presence of the I atom on the
frequency of the CN B2Σ+ − X2Σ+ electronic transition. As the I atom moves away from the CN
molecule, the energy of the CN electronic excitation increases from its value in the ICN
molecule to that of the free CN molecule. Did we know this before doing the experiment? As
the ICN bond stretches, the electronic structure of the CN moiety changes. This is
mechanism!
The photodissociation of NaI is mediated by a covalent-to-ionic curve crossing. The diabatic
(crossing) potential energy curves (solid lines) are the ones for which the electronic
character does not change rapidly as the molecule traverses the internuclear distance of the
curve crossing. The adiabatic curves (dashed lines), which are what “clamped nuclei”
quantum chemical calculations generate, exhibit a rapid change of electronic character at
the internuclear distance of the avoided crossing. As the molecule moves through the curve-
crossing region, it must decide whether it is going to follow the diabatic or the adiabatic
potential. Landau-Zener theory tells us the velocity-dependence of the probability of
jumping across the energy gap between the ionic and the covalent adiabatic curves. If you
drive too fast, you will be unable to stay on the road on a sharp curve. The sharpness of the
curve is determined by the magnitude of the interaction matrix element between the
diabatic potential curves. A very gentle curvature is the signature of a very large interaction
matrix element. In the Zewail experiments, the velocity in the curve-crossing region can be
systematically slightly adjusted by the choice of the center wavelength of the pump pulse.
At an NaI energy far above that of the curve-crossing, the velocity in the crossing region is
very large and the molecule stays on one of the diabatic potentials, in effect jumping the gap
between adiabatic curves. At an energy near that of the curve crossing, the molecule would
go through the crossing region slowly and stay on one of the adiabatic curves, with the result
that the wave packet that is born covalent, is nearly 100% converted to ionic at the
internuclear distance of the crossing. Zewail’s NaI experiments provide a direct
experimental determination of the internuclear distance of the curve crossing and an
explicit illustration of Landau-Zener theory.

Figure 1: Pump/Probe Scheme for Photodissociation of ICN (Figure 1 of Ref. 24). This is a reduced
dimension representation of three singlet potential energy surfaces of ICN: the bound ground electronic state,
V0 with minimum at Re, an excited unbound state, V1, which dissociates to CN(X2Σ+) and I(2P3/2), and a higher
energy unbound state, which dissociates to CN(B2Σ+) and I(2P3/2). A t = 0 pulse from the pump laser, with center
wavelength λ1, excites a vertical turning-point-to-turning-point (P0 = 0, P1 = 0) transition at R = R0 > Re to the
V1 potential surface. The wavepacket on the V1 potential surface experiences a force in the increasing RI-CN
direction, which causes the PI-CN momentum to increase monotonically with time. At t = τ , a pulse from the
probe laser, with center wavelength probes for the arrival of the wavepacket at RI-CN = R? or R∞ . The
energy of the vertical (ΔR=0) and momentumconserving (ΔP=0) transition also increases monotonically with
time as the wavepacket travels outward on V1. This V2−V1 transition is essentially an excitation of the CN B−X
electronic transition in the presence of the departing I atom. The R= RI-CN = R? Optically Coupled Region (OCR)
is interrogated by a probe pulse with center wavelength , where is the wavelength of the free CN
B−X v0 = 0 − v00 = 0 band. The detected signal is CN B-X spontaneous fluorescence. Reproduced with permission
from Figure 1 in M. J. Rosker, M. Dantus, and A. H. Zewail, “Femtosecond real-time probing of reactions. I. The
technique,”
J. Chem. Phys. 89, 6113–6127 (1988). Copyright 1988, AIP Publishing LLC.
Internuclear Separation

Figure 2: Wavepacket Transit through an Ionic∼Covalent Potential Energy Curve Crossing in NaI
(Figure 1 of Ref. 26). The diabatic (solid lines) Na+,I− and Na,I potential energy curves cross at Rx = 6.93A.˚ The
avoided crossing between the adiabatic potential curves is shown as dashed lines. At t = t0 the 310 nm pump
pulse creates a wavepacket at the inner turning point of the covalent (Na 2S, I2P3/2) potential curve at
R≈Re(X1Σ+) and P= 0. By adjusting the center wavelength of the pump pulse, the center total-energy (electronic
plus vibrational) of the wavepacket can be adjusted between 30,000 and 34,000 cm−1 . The excitation energy
of the ionic∼covalent curve crossing is ∼ 26, 000 cm−1 . The wavepacket is accelerated outward, passes through
the curve-crossing region at t?, and bifurcates, one part traveling on the bound ionic potential and the other
part traveling irreversibly outward on the unbound covalent potential. The ionic part is reflected at tR at the
outer turning point of the ionic potential, passes with P< 0 through the R= 6.93 ˚A curve crossing region where
it bifurcates again, and the resultant ionic and covalent parts are reflected outward at the inner turning points
of the ionic and covalent potential curves, respectively. Each outward passage of a wavepacket through the
curve crossing region results in a wavepacket traveling irreversibly outward on the unbound covalent
potential, eventually forming free Na(2S) and I(2P3/2) atoms. The probe pulse (not shown) interrogates the
dynamics by exciting Na(2S),I(2P3/2) weakly-bound molecules to a higher energy repulsive electronic state that
dissociates to Na(2P) + I(2P3/2) atoms. Excitation at centerwavelength longer than 589 nm samples NaI
molecules en route to full dissociation. Excitation centered at 589 nm provides what is essentially a time-
integrated sample of the accumulation of the free Na(2S) atoms. Reproduced with permission from Figure 1 in
T. S. Rose, M. J. Rosker, and A. H. Zewail, “Femtosecond real-time observations of wave packet oscillations
(resonance) in dissociation reactions,” J. Chem. Phys. 88, 6672–6673 (1988). Copyright 1988, AIP Publishing
LLC.
0
4
R
x
= 6.93Å
COVALENT Na +I
IONIC Na
+
+I
–
t
0
t
*
t
R
R(Å)
10
15
0
2
5
0
5
10
15
20
25
30
35
Energy (10
3
cm
–1
)
FS
pump (
λ
)
FS
probe (t,
λ
)
Na I*
Na
[
…
I]
‡
*
Na
[
……
I]
‡
*
Na + I + E
tr

Figure 3: Clocking of the Photodissociation of NaI (and NaBr) as the Nuclear Wavepacket Repeatedly
Traverses the Ionic/Covalent Curve Crossing (Figure 2 of Ref. 26). The wavepacket, illustrated in Fig. 6.5, is
created at t = t0 at the inner turning point on the covalent excited electronic state. At each outward-bound
traversal of the curve-crossing region, part of the wavepacket follows the covalent adiabatic curve irreversibly
outward to separated Na(2S)+I(2P3/2) atoms. If the probe laser centerwavelength is tuned slightly to the red of
the 589 nm free Na atom 2P←2S transition, each time a wavepacket of incompletely separated Na,I molecules
passes through the Optically Coupled Region, some not quite free Na atoms are excited to the 2P state, from
which spontaneous fluorescence is detected. The series of Na atom fluorescence pulses shown in Spectrum I
samples each outward passage of a wavepacket through the curve-crossing region. The temporal spacing of
the pulses corresponds to a 36 cm−1 vibrational frequency. When the center-wavelength of the probe laser is
tuned to 589 nm, the arrivals of free Na atom wavepackets are displayed in Spectrum II as a periodic series of
upward steps. Spectrum III shows that the (upper) adiabatic potential curve for NaBr is shallower and “leakier”
than that for NaI. Reproduced with permission from Figure 2 in T. S. Rose, M. J. Rosker, and A. H. Zewail,
“Femtosecond real-time observations of wave packet oscillations (resonance) in dissociation reactions,” J.
Chem. Phys. 88, 6672–6673 (1988). Copyright 1988, AIP Publishing LLC.
Ahmed Zewail was awarded the 1999 Nobel Prize in Chemistry for “Femtosecond Transition
State (FTS) Spectroscopy.” These experiments were described as the first time that the
mechanisms of real intramolecular dynamics were ”clocked” in real time. In a pump/probe
scheme, a femtosecond pump pulse creates a wavepacket on a repulsive or predissociated
electronically excited V1 potential energy surface at t = 0 by excitation from the v = 0 level of
the electronic ground state, V0 (ability to tune center energy of wavepacket by a small
500
fs
∆t (fs)
III
II

amount). After each excitation pulse, the time-evolving wavepacket is probed by a
femtosecond pulse with a chosen center wavelength at a time-delay t = τ. This delay time is
scanned, pulse-by-pulse, to determine the time at which the center of the wavepacket
crosses through the “Optically Coupled Region (OCR).” The probe pulse excites a portion of
the wavepacket from the V1 potential surface to a higher energy repulsive potential surface,
V2. The V2 potential surface is repulsive, dissociating to an electronically excited fragment.
The detected signal is the time-integrated ∼ 10 nanosecond lifetime fluorescence from this
excited fragment. The dynamically relevant information is encoded in the intensity vs. τ of
this time-integrated fluorescence, which samples the femtosecond passage of the
wavepacket through the OCR that is selected by the center wavelength of the probe pulse.
The ICN photodissociation experiment shows the effect of the presence of the I atom on the
frequency of the CN B2Σ+ − X2Σ+ electronic transition. As the I atom moves away from the CN
molecule, the energy of the CN electronic excitation increases from its value in the ICN
molecule to that of the free CN molecule. Did we know this before doing the experiment? As
the ICN bond stretches, the electronic structure of the CN moiety changes. This is
mechanism!
The photodissociation of NaI is mediated by a covalent-to-ionic curve crossing. The diabatic
(crossing) potential energy curves (solid lines) are the ones for which the electronic
character does not change rapidly as the molecule traverses the internuclear distance of the
curve crossing. The adiabatic curves (dashed lines), which are what “clamped nuclei”
quantum chemical calculations generate, exhibit a rapid change of electronic character at
the internuclear distance of the avoided crossing. As the molecule moves through the curve-
crossing region, it must decide whether it is going to follow the diabatic or the adiabatic
potential. Landau-Zener theory tells us the velocity-dependence of the probability of
jumping across the energy gap between the ionic and the covalent adiabatic curves. If you
drive too fast, you will be unable to stay on the road on a sharp curve. The sharpness of the
curve is determined by the magnitude of the interaction matrix element between the
diabatic potential curves. A very gentle curvature is the signature of a very large interaction
matrix element. In the Zewail experiments, the velocity in the curve-crossing region can be
systematically slightly adjusted by the choice of the center wavelength of the pump pulse.
At an NaI energy far above that of the curve-crossing, the velocity in the crossing region is
very large and the molecule stays on one of the diabatic potentials, in effect jumping the gap
between adiabatic curves. At an energy near that of the curve crossing, the molecule would
go through the crossing region slowly and stay on one of the adiabatic curves, with the result
that the wave packet that is born covalent, is nearly 100% converted to ionic at the
internuclear distance of the crossing. Zewail’s NaI experiments provide a direct
experimental determination of the internuclear distance of the curve crossing and an
explicit illustration of Landau-Zener theory.

Figure 1: Pump/Probe Scheme for Photodissociation of ICN (Figure 1 of Ref. 24). This is a reduced
dimension representation of three singlet potential energy surfaces of ICN: the bound ground electronic state,
V0 with minimum at Re, an excited unbound state, V1, which dissociates to CN(X2Σ+) and I(2P3/2), and a higher
energy unbound state, which dissociates to CN(B2Σ+) and I(2P3/2). A t = 0 pulse from the pump laser, with center
wavelength λ1, excites a vertical turning-point-to-turning-point (P0 = 0, P1 = 0) transition at R = R0 > Re to the
V1 potential surface. The wavepacket on the V1 potential surface experiences a force in the increasing RI-CN
direction, which causes the PI-CN momentum to increase monotonically with time. At t = τ , a pulse from the
probe laser, with center wavelength probes for the arrival of the wavepacket at RI-CN = R? or R∞ . The
energy of the vertical (ΔR=0) and momentumconserving (ΔP=0) transition also increases monotonically with
time as the wavepacket travels outward on V1. This V2−V1 transition is essentially an excitation of the CN B−X
electronic transition in the presence of the departing I atom. The R= RI-CN = R? Optically Coupled Region (OCR)
is interrogated by a probe pulse with center wavelength , where is the wavelength of the free CN
B−X v0 = 0 − v00 = 0 band. The detected signal is CN B-X spontaneous fluorescence. Reproduced with permission
from Figure 1 in M. J. Rosker, M. Dantus, and A. H. Zewail, “Femtosecond real-time probing of reactions. I. The
technique,”
J. Chem. Phys. 89, 6113–6127 (1988). Copyright 1988, AIP Publishing LLC.
Internuclear Separation

Figure 2: Wavepacket Transit through an Ionic∼Covalent Potential Energy Curve Crossing in NaI
(Figure 1 of Ref. 26). The diabatic (solid lines) Na+,I− and Na,I potential energy curves cross at Rx = 6.93A.˚ The
avoided crossing between the adiabatic potential curves is shown as dashed lines. At t = t0 the 310 nm pump
pulse creates a wavepacket at the inner turning point of the covalent (Na 2S, I2P3/2) potential curve at
R≈Re(X1Σ+) and P= 0. By adjusting the center wavelength of the pump pulse, the center total-energy (electronic
plus vibrational) of the wavepacket can be adjusted between 30,000 and 34,000 cm−1 . The excitation energy
of the ionic∼covalent curve crossing is ∼ 26, 000 cm−1 . The wavepacket is accelerated outward, passes through
the curve-crossing region at t?, and bifurcates, one part traveling on the bound ionic potential and the other
part traveling irreversibly outward on the unbound covalent potential. The ionic part is reflected at tR at the
outer turning point of the ionic potential, passes with P< 0 through the R= 6.93 ˚A curve crossing region where
it bifurcates again, and the resultant ionic and covalent parts are reflected outward at the inner turning points
of the ionic and covalent potential curves, respectively. Each outward passage of a wavepacket through the
curve crossing region results in a wavepacket traveling irreversibly outward on the unbound covalent
potential, eventually forming free Na(2S) and I(2P3/2) atoms. The probe pulse (not shown) interrogates the
dynamics by exciting Na(2S),I(2P3/2) weakly-bound molecules to a higher energy repulsive electronic state that
dissociates to Na(2P) + I(2P3/2) atoms. Excitation at centerwavelength longer than 589 nm samples NaI
molecules en route to full dissociation. Excitation centered at 589 nm provides what is essentially a time-
integrated sample of the accumulation of the free Na(2S) atoms. Reproduced with permission from Figure 1 in
T. S. Rose, M. J. Rosker, and A. H. Zewail, “Femtosecond real-time observations of wave packet oscillations
(resonance) in dissociation reactions,” J. Chem. Phys. 88, 6672–6673 (1988). Copyright 1988, AIP Publishing
LLC.
0
4
R
x
= 6.93Å
COVALENT Na +I
IONIC Na
+
+I
–
t
0
t
*
t
R
R(Å)
10
15
0
2
5
0
5
10
15
20
25
30
35
Energy (10
3
cm
–1
)
FS
pump (
λ
)
FS
probe (t,
λ
)
Na I*
Na
[
…
I]
‡
*
Na
[
……
I]
‡
*
Na + I + E
tr

Figure 3: Clocking of the Photodissociation of NaI (and NaBr) as the Nuclear Wavepacket Repeatedly
Traverses the Ionic/Covalent Curve Crossing (Figure 2 of Ref. 26). The wavepacket, illustrated in Fig. 6.5, is
created at t = t0 at the inner turning point on the covalent excited electronic state. At each outward-bound
traversal of the curve-crossing region, part of the wavepacket follows the covalent adiabatic curve irreversibly
outward to separated Na(2S)+I(2P3/2) atoms. If the probe laser centerwavelength is tuned slightly to the red of
the 589 nm free Na atom 2P←2S transition, each time a wavepacket of incompletely separated Na,I molecules
passes through the Optically Coupled Region, some not quite free Na atoms are excited to the 2P state, from
which spontaneous fluorescence is detected. The series of Na atom fluorescence pulses shown in Spectrum I
samples each outward passage of a wavepacket through the curve-crossing region. The temporal spacing of
the pulses corresponds to a 36 cm−1 vibrational frequency. When the center-wavelength of the probe laser is
tuned to 589 nm, the arrivals of free Na atom wavepackets are displayed in Spectrum II as a periodic series of
upward steps. Spectrum III shows that the (upper) adiabatic potential curve for NaBr is shallower and “leakier”
than that for NaI. Reproduced with permission from Figure 2 in T. S. Rose, M. J. Rosker, and A. H. Zewail,
“Femtosecond real-time observations of wave packet oscillations (resonance) in dissociation reactions,” J.
Chem. Phys. 88, 6672–6673 (1988). Copyright 1988, AIP Publishing LLC.
Ahmed Zewail was awarded the 1999 Nobel Prize in Chemistry for “Femtosecond Transition
State (FTS) Spectroscopy.” These experiments were described as the first time that the
mechanisms of real intramolecular dynamics were ”clocked” in real time. In a pump/probe
scheme, a femtosecond pump pulse creates a wavepacket on a repulsive or predissociated
electronically excited V1 potential energy surface at t = 0 by excitation from the v = 0 level of
the electronic ground state, V0 (ability to tune center energy of wavepacket by a small
500
fs
∆t (fs)
III
II

amount). After each excitation pulse, the time-evolving wavepacket is probed by a
femtosecond pulse with a chosen center wavelength at a time-delay t = τ. This delay time is
scanned, pulse-by-pulse, to determine the time at which the center of the wavepacket
crosses through the “Optically Coupled Region (OCR).” The probe pulse excites a portion of
the wavepacket from the V1 potential surface to a higher energy repulsive potential surface,
V2. The V2 potential surface is repulsive, dissociating to an electronically excited fragment.
The detected signal is the time-integrated ∼ 10 nanosecond lifetime fluorescence from this
excited fragment. The dynamically relevant information is encoded in the intensity vs. τ of
this time-integrated fluorescence, which samples the femtosecond passage of the
wavepacket through the OCR that is selected by the center wavelength of the probe pulse.
The ICN photodissociation experiment shows the effect of the presence of the I atom on the
frequency of the CN B2Σ+ − X2Σ+ electronic transition. As the I atom moves away from the CN
molecule, the energy of the CN electronic excitation increases from its value in the ICN
molecule to that of the free CN molecule. Did we know this before doing the experiment? As
the ICN bond stretches, the electronic structure of the CN moiety changes. This is
mechanism!
The photodissociation of NaI is mediated by a covalent-to-ionic curve crossing. The diabatic
(crossing) potential energy curves (solid lines) are the ones for which the electronic
character does not change rapidly as the molecule traverses the internuclear distance of the
curve crossing. The adiabatic curves (dashed lines), which are what “clamped nuclei”
quantum chemical calculations generate, exhibit a rapid change of electronic character at
the internuclear distance of the avoided crossing. As the molecule moves through the curve-
crossing region, it must decide whether it is going to follow the diabatic or the adiabatic
potential. Landau-Zener theory tells us the velocity-dependence of the probability of
jumping across the energy gap between the ionic and the covalent adiabatic curves. If you
drive too fast, you will be unable to stay on the road on a sharp curve. The sharpness of the
curve is determined by the magnitude of the interaction matrix element between the
diabatic potential curves. A very gentle curvature is the signature of a very large interaction
matrix element. In the Zewail experiments, the velocity in the curve-crossing region can be
systematically slightly adjusted by the choice of the center wavelength of the pump pulse.
At an NaI energy far above that of the curve-crossing, the velocity in the crossing region is
very large and the molecule stays on one of the diabatic potentials, in effect jumping the gap
between adiabatic curves. At an energy near that of the curve crossing, the molecule would
go through the crossing region slowly and stay on one of the adiabatic curves, with the result
that the wave packet that is born covalent, is nearly 100% converted to ionic at the
internuclear distance of the crossing. Zewail’s NaI experiments provide a direct
experimental determination of the internuclear distance of the curve crossing and an
explicit illustration of Landau-Zener theory.

Figure 1: Pump/Probe Scheme for Photodissociation of ICN (Figure 1 of Ref. 24). This is a reduced
dimension representation of three singlet potential energy surfaces of ICN: the bound ground electronic state,
V0 with minimum at Re, an excited unbound state, V1, which dissociates to CN(X2Σ+) and I(2P3/2), and a higher
energy unbound state, which dissociates to CN(B2Σ+) and I(2P3/2). A t = 0 pulse from the pump laser, with center
wavelength λ1, excites a vertical turning-point-to-turning-point (P0 = 0, P1 = 0) transition at R = R0 > Re to the
V1 potential surface. The wavepacket on the V1 potential surface experiences a force in the increasing RI-CN
direction, which causes the PI-CN momentum to increase monotonically with time. At t = τ , a pulse from the
probe laser, with center wavelength probes for the arrival of the wavepacket at RI-CN = R? or R∞ . The
energy of the vertical (ΔR=0) and momentumconserving (ΔP=0) transition also increases monotonically with
time as the wavepacket travels outward on V1. This V2−V1 transition is essentially an excitation of the CN B−X
electronic transition in the presence of the departing I atom. The R= RI-CN = R? Optically Coupled Region (OCR)
is interrogated by a probe pulse with center wavelength , where is the wavelength of the free CN
B−X v0 = 0 − v00 = 0 band. The detected signal is CN B-X spontaneous fluorescence. Reproduced with permission
from Figure 1 in M. J. Rosker, M. Dantus, and A. H. Zewail, “Femtosecond real-time probing of reactions. I. The
technique,”
J. Chem. Phys. 89, 6113–6127 (1988). Copyright 1988, AIP Publishing LLC.
Internuclear Separation

Figure 2: Wavepacket Transit through an Ionic∼Covalent Potential Energy Curve Crossing in NaI
(Figure 1 of Ref. 26). The diabatic (solid lines) Na+,I− and Na,I potential energy curves cross at Rx = 6.93A.˚ The
avoided crossing between the adiabatic potential curves is shown as dashed lines. At t = t0 the 310 nm pump
pulse creates a wavepacket at the inner turning point of the covalent (Na 2S, I2P3/2) potential curve at
R≈Re(X1Σ+) and P= 0. By adjusting the center wavelength of the pump pulse, the center total-energy (electronic
plus vibrational) of the wavepacket can be adjusted between 30,000 and 34,000 cm−1 . The excitation energy
of the ionic∼covalent curve crossing is ∼ 26, 000 cm−1 . The wavepacket is accelerated outward, passes through
the curve-crossing region at t?, and bifurcates, one part traveling on the bound ionic potential and the other
part traveling irreversibly outward on the unbound covalent potential. The ionic part is reflected at tR at the
outer turning point of the ionic potential, passes with P< 0 through the R= 6.93 ˚A curve crossing region where
it bifurcates again, and the resultant ionic and covalent parts are reflected outward at the inner turning points
of the ionic and covalent potential curves, respectively. Each outward passage of a wavepacket through the
curve crossing region results in a wavepacket traveling irreversibly outward on the unbound covalent
potential, eventually forming free Na(2S) and I(2P3/2) atoms. The probe pulse (not shown) interrogates the
dynamics by exciting Na(2S),I(2P3/2) weakly-bound molecules to a higher energy repulsive electronic state that
dissociates to Na(2P) + I(2P3/2) atoms. Excitation at centerwavelength longer than 589 nm samples NaI
molecules en route to full dissociation. Excitation centered at 589 nm provides what is essentially a time-
integrated sample of the accumulation of the free Na(2S) atoms. Reproduced with permission from Figure 1 in
T. S. Rose, M. J. Rosker, and A. H. Zewail, “Femtosecond real-time observations of wave packet oscillations
(resonance) in dissociation reactions,” J. Chem. Phys. 88, 6672–6673 (1988). Copyright 1988, AIP Publishing
LLC.
0
4
R
x
= 6.93Å
COVALENT Na +I
IONIC Na
+
+I
–
t
0
t
*
t
R
R(Å)
10
15
0
2
5
0
5
10
15
20
25
30
35
Energy (10
3
cm
–1
)
FS
pump (
λ
)
FS
probe (t,
λ
)
Na I*
Na
[
…
I]
‡
*
Na
[
……
I]
‡
*
Na + I + E
tr

Figure 3: Clocking of the Photodissociation of NaI (and NaBr) as the Nuclear Wavepacket Repeatedly
Traverses the Ionic/Covalent Curve Crossing (Figure 2 of Ref. 26). The wavepacket, illustrated in Fig. 6.5, is
created at t = t0 at the inner turning point on the covalent excited electronic state. At each outward-bound
traversal of the curve-crossing region, part of the wavepacket follows the covalent adiabatic curve irreversibly
outward to separated Na(2S)+I(2P3/2) atoms. If the probe laser centerwavelength is tuned slightly to the red of
the 589 nm free Na atom 2P←2S transition, each time a wavepacket of incompletely separated Na,I molecules
passes through the Optically Coupled Region, some not quite free Na atoms are excited to the 2P state, from
which spontaneous fluorescence is detected. The series of Na atom fluorescence pulses shown in Spectrum I
samples each outward passage of a wavepacket through the curve-crossing region. The temporal spacing of
the pulses corresponds to a 36 cm−1 vibrational frequency. When the center-wavelength of the probe laser is
tuned to 589 nm, the arrivals of free Na atom wavepackets are displayed in Spectrum II as a periodic series of
upward steps. Spectrum III shows that the (upper) adiabatic potential curve for NaBr is shallower and “leakier”
than that for NaI. Reproduced with permission from Figure 2 in T. S. Rose, M. J. Rosker, and A. H. Zewail,
“Femtosecond real-time observations of wave packet oscillations (resonance) in dissociation reactions,” J.
Chem. Phys. 88, 6672–6673 (1988). Copyright 1988, AIP Publishing LLC. Ahmed Zewail was awarded the
1999 Nobel Prize in Chemistry for “Femtosecond Transition State (FTS) Spectroscopy.”
These experiments were described as the first time that the mechanisms of real
intramolecular dynamics were ”clocked” in real time. In a pump/probe scheme, a
femtosecond pump pulse creates a wavepacket on a repulsive or predissociated
electronically excited V1 potential energy surface at t = 0 by excitation from the v = 0 level of
the electronic ground state, V0 (ability to tune center energy of wavepacket by a small
500
fs
∆t (fs)
III
II

amount). After each excitation pulse, the time-evolving wavepacket is probed by a
femtosecond pulse with a chosen center wavelength at a time-delay t = τ. This delay time is
scanned, pulse-by-pulse, to determine the time at which the center of the wavepacket
crosses through the “Optically Coupled Region (OCR).” The probe pulse excites a portion of
the wavepacket from the V1 potential surface to a higher energy repulsive potential surface,
V2. The V2 potential surface is repulsive, dissociating to an electronically excited fragment.
The detected signal is the time-integrated ∼ 10 nanosecond lifetime fluorescence from this
excited fragment. The dynamically relevant information is encoded in the intensity vs. τ of
this time-integrated fluorescence, which samples the femtosecond passage of the
wavepacket through the OCR that is selected by the center wavelength of the probe pulse.
The ICN photodissociation experiment shows the effect of the presence of the I atom on the
frequency of the CN B2Σ+ − X2Σ+ electronic transition. As the I atom moves away from the CN
molecule, the energy of the CN electronic excitation increases from its value in the ICN
molecule to that of the free CN molecule. Did we know this before doing the experiment? As
the ICN bond stretches, the electronic structure of the CN moiety changes. This is
mechanism!
The photodissociation of NaI is mediated by a covalent-to-ionic curve crossing. The diabatic
(crossing) potential energy curves (solid lines) are the ones for which the electronic
character does not change rapidly as the molecule traverses the internuclear distance of the
curve crossing. The adiabatic curves (dashed lines), which are what “clamped nuclei”
quantum chemical calculations generate, exhibit a rapid change of electronic character at
the internuclear distance of the avoided crossing. As the molecule moves through the curve-
crossing region, it must decide whether it is going to follow the diabatic or the adiabatic
potential. Landau-Zener theory tells us the velocity-dependence of the probability of
jumping across the energy gap between the ionic and the covalent adiabatic curves. If you
drive too fast, you will be unable to stay on the road on a sharp curve. The sharpness of the
curve is determined by the magnitude of the interaction matrix element between the
diabatic potential curves. A very gentle curvature is the signature of a very large interaction
matrix element. In the Zewail experiments, the velocity in the curve-crossing region can be
systematically slightly adjusted by the choice of the center wavelength of the pump pulse.
At an NaI energy far above that of the curve-crossing, the velocity in the crossing region is
very large and the molecule stays on one of the diabatic potentials, in effect jumping the gap
between adiabatic curves. At an energy near that of the curve crossing, the molecule would
go through the crossing region slowly and stay on one of the adiabatic curves, with the result
that the wave packet that is born covalent, is nearly 100% converted to ionic at the
internuclear distance of the crossing. Zewail’s NaI experiments provide a direct
experimental determination of the internuclear distance of the curve crossing and an
explicit illustration of Landau-Zener theory.

Figure 1: Pump/Probe Scheme for Photodissociation of ICN (Figure 1 of Ref. 24). This is a reduced
dimension representation of three singlet potential energy surfaces of ICN: the bound ground electronic state,
V0 with minimum at Re, an excited unbound state, V1, which dissociates to CN(X2Σ+) and I(2P3/2), and a higher
energy unbound state, which dissociates to CN(B2Σ+) and I(2P3/2). A t = 0 pulse from the pump laser, with center
wavelength λ1, excites a vertical turning-point-to-turning-point (P0 = 0, P1 = 0) transition at R = R0 > Re to the
V1 potential surface. The wavepacket on the V1 potential surface experiences a force in the increasing RI-CN
direction, which causes the PI-CN momentum to increase monotonically with time. At t = τ , a pulse from the
probe laser, with center wavelength probes for the arrival of the wavepacket at RI-CN = R? or R∞ . The
energy of the vertical (ΔR=0) and momentumconserving (ΔP=0) transition also increases monotonically with
time as the wavepacket travels outward on V1. This V2−V1 transition is essentially an excitation of the CN B−X
electronic transition in the presence of the departing I atom. The R= RI-CN = R? Optically Coupled Region (OCR)
is interrogated by a probe pulse with center wavelength , where is the wavelength of the free CN
B−X v0 = 0 − v00 = 0 band. The detected signal is CN B-X spontaneous fluorescence. Reproduced with permission
from Figure 1 in M. J. Rosker, M. Dantus, and A. H. Zewail, “Femtosecond real-time probing of reactions. I. The
technique,”
J. Chem. Phys. 89, 6113–6127 (1988). Copyright 1988, AIP Publishing LLC.
Internuclear Separation

Figure 2: Wavepacket Transit through an Ionic∼Covalent Potential Energy Curve Crossing in NaI
(Figure 1 of Ref. 26). The diabatic (solid lines) Na+,I− and Na,I potential energy curves cross at Rx = 6.93A.˚ The
avoided crossing between the adiabatic potential curves is shown as dashed lines. At t = t0 the 310 nm pump
pulse creates a wavepacket at the inner turning point of the covalent (Na 2S, I2P3/2) potential curve at
R≈Re(X1Σ+) and P= 0. By adjusting the center wavelength of the pump pulse, the center total-energy (electronic
plus vibrational) of the wavepacket can be adjusted between 30,000 and 34,000 cm−1 . The excitation energy
of the ionic∼covalent curve crossing is ∼ 26, 000 cm−1 . The wavepacket is accelerated outward, passes through
the curve-crossing region at t?, and bifurcates, one part traveling on the bound ionic potential and the other
part traveling irreversibly outward on the unbound covalent potential. The ionic part is reflected at tR at the
outer turning point of the ionic potential, passes with P< 0 through the R= 6.93 ˚A curve crossing region where
it bifurcates again, and the resultant ionic and covalent parts are reflected outward at the inner turning points
of the ionic and covalent potential curves, respectively. Each outward passage of a wavepacket through the
curve crossing region results in a wavepacket traveling irreversibly outward on the unbound covalent
potential, eventually forming free Na(2S) and I(2P3/2) atoms. The probe pulse (not shown) interrogates the
dynamics by exciting Na(2S),I(2P3/2) weakly-bound molecules to a higher energy repulsive electronic state that
dissociates to Na(2P) + I(2P3/2) atoms. Excitation at centerwavelength longer than 589 nm samples NaI
molecules en route to full dissociation. Excitation centered at 589 nm provides what is essentially a time-
integrated sample of the accumulation of the free Na(2S) atoms. Reproduced with permission from Figure 1 in
T. S. Rose, M. J. Rosker, and A. H. Zewail, “Femtosecond real-time observations of wave packet oscillations
(resonance) in dissociation reactions,” J. Chem. Phys. 88, 6672–6673 (1988). Copyright 1988, AIP Publishing
LLC.
0
4
R
x
= 6.93Å
COVALENT Na +I
IONIC Na
+
+I
–
t
0
t
*
t
R
R(Å)
10
15
0
2
5
0
5
10
15
20
25
30
35
Energy (10
3
cm
–1
)
FS
pump (
λ
)
FS
probe (t,
λ
)
Na I*
Na
[
…
I]
‡
*
Na
[
……
I]
‡
*
Na + I + E
tr

Figure 3: Clocking of the Photodissociation of NaI (and NaBr) as the Nuclear Wavepacket Repeatedly
Traverses the Ionic/Covalent Curve Crossing (Figure 2 of Ref. 26). The wavepacket, illustrated in Fig. 6.5, is
created at t = t0 at the inner turning point on the covalent excited electronic state. At each outward-bound
traversal of the curve-crossing region, part of the wavepacket follows the covalent adiabatic curve irreversibly
outward to separated Na(2S)+I(2P3/2) atoms. If the probe laser centerwavelength is tuned slightly to the red of
the 589 nm free Na atom 2P←2S transition, each time a wavepacket of incompletely separated Na,I molecules
passes through the Optically Coupled Region, some not quite free Na atoms are excited to the 2P state, from
which spontaneous fluorescence is detected. The series of Na atom fluorescence pulses shown in Spectrum I
samples each outward passage of a wavepacket through the curve-crossing region. The temporal spacing of
the pulses corresponds to a 36 cm−1 vibrational frequency. When the center-wavelength of the probe laser is
tuned to 589 nm, the arrivals of free Na atom wavepackets are displayed in Spectrum II as a periodic series of
upward steps. Spectrum III shows that the (upper) adiabatic potential curve for NaBr is shallower and “leakier”
than that for NaI. Reproduced with permission from Figure 2 in T. S. Rose, M. J. Rosker, and A. H. Zewail,
“Femtosecond real-time observations of wave packet oscillations (resonance) in dissociation reactions,” J.
Chem. Phys. 88, 6672–6673 (1988). Copyright 1988, AIP Publishing LLC.
Ahmed Zewail was awarded the 1999 Nobel Prize in Chemistry for “Femtosecond Transition
State (FTS) Spectroscopy.” These experiments were described as the first time that the
mechanisms of real intramolecular dynamics were ”clocked” in real time. In a pump/probe
scheme, a femtosecond pump pulse creates a wavepacket on a repulsive or predissociated
electronically excited V1 potential energy surface at t = 0 by excitation from the v = 0 level of
the electronic ground state, V0 (ability to tune center energy of wavepacket by a small
500
fs
∆t (fs)
III
II

amount). After each excitation pulse, the time-evolving wavepacket is probed by a
femtosecond pulse with a chosen center wavelength at a time-delay t = τ. This delay time is
scanned, pulse-by-pulse, to determine the time at which the center of the wavepacket
crosses through the “Optically Coupled Region (OCR).” The probe pulse excites a portion of
the wavepacket from the V1 potential surface to a higher energy repulsive potential surface,
V2. The V2 potential surface is repulsive, dissociating to an electronically excited fragment.
The detected signal is the time-integrated ∼ 10 nanosecond lifetime fluorescence from this
excited fragment. The dynamically relevant information is encoded in the intensity vs. τ of
this time-integrated fluorescence, which samples the femtosecond passage of the
wavepacket through the OCR that is selected by the center wavelength of the probe pulse.
The ICN photodissociation experiment shows the effect of the presence of the I atom on the
frequency of the CN B2Σ+ − X2Σ+ electronic transition. As the I atom moves away from the CN
molecule, the energy of the CN electronic excitation increases from its value in the ICN
molecule to that of the free CN molecule. Did we know this before doing the experiment? As
the ICN bond stretches, the electronic structure of the CN moiety changes. This is
mechanism!
The photodissociation of NaI is mediated by a covalent-to-ionic curve crossing. The diabatic
(crossing) potential energy curves (solid lines) are the ones for which the electronic
character does not change rapidly as the molecule traverses the internuclear distance of the
curve crossing. The adiabatic curves (dashed lines), which are what “clamped nuclei”
quantum chemical calculations generate, exhibit a rapid change of electronic character at
the internuclear distance of the avoided crossing. As the molecule moves through the curve-
crossing region, it must decide whether it is going to follow the diabatic or the adiabatic
potential. Landau-Zener theory tells us the velocity-dependence of the probability of
jumping across the energy gap between the ionic and the covalent adiabatic curves. If you
drive too fast, you will be unable to stay on the road on a sharp curve. The sharpness of the
curve is determined by the magnitude of the interaction matrix element between the
diabatic potential curves. A very gentle curvature is the signature of a very large interaction
matrix element. In the Zewail experiments, the velocity in the curve-crossing region can be
systematically slightly adjusted by the choice of the center wavelength of the pump pulse.
At an NaI energy far above that of the curve-crossing, the velocity in the crossing region is
very large and the molecule stays on one of the diabatic potentials, in effect jumping the gap
between adiabatic curves. At an energy near that of the curve crossing, the molecule would
go through the crossing region slowly and stay on one of the adiabatic curves, with the result
that the wave packet that is born covalent, is nearly 100% converted to ionic at the
internuclear distance of the crossing. Zewail’s NaI experiments provide a direct
experimental determination of the internuclear distance of the curve crossing and an
explicit illustration of Landau-Zener theory.

Figure 1: Pump/Probe Scheme for Photodissociation of ICN (Figure 1 of Ref. 24). This is a reduced
dimension representation of three singlet potential energy surfaces of ICN: the bound ground electronic state,
V0 with minimum at Re, an excited unbound state, V1, which dissociates to CN(X2Σ+) and I(2P3/2), and a higher
energy unbound state, which dissociates to CN(B2Σ+) and I(2P3/2). A t = 0 pulse from the pump laser, with center
wavelength λ1, excites a vertical turning-point-to-turning-point (P0 = 0, P1 = 0) transition at R = R0 > Re to the
V1 potential surface. The wavepacket on the V1 potential surface experiences a force in the increasing RI-CN
direction, which causes the PI-CN momentum to increase monotonically with time. At t = τ , a pulse from the
probe laser, with center wavelength probes for the arrival of the wavepacket at RI-CN = R? or R∞ . The
energy of the vertical (ΔR=0) and momentumconserving (ΔP=0) transition also increases monotonically with
time as the wavepacket travels outward on V1. This V2−V1 transition is essentially an excitation of the CN B−X
electronic transition in the presence of the departing I atom. The R= RI-CN = R? Optically Coupled Region (OCR)
is interrogated by a probe pulse with center wavelength , where is the wavelength of the free CN
B−X v0 = 0 − v00 = 0 band. The detected signal is CN B-X spontaneous fluorescence. Reproduced with permission
from Figure 1 in M. J. Rosker, M. Dantus, and A. H. Zewail, “Femtosecond real-time probing of reactions. I. The
technique,”
J. Chem. Phys. 89, 6113–6127 (1988). Copyright 1988, AIP Publishing LLC.
Internuclear Separation

Figure 2: Wavepacket Transit through an Ionic∼Covalent Potential Energy Curve Crossing in NaI
(Figure 1 of Ref. 26). The diabatic (solid lines) Na+,I− and Na,I potential energy curves cross at Rx = 6.93A.˚ The
avoided crossing between the adiabatic potential curves is shown as dashed lines. At t = t0 the 310 nm pump
pulse creates a wavepacket at the inner turning point of the covalent (Na 2S, I2P3/2) potential curve at
R≈Re(X1Σ+) and P= 0. By adjusting the center wavelength of the pump pulse, the center total-energy (electronic
plus vibrational) of the wavepacket can be adjusted between 30,000 and 34,000 cm−1 . The excitation energy
of the ionic∼covalent curve crossing is ∼ 26, 000 cm−1 . The wavepacket is accelerated outward, passes through
the curve-crossing region at t?, and bifurcates, one part traveling on the bound ionic potential and the other
part traveling irreversibly outward on the unbound covalent potential. The ionic part is reflected at tR at the
outer turning point of the ionic potential, passes with P< 0 through the R= 6.93 ˚A curve crossing region where
it bifurcates again, and the resultant ionic and covalent parts are reflected outward at the inner turning points
of the ionic and covalent potential curves, respectively. Each outward passage of a wavepacket through the
curve crossing region results in a wavepacket traveling irreversibly outward on the unbound covalent
potential, eventually forming free Na(2S) and I(2P3/2) atoms. The probe pulse (not shown) interrogates the
dynamics by exciting Na(2S),I(2P3/2) weakly-bound molecules to a higher energy repulsive electronic state that
dissociates to Na(2P) + I(2P3/2) atoms. Excitation at centerwavelength longer than 589 nm samples NaI
molecules en route to full dissociation. Excitation centered at 589 nm provides what is essentially a time-
integrated sample of the accumulation of the free Na(2S) atoms. Reproduced with permission from Figure 1 in
T. S. Rose, M. J. Rosker, and A. H. Zewail, “Femtosecond real-time observations of wave packet oscillations
(resonance) in dissociation reactions,” J. Chem. Phys. 88, 6672–6673 (1988). Copyright 1988, AIP Publishing
LLC.
0
4
R
x
= 6.93Å
COVALENT Na +I
IONIC Na
+
+I
–
t
0
t
*
t
R
R(Å)
10
15
0
2
5
0
5
10
15
20
25
30
35
Energy (10
3
cm
–1
)
FS
pump (
λ
)
FS
probe (t,
λ
)
Na I*
Na
[
…
I]
‡
*
Na
[
……
I]
‡
*
Na + I + E
tr

Figure 3: Clocking of the Photodissociation of NaI (and NaBr) as the Nuclear Wavepacket Repeatedly
Traverses the Ionic/Covalent Curve Crossing (Figure 2 of Ref. 26). The wavepacket, illustrated in Fig. 6.5, is
created at t = t0 at the inner turning point on the covalent excited electronic state. At each outward-bound
traversal of the curve-crossing region, part of the wavepacket follows the covalent adiabatic curve irreversibly
outward to separated Na(2S)+I(2P3/2) atoms. If the probe laser centerwavelength is tuned slightly to the red of
the 589 nm free Na atom 2P←2S transition, each time a wavepacket of incompletely separated Na,I molecules
passes through the Optically Coupled Region, some not quite free Na atoms are excited to the 2P state, from
which spontaneous fluorescence is detected. The series of Na atom fluorescence pulses shown in Spectrum I
samples each outward passage of a wavepacket through the curve-crossing region. The temporal spacing of
the pulses corresponds to a 36 cm−1 vibrational frequency. When the center-wavelength of the probe laser is
tuned to 589 nm, the arrivals of free Na atom wavepackets are displayed in Spectrum II as a periodic series of
upward steps. Spectrum III shows that the (upper) adiabatic potential curve for NaBr is shallower and “leakier”
than that for NaI. Reproduced with permission from Figure 2 in T. S. Rose, M. J. Rosker, and A. H. Zewail,
“Femtosecond real-time observations of wave packet oscillations (resonance) in dissociation reactions,” J.
Chem. Phys. 88, 6672–6673 (1988). Copyright 1988, AIP Publishing LLC.
Ahmed Zewail was awarded the 1999 Nobel Prize in Chemistry for “Femtosecond Transition
State (FTS) Spectroscopy.” These experiments were described as the first time that the
mechanisms of real intramolecular dynamics were ”clocked” in real time. In a pump/probe
scheme, a femtosecond pump pulse creates a wavepacket on a repulsive or predissociated
electronically excited V1 potential energy surface at t = 0 by excitation from the v = 0 level of
the electronic ground state, V0 (ability to tune center energy of wavepacket by a small
500
fs
∆t (fs)
III
II

amount). After each excitation pulse, the time-evolving wavepacket is probed by a
femtosecond pulse with a chosen center wavelength at a time-delay t = τ. This delay time is
scanned, pulse-by-pulse, to determine the time at which the center of the wavepacket
crosses through the “Optically Coupled Region (OCR).” The probe pulse excites a portion of
the wavepacket from the V1 potential surface to a higher energy repulsive potential surface,
V2. The V2 potential surface is repulsive, dissociating to an electronically excited fragment.
The detected signal is the time-integrated ∼ 10 nanosecond lifetime fluorescence from this
excited fragment. The dynamically relevant information is encoded in the intensity vs. τ of
this time-integrated fluorescence, which samples the femtosecond passage of the
wavepacket through the OCR that is selected by the center wavelength of the probe pulse.
The ICN photodissociation experiment shows the effect of the presence of the I atom on the
frequency of the CN B2Σ+ − X2Σ+ electronic transition. As the I atom moves away from the CN
molecule, the energy of the CN electronic excitation increases from its value in the ICN
molecule to that of the free CN molecule. Did we know this before doing the experiment? As
the ICN bond stretches, the electronic structure of the CN moiety changes. This is
mechanism!
The photodissociation of NaI is mediated by a covalent-to-ionic curve crossing. The diabatic
(crossing) potential energy curves (solid lines) are the ones for which the electronic
character does not change rapidly as the molecule traverses the internuclear distance of the
curve crossing. The adiabatic curves (dashed lines), which are what “clamped nuclei”
quantum chemical calculations generate, exhibit a rapid change of electronic character at
the internuclear distance of the avoided crossing. As the molecule moves through the curve-
crossing region, it must decide whether it is going to follow the diabatic or the adiabatic
potential. Landau-Zener theory tells us the velocity-dependence of the probability of
jumping across the energy gap between the ionic and the covalent adiabatic curves. If you
drive too fast, you will be unable to stay on the road on a sharp curve. The sharpness of the
curve is determined by the magnitude of the interaction matrix element between the
diabatic potential curves. A very gentle curvature is the signature of a very large interaction
matrix element. In the Zewail experiments, the velocity in the curve-crossing region can be
systematically slightly adjusted by the choice of the center wavelength of the pump pulse.
At an NaI energy far above that of the curve-crossing, the velocity in the crossing region is
very large and the molecule stays on one of the diabatic potentials, in effect jumping the gap
between adiabatic curves. At an energy near that of the curve crossing, the molecule would
go through the crossing region slowly and stay on one of the adiabatic curves, with the result
that the wave packet that is born covalent, is nearly 100% converted to ionic at the
internuclear distance of the crossing. Zewail’s NaI experiments provide a direct
experimental determination of the internuclear distance of the curve crossing and an
explicit illustration of Landau-Zener theory.

Figure 1: Pump/Probe Scheme for Photodissociation of ICN (Figure 1 of Ref. 24). This is a reduced
dimension representation of three singlet potential energy surfaces of ICN: the bound ground electronic state,
V0 with minimum at Re, an excited unbound state, V1, which dissociates to CN(X2Σ+) and I(2P3/2), and a higher
energy unbound state, which dissociates to CN(B2Σ+) and I(2P3/2). A t = 0 pulse from the pump laser, with center
wavelength λ1, excites a vertical turning-point-to-turning-point (P0 = 0, P1 = 0) transition at R = R0 > Re to the
V1 potential surface. The wavepacket on the V1 potential surface experiences a force in the increasing RI-CN
direction, which causes the PI-CN momentum to increase monotonically with time. At t = τ , a pulse from the
probe laser, with center wavelength probes for the arrival of the wavepacket at RI-CN = R? or R∞ . The
energy of the vertical (ΔR=0) and momentumconserving (ΔP=0) transition also increases monotonically with
time as the wavepacket travels outward on V1. This V2−V1 transition is essentially an excitation of the CN B−X
electronic transition in the presence of the departing I atom. The R= RI-CN = R? Optically Coupled Region (OCR)
is interrogated by a probe pulse with center wavelength , where is the wavelength of the free CN
B−X v0 = 0 − v00 = 0 band. The detected signal is CN B-X spontaneous fluorescence. Reproduced with permission
from Figure 1 in M. J. Rosker, M. Dantus, and A. H. Zewail, “Femtosecond real-time probing of reactions. I. The
technique,”
J. Chem. Phys. 89, 6113–6127 (1988). Copyright 1988, AIP Publishing LLC.
Internuclear Separation

Figure 2: Wavepacket Transit through an Ionic∼Covalent Potential Energy Curve Crossing in NaI
(Figure 1 of Ref. 26). The diabatic (solid lines) Na+,I− and Na,I potential energy curves cross at Rx = 6.93A.˚ The
avoided crossing between the adiabatic potential curves is shown as dashed lines. At t = t0 the 310 nm pump
pulse creates a wavepacket at the inner turning point of the covalent (Na 2S, I2P3/2) potential curve at
R≈Re(X1Σ+) and P= 0. By adjusting the center wavelength of the pump pulse, the center total-energy (electronic
plus vibrational) of the wavepacket can be adjusted between 30,000 and 34,000 cm−1 . The excitation energy
of the ionic∼covalent curve crossing is ∼ 26, 000 cm−1 . The wavepacket is accelerated outward, passes through
the curve-crossing region at t?, and bifurcates, one part traveling on the bound ionic potential and the other
part traveling irreversibly outward on the unbound covalent potential. The ionic part is reflected at tR at the
outer turning point of the ionic potential, passes with P< 0 through the R= 6.93 ˚A curve crossing region where
it bifurcates again, and the resultant ionic and covalent parts are reflected outward at the inner turning points
of the ionic and covalent potential curves, respectively. Each outward passage of a wavepacket through the
curve crossing region results in a wavepacket traveling irreversibly outward on the unbound covalent
potential, eventually forming free Na(2S) and I(2P3/2) atoms. The probe pulse (not shown) interrogates the
dynamics by exciting Na(2S),I(2P3/2) weakly-bound molecules to a higher energy repulsive electronic state that
dissociates to Na(2P) + I(2P3/2) atoms. Excitation at centerwavelength longer than 589 nm samples NaI
molecules en route to full dissociation. Excitation centered at 589 nm provides what is essentially a time-
integrated sample of the accumulation of the free Na(2S) atoms. Reproduced with permission from Figure 1 in
T. S. Rose, M. J. Rosker, and A. H. Zewail, “Femtosecond real-time observations of wave packet oscillations
(resonance) in dissociation reactions,” J. Chem. Phys. 88, 6672–6673 (1988). Copyright 1988, AIP Publishing
LLC.
0
4
R
x
= 6.93Å
COVALENT Na +I
IONIC Na
+
+I
–
t
0
t
*
t
R
R(Å)
10
15
0
2
5
0
5
10
15
20
25
30
35
Energy (10
3
cm
–1
)
FS
pump (
λ
)
FS
probe (t,
λ
)
Na I*
Na
[
…
I]
‡
*
Na
[
……
I]
‡
*
Na + I + E
tr

Figure 3: Clocking of the Photodissociation of NaI (and NaBr) as the Nuclear Wavepacket Repeatedly
Traverses the Ionic/Covalent Curve Crossing (Figure 2 of Ref. 26). The wavepacket, illustrated in Fig. 6.5, is
created at t = t0 at the inner turning point on the covalent excited electronic state. At each outward-bound
traversal of the curve-crossing region, part of the wavepacket follows the covalent adiabatic curve irreversibly
outward to separated Na(2S)+I(2P3/2) atoms. If the probe laser centerwavelength is tuned slightly to the red of
the 589 nm free Na atom 2P←2S transition, each time a wavepacket of incompletely separated Na,I molecules
passes through the Optically Coupled Region, some not quite free Na atoms are excited to the 2P state, from
which spontaneous fluorescence is detected. The series of Na atom fluorescence pulses shown in Spectrum I
samples each outward passage of a wavepacket through the curve-crossing region. The temporal spacing of
the pulses corresponds to a 36 cm−1 vibrational frequency. When the center-wavelength of the probe laser is
tuned to 589 nm, the arrivals of free Na atom wavepackets are displayed in Spectrum II as a periodic series of
upward steps. Spectrum III shows that the (upper) adiabatic potential curve for NaBr is shallower and “leakier”
than that for NaI. Reproduced with permission from Figure 2 in T. S. Rose, M. J. Rosker, and A. H. Zewail,
“Femtosecond real-time observations of wave packet oscillations (resonance) in dissociation reactions,” J.
Chem. Phys. 88, 6672–6673 (1988). Copyright 1988, AIP Publishing LLC.
Ahmed Zewail was awarded the 1999 Nobel Prize in Chemistry for “Femtosecond Transition
State (FTS) Spectroscopy.” These experiments were described as the first time that the
mechanisms of real intramolecular dynamics were ”clocked” in real time. In a pump/probe
scheme, a femtosecond pump pulse creates a wavepacket on a repulsive or predissociated
electronically excited V1 potential energy surface at t = 0 by excitation from the v = 0 level of
the electronic ground state, V0 (ability to tune center energy of wavepacket by a small
500
fs
∆t (fs)
III
II

amount). After each excitation pulse, the time-evolving wavepacket is probed by a
femtosecond pulse with a chosen center wavelength at a time-delay t = τ. This delay time is
scanned, pulse-by-pulse, to determine the time at which the center of the wavepacket
crosses through the “Optically Coupled Region (OCR).” The probe pulse excites a portion of
the wavepacket from the V1 potential surface to a higher energy repulsive potential surface,
V2. The V2 potential surface is repulsive, dissociating to an electronically excited fragment.
The detected signal is the time-integrated ∼ 10 nanosecond lifetime fluorescence from this
excited fragment. The dynamically relevant information is encoded in the intensity vs. τ of
this time-integrated fluorescence, which samples the femtosecond passage of the
wavepacket through the OCR that is selected by the center wavelength of the probe pulse.
The ICN photodissociation experiment shows the effect of the presence of the I atom on the
frequency of the CN B2Σ+ − X2Σ+ electronic transition. As the I atom moves away from the CN
molecule, the energy of the CN electronic excitation increases from its value in the ICN
molecule to that of the free CN molecule. Did we know this before doing the experiment? As
the ICN bond stretches, the electronic structure of the CN moiety changes. This is
mechanism!
The photodissociation of NaI is mediated by a covalent-to-ionic curve crossing. The diabatic
(crossing) potential energy curves (solid lines) are the ones for which the electronic
character does not change rapidly as the molecule traverses the internuclear distance of the
curve crossing. The adiabatic curves (dashed lines), which are what “clamped nuclei”
quantum chemical calculations generate, exhibit a rapid change of electronic character at
the internuclear distance of the avoided crossing. As the molecule moves through the curve-
crossing region, it must decide whether it is going to follow the diabatic or the adiabatic
potential. Landau-Zener theory tells us the velocity-dependence of the probability of
jumping across the energy gap between the ionic and the covalent adiabatic curves. If you
drive too fast, you will be unable to stay on the road on a sharp curve. The sharpness of the
curve is determined by the magnitude of the interaction matrix element between the
diabatic potential curves. A very gentle curvature is the signature of a very large interaction
matrix element. In the Zewail experiments, the velocity in the curve-crossing region can be
systematically slightly adjusted by the choice of the center wavelength of the pump pulse.
At an NaI energy far above that of the curve-crossing, the velocity in the crossing region is
very large and the molecule stays on one of the diabatic potentials, in effect jumping the gap
between adiabatic curves. At an energy near that of the curve crossing, the molecule would
go through the crossing region slowly and stay on one of the adiabatic curves, with the result
that the wave packet that is born covalent, is nearly 100% converted to ionic at the
internuclear distance of the crossing. Zewail’s NaI experiments provide a direct
experimental determination of the internuclear distance of the curve crossing and an
explicit illustration of Landau-Zener theory.

Figure 1: Pump/Probe Scheme for Photodissociation of ICN (Figure 1 of Ref. 24). This is a reduced
dimension representation of three singlet potential energy surfaces of ICN: the bound ground electronic state,
V0 with minimum at Re, an excited unbound state, V1, which dissociates to CN(X2Σ+) and I(2P3/2), and a higher
energy unbound state, which dissociates to CN(B2Σ+) and I(2P3/2). A t = 0 pulse from the pump laser, with center
wavelength λ1, excites a vertical turning-point-to-turning-point (P0 = 0, P1 = 0) transition at R = R0 > Re to the
V1 potential surface. The wavepacket on the V1 potential surface experiences a force in the increasing RI-CN
direction, which causes the PI-CN momentum to increase monotonically with time. At t = τ , a pulse from the
probe laser, with center wavelength probes for the arrival of the wavepacket at RI-CN = R? or R∞ . The
energy of the vertical (ΔR=0) and momentumconserving (ΔP=0) transition also increases monotonically with
time as the wavepacket travels outward on V1. This V2−V1 transition is essentially an excitation of the CN B−X
electronic transition in the presence of the departing I atom. The R= RI-CN = R? Optically Coupled Region (OCR)
is interrogated by a probe pulse with center wavelength , where is the wavelength of the free CN
B−X v0 = 0 − v00 = 0 band. The detected signal is CN B-X spontaneous fluorescence. Reproduced with permission
from Figure 1 in M. J. Rosker, M. Dantus, and A. H. Zewail, “Femtosecond real-time probing of reactions. I. The
technique,”
J. Chem. Phys. 89, 6113–6127 (1988). Copyright 1988, AIP Publishing LLC.
Internuclear Separation

Figure 2: Wavepacket Transit through an Ionic∼Covalent Potential Energy Curve Crossing in NaI
(Figure 1 of Ref. 26). The diabatic (solid lines) Na+,I− and Na,I potential energy curves cross at Rx = 6.93A.˚ The
avoided crossing between the adiabatic potential curves is shown as dashed lines. At t = t0 the 310 nm pump
pulse creates a wavepacket at the inner turning point of the covalent (Na 2S, I2P3/2) potential curve at
R≈Re(X1Σ+) and P= 0. By adjusting the center wavelength of the pump pulse, the center total-energy (electronic
plus vibrational) of the wavepacket can be adjusted between 30,000 and 34,000 cm−1 . The excitation energy
of the ionic∼covalent curve crossing is ∼ 26, 000 cm−1 . The wavepacket is accelerated outward, passes through
the curve-crossing region at t?, and bifurcates, one part traveling on the bound ionic potential and the other
part traveling irreversibly outward on the unbound covalent potential. The ionic part is reflected at tR at the
outer turning point of the ionic potential, passes with P< 0 through the R= 6.93 ˚A curve crossing region where
it bifurcates again, and the resultant ionic and covalent parts are reflected outward at the inner turning points
of the ionic and covalent potential curves, respectively. Each outward passage of a wavepacket through the
curve crossing region results in a wavepacket traveling irreversibly outward on the unbound covalent
potential, eventually forming free Na(2S) and I(2P3/2) atoms. The probe pulse (not shown) interrogates the
dynamics by exciting Na(2S),I(2P3/2) weakly-bound molecules to a higher energy repulsive electronic state that
dissociates to Na(2P) + I(2P3/2) atoms. Excitation at centerwavelength longer than 589 nm samples NaI
molecules en route to full dissociation. Excitation centered at 589 nm provides what is essentially a time-
integrated sample of the accumulation of the free Na(2S) atoms. Reproduced with permission from Figure 1 in
T. S. Rose, M. J. Rosker, and A. H. Zewail, “Femtosecond real-time observations of wave packet oscillations
(resonance) in dissociation reactions,” J. Chem. Phys. 88, 6672–6673 (1988). Copyright 1988, AIP Publishing
LLC.
0
4
R
x
= 6.93Å
COVALENT Na +I
IONIC Na
+
+I
–
t
0
t
*
t
R
R(Å)
10
15
0
2
5
0
5
10
15
20
25
30
35
Energy (10
3
cm
–1
)
FS
pump (
λ
)
FS
probe (t,
λ
)
Na I*
Na
[
…
I]
‡
*
Na
[
……
I]
‡
*
Na + I + E
tr

Figure 3: Clocking of the Photodissociation of NaI (and NaBr) as the Nuclear Wavepacket Repeatedly
Traverses the Ionic/Covalent Curve Crossing (Figure 2 of Ref. 26). The wavepacket, illustrated in Fig. 6.5, is
created at t = t0 at the inner turning point on the covalent excited electronic state. At each outward-bound
traversal of the curve-crossing region, part of the wavepacket follows the covalent adiabatic curve irreversibly
outward to separated Na(2S)+I(2P3/2) atoms. If the probe laser centerwavelength is tuned slightly to the red of
the 589 nm free Na atom 2P←2S transition, each time a wavepacket of incompletely separated Na,I molecules
passes through the Optically Coupled Region, some not quite free Na atoms are excited to the 2P state, from
which spontaneous fluorescence is detected. The series of Na atom fluorescence pulses shown in Spectrum I
samples each outward passage of a wavepacket through the curve-crossing region. The temporal spacing of
the pulses corresponds to a 36 cm−1 vibrational frequency. When the center-wavelength of the probe laser is
tuned to 589 nm, the arrivals of free Na atom wavepackets are displayed in Spectrum II as a periodic series of
upward steps. Spectrum III shows that the (upper) adiabatic potential curve for NaBr is shallower and “leakier”
than that for NaI. Reproduced with permission from Figure 2 in T. S. Rose, M. J. Rosker, and A. H. Zewail,
“Femtosecond real-time observations of wave packet oscillations (resonance) in dissociation reactions,” J.
Chem. Phys. 88, 6672–6673 (1988). Copyright 1988, AIP Publishing LLC. Ahmed Zewail was awarded the
1999 Nobel Prize in Chemistry for “Femtosecond Transition State (FTS) Spectroscopy.”
These experiments were described as the first time that the mechanisms of real
intramolecular dynamics were ”clocked” in real time. In a pump/probe scheme, a
femtosecond pump pulse creates a wavepacket on a repulsive or predissociated
electronically excited V1 potential energy surface at t = 0 by excitation from the v = 0 level of
the electronic ground state, V0 (ability to tune center energy of wavepacket by a small
500
fs
∆t (fs)
III
II

amount). After each excitation pulse, the time-evolving wavepacket is probed by a
femtosecond pulse with a chosen center wavelength at a time-delay t = τ. This delay time is
scanned, pulse-by-pulse, to determine the time at which the center of the wavepacket
crosses through the “Optically Coupled Region (OCR).” The probe pulse excites a portion of
the wavepacket from the V1 potential surface to a higher energy repulsive potential surface,
V2. The V2 potential surface is repulsive, dissociating to an electronically excited fragment.
The detected signal is the time-integrated ∼ 10 nanosecond lifetime fluorescence from this
excited fragment. The dynamically relevant information is encoded in the intensity vs. τ of
this time-integrated fluorescence, which samples the femtosecond passage of the
wavepacket through the OCR that is selected by the center wavelength of the probe pulse.
The ICN photodissociation experiment shows the effect of the presence of the I atom on the
frequency of the CN B2Σ+ − X2Σ+ electronic transition. As the I atom moves away from the CN
molecule, the energy of the CN electronic excitation increases from its value in the ICN
molecule to that of the free CN molecule. Did we know this before doing the experiment? As
the ICN bond stretches, the electronic structure of the CN moiety changes. This is
mechanism!
The photodissociation of NaI is mediated by a covalent-to-ionic curve crossing. The diabatic
(crossing) potential energy curves (solid lines) are the ones for which the electronic
character does not change rapidly as the molecule traverses the internuclear distance of the
curve crossing. The adiabatic curves (dashed lines), which are what “clamped nuclei”
quantum chemical calculations generate, exhibit a rapid change of electronic character at
the internuclear distance of the avoided crossing. As the molecule moves through the curve-
crossing region, it must decide whether it is going to follow the diabatic or the adiabatic
potential. Landau-Zener theory tells us the velocity-dependence of the probability of
jumping across the energy gap between the ionic and the covalent adiabatic curves. If you
drive too fast, you will be unable to stay on the road on a sharp curve. The sharpness of the
curve is determined by the magnitude of the interaction matrix element between the
diabatic potential curves. A very gentle curvature is the signature of a very large interaction
matrix element. In the Zewail experiments, the velocity in the curve-crossing region can be
systematically slightly adjusted by the choice of the center wavelength of the pump pulse.
At an NaI energy far above that of the curve-crossing, the velocity in the crossing region is
very large and the molecule stays on one of the diabatic potentials, in effect jumping the gap
between adiabatic curves. At an energy near that of the curve crossing, the molecule would
go through the crossing region slowly and stay on one of the adiabatic curves, with the result
that the wave packet that is born covalent, is nearly 100% converted to ionic at the
internuclear distance of the crossing. Zewail’s NaI experiments provide a direct
experimental determination of the internuclear distance of the curve crossing and an
explicit illustration of Landau-Zener theory.

Figure 1: Pump/Probe Scheme for Photodissociation of ICN (Figure 1 of Ref. 24). This is a reduced
dimension representation of three singlet potential energy surfaces of ICN: the bound ground electronic state,
V0 with minimum at Re, an excited unbound state, V1, which dissociates to CN(X2Σ+) and I(2P3/2), and a higher
energy unbound state, which dissociates to CN(B2Σ+) and I(2P3/2). A t = 0 pulse from the pump laser, with center
wavelength λ1, excites a vertical turning-point-to-turning-point (P0 = 0, P1 = 0) transition at R = R0 > Re to the
V1 potential surface. The wavepacket on the V1 potential surface experiences a force in the increasing RI-CN
direction, which causes the PI-CN momentum to increase monotonically with time. At t = τ , a pulse from the
probe laser, with center wavelength probes for the arrival of the wavepacket at RI-CN = R? or R∞ . The
energy of the vertical (ΔR=0) and momentumconserving (ΔP=0) transition also increases monotonically with
time as the wavepacket travels outward on V1. This V2−V1 transition is essentially an excitation of the CN B−X
electronic transition in the presence of the departing I atom. The R= RI-CN = R? Optically Coupled Region (OCR)
is interrogated by a probe pulse with center wavelength , where is the wavelength of the free CN
B−X v0 = 0 − v00 = 0 band. The detected signal is CN B-X spontaneous fluorescence. Reproduced with permission
from Figure 1 in M. J. Rosker, M. Dantus, and A. H. Zewail, “Femtosecond real-time probing of reactions. I. The
technique,”
J. Chem. Phys. 89, 6113–6127 (1988). Copyright 1988, AIP Publishing LLC.
Internuclear Separation

Figure 2: Wavepacket Transit through an Ionic∼Covalent Potential Energy Curve Crossing in NaI
(Figure 1 of Ref. 26). The diabatic (solid lines) Na+,I− and Na,I potential energy curves cross at Rx = 6.93A.˚ The
avoided crossing between the adiabatic potential curves is shown as dashed lines. At t = t0 the 310 nm pump
pulse creates a wavepacket at the inner turning point of the covalent (Na 2S, I2P3/2) potential curve at
R≈Re(X1Σ+) and P= 0. By adjusting the center wavelength of the pump pulse, the center total-energy (electronic
plus vibrational) of the wavepacket can be adjusted between 30,000 and 34,000 cm−1 . The excitation energy
of the ionic∼covalent curve crossing is ∼ 26, 000 cm−1 . The wavepacket is accelerated outward, passes through
the curve-crossing region at t?, and bifurcates, one part traveling on the bound ionic potential and the other
part traveling irreversibly outward on the unbound covalent potential. The ionic part is reflected at tR at the
outer turning point of the ionic potential, passes with P< 0 through the R= 6.93 ˚A curve crossing region where
it bifurcates again, and the resultant ionic and covalent parts are reflected outward at the inner turning points
of the ionic and covalent potential curves, respectively. Each outward passage of a wavepacket through the
curve crossing region results in a wavepacket traveling irreversibly outward on the unbound covalent
potential, eventually forming free Na(2S) and I(2P3/2) atoms. The probe pulse (not shown) interrogates the
dynamics by exciting Na(2S),I(2P3/2) weakly-bound molecules to a higher energy repulsive electronic state that
dissociates to Na(2P) + I(2P3/2) atoms. Excitation at centerwavelength longer than 589 nm samples NaI
molecules en route to full dissociation. Excitation centered at 589 nm provides what is essentially a time-
integrated sample of the accumulation of the free Na(2S) atoms. Reproduced with permission from Figure 1 in
T. S. Rose, M. J. Rosker, and A. H. Zewail, “Femtosecond real-time observations of wave packet oscillations
(resonance) in dissociation reactions,” J. Chem. Phys. 88, 6672–6673 (1988). Copyright 1988, AIP Publishing
LLC.
0
4
R
x
= 6.93Å
COVALENT Na +I
IONIC Na
+
+I
–
t
0
t
*
t
R
R(Å)
10
15
0
2
5
0
5
10
15
20
25
30
35
Energy (10
3
cm
–1
)
FS
pump (
λ
)
FS
probe (t,
λ
)
Na I*
Na
[
…
I]
‡
*
Na
[
……
I]
‡
*
Na + I + E
tr

Figure 3: Clocking of the Photodissociation of NaI (and NaBr) as the Nuclear Wavepacket Repeatedly
Traverses the Ionic/Covalent Curve Crossing (Figure 2 of Ref. 26). The wavepacket, illustrated in Fig. 6.5, is
created at t = t0 at the inner turning point on the covalent excited electronic state. At each outward-bound
traversal of the curve-crossing region, part of the wavepacket follows the covalent adiabatic curve irreversibly
outward to separated Na(2S)+I(2P3/2) atoms. If the probe laser centerwavelength is tuned slightly to the red of
the 589 nm free Na atom 2P←2S transition, each time a wavepacket of incompletely separated Na,I molecules
passes through the Optically Coupled Region, some not quite free Na atoms are excited to the 2P state, from
which spontaneous fluorescence is detected. The series of Na atom fluorescence pulses shown in Spectrum I
samples each outward passage of a wavepacket through the curve-crossing region. The temporal spacing of
the pulses corresponds to a 36 cm−1 vibrational frequency. When the center-wavelength of the probe laser is
tuned to 589 nm, the arrivals of free Na atom wavepackets are displayed in Spectrum II as a periodic series of
upward steps. Spectrum III shows that the (upper) adiabatic potential curve for NaBr is shallower and “leakier”
than that for NaI. Reproduced with permission from Figure 2 in T. S. Rose, M. J. Rosker, and A. H. Zewail,
“Femtosecond real-time observations of wave packet oscillations (resonance) in dissociation reactions,” J.
Chem. Phys. 88, 6672–6673 (1988). Copyright 1988, AIP Publishing LLC.
Ahmed Zewail was awarded the 1999 Nobel Prize in Chemistry for “Femtosecond Transition
State (FTS) Spectroscopy.” These experiments were described as the first time that the
mechanisms of real intramolecular dynamics were ”clocked” in real time. In a pump/probe
scheme, a femtosecond pump pulse creates a wavepacket on a repulsive or predissociated
electronically excited V1 potential energy surface at t = 0 by excitation from the v = 0 level of
the electronic ground state, V0 (ability to tune center energy of wavepacket by a small
500
fs
∆t (fs)
III
II

amount). After each excitation pulse, the time-evolving wavepacket is probed by a
femtosecond pulse with a chosen center wavelength at a time-delay t = τ. This delay time is
scanned, pulse-by-pulse, to determine the time at which the center of the wavepacket
crosses through the “Optically Coupled Region (OCR).” The probe pulse excites a portion of
the wavepacket from the V1 potential surface to a higher energy repulsive potential surface,
V2. The V2 potential surface is repulsive, dissociating to an electronically excited fragment.
The detected signal is the time-integrated ∼ 10 nanosecond lifetime fluorescence from this
excited fragment. The dynamically relevant information is encoded in the intensity vs. τ of
this time-integrated fluorescence, which samples the femtosecond passage of the
wavepacket through the OCR that is selected by the center wavelength of the probe pulse.
The ICN photodissociation experiment shows the effect of the presence of the I atom on the
frequency of the CN B2Σ+ − X2Σ+ electronic transition. As the I atom moves away from the CN
molecule, the energy of the CN electronic excitation increases from its value in the ICN
molecule to that of the free CN molecule. Did we know this before doing the experiment? As
the ICN bond stretches, the electronic structure of the CN moiety changes. This is
mechanism!
The photodissociation of NaI is mediated by a covalent-to-ionic curve crossing. The diabatic
(crossing) potential energy curves (solid lines) are the ones for which the electronic
character does not change rapidly as the molecule traverses the internuclear distance of the
curve crossing. The adiabatic curves (dashed lines), which are what “clamped nuclei”
quantum chemical calculations generate, exhibit a rapid change of electronic character at
the internuclear distance of the avoided crossing. As the molecule moves through the curve-
crossing region, it must decide whether it is going to follow the diabatic or the adiabatic
potential. Landau-Zener theory tells us the velocity-dependence of the probability of
jumping across the energy gap between the ionic and the covalent adiabatic curves. If you
drive too fast, you will be unable to stay on the road on a sharp curve. The sharpness of the
curve is determined by the magnitude of the interaction matrix element between the
diabatic potential curves. A very gentle curvature is the signature of a very large interaction
matrix element. In the Zewail experiments, the velocity in the curve-crossing region can be
systematically slightly adjusted by the choice of the center wavelength of the pump pulse.
At an NaI energy far above that of the curve-crossing, the velocity in the crossing region is
very large and the molecule stays on one of the diabatic potentials, in effect jumping the gap
between adiabatic curves. At an energy near that of the curve crossing, the molecule would
go through the crossing region slowly and stay on one of the adiabatic curves, with the result
that the wave packet that is born covalent, is nearly 100% converted to ionic at the
internuclear distance of the crossing. Zewail’s NaI experiments provide a direct
experimental determination of the internuclear distance of the curve crossing and an
explicit illustration of Landau-Zener theory.

Figure 1: Pump/Probe Scheme for Photodissociation of ICN (Figure 1 of Ref. 24). This is a reduced
dimension representation of three singlet potential energy surfaces of ICN: the bound ground electronic state,
V0 with minimum at Re, an excited unbound state, V1, which dissociates to CN(X2Σ+) and I(2P3/2), and a higher
energy unbound state, which dissociates to CN(B2Σ+) and I(2P3/2). A t = 0 pulse from the pump laser, with center
wavelength λ1, excites a vertical turning-point-to-turning-point (P0 = 0, P1 = 0) transition at R = R0 > Re to the
V1 potential surface. The wavepacket on the V1 potential surface experiences a force in the increasing RI-CN
direction, which causes the PI-CN momentum to increase monotonically with time. At t = τ , a pulse from the
probe laser, with center wavelength probes for the arrival of the wavepacket at RI-CN = R? or R∞ . The
energy of the vertical (ΔR=0) and momentumconserving (ΔP=0) transition also increases monotonically with
time as the wavepacket travels outward on V1. This V2−V1 transition is essentially an excitation of the CN B−X
electronic transition in the presence of the departing I atom. The R= RI-CN = R? Optically Coupled Region (OCR)
is interrogated by a probe pulse with center wavelength , where is the wavelength of the free CN
B−X v0 = 0 − v00 = 0 band. The detected signal is CN B-X spontaneous fluorescence. Reproduced with permission
from Figure 1 in M. J. Rosker, M. Dantus, and A. H. Zewail, “Femtosecond real-time probing of reactions. I. The
technique,”
J. Chem. Phys. 89, 6113–6127 (1988). Copyright 1988, AIP Publishing LLC.
Internuclear Separation

Figure 2: Wavepacket Transit through an Ionic∼Covalent Potential Energy Curve Crossing in NaI
(Figure 1 of Ref. 26). The diabatic (solid lines) Na+,I− and Na,I potential energy curves cross at Rx = 6.93A.˚ The
avoided crossing between the adiabatic potential curves is shown as dashed lines. At t = t0 the 310 nm pump
pulse creates a wavepacket at the inner turning point of the covalent (Na 2S, I2P3/2) potential curve at
R≈Re(X1Σ+) and P= 0. By adjusting the center wavelength of the pump pulse, the center total-energy (electronic
plus vibrational) of the wavepacket can be adjusted between 30,000 and 34,000 cm−1 . The excitation energy
of the ionic∼covalent curve crossing is ∼ 26, 000 cm−1 . The wavepacket is accelerated outward, passes through
the curve-crossing region at t?, and bifurcates, one part traveling on the bound ionic potential and the other
part traveling irreversibly outward on the unbound covalent potential. The ionic part is reflected at tR at the
outer turning point of the ionic potential, passes with P< 0 through the R= 6.93 ˚A curve crossing region where
it bifurcates again, and the resultant ionic and covalent parts are reflected outward at the inner turning points
of the ionic and covalent potential curves, respectively. Each outward passage of a wavepacket through the
curve crossing region results in a wavepacket traveling irreversibly outward on the unbound covalent
potential, eventually forming free Na(2S) and I(2P3/2) atoms. The probe pulse (not shown) interrogates the
dynamics by exciting Na(2S),I(2P3/2) weakly-bound molecules to a higher energy repulsive electronic state that
dissociates to Na(2P) + I(2P3/2) atoms. Excitation at centerwavelength longer than 589 nm samples NaI
molecules en route to full dissociation. Excitation centered at 589 nm provides what is essentially a time-
integrated sample of the accumulation of the free Na(2S) atoms. Reproduced with permission from Figure 1 in
T. S. Rose, M. J. Rosker, and A. H. Zewail, “Femtosecond real-time observations of wave packet oscillations
(resonance) in dissociation reactions,” J. Chem. Phys. 88, 6672–6673 (1988). Copyright 1988, AIP Publishing
LLC.
0
4
R
x
= 6.93Å
COVALENT Na +I
IONIC Na
+
+I
–
t
0
t
*
t
R
R(Å)
10
15
0
2
5
0
5
10
15
20
25
30
35
Energy (10
3
cm
–1
)
FS
pump (
λ
)
FS
probe (t,
λ
)
Na I*
Na
[
…
I]
‡
*
Na
[
……
I]
‡
*
Na + I + E
tr

Figure 3: Clocking of the Photodissociation of NaI (and NaBr) as the Nuclear Wavepacket Repeatedly
Traverses the Ionic/Covalent Curve Crossing (Figure 2 of Ref. 26). The wavepacket, illustrated in Fig. 6.5, is
created at t = t0 at the inner turning point on the covalent excited electronic state. At each outward-bound
traversal of the curve-crossing region, part of the wavepacket follows the covalent adiabatic curve irreversibly
outward to separated Na(2S)+I(2P3/2) atoms. If the probe laser centerwavelength is tuned slightly to the red of
the 589 nm free Na atom 2P←2S transition, each time a wavepacket of incompletely separated Na,I molecules
passes through the Optically Coupled Region, some not quite free Na atoms are excited to the 2P state, from
which spontaneous fluorescence is detected. The series of Na atom fluorescence pulses shown in Spectrum I
samples each outward passage of a wavepacket through the curve-crossing region. The temporal spacing of
the pulses corresponds to a 36 cm−1 vibrational frequency. When the center-wavelength of the probe laser is
tuned to 589 nm, the arrivals of free Na atom wavepackets are displayed in Spectrum II as a periodic series of
upward steps. Spectrum III shows that the (upper) adiabatic potential curve for NaBr is shallower and “leakier”
than that for NaI. Reproduced with permission from Figure 2 in T. S. Rose, M. J. Rosker, and A. H. Zewail,
“Femtosecond real-time observations of wave packet oscillations (resonance) in dissociation reactions,” J.
Chem. Phys. 88, 6672–6673 (1988). Copyright 1988, AIP Publishing LLC.
Ahmed Zewail was awarded the 1999 Nobel Prize in Chemistry for “Femtosecond Transition
State (FTS) Spectroscopy.” These experiments were described as the first time that the
mechanisms of real intramolecular dynamics were ”clocked” in real time. In a pump/probe
scheme, a femtosecond pump pulse creates a wavepacket on a repulsive or predissociated
electronically excited V1 potential energy surface at t = 0 by excitation from the v = 0 level of
the electronic ground state, V0 (ability to tune center energy of wavepacket by a small
500
fs
∆t (fs)
III
II

amount). After each excitation pulse, the time-evolving wavepacket is probed by a
femtosecond pulse with a chosen center wavelength at a time-delay t = τ. This delay time is
scanned, pulse-by-pulse, to determine the time at which the center of the wavepacket
crosses through the “Optically Coupled Region (OCR).” The probe pulse excites a portion of
the wavepacket from the V1 potential surface to a higher energy repulsive potential surface,
V2. The V2 potential surface is repulsive, dissociating to an electronically excited fragment.
The detected signal is the time-integrated ∼ 10 nanosecond lifetime fluorescence from this
excited fragment. The dynamically relevant information is encoded in the intensity vs. τ of
this time-integrated fluorescence, which samples the femtosecond passage of the
wavepacket through the OCR that is selected by the center wavelength of the probe pulse.
The ICN photodissociation experiment shows the effect of the presence of the I atom on the
frequency of the CN B2Σ+ − X2Σ+ electronic transition. As the I atom moves away from the CN
molecule, the energy of the CN electronic excitation increases from its value in the ICN
molecule to that of the free CN molecule. Did we know this before doing the experiment? As
the ICN bond stretches, the electronic structure of the CN moiety changes. This is
mechanism!
The photodissociation of NaI is mediated by a covalent-to-ionic curve crossing. The diabatic
(crossing) potential energy curves (solid lines) are the ones for which the electronic
character does not change rapidly as the molecule traverses the internuclear distance of the
curve crossing. The adiabatic curves (dashed lines), which are what “clamped nuclei”
quantum chemical calculations generate, exhibit a rapid change of electronic character at
the internuclear distance of the avoided crossing. As the molecule moves through the curve-
crossing region, it must decide whether it is going to follow the diabatic or the adiabatic
potential. Landau-Zener theory tells us the velocity-dependence of the probability of
jumping across the energy gap between the ionic and the covalent adiabatic curves. If you
drive too fast, you will be unable to stay on the road on a sharp curve. The sharpness of the
curve is determined by the magnitude of the interaction matrix element between the
diabatic potential curves. A very gentle curvature is the signature of a very large interaction
matrix element. In the Zewail experiments, the velocity in the curve-crossing region can be
systematically slightly adjusted by the choice of the center wavelength of the pump pulse.
At an NaI energy far above that of the curve-crossing, the velocity in the crossing region is
very large and the molecule stays on one of the diabatic potentials, in effect jumping the gap
between adiabatic curves. At an energy near that of the curve crossing, the molecule would
go through the crossing region slowly and stay on one of the adiabatic curves, with the result
that the wave packet that is born covalent, is nearly 100% converted to ionic at the
internuclear distance of the crossing. Zewail’s NaI experiments provide a direct
experimental determination of the internuclear distance of the curve crossing and an
explicit illustration of Landau-Zener theory.

Figure 1: Pump/Probe Scheme for Photodissociation of ICN (Figure 1 of Ref. 24). This is a reduced
dimension representation of three singlet potential energy surfaces of ICN: the bound ground electronic state,
V0 with minimum at Re, an excited unbound state, V1, which dissociates to CN(X2Σ+) and I(2P3/2), and a higher
energy unbound state, which dissociates to CN(B2Σ+) and I(2P3/2). A t = 0 pulse from the pump laser, with center
wavelength λ1, excites a vertical turning-point-to-turning-point (P0 = 0, P1 = 0) transition at R = R0 > Re to the
V1 potential surface. The wavepacket on the V1 potential surface experiences a force in the increasing RI-CN
direction, which causes the PI-CN momentum to increase monotonically with time. At t = τ , a pulse from the
probe laser, with center wavelength probes for the arrival of the wavepacket at RI-CN = R? or R∞ . The
energy of the vertical (ΔR=0) and momentumconserving (ΔP=0) transition also increases monotonically with
time as the wavepacket travels outward on V1. This V2−V1 transition is essentially an excitation of the CN B−X
electronic transition in the presence of the departing I atom. The R= RI-CN = R? Optically Coupled Region (OCR)
is interrogated by a probe pulse with center wavelength , where is the wavelength of the free CN
B−X v0 = 0 − v00 = 0 band. The detected signal is CN B-X spontaneous fluorescence. Reproduced with permission
from Figure 1 in M. J. Rosker, M. Dantus, and A. H. Zewail, “Femtosecond real-time probing of reactions. I. The
technique,”
J. Chem. Phys. 89, 6113–6127 (1988). Copyright 1988, AIP Publishing LLC.
Internuclear Separation

Figure 2: Wavepacket Transit through an Ionic∼Covalent Potential Energy Curve Crossing in NaI
(Figure 1 of Ref. 26). The diabatic (solid lines) Na+,I− and Na,I potential energy curves cross at Rx = 6.93A.˚ The
avoided crossing between the adiabatic potential curves is shown as dashed lines. At t = t0 the 310 nm pump
pulse creates a wavepacket at the inner turning point of the covalent (Na 2S, I2P3/2) potential curve at
R≈Re(X1Σ+) and P= 0. By adjusting the center wavelength of the pump pulse, the center total-energy (electronic
plus vibrational) of the wavepacket can be adjusted between 30,000 and 34,000 cm−1 . The excitation energy
of the ionic∼covalent curve crossing is ∼ 26, 000 cm−1 . The wavepacket is accelerated outward, passes through
the curve-crossing region at t?, and bifurcates, one part traveling on the bound ionic potential and the other
part traveling irreversibly outward on the unbound covalent potential. The ionic part is reflected at tR at the
outer turning point of the ionic potential, passes with P< 0 through the R= 6.93 ˚A curve crossing region where
it bifurcates again, and the resultant ionic and covalent parts are reflected outward at the inner turning points
of the ionic and covalent potential curves, respectively. Each outward passage of a wavepacket through the
curve crossing region results in a wavepacket traveling irreversibly outward on the unbound covalent
potential, eventually forming free Na(2S) and I(2P3/2) atoms. The probe pulse (not shown) interrogates the
dynamics by exciting Na(2S),I(2P3/2) weakly-bound molecules to a higher energy repulsive electronic state that
dissociates to Na(2P) + I(2P3/2) atoms. Excitation at centerwavelength longer than 589 nm samples NaI
molecules en route to full dissociation. Excitation centered at 589 nm provides what is essentially a time-
integrated sample of the accumulation of the free Na(2S) atoms. Reproduced with permission from Figure 1 in
T. S. Rose, M. J. Rosker, and A. H. Zewail, “Femtosecond real-time observations of wave packet oscillations
(resonance) in dissociation reactions,” J. Chem. Phys. 88, 6672–6673 (1988). Copyright 1988, AIP Publishing
LLC.
0
4
R
x
= 6.93Å
COVALENT Na +I
IONIC Na
+
+I
–
t
0
t
*
t
R
R(Å)
10
15
0
2
5
0
5
10
15
20
25
30
35
Energy (10
3
cm
–1
)
FS
pump (
λ
)
FS
probe (t,
λ
)
Na I*
Na
[
…
I]
‡
*
Na
[
……
I]
‡
*
Na + I + E
tr

Figure 3: Clocking of the Photodissociation of NaI (and NaBr) as the Nuclear Wavepacket Repeatedly
Traverses the Ionic/Covalent Curve Crossing (Figure 2 of Ref. 26). The wavepacket, illustrated in Fig. 6.5, is
created at t = t0 at the inner turning point on the covalent excited electronic state. At each outward-bound
traversal of the curve-crossing region, part of the wavepacket follows the covalent adiabatic curve irreversibly
outward to separated Na(2S)+I(2P3/2) atoms. If the probe laser centerwavelength is tuned slightly to the red of
the 589 nm free Na atom 2P←2S transition, each time a wavepacket of incompletely separated Na,I molecules
passes through the Optically Coupled Region, some not quite free Na atoms are excited to the 2P state, from
which spontaneous fluorescence is detected. The series of Na atom fluorescence pulses shown in Spectrum I
samples each outward passage of a wavepacket through the curve-crossing region. The temporal spacing of
the pulses corresponds to a 36 cm−1 vibrational frequency. When the center-wavelength of the probe laser is
tuned to 589 nm, the arrivals of free Na atom wavepackets are displayed in Spectrum II as a periodic series of
upward steps. Spectrum III shows that the (upper) adiabatic potential curve for NaBr is shallower and “leakier”
than that for NaI. Reproduced with permission from Figure 2 in T. S. Rose, M. J. Rosker, and A. H. Zewail,
“Femtosecond real-time observations of wave packet oscillations (resonance) in dissociation reactions,” J.
Chem. Phys. 88, 6672–6673 (1988). Copyright 1988, AIP Publishing LLC.
Ahmed Zewail was awarded the 1999 Nobel Prize in Chemistry for “Femtosecond Transition
State (FTS) Spectroscopy.” These experiments were described as the first time that the
mechanisms of real intramolecular dynamics were ”clocked” in real time. In a pump/probe
scheme, a femtosecond pump pulse creates a wavepacket on a repulsive or predissociated
electronically excited V1 potential energy surface at t = 0 by excitation from the v = 0 level of
the electronic ground state, V0 (ability to tune center energy of wavepacket by a small
500
fs
∆t (fs)
III
II

amount). After each excitation pulse, the time-evolving wavepacket is probed by a
femtosecond pulse with a chosen center wavelength at a time-delay t = τ. This delay time is
scanned, pulse-by-pulse, to determine the time at which the center of the wavepacket
crosses through the “Optically Coupled Region (OCR).” The probe pulse excites a portion of
the wavepacket from the V1 potential surface to a higher energy repulsive potential surface,
V2. The V2 potential surface is repulsive, dissociating to an electronically excited fragment.
The detected signal is the time-integrated ∼ 10 nanosecond lifetime fluorescence from this
excited fragment. The dynamically relevant information is encoded in the intensity vs. τ of
this time-integrated fluorescence, which samples the femtosecond passage of the
wavepacket through the OCR that is selected by the center wavelength of the probe pulse.
The ICN photodissociation experiment shows the effect of the presence of the I atom on the
frequency of the CN B2Σ+ − X2Σ+ electronic transition. As the I atom moves away from the CN
molecule, the energy of the CN electronic excitation increases from its value in the ICN
molecule to that of the free CN molecule. Did we know this before doing the experiment? As
the ICN bond stretches, the electronic structure of the CN moiety changes. This is
mechanism!
The photodissociation of NaI is mediated by a covalent-to-ionic curve crossing. The diabatic
(crossing) potential energy curves (solid lines) are the ones for which the electronic
character does not change rapidly as the molecule traverses the internuclear distance of the
curve crossing. The adiabatic curves (dashed lines), which are what “clamped nuclei”
quantum chemical calculations generate, exhibit a rapid change of electronic character at
the internuclear distance of the avoided crossing. As the molecule moves through the curve-
crossing region, it must decide whether it is going to follow the diabatic or the adiabatic
potential. Landau-Zener theory tells us the velocity-dependence of the probability of
jumping across the energy gap between the ionic and the covalent adiabatic curves. If you
drive too fast, you will be unable to stay on the road on a sharp curve. The sharpness of the
curve is determined by the magnitude of the interaction matrix element between the
diabatic potential curves. A very gentle curvature is the signature of a very large interaction
matrix element. In the Zewail experiments, the velocity in the curve-crossing region can be
systematically slightly adjusted by the choice of the center wavelength of the pump pulse.
At an NaI energy far above that of the curve-crossing, the velocity in the crossing region is
very large and the molecule stays on one of the diabatic potentials, in effect jumping the gap
between adiabatic curves. At an energy near that of the curve crossing, the molecule would
go through the crossing region slowly and stay on one of the adiabatic curves, with the result
that the wave packet that is born covalent, is nearly 100% converted to ionic at the
internuclear distance of the crossing. Zewail’s NaI experiments provide a direct
experimental determination of the internuclear distance of the curve crossing and an
explicit illustration of Landau-Zener theory.

Figure 1: Pump/Probe Scheme for Photodissociation of ICN (Figure 1 of Ref. 24). This is a reduced
dimension representation of three singlet potential energy surfaces of ICN: the bound ground electronic state,
V0 with minimum at Re, an excited unbound state, V1, which dissociates to CN(X2Σ+) and I(2P3/2), and a higher
energy unbound state, which dissociates to CN(B2Σ+) and I(2P3/2). A t = 0 pulse from the pump laser, with center
wavelength λ1, excites a vertical turning-point-to-turning-point (P0 = 0, P1 = 0) transition at R = R0 > Re to the
V1 potential surface. The wavepacket on the V1 potential surface experiences a force in the increasing RI-CN
direction, which causes the PI-CN momentum to increase monotonically with time. At t = τ , a pulse from the
probe laser, with center wavelength probes for the arrival of the wavepacket at RI-CN = R? or R∞ . The
energy of the vertical (ΔR=0) and momentumconserving (ΔP=0) transition also increases monotonically with
time as the wavepacket travels outward on V1. This V2−V1 transition is essentially an excitation of the CN B−X
electronic transition in the presence of the departing I atom. The R= RI-CN = R? Optically Coupled Region (OCR)
is interrogated by a probe pulse with center wavelength , where is the wavelength of the free CN
B−X v0 = 0 − v00 = 0 band. The detected signal is CN B-X spontaneous fluorescence. Reproduced with permission
from Figure 1 in M. J. Rosker, M. Dantus, and A. H. Zewail, “Femtosecond real-time probing of reactions. I. The
technique,”
J. Chem. Phys. 89, 6113–6127 (1988). Copyright 1988, AIP Publishing LLC.
Internuclear Separation

Figure 2: Wavepacket Transit through an Ionic∼Covalent Potential Energy Curve Crossing in NaI
(Figure 1 of Ref. 26). The diabatic (solid lines) Na+,I− and Na,I potential energy curves cross at Rx = 6.93A.˚ The
avoided crossing between the adiabatic potential curves is shown as dashed lines. At t = t0 the 310 nm pump
pulse creates a wavepacket at the inner turning point of the covalent (Na 2S, I2P3/2) potential curve at
R≈Re(X1Σ+) and P= 0. By adjusting the center wavelength of the pump pulse, the center total-energy (electronic
plus vibrational) of the wavepacket can be adjusted between 30,000 and 34,000 cm−1 . The excitation energy
of the ionic∼covalent curve crossing is ∼ 26, 000 cm−1 . The wavepacket is accelerated outward, passes through
the curve-crossing region at t?, and bifurcates, one part traveling on the bound ionic potential and the other
part traveling irreversibly outward on the unbound covalent potential. The ionic part is reflected at tR at the
outer turning point of the ionic potential, passes with P< 0 through the R= 6.93 ˚A curve crossing region where
it bifurcates again, and the resultant ionic and covalent parts are reflected outward at the inner turning points
of the ionic and covalent potential curves, respectively. Each outward passage of a wavepacket through the
curve crossing region results in a wavepacket traveling irreversibly outward on the unbound covalent
potential, eventually forming free Na(2S) and I(2P3/2) atoms. The probe pulse (not shown) interrogates the
dynamics by exciting Na(2S),I(2P3/2) weakly-bound molecules to a higher energy repulsive electronic state that
dissociates to Na(2P) + I(2P3/2) atoms. Excitation at centerwavelength longer than 589 nm samples NaI
molecules en route to full dissociation. Excitation centered at 589 nm provides what is essentially a time-
integrated sample of the accumulation of the free Na(2S) atoms. Reproduced with permission from Figure 1 in
T. S. Rose, M. J. Rosker, and A. H. Zewail, “Femtosecond real-time observations of wave packet oscillations
(resonance) in dissociation reactions,” J. Chem. Phys. 88, 6672–6673 (1988). Copyright 1988, AIP Publishing
LLC.
0
4
R
x
= 6.93Å
COVALENT Na +I
IONIC Na
+
+I
–
t
0
t
*
t
R
R(Å)
10
15
0
2
5
0
5
10
15
20
25
30
35
Energy (10
3
cm
–1
)
FS
pump (
λ
)
FS
probe (t,
λ
)
Na I*
Na
[
…
I]
‡
*
Na
[
……
I]
‡
*
Na + I + E
tr

Figure 3: Clocking of the Photodissociation of NaI (and NaBr) as the Nuclear Wavepacket Repeatedly
Traverses the Ionic/Covalent Curve Crossing (Figure 2 of Ref. 26). The wavepacket, illustrated in Fig. 6.5, is
created at t = t0 at the inner turning point on the covalent excited electronic state. At each outward-bound
traversal of the curve-crossing region, part of the wavepacket follows the covalent adiabatic curve irreversibly
outward to separated Na(2S)+I(2P3/2) atoms. If the probe laser centerwavelength is tuned slightly to the red of
the 589 nm free Na atom 2P←2S transition, each time a wavepacket of incompletely separated Na,I molecules
passes through the Optically Coupled Region, some not quite free Na atoms are excited to the 2P state, from
which spontaneous fluorescence is detected. The series of Na atom fluorescence pulses shown in Spectrum I
samples each outward passage of a wavepacket through the curve-crossing region. The temporal spacing of
the pulses corresponds to a 36 cm−1 vibrational frequency. When the center-wavelength of the probe laser is
tuned to 589 nm, the arrivals of free Na atom wavepackets are displayed in Spectrum II as a periodic series of
upward steps. Spectrum III shows that the (upper) adiabatic potential curve for NaBr is shallower and “leakier”
than that for NaI. Reproduced with permission from Figure 2 in T. S. Rose, M. J. Rosker, and A. H. Zewail,
“Femtosecond real-time observations of wave packet oscillations (resonance) in dissociation reactions,” J.
Chem. Phys. 88, 6672–6673 (1988). Copyright 1988, AIP Publishing LLC. Ahmed Zewail was awarded the
1999 Nobel Prize in Chemistry for “Femtosecond Transition State (FTS) Spectroscopy.”
These experiments were described as the first time that the mechanisms of real
intramolecular dynamics were ”clocked” in real time. In a pump/probe scheme, a
femtosecond pump pulse creates a wavepacket on a repulsive or predissociated
electronically excited V1 potential energy surface at t = 0 by excitation from the v = 0 level of
the electronic ground state, V0 (ability to tune center energy of wavepacket by a small
500
fs
∆t (fs)
III
II

amount). After each excitation pulse, the time-evolving wavepacket is probed by a
femtosecond pulse with a chosen center wavelength at a time-delay t = τ. This delay time is
scanned, pulse-by-pulse, to determine the time at which the center of the wavepacket
crosses through the “Optically Coupled Region (OCR).” The probe pulse excites a portion of
the wavepacket from the V1 potential surface to a higher energy repulsive potential surface,
V2. The V2 potential surface is repulsive, dissociating to an electronically excited fragment.
The detected signal is the time-integrated ∼ 10 nanosecond lifetime fluorescence from this
excited fragment. The dynamically relevant information is encoded in the intensity vs. τ of
this time-integrated fluorescence, which samples the femtosecond passage of the
wavepacket through the OCR that is selected by the center wavelength of the probe pulse.
The ICN photodissociation experiment shows the effect of the presence of the I atom on the
frequency of the CN B2Σ+ − X2Σ+ electronic transition. As the I atom moves away from the CN
molecule, the energy of the CN electronic excitation increases from its value in the ICN
molecule to that of the free CN molecule. Did we know this before doing the experiment? As
the ICN bond stretches, the electronic structure of the CN moiety changes. This is
mechanism!
The photodissociation of NaI is mediated by a covalent-to-ionic curve crossing. The diabatic
(crossing) potential energy curves (solid lines) are the ones for which the electronic
character does not change rapidly as the molecule traverses the internuclear distance of the
curve crossing. The adiabatic curves (dashed lines), which are what “clamped nuclei”
quantum chemical calculations generate, exhibit a rapid change of electronic character at
the internuclear distance of the avoided crossing. As the molecule moves through the curve-
crossing region, it must decide whether it is going to follow the diabatic or the adiabatic
potential. Landau-Zener theory tells us the velocity-dependence of the probability of
jumping across the energy gap between the ionic and the covalent adiabatic curves. If you
drive too fast, you will be unable to stay on the road on a sharp curve. The sharpness of the
curve is determined by the magnitude of the interaction matrix element between the
diabatic potential curves. A very gentle curvature is the signature of a very large interaction
matrix element. In the Zewail experiments, the velocity in the curve-crossing region can be
systematically slightly adjusted by the choice of the center wavelength of the pump pulse.
At an NaI energy far above that of the curve-crossing, the velocity in the crossing region is
very large and the molecule stays on one of the diabatic potentials, in effect jumping the gap
between adiabatic curves. At an energy near that of the curve crossing, the molecule would
go through the crossing region slowly and stay on one of the adiabatic curves, with the result
that the wave packet that is born covalent, is nearly 100% converted to ionic at the
internuclear distance of the crossing. Zewail’s NaI experiments provide a direct
experimental determination of the internuclear distance of the curve crossing and an
explicit illustration of Landau-Zener theory.

Figure 1: Pump/Probe Scheme for Photodissociation of ICN (Figure 1 of Ref. 24). This is a reduced
dimension representation of three singlet potential energy surfaces of ICN: the bound ground electronic state,
V0 with minimum at Re, an excited unbound state, V1, which dissociates to CN(X2Σ+) and I(2P3/2), and a higher
energy unbound state, which dissociates to CN(B2Σ+) and I(2P3/2). A t = 0 pulse from the pump laser, with center
wavelength λ1, excites a vertical turning-point-to-turning-point (P0 = 0, P1 = 0) transition at R = R0 > Re to the
V1 potential surface. The wavepacket on the V1 potential surface experiences a force in the increasing RI-CN
direction, which causes the PI-CN momentum to increase monotonically with time. At t = τ , a pulse from the
probe laser, with center wavelength probes for the arrival of the wavepacket at RI-CN = R? or R∞ . The
energy of the vertical (ΔR=0) and momentumconserving (ΔP=0) transition also increases monotonically with
time as the wavepacket travels outward on V1. This V2−V1 transition is essentially an excitation of the CN B−X
electronic transition in the presence of the departing I atom. The R= RI-CN = R? Optically Coupled Region (OCR)
is interrogated by a probe pulse with center wavelength , where is the wavelength of the free CN
B−X v0 = 0 − v00 = 0 band. The detected signal is CN B-X spontaneous fluorescence. Reproduced with permission
from Figure 1 in M. J. Rosker, M. Dantus, and A. H. Zewail, “Femtosecond real-time probing of reactions. I. The
technique,”
J. Chem. Phys. 89, 6113–6127 (1988). Copyright 1988, AIP Publishing LLC.
Internuclear Separation

Figure 2: Wavepacket Transit through an Ionic∼Covalent Potential Energy Curve Crossing in NaI
(Figure 1 of Ref. 26). The diabatic (solid lines) Na+,I− and Na,I potential energy curves cross at Rx = 6.93A.˚ The
avoided crossing between the adiabatic potential curves is shown as dashed lines. At t = t0 the 310 nm pump
pulse creates a wavepacket at the inner turning point of the covalent (Na 2S, I2P3/2) potential curve at
R≈Re(X1Σ+) and P= 0. By adjusting the center wavelength of the pump pulse, the center total-energy (electronic
plus vibrational) of the wavepacket can be adjusted between 30,000 and 34,000 cm−1 . The excitation energy
of the ionic∼covalent curve crossing is ∼ 26, 000 cm−1 . The wavepacket is accelerated outward, passes through
the curve-crossing region at t?, and bifurcates, one part traveling on the bound ionic potential and the other
part traveling irreversibly outward on the unbound covalent potential. The ionic part is reflected at tR at the
outer turning point of the ionic potential, passes with P< 0 through the R= 6.93 ˚A curve crossing region where
it bifurcates again, and the resultant ionic and covalent parts are reflected outward at the inner turning points
of the ionic and covalent potential curves, respectively. Each outward passage of a wavepacket through the
curve crossing region results in a wavepacket traveling irreversibly outward on the unbound covalent
potential, eventually forming free Na(2S) and I(2P3/2) atoms. The probe pulse (not shown) interrogates the
dynamics by exciting Na(2S),I(2P3/2) weakly-bound molecules to a higher energy repulsive electronic state that
dissociates to Na(2P) + I(2P3/2) atoms. Excitation at centerwavelength longer than 589 nm samples NaI
molecules en route to full dissociation. Excitation centered at 589 nm provides what is essentially a time-
integrated sample of the accumulation of the free Na(2S) atoms. Reproduced with permission from Figure 1 in
T. S. Rose, M. J. Rosker, and A. H. Zewail, “Femtosecond real-time observations of wave packet oscillations
(resonance) in dissociation reactions,” J. Chem. Phys. 88, 6672–6673 (1988). Copyright 1988, AIP Publishing
LLC.
0
4
R
x
= 6.93Å
COVALENT Na +I
IONIC Na
+
+I
–
t
0
t
*
t
R
R(Å)
10
15
0
2
5
0
5
10
15
20
25
30
35
Energy (10
3
cm
–1
)
FS
pump (
λ
)
FS
probe (t,
λ
)
Na I*
Na
[
…
I]
‡
*
Na
[
……
I]
‡
*
Na + I + E
tr

Figure 3: Clocking of the Photodissociation of NaI (and NaBr) as the Nuclear Wavepacket Repeatedly
Traverses the Ionic/Covalent Curve Crossing (Figure 2 of Ref. 26). The wavepacket, illustrated in Fig. 6.5, is
created at t = t0 at the inner turning point on the covalent excited electronic state. At each outward-bound
traversal of the curve-crossing region, part of the wavepacket follows the covalent adiabatic curve irreversibly
outward to separated Na(2S)+I(2P3/2) atoms. If the probe laser centerwavelength is tuned slightly to the red of
the 589 nm free Na atom 2P←2S transition, each time a wavepacket of incompletely separated Na,I molecules
passes through the Optically Coupled Region, some not quite free Na atoms are excited to the 2P state, from
which spontaneous fluorescence is detected. The series of Na atom fluorescence pulses shown in Spectrum I
samples each outward passage of a wavepacket through the curve-crossing region. The temporal spacing of
the pulses corresponds to a 36 cm−1 vibrational frequency. When the center-wavelength of the probe laser is
tuned to 589 nm, the arrivals of free Na atom wavepackets are displayed in Spectrum II as a periodic series of
upward steps. Spectrum III shows that the (upper) adiabatic potential curve for NaBr is shallower and “leakier”
than that for NaI. Reproduced with permission from Figure 2 in T. S. Rose, M. J. Rosker, and A. H. Zewail,
“Femtosecond real-time observations of wave packet oscillations (resonance) in dissociation reactions,” J.
Chem. Phys. 88, 6672–6673 (1988). Copyright 1988, AIP Publishing LLC.
Ahmed Zewail was awarded the 1999 Nobel Prize in Chemistry for “Femtosecond Transition
State (FTS) Spectroscopy.” These experiments were described as the first time that the
mechanisms of real intramolecular dynamics were ”clocked” in real time. In a pump/probe
scheme, a femtosecond pump pulse creates a wavepacket on a repulsive or predissociated
electronically excited V1 potential energy surface at t = 0 by excitation from the v = 0 level of
the electronic ground state, V0 (ability to tune center energy of wavepacket by a small
500
fs
∆t (fs)
III
II

amount). After each excitation pulse, the time-evolving wavepacket is probed by a
femtosecond pulse with a chosen center wavelength at a time-delay t = τ. This delay time is
scanned, pulse-by-pulse, to determine the time at which the center of the wavepacket
crosses through the “Optically Coupled Region (OCR).” The probe pulse excites a portion of
the wavepacket from the V1 potential surface to a higher energy repulsive potential surface,
V2. The V2 potential surface is repulsive, dissociating to an electronically excited fragment.
The detected signal is the time-integrated ∼ 10 nanosecond lifetime fluorescence from this
excited fragment. The dynamically relevant information is encoded in the intensity vs. τ of
this time-integrated fluorescence, which samples the femtosecond passage of the
wavepacket through the OCR that is selected by the center wavelength of the probe pulse.
The ICN photodissociation experiment shows the effect of the presence of the I atom on the
frequency of the CN B2Σ+ − X2Σ+ electronic transition. As the I atom moves away from the CN
molecule, the energy of the CN electronic excitation increases from its value in the ICN
molecule to that of the free CN molecule. Did we know this before doing the experiment? As
the ICN bond stretches, the electronic structure of the CN moiety changes. This is
mechanism!
The photodissociation of NaI is mediated by a covalent-to-ionic curve crossing. The diabatic
(crossing) potential energy curves (solid lines) are the ones for which the electronic
character does not change rapidly as the molecule traverses the internuclear distance of the
curve crossing. The adiabatic curves (dashed lines), which are what “clamped nuclei”
quantum chemical calculations generate, exhibit a rapid change of electronic character at
the internuclear distance of the avoided crossing. As the molecule moves through the curve-
crossing region, it must decide whether it is going to follow the diabatic or the adiabatic
potential. Landau-Zener theory tells us the velocity-dependence of the probability of
jumping across the energy gap between the ionic and the covalent adiabatic curves. If you
drive too fast, you will be unable to stay on the road on a sharp curve. The sharpness of the
curve is determined by the magnitude of the interaction matrix element between the
diabatic potential curves. A very gentle curvature is the signature of a very large interaction
matrix element. In the Zewail experiments, the velocity in the curve-crossing region can be
systematically slightly adjusted by the choice of the center wavelength of the pump pulse.
At an NaI energy far above that of the curve-crossing, the velocity in the crossing region is
very large and the molecule stays on one of the diabatic potentials, in effect jumping the gap
between adiabatic curves. At an energy near that of the curve crossing, the molecule would
go through the crossing region slowly and stay on one of the adiabatic curves, with the result
that the wave packet that is born covalent, is nearly 100% converted to ionic at the
internuclear distance of the crossing. Zewail’s NaI experiments provide a direct
experimental determination of the internuclear distance of the curve crossing and an
explicit illustration of Landau-Zener theory.

Figure 1: Pump/Probe Scheme for Photodissociation of ICN (Figure 1 of Ref. 24). This is a reduced
dimension representation of three singlet potential energy surfaces of ICN: the bound ground electronic state,
V0 with minimum at Re, an excited unbound state, V1, which dissociates to CN(X2Σ+) and I(2P3/2), and a higher
energy unbound state, which dissociates to CN(B2Σ+) and I(2P3/2). A t = 0 pulse from the pump laser, with center
wavelength λ1, excites a vertical turning-point-to-turning-point (P0 = 0, P1 = 0) transition at R = R0 > Re to the
V1 potential surface. The wavepacket on the V1 potential surface experiences a force in the increasing RI-CN
direction, which causes the PI-CN momentum to increase monotonically with time. At t = τ , a pulse from the
probe laser, with center wavelength probes for the arrival of the wavepacket at RI-CN = R? or R∞ . The
energy of the vertical (ΔR=0) and momentumconserving (ΔP=0) transition also increases monotonically with
time as the wavepacket travels outward on V1. This V2−V1 transition is essentially an excitation of the CN B−X
electronic transition in the presence of the departing I atom. The R= RI-CN = R? Optically Coupled Region (OCR)
is interrogated by a probe pulse with center wavelength , where is the wavelength of the free CN
B−X v0 = 0 − v00 = 0 band. The detected signal is CN B-X spontaneous fluorescence. Reproduced with permission
from Figure 1 in M. J. Rosker, M. Dantus, and A. H. Zewail, “Femtosecond real-time probing of reactions. I. The
technique,”
J. Chem. Phys. 89, 6113–6127 (1988). Copyright 1988, AIP Publishing LLC.
Internuclear Separation

Figure 2: Wavepacket Transit through an Ionic∼Covalent Potential Energy Curve Crossing in NaI
(Figure 1 of Ref. 26). The diabatic (solid lines) Na+,I− and Na,I potential energy curves cross at Rx = 6.93A.˚ The
avoided crossing between the adiabatic potential curves is shown as dashed lines. At t = t0 the 310 nm pump
pulse creates a wavepacket at the inner turning point of the covalent (Na 2S, I2P3/2) potential curve at
R≈Re(X1Σ+) and P= 0. By adjusting the center wavelength of the pump pulse, the center total-energy (electronic
plus vibrational) of the wavepacket can be adjusted between 30,000 and 34,000 cm−1 . The excitation energy
of the ionic∼covalent curve crossing is ∼ 26, 000 cm−1 . The wavepacket is accelerated outward, passes through
the curve-crossing region at t?, and bifurcates, one part traveling on the bound ionic potential and the other
part traveling irreversibly outward on the unbound covalent potential. The ionic part is reflected at tR at the
outer turning point of the ionic potential, passes with P< 0 through the R= 6.93 ˚A curve crossing region where
it bifurcates again, and the resultant ionic and covalent parts are reflected outward at the inner turning points
of the ionic and covalent potential curves, respectively. Each outward passage of a wavepacket through the
curve crossing region results in a wavepacket traveling irreversibly outward on the unbound covalent
potential, eventually forming free Na(2S) and I(2P3/2) atoms. The probe pulse (not shown) interrogates the
dynamics by exciting Na(2S),I(2P3/2) weakly-bound molecules to a higher energy repulsive electronic state that
dissociates to Na(2P) + I(2P3/2) atoms. Excitation at centerwavelength longer than 589 nm samples NaI
molecules en route to full dissociation. Excitation centered at 589 nm provides what is essentially a time-
integrated sample of the accumulation of the free Na(2S) atoms. Reproduced with permission from Figure 1 in
T. S. Rose, M. J. Rosker, and A. H. Zewail, “Femtosecond real-time observations of wave packet oscillations
(resonance) in dissociation reactions,” J. Chem. Phys. 88, 6672–6673 (1988). Copyright 1988, AIP Publishing
LLC.
0
4
R
x
= 6.93Å
COVALENT Na +I
IONIC Na
+
+I
–
t
0
t
*
t
R
R(Å)
10
15
0
2
5
0
5
10
15
20
25
30
35
Energy (10
3
cm
–1
)
FS
pump (
λ
)
FS
probe (t,
λ
)
Na I*
Na
[
…
I]
‡
*
Na
[
……
I]
‡
*
Na + I + E
tr

Figure 3: Clocking of the Photodissociation of NaI (and NaBr) as the Nuclear Wavepacket Repeatedly
Traverses the Ionic/Covalent Curve Crossing (Figure 2 of Ref. 26). The wavepacket, illustrated in Fig. 6.5, is
created at t = t0 at the inner turning point on the covalent excited electronic state. At each outward-bound
traversal of the curve-crossing region, part of the wavepacket follows the covalent adiabatic curve irreversibly
outward to separated Na(2S)+I(2P3/2) atoms. If the probe laser centerwavelength is tuned slightly to the red of
the 589 nm free Na atom 2P←2S transition, each time a wavepacket of incompletely separated Na,I molecules
passes through the Optically Coupled Region, some not quite free Na atoms are excited to the 2P state, from
which spontaneous fluorescence is detected. The series of Na atom fluorescence pulses shown in Spectrum I
samples each outward passage of a wavepacket through the curve-crossing region. The temporal spacing of
the pulses corresponds to a 36 cm−1 vibrational frequency. When the center-wavelength of the probe laser is
tuned to 589 nm, the arrivals of free Na atom wavepackets are displayed in Spectrum II as a periodic series of
upward steps. Spectrum III shows that the (upper) adiabatic potential curve for NaBr is shallower and “leakier”
than that for NaI. Reproduced with permission from Figure 2 in T. S. Rose, M. J. Rosker, and A. H. Zewail,
“Femtosecond real-time observations of wave packet oscillations (resonance) in dissociation reactions,” J.
Chem. Phys. 88, 6672–6673 (1988). Copyright 1988, AIP Publishing LLC.
Ahmed Zewail was awarded the 1999 Nobel Prize in Chemistry for “Femtosecond Transition
State (FTS) Spectroscopy.” These experiments were described as the first time that the
mechanisms of real intramolecular dynamics were ”clocked” in real time. In a pump/probe
scheme, a femtosecond pump pulse creates a wavepacket on a repulsive or predissociated
electronically excited V1 potential energy surface at t = 0 by excitation from the v = 0 level of
the electronic ground state, V0 (ability to tune center energy of wavepacket by a small
500
fs
∆t (fs)
III
II

amount). After each excitation pulse, the time-evolving wavepacket is probed by a
femtosecond pulse with a chosen center wavelength at a time-delay t = τ. This delay time is
scanned, pulse-by-pulse, to determine the time at which the center of the wavepacket
crosses through the “Optically Coupled Region (OCR).” The probe pulse excites a portion of
the wavepacket from the V1 potential surface to a higher energy repulsive potential surface,
V2. The V2 potential surface is repulsive, dissociating to an electronically excited fragment.
The detected signal is the time-integrated ∼ 10 nanosecond lifetime fluorescence from this
excited fragment. The dynamically relevant information is encoded in the intensity vs. τ of
this time-integrated fluorescence, which samples the femtosecond passage of the
wavepacket through the OCR that is selected by the center wavelength of the probe pulse.
The ICN photodissociation experiment shows the effect of the presence of the I atom on the
frequency of the CN B2Σ+ − X2Σ+ electronic transition. As the I atom moves away from the CN
molecule, the energy of the CN electronic excitation increases from its value in the ICN
molecule to that of the free CN molecule. Did we know this before doing the experiment? As
the ICN bond stretches, the electronic structure of the CN moiety changes. This is
mechanism!
The photodissociation of NaI is mediated by a covalent-to-ionic curve crossing. The diabatic
(crossing) potential energy curves (solid lines) are the ones for which the electronic
character does not change rapidly as the molecule traverses the internuclear distance of the
curve crossing. The adiabatic curves (dashed lines), which are what “clamped nuclei”
quantum chemical calculations generate, exhibit a rapid change of electronic character at
the internuclear distance of the avoided crossing. As the molecule moves through the curve-
crossing region, it must decide whether it is going to follow the diabatic or the adiabatic
potential. Landau-Zener theory tells us the velocity-dependence of the probability of
jumping across the energy gap between the ionic and the covalent adiabatic curves. If you
drive too fast, you will be unable to stay on the road on a sharp curve. The sharpness of the
curve is determined by the magnitude of the interaction matrix element between the
diabatic potential curves. A very gentle curvature is the signature of a very large interaction
matrix element. In the Zewail experiments, the velocity in the curve-crossing region can be
systematically slightly adjusted by the choice of the center wavelength of the pump pulse.
At an NaI energy far above that of the curve-crossing, the velocity in the crossing region is
very large and the molecule stays on one of the diabatic potentials, in effect jumping the gap
between adiabatic curves. At an energy near that of the curve crossing, the molecule would
go through the crossing region slowly and stay on one of the adiabatic curves, with the result
that the wave packet that is born covalent, is nearly 100% converted to ionic at the
internuclear distance of the crossing. Zewail’s NaI experiments provide a direct
experimental determination of the internuclear distance of the curve crossing and an
explicit illustration of Landau-Zener theory.

Figure 1: Pump/Probe Scheme for Photodissociation of ICN (Figure 1 of Ref. 24). This is a reduced
dimension representation of three singlet potential energy surfaces of ICN: the bound ground electronic state,
V0 with minimum at Re, an excited unbound state, V1, which dissociates to CN(X2Σ+) and I(2P3/2), and a higher
energy unbound state, which dissociates to CN(B2Σ+) and I(2P3/2). A t = 0 pulse from the pump laser, with center
wavelength λ1, excites a vertical turning-point-to-turning-point (P0 = 0, P1 = 0) transition at R = R0 > Re to the
V1 potential surface. The wavepacket on the V1 potential surface experiences a force in the increasing RI-CN
direction, which causes the PI-CN momentum to increase monotonically with time. At t = τ , a pulse from the
probe laser, with center wavelength probes for the arrival of the wavepacket at RI-CN = R? or R∞ . The
energy of the vertical (ΔR=0) and momentumconserving (ΔP=0) transition also increases monotonically with
time as the wavepacket travels outward on V1. This V2−V1 transition is essentially an excitation of the CN B−X
electronic transition in the presence of the departing I atom. The R= RI-CN = R? Optically Coupled Region (OCR)
is interrogated by a probe pulse with center wavelength , where is the wavelength of the free CN
B−X v0 = 0 − v00 = 0 band. The detected signal is CN B-X spontaneous fluorescence. Reproduced with permission
from Figure 1 in M. J. Rosker, M. Dantus, and A. H. Zewail, “Femtosecond real-time probing of reactions. I. The
technique,”
J. Chem. Phys. 89, 6113–6127 (1988). Copyright 1988, AIP Publishing LLC.
Internuclear Separation

Figure 2: Wavepacket Transit through an Ionic∼Covalent Potential Energy Curve Crossing in NaI
(Figure 1 of Ref. 26). The diabatic (solid lines) Na+,I− and Na,I potential energy curves cross at Rx = 6.93A.˚ The
avoided crossing between the adiabatic potential curves is shown as dashed lines. At t = t0 the 310 nm pump
pulse creates a wavepacket at the inner turning point of the covalent (Na 2S, I2P3/2) potential curve at
R≈Re(X1Σ+) and P= 0. By adjusting the center wavelength of the pump pulse, the center total-energy (electronic
plus vibrational) of the wavepacket can be adjusted between 30,000 and 34,000 cm−1 . The excitation energy
of the ionic∼covalent curve crossing is ∼ 26, 000 cm−1 . The wavepacket is accelerated outward, passes through
the curve-crossing region at t?, and bifurcates, one part traveling on the bound ionic potential and the other
part traveling irreversibly outward on the unbound covalent potential. The ionic part is reflected at tR at the
outer turning point of the ionic potential, passes with P< 0 through the R= 6.93 ˚A curve crossing region where
it bifurcates again, and the resultant ionic and covalent parts are reflected outward at the inner turning points
of the ionic and covalent potential curves, respectively. Each outward passage of a wavepacket through the
curve crossing region results in a wavepacket traveling irreversibly outward on the unbound covalent
potential, eventually forming free Na(2S) and I(2P3/2) atoms. The probe pulse (not shown) interrogates the
dynamics by exciting Na(2S),I(2P3/2) weakly-bound molecules to a higher energy repulsive electronic state that
dissociates to Na(2P) + I(2P3/2) atoms. Excitation at centerwavelength longer than 589 nm samples NaI
molecules en route to full dissociation. Excitation centered at 589 nm provides what is essentially a time-
integrated sample of the accumulation of the free Na(2S) atoms. Reproduced with permission from Figure 1 in
T. S. Rose, M. J. Rosker, and A. H. Zewail, “Femtosecond real-time observations of wave packet oscillations
(resonance) in dissociation reactions,” J. Chem. Phys. 88, 6672–6673 (1988). Copyright 1988, AIP Publishing
LLC.
0
4
R
x
= 6.93Å
COVALENT Na +I
IONIC Na
+
+I
–
t
0
t
*
t
R
R(Å)
10
15
0
2
5
0
5
10
15
20
25
30
35
Energy (10
3
cm
–1
)
FS
pump (
λ
)
FS
probe (t,
λ
)
Na I*
Na
[
…
I]
‡
*
Na
[
……
I]
‡
*
Na + I + E
tr

Figure 3: Clocking of the Photodissociation of NaI (and NaBr) as the Nuclear Wavepacket Repeatedly
Traverses the Ionic/Covalent Curve Crossing (Figure 2 of Ref. 26). The wavepacket, illustrated in Fig. 6.5, is
created at t = t0 at the inner turning point on the covalent excited electronic state. At each outward-bound
traversal of the curve-crossing region, part of the wavepacket follows the covalent adiabatic curve irreversibly
outward to separated Na(2S)+I(2P3/2) atoms. If the probe laser centerwavelength is tuned slightly to the red of
the 589 nm free Na atom 2P←2S transition, each time a wavepacket of incompletely separated Na,I molecules
passes through the Optically Coupled Region, some not quite free Na atoms are excited to the 2P state, from
which spontaneous fluorescence is detected. The series of Na atom fluorescence pulses shown in Spectrum I
samples each outward passage of a wavepacket through the curve-crossing region. The temporal spacing of
the pulses corresponds to a 36 cm−1 vibrational frequency. When the center-wavelength of the probe laser is
tuned to 589 nm, the arrivals of free Na atom wavepackets are displayed in Spectrum II as a periodic series of
upward steps. Spectrum III shows that the (upper) adiabatic potential curve for NaBr is shallower and “leakier”
than that for NaI. Reproduced with permission from Figure 2 in T. S. Rose, M. J. Rosker, and A. H. Zewail,
“Femtosecond real-time observations of wave packet oscillations (resonance) in dissociation reactions,” J.
Chem. Phys. 88, 6672–6673 (1988). Copyright 1988, AIP Publishing LLC.
Ahmed Zewail was awarded the 1999 Nobel Prize in Chemistry for “Femtosecond Transition
State (FTS) Spectroscopy.” These experiments were described as the first time that the
mechanisms of real intramolecular dynamics were ”clocked” in real time. In a pump/probe
scheme, a femtosecond pump pulse creates a wavepacket on a repulsive or predissociated
electronically excited V1 potential energy surface at t = 0 by excitation from the v = 0 level of
the electronic ground state, V0 (ability to tune center energy of wavepacket by a small
500
fs
∆t (fs)
III
II

amount). After each excitation pulse, the time-evolving wavepacket is probed by a
femtosecond pulse with a chosen center wavelength at a time-delay t = τ. This delay time is
scanned, pulse-by-pulse, to determine the time at which the center of the wavepacket
crosses through the “Optically Coupled Region (OCR).” The probe pulse excites a portion of
the wavepacket from the V1 potential surface to a higher energy repulsive potential surface,
V2. The V2 potential surface is repulsive, dissociating to an electronically excited fragment.
The detected signal is the time-integrated ∼ 10 nanosecond lifetime fluorescence from this
excited fragment. The dynamically relevant information is encoded in the intensity vs. τ of
this time-integrated fluorescence, which samples the femtosecond passage of the
wavepacket through the OCR that is selected by the center wavelength of the probe pulse.
The ICN photodissociation experiment shows the effect of the presence of the I atom on the
frequency of the CN B2Σ+ − X2Σ+ electronic transition. As the I atom moves away from the CN
molecule, the energy of the CN electronic excitation increases from its value in the ICN
molecule to that of the free CN molecule. Did we know this before doing the experiment? As
the ICN bond stretches, the electronic structure of the CN moiety changes. This is
mechanism!
The photodissociation of NaI is mediated by a covalent-to-ionic curve crossing. The diabatic
(crossing) potential energy curves (solid lines) are the ones for which the electronic
character does not change rapidly as the molecule traverses the internuclear distance of the
curve crossing. The adiabatic curves (dashed lines), which are what “clamped nuclei”
quantum chemical calculations generate, exhibit a rapid change of electronic character at
the internuclear distance of the avoided crossing. As the molecule moves through the curve-
crossing region, it must decide whether it is going to follow the diabatic or the adiabatic
potential. Landau-Zener theory tells us the velocity-dependence of the probability of
jumping across the energy gap between the ionic and the covalent adiabatic curves. If you
drive too fast, you will be unable to stay on the road on a sharp curve. The sharpness of the
curve is determined by the magnitude of the interaction matrix element between the
diabatic potential curves. A very gentle curvature is the signature of a very large interaction
matrix element. In the Zewail experiments, the velocity in the curve-crossing region can be
systematically slightly adjusted by the choice of the center wavelength of the pump pulse.
At an NaI energy far above that of the curve-crossing, the velocity in the crossing region is
very large and the molecule stays on one of the diabatic potentials, in effect jumping the gap
between adiabatic curves. At an energy near that of the curve crossing, the molecule would
go through the crossing region slowly and stay on one of the adiabatic curves, with the result
that the wave packet that is born covalent, is nearly 100% converted to ionic at the
internuclear distance of the crossing. Zewail’s NaI experiments provide a direct
experimental determination of the internuclear distance of the curve crossing and an
explicit illustration of Landau-Zener theory.

Figure 1: Pump/Probe Scheme for Photodissociation of ICN (Figure 1 of Ref. 24). This is a reduced
dimension representation of three singlet potential energy surfaces of ICN: the bound ground electronic state,
V0 with minimum at Re, an excited unbound state, V1, which dissociates to CN(X2Σ+) and I(2P3/2), and a higher
energy unbound state, which dissociates to CN(B2Σ+) and I(2P3/2). A t = 0 pulse from the pump laser, with center
wavelength λ1, excites a vertical turning-point-to-turning-point (P0 = 0, P1 = 0) transition at R = R0 > Re to the
V1 potential surface. The wavepacket on the V1 potential surface experiences a force in the increasing RI-CN
direction, which causes the PI-CN momentum to increase monotonically with time. At t = τ , a pulse from the
probe laser, with center wavelength probes for the arrival of the wavepacket at RI-CN = R? or R∞ . The
energy of the vertical (ΔR=0) and momentumconserving (ΔP=0) transition also increases monotonically with
time as the wavepacket travels outward on V1. This V2−V1 transition is essentially an excitation of the CN B−X
electronic transition in the presence of the departing I atom. The R= RI-CN = R? Optically Coupled Region (OCR)
is interrogated by a probe pulse with center wavelength , where is the wavelength of the free CN
B−X v0 = 0 − v00 = 0 band. The detected signal is CN B-X spontaneous fluorescence. Reproduced with permission
from Figure 1 in M. J. Rosker, M. Dantus, and A. H. Zewail, “Femtosecond real-time probing of reactions. I. The
technique,”
J. Chem. Phys. 89, 6113–6127 (1988). Copyright 1988, AIP Publishing LLC.
Internuclear Separation

Figure 2: Wavepacket Transit through an Ionic∼Covalent Potential Energy Curve Crossing in NaI
(Figure 1 of Ref. 26). The diabatic (solid lines) Na+,I− and Na,I potential energy curves cross at Rx = 6.93A.˚ The
avoided crossing between the adiabatic potential curves is shown as dashed lines. At t = t0 the 310 nm pump
pulse creates a wavepacket at the inner turning point of the covalent (Na 2S, I2P3/2) potential curve at
R≈Re(X1Σ+) and P= 0. By adjusting the center wavelength of the pump pulse, the center total-energy (electronic
plus vibrational) of the wavepacket can be adjusted between 30,000 and 34,000 cm−1 . The excitation energy
of the ionic∼covalent curve crossing is ∼ 26, 000 cm−1 . The wavepacket is accelerated outward, passes through
the curve-crossing region at t?, and bifurcates, one part traveling on the bound ionic potential and the other
part traveling irreversibly outward on the unbound covalent potential. The ionic part is reflected at tR at the
outer turning point of the ionic potential, passes with P< 0 through the R= 6.93 ˚A curve crossing region where
it bifurcates again, and the resultant ionic and covalent parts are reflected outward at the inner turning points
of the ionic and covalent potential curves, respectively. Each outward passage of a wavepacket through the
curve crossing region results in a wavepacket traveling irreversibly outward on the unbound covalent
potential, eventually forming free Na(2S) and I(2P3/2) atoms. The probe pulse (not shown) interrogates the
dynamics by exciting Na(2S),I(2P3/2) weakly-bound molecules to a higher energy repulsive electronic state that
dissociates to Na(2P) + I(2P3/2) atoms. Excitation at centerwavelength longer than 589 nm samples NaI
molecules en route to full dissociation. Excitation centered at 589 nm provides what is essentially a time-
integrated sample of the accumulation of the free Na(2S) atoms. Reproduced with permission from Figure 1 in
T. S. Rose, M. J. Rosker, and A. H. Zewail, “Femtosecond real-time observations of wave packet oscillations
(resonance) in dissociation reactions,” J. Chem. Phys. 88, 6672–6673 (1988). Copyright 1988, AIP Publishing
LLC.
0
4
R
x
= 6.93Å
COVALENT Na +I
IONIC Na
+
+I
–
t
0
t
*
t
R
R(Å)
10
15
0
2
5
0
5
10
15
20
25
30
35
Energy (10
3
cm
–1
)
FS
pump (
λ
)
FS
probe (t,
λ
)
Na I*
Na
[
…
I]
‡
*
Na
[
……
I]
‡
*
Na + I + E
tr

Figure 3: Clocking of the Photodissociation of NaI (and NaBr) as the Nuclear Wavepacket Repeatedly
Traverses the Ionic/Covalent Curve Crossing (Figure 2 of Ref. 26). The wavepacket, illustrated in Fig. 6.5, is
created at t = t0 at the inner turning point on the covalent excited electronic state. At each outward-bound
traversal of the curve-crossing region, part of the wavepacket follows the covalent adiabatic curve irreversibly
outward to separated Na(2S)+I(2P3/2) atoms. If the probe laser centerwavelength is tuned slightly to the red of
the 589 nm free Na atom 2P←2S transition, each time a wavepacket of incompletely separated Na,I molecules
passes through the Optically Coupled Region, some not quite free Na atoms are excited to the 2P state, from
which spontaneous fluorescence is detected. The series of Na atom fluorescence pulses shown in Spectrum I
samples each outward passage of a wavepacket through the curve-crossing region. The temporal spacing of
the pulses corresponds to a 36 cm−1 vibrational frequency. When the center-wavelength of the probe laser is
tuned to 589 nm, the arrivals of free Na atom wavepackets are displayed in Spectrum II as a periodic series of
upward steps. Spectrum III shows that the (upper) adiabatic potential curve for NaBr is shallower and “leakier”
than that for NaI. Reproduced with permission from Figure 2 in T. S. Rose, M. J. Rosker, and A. H. Zewail,
“Femtosecond real-time observations of wave packet oscillations (resonance) in dissociation reactions,” J.
Chem. Phys. 88, 6672–6673 (1988). Copyright 1988, AIP Publishing LLC. Ahmed Zewail was awarded the
1999 Nobel Prize in Chemistry for “Femtosecond Transition State (FTS) Spectroscopy.”
These experiments were described as the first time that the mechanisms of real
intramolecular dynamics were ”clocked” in real time. In a pump/probe scheme, a
femtosecond pump pulse creates a wavepacket on a repulsive or predissociated
electronically excited V1 potential energy surface at t = 0 by excitation from the v = 0 level of
the electronic ground state, V0 (ability to tune center energy of wavepacket by a small
500
fs
∆t (fs)
III
II

amount). After each excitation pulse, the time-evolving wavepacket is probed by a
femtosecond pulse with a chosen center wavelength at a time-delay t = τ. This delay time is
scanned, pulse-by-pulse, to determine the time at which the center of the wavepacket
crosses through the “Optically Coupled Region (OCR).” The probe pulse excites a portion of
the wavepacket from the V1 potential surface to a higher energy repulsive potential surface,
V2. The V2 potential surface is repulsive, dissociating to an electronically excited fragment.
The detected signal is the time-integrated ∼ 10 nanosecond lifetime fluorescence from this
excited fragment. The dynamically relevant information is encoded in the intensity vs. τ of
this time-integrated fluorescence, which samples the femtosecond passage of the
wavepacket through the OCR that is selected by the center wavelength of the probe pulse.
The ICN photodissociation experiment shows the effect of the presence of the I atom on the
frequency of the CN B2Σ+ − X2Σ+ electronic transition. As the I atom moves away from the CN
molecule, the energy of the CN electronic excitation increases from its value in the ICN
molecule to that of the free CN molecule. Did we know this before doing the experiment? As
the ICN bond stretches, the electronic structure of the CN moiety changes. This is
mechanism!
The photodissociation of NaI is mediated by a covalent-to-ionic curve crossing. The diabatic
(crossing) potential energy curves (solid lines) are the ones for which the electronic
character does not change rapidly as the molecule traverses the internuclear distance of the
curve crossing. The adiabatic curves (dashed lines), which are what “clamped nuclei”
quantum chemical calculations generate, exhibit a rapid change of electronic character at
the internuclear distance of the avoided crossing. As the molecule moves through the curve-
crossing region, it must decide whether it is going to follow the diabatic or the adiabatic
potential. Landau-Zener theory tells us the velocity-dependence of the probability of
jumping across the energy gap between the ionic and the covalent adiabatic curves. If you
drive too fast, you will be unable to stay on the road on a sharp curve. The sharpness of the
curve is determined by the magnitude of the interaction matrix element between the
diabatic potential curves. A very gentle curvature is the signature of a very large interaction
matrix element. In the Zewail experiments, the velocity in the curve-crossing region can be
systematically slightly adjusted by the choice of the center wavelength of the pump pulse.
At an NaI energy far above that of the curve-crossing, the velocity in the crossing region is
very large and the molecule stays on one of the diabatic potentials, in effect jumping the gap
between adiabatic curves. At an energy near that of the curve crossing, the molecule would
go through the crossing region slowly and stay on one of the adiabatic curves, with the result
that the wave packet that is born covalent, is nearly 100% converted to ionic at the
internuclear distance of the crossing. Zewail’s NaI experiments provide a direct
experimental determination of the internuclear distance of the curve crossing and an
explicit illustration of Landau-Zener theory.

Figure 1: Pump/Probe Scheme for Photodissociation of ICN (Figure 1 of Ref. 24). This is a reduced
dimension representation of three singlet potential energy surfaces of ICN: the bound ground electronic state,
V0 with minimum at Re, an excited unbound state, V1, which dissociates to CN(X2Σ+) and I(2P3/2), and a higher
energy unbound state, which dissociates to CN(B2Σ+) and I(2P3/2). A t = 0 pulse from the pump laser, with center
wavelength λ1, excites a vertical turning-point-to-turning-point (P0 = 0, P1 = 0) transition at R = R0 > Re to the
V1 potential surface. The wavepacket on the V1 potential surface experiences a force in the increasing RI-CN
direction, which causes the PI-CN momentum to increase monotonically with time. At t = τ , a pulse from the
probe laser, with center wavelength probes for the arrival of the wavepacket at RI-CN = R? or R∞ . The
energy of the vertical (ΔR=0) and momentumconserving (ΔP=0) transition also increases monotonically with
time as the wavepacket travels outward on V1. This V2−V1 transition is essentially an excitation of the CN B−X
electronic transition in the presence of the departing I atom. The R= RI-CN = R? Optically Coupled Region (OCR)
is interrogated by a probe pulse with center wavelength , where is the wavelength of the free CN
B−X v0 = 0 − v00 = 0 band. The detected signal is CN B-X spontaneous fluorescence. Reproduced with permission
from Figure 1 in M. J. Rosker, M. Dantus, and A. H. Zewail, “Femtosecond real-time probing of reactions. I. The
technique,”
J. Chem. Phys. 89, 6113–6127 (1988). Copyright 1988, AIP Publishing LLC.
Internuclear Separation

Figure 2: Wavepacket Transit through an Ionic∼Covalent Potential Energy Curve Crossing in NaI
(Figure 1 of Ref. 26). The diabatic (solid lines) Na+,I− and Na,I potential energy curves cross at Rx = 6.93A.˚ The
avoided crossing between the adiabatic potential curves is shown as dashed lines. At t = t0 the 310 nm pump
pulse creates a wavepacket at the inner turning point of the covalent (Na 2S, I2P3/2) potential curve at
R≈Re(X1Σ+) and P= 0. By adjusting the center wavelength of the pump pulse, the center total-energy (electronic
plus vibrational) of the wavepacket can be adjusted between 30,000 and 34,000 cm−1 . The excitation energy
of the ionic∼covalent curve crossing is ∼ 26, 000 cm−1 . The wavepacket is accelerated outward, passes through
the curve-crossing region at t?, and bifurcates, one part traveling on the bound ionic potential and the other
part traveling irreversibly outward on the unbound covalent potential. The ionic part is reflected at tR at the
outer turning point of the ionic potential, passes with P< 0 through the R= 6.93 ˚A curve crossing region where
it bifurcates again, and the resultant ionic and covalent parts are reflected outward at the inner turning points
of the ionic and covalent potential curves, respectively. Each outward passage of a wavepacket through the
curve crossing region results in a wavepacket traveling irreversibly outward on the unbound covalent
potential, eventually forming free Na(2S) and I(2P3/2) atoms. The probe pulse (not shown) interrogates the
dynamics by exciting Na(2S),I(2P3/2) weakly-bound molecules to a higher energy repulsive electronic state that
dissociates to Na(2P) + I(2P3/2) atoms. Excitation at centerwavelength longer than 589 nm samples NaI
molecules en route to full dissociation. Excitation centered at 589 nm provides what is essentially a time-
integrated sample of the accumulation of the free Na(2S) atoms. Reproduced with permission from Figure 1 in
T. S. Rose, M. J. Rosker, and A. H. Zewail, “Femtosecond real-time observations of wave packet oscillations
(resonance) in dissociation reactions,” J. Chem. Phys. 88, 6672–6673 (1988). Copyright 1988, AIP Publishing
LLC.
0
4
R
x
= 6.93Å
COVALENT Na +I
IONIC Na
+
+I
–
t
0
t
*
t
R
R(Å)
10
15
0
2
5
0
5
10
15
20
25
30
35
Energy (10
3
cm
–1
)
FS
pump (
λ
)
FS
probe (t,
λ
)
Na I*
Na
[
…
I]
‡
*
Na
[
……
I]
‡
*
Na + I + E
tr

Figure 3: Clocking of the Photodissociation of NaI (and NaBr) as the Nuclear Wavepacket Repeatedly
Traverses the Ionic/Covalent Curve Crossing (Figure 2 of Ref. 26). The wavepacket, illustrated in Fig. 6.5, is
created at t = t0 at the inner turning point on the covalent excited electronic state. At each outward-bound
traversal of the curve-crossing region, part of the wavepacket follows the covalent adiabatic curve irreversibly
outward to separated Na(2S)+I(2P3/2) atoms. If the probe laser centerwavelength is tuned slightly to the red of
the 589 nm free Na atom 2P←2S transition, each time a wavepacket of incompletely separated Na,I molecules
passes through the Optically Coupled Region, some not quite free Na atoms are excited to the 2P state, from
which spontaneous fluorescence is detected. The series of Na atom fluorescence pulses shown in Spectrum I
samples each outward passage of a wavepacket through the curve-crossing region. The temporal spacing of
the pulses corresponds to a 36 cm−1 vibrational frequency. When the center-wavelength of the probe laser is
tuned to 589 nm, the arrivals of free Na atom wavepackets are displayed in Spectrum II as a periodic series of
upward steps. Spectrum III shows that the (upper) adiabatic potential curve for NaBr is shallower and “leakier”
than that for NaI. Reproduced with permission from Figure 2 in T. S. Rose, M. J. Rosker, and A. H. Zewail,
“Femtosecond real-time observations of wave packet oscillations (resonance) in dissociation reactions,” J.
Chem. Phys. 88, 6672–6673 (1988). Copyright 1988, AIP Publishing LLC.
Ahmed Zewail was awarded the 1999 Nobel Prize in Chemistry for “Femtosecond Transition
State (FTS) Spectroscopy.” These experiments were described as the first time that the
mechanisms of real intramolecular dynamics were ”clocked” in real time. In a pump/probe
scheme, a femtosecond pump pulse creates a wavepacket on a repulsive or predissociated
electronically excited V1 potential energy surface at t = 0 by excitation from the v = 0 level of
the electronic ground state, V0 (ability to tune center energy of wavepacket by a small
500
fs
∆t (fs)
III
II

amount). After each excitation pulse, the time-evolving wavepacket is probed by a
femtosecond pulse with a chosen center wavelength at a time-delay t = τ. This delay time is
scanned, pulse-by-pulse, to determine the time at which the center of the wavepacket
crosses through the “Optically Coupled Region (OCR).” The probe pulse excites a portion of
the wavepacket from the V1 potential surface to a higher energy repulsive potential surface,
V2. The V2 potential surface is repulsive, dissociating to an electronically excited fragment.
The detected signal is the time-integrated ∼ 10 nanosecond lifetime fluorescence from this
excited fragment. The dynamically relevant information is encoded in the intensity vs. τ of
this time-integrated fluorescence, which samples the femtosecond passage of the
wavepacket through the OCR that is selected by the center wavelength of the probe pulse.
The ICN photodissociation experiment shows the effect of the presence of the I atom on the
frequency of the CN B2Σ+ − X2Σ+ electronic transition. As the I atom moves away from the CN
molecule, the energy of the CN electronic excitation increases from its value in the ICN
molecule to that of the free CN molecule. Did we know this before doing the experiment? As
the ICN bond stretches, the electronic structure of the CN moiety changes. This is
mechanism!
The photodissociation of NaI is mediated by a covalent-to-ionic curve crossing. The diabatic
(crossing) potential energy curves (solid lines) are the ones for which the electronic
character does not change rapidly as the molecule traverses the internuclear distance of the
curve crossing. The adiabatic curves (dashed lines), which are what “clamped nuclei”
quantum chemical calculations generate, exhibit a rapid change of electronic character at
the internuclear distance of the avoided crossing. As the molecule moves through the curve-
crossing region, it must decide whether it is going to follow the diabatic or the adiabatic
potential. Landau-Zener theory tells us the velocity-dependence of the probability of
jumping across the energy gap between the ionic and the covalent adiabatic curves. If you
drive too fast, you will be unable to stay on the road on a sharp curve. The sharpness of the
curve is determined by the magnitude of the interaction matrix element between the
diabatic potential curves. A very gentle curvature is the signature of a very large interaction
matrix element. In the Zewail experiments, the velocity in the curve-crossing region can be
systematically slightly adjusted by the choice of the center wavelength of the pump pulse.
At an NaI energy far above that of the curve-crossing, the velocity in the crossing region is
very large and the molecule stays on one of the diabatic potentials, in effect jumping the gap
between adiabatic curves. At an energy near that of the curve crossing, the molecule would
go through the crossing region slowly and stay on one of the adiabatic curves, with the result
that the wave packet that is born covalent, is nearly 100% converted to ionic at the
internuclear distance of the crossing. Zewail’s NaI experiments provide a direct
experimental determination of the internuclear distance of the curve crossing and an
explicit illustration of Landau-Zener theory.

Figure 1: Pump/Probe Scheme for Photodissociation of ICN (Figure 1 of Ref. 24). This is a reduced
dimension representation of three singlet potential energy surfaces of ICN: the bound ground electronic state,
V0 with minimum at Re, an excited unbound state, V1, which dissociates to CN(X2Σ+) and I(2P3/2), and a higher
energy unbound state, which dissociates to CN(B2Σ+) and I(2P3/2). A t = 0 pulse from the pump laser, with center
wavelength λ1, excites a vertical turning-point-to-turning-point (P0 = 0, P1 = 0) transition at R = R0 > Re to the
V1 potential surface. The wavepacket on the V1 potential surface experiences a force in the increasing RI-CN
direction, which causes the PI-CN momentum to increase monotonically with time. At t = τ , a pulse from the
probe laser, with center wavelength probes for the arrival of the wavepacket at RI-CN = R? or R∞ . The
energy of the vertical (ΔR=0) and momentumconserving (ΔP=0) transition also increases monotonically with
time as the wavepacket travels outward on V1. This V2−V1 transition is essentially an excitation of the CN B−X
electronic transition in the presence of the departing I atom. The R= RI-CN = R? Optically Coupled Region (OCR)
is interrogated by a probe pulse with center wavelength , where is the wavelength of the free CN
B−X v0 = 0 − v00 = 0 band. The detected signal is CN B-X spontaneous fluorescence. Reproduced with permission
from Figure 1 in M. J. Rosker, M. Dantus, and A. H. Zewail, “Femtosecond real-time probing of reactions. I. The
technique,”
J. Chem. Phys. 89, 6113–6127 (1988). Copyright 1988, AIP Publishing LLC.
Internuclear Separation

Figure 2: Wavepacket Transit through an Ionic∼Covalent Potential Energy Curve Crossing in NaI
(Figure 1 of Ref. 26). The diabatic (solid lines) Na+,I− and Na,I potential energy curves cross at Rx = 6.93A.˚ The
avoided crossing between the adiabatic potential curves is shown as dashed lines. At t = t0 the 310 nm pump
pulse creates a wavepacket at the inner turning point of the covalent (Na 2S, I2P3/2) potential curve at
R≈Re(X1Σ+) and P= 0. By adjusting the center wavelength of the pump pulse, the center total-energy (electronic
plus vibrational) of the wavepacket can be adjusted between 30,000 and 34,000 cm−1 . The excitation energy
of the ionic∼covalent curve crossing is ∼ 26, 000 cm−1 . The wavepacket is accelerated outward, passes through
the curve-crossing region at t?, and bifurcates, one part traveling on the bound ionic potential and the other
part traveling irreversibly outward on the unbound covalent potential. The ionic part is reflected at tR at the
outer turning point of the ionic potential, passes with P< 0 through the R= 6.93 ˚A curve crossing region where
it bifurcates again, and the resultant ionic and covalent parts are reflected outward at the inner turning points
of the ionic and covalent potential curves, respectively. Each outward passage of a wavepacket through the
curve crossing region results in a wavepacket traveling irreversibly outward on the unbound covalent
potential, eventually forming free Na(2S) and I(2P3/2) atoms. The probe pulse (not shown) interrogates the
dynamics by exciting Na(2S),I(2P3/2) weakly-bound molecules to a higher energy repulsive electronic state that
dissociates to Na(2P) + I(2P3/2) atoms. Excitation at centerwavelength longer than 589 nm samples NaI
molecules en route to full dissociation. Excitation centered at 589 nm provides what is essentially a time-
integrated sample of the accumulation of the free Na(2S) atoms. Reproduced with permission from Figure 1 in
T. S. Rose, M. J. Rosker, and A. H. Zewail, “Femtosecond real-time observations of wave packet oscillations
(resonance) in dissociation reactions,” J. Chem. Phys. 88, 6672–6673 (1988). Copyright 1988, AIP Publishing
LLC.
0
4
R
x
= 6.93Å
COVALENT Na +I
IONIC Na
+
+I
–
t
0
t
*
t
R
R(Å)
10
15
0
2
5
0
5
10
15
20
25
30
35
Energy (10
3
cm
–1
)
FS
pump (
λ
)
FS
probe (t,
λ
)
Na I*
Na
[
…
I]
‡
*
Na
[
……
I]
‡
*
Na + I + E
tr

Figure 3: Clocking of the Photodissociation of NaI (and NaBr) as the Nuclear Wavepacket Repeatedly
Traverses the Ionic/Covalent Curve Crossing (Figure 2 of Ref. 26). The wavepacket, illustrated in Fig. 6.5, is
created at t = t0 at the inner turning point on the covalent excited electronic state. At each outward-bound
traversal of the curve-crossing region, part of the wavepacket follows the covalent adiabatic curve irreversibly
outward to separated Na(2S)+I(2P3/2) atoms. If the probe laser centerwavelength is tuned slightly to the red of
the 589 nm free Na atom 2P←2S transition, each time a wavepacket of incompletely separated Na,I molecules
passes through the Optically Coupled Region, some not quite free Na atoms are excited to the 2P state, from
which spontaneous fluorescence is detected. The series of Na atom fluorescence pulses shown in Spectrum I
samples each outward passage of a wavepacket through the curve-crossing region. The temporal spacing of
the pulses corresponds to a 36 cm−1 vibrational frequency. When the center-wavelength of the probe laser is
tuned to 589 nm, the arrivals of free Na atom wavepackets are displayed in Spectrum II as a periodic series of
upward steps. Spectrum III shows that the (upper) adiabatic potential curve for NaBr is shallower and “leakier”
than that for NaI. Reproduced with permission from Figure 2 in T. S. Rose, M. J. Rosker, and A. H. Zewail,
“Femtosecond real-time observations of wave packet oscillations (resonance) in dissociation reactions,” J.
Chem. Phys. 88, 6672–6673 (1988). Copyright 1988, AIP Publishing LLC.
Ahmed Zewail was awarded the 1999 Nobel Prize in Chemistry for “Femtosecond Transition
State (FTS) Spectroscopy.” These experiments were described as the first time that the
mechanisms of real intramolecular dynamics were ”clocked” in real time. In a pump/probe
scheme, a femtosecond pump pulse creates a wavepacket on a repulsive or predissociated
electronically excited V1 potential energy surface at t = 0 by excitation from the v = 0 level of
the electronic ground state, V0 (ability to tune center energy of wavepacket by a small
500
fs
∆t (fs)
III
II

amount). After each excitation pulse, the time-evolving wavepacket is probed by a
femtosecond pulse with a chosen center wavelength at a time-delay t = τ. This delay time is
scanned, pulse-by-pulse, to determine the time at which the center of the wavepacket
crosses through the “Optically Coupled Region (OCR).” The probe pulse excites a portion of
the wavepacket from the V1 potential surface to a higher energy repulsive potential surface,
V2. The V2 potential surface is repulsive, dissociating to an electronically excited fragment.
The detected signal is the time-integrated ∼ 10 nanosecond lifetime fluorescence from this
excited fragment. The dynamically relevant information is encoded in the intensity vs. τ of
this time-integrated fluorescence, which samples the femtosecond passage of the
wavepacket through the OCR that is selected by the center wavelength of the probe pulse.
The ICN photodissociation experiment shows the effect of the presence of the I atom on the
frequency of the CN B2Σ+ − X2Σ+ electronic transition. As the I atom moves away from the CN
molecule, the energy of the CN electronic excitation increases from its value in the ICN
molecule to that of the free CN molecule. Did we know this before doing the experiment? As
the ICN bond stretches, the electronic structure of the CN moiety changes. This is
mechanism!
The photodissociation of NaI is mediated by a covalent-to-ionic curve crossing. The diabatic
(crossing) potential energy curves (solid lines) are the ones for which the electronic
character does not change rapidly as the molecule traverses the internuclear distance of the
curve crossing. The adiabatic curves (dashed lines), which are what “clamped nuclei”
quantum chemical calculations generate, exhibit a rapid change of electronic character at
the internuclear distance of the avoided crossing. As the molecule moves through the curve-
crossing region, it must decide whether it is going to follow the diabatic or the adiabatic
potential. Landau-Zener theory tells us the velocity-dependence of the probability of
jumping across the energy gap between the ionic and the covalent adiabatic curves. If you
drive too fast, you will be unable to stay on the road on a sharp curve. The sharpness of the
curve is determined by the magnitude of the interaction matrix element between the
diabatic potential curves. A very gentle curvature is the signature of a very large interaction
matrix element. In the Zewail experiments, the velocity in the curve-crossing region can be
systematically slightly adjusted by the choice of the center wavelength of the pump pulse.
At an NaI energy far above that of the curve-crossing, the velocity in the crossing region is
very large and the molecule stays on one of the diabatic potentials, in effect jumping the gap
between adiabatic curves. At an energy near that of the curve crossing, the molecule would
go through the crossing region slowly and stay on one of the adiabatic curves, with the result
that the wave packet that is born covalent, is nearly 100% converted to ionic at the
internuclear distance of the crossing. Zewail’s NaI experiments provide a direct
experimental determination of the internuclear distance of the curve crossing and an
explicit illustration of Landau-Zener theory.

Figure 1: Pump/Probe Scheme for Photodissociation of ICN (Figure 1 of Ref. 24). This is a reduced
dimension representation of three singlet potential energy surfaces of ICN: the bound ground electronic state,
V0 with minimum at Re, an excited unbound state, V1, which dissociates to CN(X2Σ+) and I(2P3/2), and a higher
energy unbound state, which dissociates to CN(B2Σ+) and I(2P3/2). A t = 0 pulse from the pump laser, with center
wavelength λ1, excites a vertical turning-point-to-turning-point (P0 = 0, P1 = 0) transition at R = R0 > Re to the
V1 potential surface. The wavepacket on the V1 potential surface experiences a force in the increasing RI-CN
direction, which causes the PI-CN momentum to increase monotonically with time. At t = τ , a pulse from the
probe laser, with center wavelength probes for the arrival of the wavepacket at RI-CN = R? or R∞ . The
energy of the vertical (ΔR=0) and momentumconserving (ΔP=0) transition also increases monotonically with
time as the wavepacket travels outward on V1. This V2−V1 transition is essentially an excitation of the CN B−X
electronic transition in the presence of the departing I atom. The R= RI-CN = R? Optically Coupled Region (OCR)
is interrogated by a probe pulse with center wavelength , where is the wavelength of the free CN
B−X v0 = 0 − v00 = 0 band. The detected signal is CN B-X spontaneous fluorescence. Reproduced with permission
from Figure 1 in M. J. Rosker, M. Dantus, and A. H. Zewail, “Femtosecond real-time probing of reactions. I. The
technique,”
J. Chem. Phys. 89, 6113–6127 (1988). Copyright 1988, AIP Publishing LLC.
Internuclear Separation

Figure 2: Wavepacket Transit through an Ionic∼Covalent Potential Energy Curve Crossing in NaI
(Figure 1 of Ref. 26). The diabatic (solid lines) Na+,I− and Na,I potential energy curves cross at Rx = 6.93A.˚ The
avoided crossing between the adiabatic potential curves is shown as dashed lines. At t = t0 the 310 nm pump
pulse creates a wavepacket at the inner turning point of the covalent (Na 2S, I2P3/2) potential curve at
R≈Re(X1Σ+) and P= 0. By adjusting the center wavelength of the pump pulse, the center total-energy (electronic
plus vibrational) of the wavepacket can be adjusted between 30,000 and 34,000 cm−1 . The excitation energy
of the ionic∼covalent curve crossing is ∼ 26, 000 cm−1 . The wavepacket is accelerated outward, passes through
the curve-crossing region at t?, and bifurcates, one part traveling on the bound ionic potential and the other
part traveling irreversibly outward on the unbound covalent potential. The ionic part is reflected at tR at the
outer turning point of the ionic potential, passes with P< 0 through the R= 6.93 ˚A curve crossing region where
it bifurcates again, and the resultant ionic and covalent parts are reflected outward at the inner turning points
of the ionic and covalent potential curves, respectively. Each outward passage of a wavepacket through the
curve crossing region results in a wavepacket traveling irreversibly outward on the unbound covalent
potential, eventually forming free Na(2S) and I(2P3/2) atoms. The probe pulse (not shown) interrogates the
dynamics by exciting Na(2S),I(2P3/2) weakly-bound molecules to a higher energy repulsive electronic state that
dissociates to Na(2P) + I(2P3/2) atoms. Excitation at centerwavelength longer than 589 nm samples NaI
molecules en route to full dissociation. Excitation centered at 589 nm provides what is essentially a time-
integrated sample of the accumulation of the free Na(2S) atoms. Reproduced with permission from Figure 1 in
T. S. Rose, M. J. Rosker, and A. H. Zewail, “Femtosecond real-time observations of wave packet oscillations
(resonance) in dissociation reactions,” J. Chem. Phys. 88, 6672–6673 (1988). Copyright 1988, AIP Publishing
LLC.
0
4
R
x
= 6.93Å
COVALENT Na +I
IONIC Na
+
+I
–
t
0
t
*
t
R
R(Å)
10
15
0
2
5
0
5
10
15
20
25
30
35
Energy (10
3
cm
–1
)
FS
pump (
λ
)
FS
probe (t,
λ
)
Na I*
Na
[
…
I]
‡
*
Na
[
……
I]
‡
*
Na + I + E
tr

Figure 3: Clocking of the Photodissociation of NaI (and NaBr) as the Nuclear Wavepacket Repeatedly
Traverses the Ionic/Covalent Curve Crossing (Figure 2 of Ref. 26). The wavepacket, illustrated in Fig. 6.5, is
created at t = t0 at the inner turning point on the covalent excited electronic state. At each outward-bound
traversal of the curve-crossing region, part of the wavepacket follows the covalent adiabatic curve irreversibly
outward to separated Na(2S)+I(2P3/2) atoms. If the probe laser centerwavelength is tuned slightly to the red of
the 589 nm free Na atom 2P←2S transition, each time a wavepacket of incompletely separated Na,I molecules
passes through the Optically Coupled Region, some not quite free Na atoms are excited to the 2P state, from
which spontaneous fluorescence is detected. The series of Na atom fluorescence pulses shown in Spectrum I
samples each outward passage of a wavepacket through the curve-crossing region. The temporal spacing of
the pulses corresponds to a 36 cm−1 vibrational frequency. When the center-wavelength of the probe laser is
tuned to 589 nm, the arrivals of free Na atom wavepackets are displayed in Spectrum II as a periodic series of
upward steps. Spectrum III shows that the (upper) adiabatic potential curve for NaBr is shallower and “leakier”
than that for NaI. Reproduced with permission from Figure 2 in T. S. Rose, M. J. Rosker, and A. H. Zewail,
“Femtosecond real-time observations of wave packet oscillations (resonance) in dissociation reactions,” J.
Chem. Phys. 88, 6672–6673 (1988). Copyright 1988, AIP Publishing LLC.
Ahmed Zewail was awarded the 1999 Nobel Prize in Chemistry for “Femtosecond Transition
State (FTS) Spectroscopy.” These experiments were described as the first time that the
mechanisms of real intramolecular dynamics were ”clocked” in real time. In a pump/probe
scheme, a femtosecond pump pulse creates a wavepacket on a repulsive or predissociated
electronically excited V1 potential energy surface at t = 0 by excitation from the v = 0 level of
the electronic ground state, V0 (ability to tune center energy of wavepacket by a small
500
fs
∆t (fs)
III
II

amount). After each excitation pulse, the time-evolving wavepacket is probed by a
femtosecond pulse with a chosen center wavelength at a time-delay t = τ. This delay time is
scanned, pulse-by-pulse, to determine the time at which the center of the wavepacket
crosses through the “Optically Coupled Region (OCR).” The probe pulse excites a portion of
the wavepacket from the V1 potential surface to a higher energy repulsive potential surface,
V2. The V2 potential surface is repulsive, dissociating to an electronically excited fragment.
The detected signal is the time-integrated ∼ 10 nanosecond lifetime fluorescence from this
excited fragment. The dynamically relevant information is encoded in the intensity vs. τ of
this time-integrated fluorescence, which samples the femtosecond passage of the
wavepacket through the OCR that is selected by the center wavelength of the probe pulse.
The ICN photodissociation experiment shows the effect of the presence of the I atom on the
frequency of the CN B2Σ+ − X2Σ+ electronic transition. As the I atom moves away from the CN
molecule, the energy of the CN electronic excitation increases from its value in the ICN
molecule to that of the free CN molecule. Did we know this before doing the experiment? As
the ICN bond stretches, the electronic structure of the CN moiety changes. This is
mechanism!
The photodissociation of NaI is mediated by a covalent-to-ionic curve crossing. The diabatic
(crossing) potential energy curves (solid lines) are the ones for which the electronic
character does not change rapidly as the molecule traverses the internuclear distance of the
curve crossing. The adiabatic curves (dashed lines), which are what “clamped nuclei”
quantum chemical calculations generate, exhibit a rapid change of electronic character at
the internuclear distance of the avoided crossing. As the molecule moves through the curve-
crossing region, it must decide whether it is going to follow the diabatic or the adiabatic
potential. Landau-Zener theory tells us the velocity-dependence of the probability of
jumping across the energy gap between the ionic and the covalent adiabatic curves. If you
drive too fast, you will be unable to stay on the road on a sharp curve. The sharpness of the
curve is determined by the magnitude of the interaction matrix element between the
diabatic potential curves. A very gentle curvature is the signature of a very large interaction
matrix element. In the Zewail experiments, the velocity in the curve-crossing region can be
systematically slightly adjusted by the choice of the center wavelength of the pump pulse.
At an NaI energy far above that of the curve-crossing, the velocity in the crossing region is
very large and the molecule stays on one of the diabatic potentials, in effect jumping the gap
between adiabatic curves. At an energy near that of the curve crossing, the molecule would
go through the crossing region slowly and stay on one of the adiabatic curves, with the result
that the wave packet that is born covalent, is nearly 100% converted to ionic at the
internuclear distance of the crossing. Zewail’s NaI experiments provide a direct
experimental determination of the internuclear distance of the curve crossing and an
explicit illustration of Landau-Zener theory.

Figure 1: Pump/Probe Scheme for Photodissociation of ICN (Figure 1 of Ref. 24). This is a reduced
dimension representation of three singlet potential energy surfaces of ICN: the bound ground electronic state,
V0 with minimum at Re, an excited unbound state, V1, which dissociates to CN(X2Σ+) and I(2P3/2), and a higher
energy unbound state, which dissociates to CN(B2Σ+) and I(2P3/2). A t = 0 pulse from the pump laser, with center
wavelength λ1, excites a vertical turning-point-to-turning-point (P0 = 0, P1 = 0) transition at R = R0 > Re to the
V1 potential surface. The wavepacket on the V1 potential surface experiences a force in the increasing RI-CN
direction, which causes the PI-CN momentum to increase monotonically with time. At t = τ , a pulse from the
probe laser, with center wavelength probes for the arrival of the wavepacket at RI-CN = R? or R∞ . The
energy of the vertical (ΔR=0) and momentumconserving (ΔP=0) transition also increases monotonically with
time as the wavepacket travels outward on V1. This V2−V1 transition is essentially an excitation of the CN B−X
electronic transition in the presence of the departing I atom. The R= RI-CN = R? Optically Coupled Region (OCR)
is interrogated by a probe pulse with center wavelength , where is the wavelength of the free CN
B−X v0 = 0 − v00 = 0 band. The detected signal is CN B-X spontaneous fluorescence. Reproduced with permission
from Figure 1 in M. J. Rosker, M. Dantus, and A. H. Zewail, “Femtosecond real-time probing of reactions. I. The
technique,”
J. Chem. Phys. 89, 6113–6127 (1988). Copyright 1988, AIP Publishing LLC.
Internuclear Separation

Figure 2: Wavepacket Transit through an Ionic∼Covalent Potential Energy Curve Crossing in NaI
(Figure 1 of Ref. 26). The diabatic (solid lines) Na+,I− and Na,I potential energy curves cross at Rx = 6.93A.˚ The
avoided crossing between the adiabatic potential curves is shown as dashed lines. At t = t0 the 310 nm pump
pulse creates a wavepacket at the inner turning point of the covalent (Na 2S, I2P3/2) potential curve at
R≈Re(X1Σ+) and P= 0. By adjusting the center wavelength of the pump pulse, the center total-energy (electronic
plus vibrational) of the wavepacket can be adjusted between 30,000 and 34,000 cm−1 . The excitation energy
of the ionic∼covalent curve crossing is ∼ 26, 000 cm−1 . The wavepacket is accelerated outward, passes through
the curve-crossing region at t?, and bifurcates, one part traveling on the bound ionic potential and the other
part traveling irreversibly outward on the unbound covalent potential. The ionic part is reflected at tR at the
outer turning point of the ionic potential, passes with P< 0 through the R= 6.93 ˚A curve crossing region where
it bifurcates again, and the resultant ionic and covalent parts are reflected outward at the inner turning points
of the ionic and covalent potential curves, respectively. Each outward passage of a wavepacket through the
curve crossing region results in a wavepacket traveling irreversibly outward on the unbound covalent
potential, eventually forming free Na(2S) and I(2P3/2) atoms. The probe pulse (not shown) interrogates the
dynamics by exciting Na(2S),I(2P3/2) weakly-bound molecules to a higher energy repulsive electronic state that
dissociates to Na(2P) + I(2P3/2) atoms. Excitation at centerwavelength longer than 589 nm samples NaI
molecules en route to full dissociation. Excitation centered at 589 nm provides what is essentially a time-
integrated sample of the accumulation of the free Na(2S) atoms. Reproduced with permission from Figure 1 in
T. S. Rose, M. J. Rosker, and A. H. Zewail, “Femtosecond real-time observations of wave packet oscillations
(resonance) in dissociation reactions,” J. Chem. Phys. 88, 6672–6673 (1988). Copyright 1988, AIP Publishing
LLC.
0
4
R
x
= 6.93Å
COVALENT Na +I
IONIC Na
+
+I
–
t
0
t
*
t
R
R(Å)
10
15
0
2
5
0
5
10
15
20
25
30
35
Energy (10
3
cm
–1
)
FS
pump (
λ
)
FS
probe (t,
λ
)
Na I*
Na
[
…
I]
‡
*
Na
[
……
I]
‡
*
Na + I + E
tr

Figure 3: Clocking of the Photodissociation of NaI (and NaBr) as the Nuclear Wavepacket Repeatedly
Traverses the Ionic/Covalent Curve Crossing (Figure 2 of Ref. 26). The wavepacket, illustrated in Fig. 6.5, is
created at t = t0 at the inner turning point on the covalent excited electronic state. At each outward-bound
traversal of the curve-crossing region, part of the wavepacket follows the covalent adiabatic curve irreversibly
outward to separated Na(2S)+I(2P3/2) atoms. If the probe laser centerwavelength is tuned slightly to the red of
the 589 nm free Na atom 2P←2S transition, each time a wavepacket of incompletely separated Na,I molecules
passes through the Optically Coupled Region, some not quite free Na atoms are excited to the 2P state, from
which spontaneous fluorescence is detected. The series of Na atom fluorescence pulses shown in Spectrum I
samples each outward passage of a wavepacket through the curve-crossing region. The temporal spacing of
the pulses corresponds to a 36 cm−1 vibrational frequency. When the center-wavelength of the probe laser is
tuned to 589 nm, the arrivals of free Na atom wavepackets are displayed in Spectrum II as a periodic series of
upward steps. Spectrum III shows that the (upper) adiabatic potential curve for NaBr is shallower and “leakier”
than that for NaI. Reproduced with permission from Figure 2 in T. S. Rose, M. J. Rosker, and A. H. Zewail,
“Femtosecond real-time observations of wave packet oscillations (resonance) in dissociation reactions,” J.
Chem. Phys. 88, 6672–6673 (1988). Copyright 1988, AIP Publishing LLC. Ahmed Zewail was awarded the
1999 Nobel Prize in Chemistry for “Femtosecond Transition State (FTS) Spectroscopy.”
These experiments were described as the first time that the mechanisms of real
intramolecular dynamics were ”clocked” in real time. In a pump/probe scheme, a
femtosecond pump pulse creates a wavepacket on a repulsive or predissociated
electronically excited V1 potential energy surface at t = 0 by excitation from the v = 0 level of
the electronic ground state, V0 (ability to tune center energy of wavepacket by a small
500
fs
∆t (fs)
III
II

amount). After each excitation pulse, the time-evolving wavepacket is probed by a
femtosecond pulse with a chosen center wavelength at a time-delay t = τ. This delay time is
scanned, pulse-by-pulse, to determine the time at which the center of the wavepacket
crosses through the “Optically Coupled Region (OCR).” The probe pulse excites a portion of
the wavepacket from the V1 potential surface to a higher energy repulsive potential surface,
V2. The V2 potential surface is repulsive, dissociating to an electronically excited fragment.
The detected signal is the time-integrated ∼ 10 nanosecond lifetime fluorescence from this
excited fragment. The dynamically relevant information is encoded in the intensity vs. τ of
this time-integrated fluorescence, which samples the femtosecond passage of the
wavepacket through the OCR that is selected by the center wavelength of the probe pulse.
The ICN photodissociation experiment shows the effect of the presence of the I atom on the
frequency of the CN B2Σ+ − X2Σ+ electronic transition. As the I atom moves away from the CN
molecule, the energy of the CN electronic excitation increases from its value in the ICN
molecule to that of the free CN molecule. Did we know this before doing the experiment? As
the ICN bond stretches, the electronic structure of the CN moiety changes. This is
mechanism!
The photodissociation of NaI is mediated by a covalent-to-ionic curve crossing. The diabatic
(crossing) potential energy curves (solid lines) are the ones for which the electronic
character does not change rapidly as the molecule traverses the internuclear distance of the
curve crossing. The adiabatic curves (dashed lines), which are what “clamped nuclei”
quantum chemical calculations generate, exhibit a rapid change of electronic character at
the internuclear distance of the avoided crossing. As the molecule moves through the curve-
crossing region, it must decide whether it is going to follow the diabatic or the adiabatic
potential. Landau-Zener theory tells us the velocity-dependence of the probability of
jumping across the energy gap between the ionic and the covalent adiabatic curves. If you
drive too fast, you will be unable to stay on the road on a sharp curve. The sharpness of the
curve is determined by the magnitude of the interaction matrix element between the
diabatic potential curves. A very gentle curvature is the signature of a very large interaction
matrix element. In the Zewail experiments, the velocity in the curve-crossing region can be
systematically slightly adjusted by the choice of the center wavelength of the pump pulse.
At an NaI energy far above that of the curve-crossing, the velocity in the crossing region is
very large and the molecule stays on one of the diabatic potentials, in effect jumping the gap
between adiabatic curves. At an energy near that of the curve crossing, the molecule would
go through the crossing region slowly and stay on one of the adiabatic curves, with the result
that the wave packet that is born covalent, is nearly 100% converted to ionic at the
internuclear distance of the crossing. Zewail’s NaI experiments provide a direct
experimental determination of the internuclear distance of the curve crossing and an
explicit illustration of Landau-Zener theory.

Figure 1: Pump/Probe Scheme for Photodissociation of ICN (Figure 1 of Ref. 24). This is a reduced
dimension representation of three singlet potential energy surfaces of ICN: the bound ground electronic state,
V0 with minimum at Re, an excited unbound state, V1, which dissociates to CN(X2Σ+) and I(2P3/2), and a higher
energy unbound state, which dissociates to CN(B2Σ+) and I(2P3/2). A t = 0 pulse from the pump laser, with center
wavelength λ1, excites a vertical turning-point-to-turning-point (P0 = 0, P1 = 0) transition at R = R0 > Re to the
V1 potential surface. The wavepacket on the V1 potential surface experiences a force in the increasing RI-CN
direction, which causes the PI-CN momentum to increase monotonically with time. At t = τ , a pulse from the
probe laser, with center wavelength probes for the arrival of the wavepacket at RI-CN = R? or R∞ . The
energy of the vertical (ΔR=0) and momentumconserving (ΔP=0) transition also increases monotonically with
time as the wavepacket travels outward on V1. This V2−V1 transition is essentially an excitation of the CN B−X
electronic transition in the presence of the departing I atom. The R= RI-CN = R? Optically Coupled Region (OCR)
is interrogated by a probe pulse with center wavelength , where is the wavelength of the free CN
B−X v0 = 0 − v00 = 0 band. The detected signal is CN B-X spontaneous fluorescence. Reproduced with permission
from Figure 1 in M. J. Rosker, M. Dantus, and A. H. Zewail, “Femtosecond real-time probing of reactions. I. The
technique,”
J. Chem. Phys. 89, 6113–6127 (1988). Copyright 1988, AIP Publishing LLC.
Internuclear Separation

Figure 2: Wavepacket Transit through an Ionic∼Covalent Potential Energy Curve Crossing in NaI
(Figure 1 of Ref. 26). The diabatic (solid lines) Na+,I− and Na,I potential energy curves cross at Rx = 6.93A.˚ The
avoided crossing between the adiabatic potential curves is shown as dashed lines. At t = t0 the 310 nm pump
pulse creates a wavepacket at the inner turning point of the covalent (Na 2S, I2P3/2) potential curve at
R≈Re(X1Σ+) and P= 0. By adjusting the center wavelength of the pump pulse, the center total-energy (electronic
plus vibrational) of the wavepacket can be adjusted between 30,000 and 34,000 cm−1 . The excitation energy
of the ionic∼covalent curve crossing is ∼ 26, 000 cm−1 . The wavepacket is accelerated outward, passes through
the curve-crossing region at t?, and bifurcates, one part traveling on the bound ionic potential and the other
part traveling irreversibly outward on the unbound covalent potential. The ionic part is reflected at tR at the
outer turning point of the ionic potential, passes with P< 0 through the R= 6.93 ˚A curve crossing region where
it bifurcates again, and the resultant ionic and covalent parts are reflected outward at the inner turning points
of the ionic and covalent potential curves, respectively. Each outward passage of a wavepacket through the
curve crossing region results in a wavepacket traveling irreversibly outward on the unbound covalent
potential, eventually forming free Na(2S) and I(2P3/2) atoms. The probe pulse (not shown) interrogates the
dynamics by exciting Na(2S),I(2P3/2) weakly-bound molecules to a higher energy repulsive electronic state that
dissociates to Na(2P) + I(2P3/2) atoms. Excitation at centerwavelength longer than 589 nm samples NaI
molecules en route to full dissociation. Excitation centered at 589 nm provides what is essentially a time-
integrated sample of the accumulation of the free Na(2S) atoms. Reproduced with permission from Figure 1 in
T. S. Rose, M. J. Rosker, and A. H. Zewail, “Femtosecond real-time observations of wave packet oscillations
(resonance) in dissociation reactions,” J. Chem. Phys. 88, 6672–6673 (1988). Copyright 1988, AIP Publishing
LLC.
0
4
R
x
= 6.93Å
COVALENT Na +I
IONIC Na
+
+I
–
t
0
t
*
t
R
R(Å)
10
15
0
2
5
0
5
10
15
20
25
30
35
Energy (10
3
cm
–1
)
FS
pump (
λ
)
FS
probe (t,
λ
)
Na I*
Na
[
…
I]
‡
*
Na
[
……
I]
‡
*
Na + I + E
tr

Figure 3: Clocking of the Photodissociation of NaI (and NaBr) as the Nuclear Wavepacket Repeatedly
Traverses the Ionic/Covalent Curve Crossing (Figure 2 of Ref. 26). The wavepacket, illustrated in Fig. 6.5, is
created at t = t0 at the inner turning point on the covalent excited electronic state. At each outward-bound
traversal of the curve-crossing region, part of the wavepacket follows the covalent adiabatic curve irreversibly
outward to separated Na(2S)+I(2P3/2) atoms. If the probe laser centerwavelength is tuned slightly to the red of
the 589 nm free Na atom 2P←2S transition, each time a wavepacket of incompletely separated Na,I molecules
passes through the Optically Coupled Region, some not quite free Na atoms are excited to the 2P state, from
which spontaneous fluorescence is detected. The series of Na atom fluorescence pulses shown in Spectrum I
samples each outward passage of a wavepacket through the curve-crossing region. The temporal spacing of
the pulses corresponds to a 36 cm−1 vibrational frequency. When the center-wavelength of the probe laser is
tuned to 589 nm, the arrivals of free Na atom wavepackets are displayed in Spectrum II as a periodic series of
upward steps. Spectrum III shows that the (upper) adiabatic potential curve for NaBr is shallower and “leakier”
than that for NaI. Reproduced with permission from Figure 2 in T. S. Rose, M. J. Rosker, and A. H. Zewail,
“Femtosecond real-time observations of wave packet oscillations (resonance) in dissociation reactions,” J.
Chem. Phys. 88, 6672–6673 (1988). Copyright 1988, AIP Publishing LLC.
Ahmed Zewail was awarded the 1999 Nobel Prize in Chemistry for “Femtosecond Transition
State (FTS) Spectroscopy.” These experiments were described as the first time that the
mechanisms of real intramolecular dynamics were ”clocked” in real time. In a pump/probe
scheme, a femtosecond pump pulse creates a wavepacket on a repulsive or predissociated
electronically excited V1 potential energy surface at t = 0 by excitation from the v = 0 level of
the electronic ground state, V0 (ability to tune center energy of wavepacket by a small
500
fs
∆t (fs)
III
II

amount). After each excitation pulse, the time-evolving wavepacket is probed by a
femtosecond pulse with a chosen center wavelength at a time-delay t = τ. This delay time is
scanned, pulse-by-pulse, to determine the time at which the center of the wavepacket
crosses through the “Optically Coupled Region (OCR).” The probe pulse excites a portion of
the wavepacket from the V1 potential surface to a higher energy repulsive potential surface,
V2. The V2 potential surface is repulsive, dissociating to an electronically excited fragment.
The detected signal is the time-integrated ∼ 10 nanosecond lifetime fluorescence from this
excited fragment. The dynamically relevant information is encoded in the intensity vs. τ of
this time-integrated fluorescence, which samples the femtosecond passage of the
wavepacket through the OCR that is selected by the center wavelength of the probe pulse.
The ICN photodissociation experiment shows the effect of the presence of the I atom on the
frequency of the CN B2Σ+ − X2Σ+ electronic transition. As the I atom moves away from the CN
molecule, the energy of the CN electronic excitation increases from its value in the ICN
molecule to that of the free CN molecule. Did we know this before doing the experiment? As
the ICN bond stretches, the electronic structure of the CN moiety changes. This is
mechanism!
The photodissociation of NaI is mediated by a covalent-to-ionic curve crossing. The diabatic
(crossing) potential energy curves (solid lines) are the ones for which the electronic
character does not change rapidly as the molecule traverses the internuclear distance of the
curve crossing. The adiabatic curves (dashed lines), which are what “clamped nuclei”
quantum chemical calculations generate, exhibit a rapid change of electronic character at
the internuclear distance of the avoided crossing. As the molecule moves through the curve-
crossing region, it must decide whether it is going to follow the diabatic or the adiabatic
potential. Landau-Zener theory tells us the velocity-dependence of the probability of
jumping across the energy gap between the ionic and the covalent adiabatic curves. If you
drive too fast, you will be unable to stay on the road on a sharp curve. The sharpness of the
curve is determined by the magnitude of the interaction matrix element between the
diabatic potential curves. A very gentle curvature is the signature of a very large interaction
matrix element. In the Zewail experiments, the velocity in the curve-crossing region can be
systematically slightly adjusted by the choice of the center wavelength of the pump pulse.
At an NaI energy far above that of the curve-crossing, the velocity in the crossing region is
very large and the molecule stays on one of the diabatic potentials, in effect jumping the gap
between adiabatic curves. At an energy near that of the curve crossing, the molecule would
go through the crossing region slowly and stay on one of the adiabatic curves, with the result
that the wave packet that is born covalent, is nearly 100% converted to ionic at the
internuclear distance of the crossing. Zewail’s NaI experiments provide a direct
experimental determination of the internuclear distance of the curve crossing and an
explicit illustration of Landau-Zener theory.

Figure 1: Pump/Probe Scheme for Photodissociation of ICN (Figure 1 of Ref. 24). This is a reduced
dimension representation of three singlet potential energy surfaces of ICN: the bound ground electronic state,
V0 with minimum at Re, an excited unbound state, V1, which dissociates to CN(X2Σ+) and I(2P3/2), and a higher
energy unbound state, which dissociates to CN(B2Σ+) and I(2P3/2). A t = 0 pulse from the pump laser, with center
wavelength λ1, excites a vertical turning-point-to-turning-point (P0 = 0, P1 = 0) transition at R = R0 > Re to the
V1 potential surface. The wavepacket on the V1 potential surface experiences a force in the increasing RI-CN
direction, which causes the PI-CN momentum to increase monotonically with time. At t = τ , a pulse from the
probe laser, with center wavelength probes for the arrival of the wavepacket at RI-CN = R? or R∞ . The
energy of the vertical (ΔR=0) and momentumconserving (ΔP=0) transition also increases monotonically with
time as the wavepacket travels outward on V1. This V2−V1 transition is essentially an excitation of the CN B−X
electronic transition in the presence of the departing I atom. The R= RI-CN = R? Optically Coupled Region (OCR)
is interrogated by a probe pulse with center wavelength , where is the wavelength of the free CN
B−X v0 = 0 − v00 = 0 band. The detected signal is CN B-X spontaneous fluorescence. Reproduced with permission
from Figure 1 in M. J. Rosker, M. Dantus, and A. H. Zewail, “Femtosecond real-time probing of reactions. I. The
technique,”
J. Chem. Phys. 89, 6113–6127 (1988). Copyright 1988, AIP Publishing LLC.
Internuclear Separation

Figure 2: Wavepacket Transit through an Ionic∼Covalent Potential Energy Curve Crossing in NaI
(Figure 1 of Ref. 26). The diabatic (solid lines) Na+,I− and Na,I potential energy curves cross at Rx = 6.93A.˚ The
avoided crossing between the adiabatic potential curves is shown as dashed lines. At t = t0 the 310 nm pump
pulse creates a wavepacket at the inner turning point of the covalent (Na 2S, I2P3/2) potential curve at
R≈Re(X1Σ+) and P= 0. By adjusting the center wavelength of the pump pulse, the center total-energy (electronic
plus vibrational) of the wavepacket can be adjusted between 30,000 and 34,000 cm−1 . The excitation energy
of the ionic∼covalent curve crossing is ∼ 26, 000 cm−1 . The wavepacket is accelerated outward, passes through
the curve-crossing region at t?, and bifurcates, one part traveling on the bound ionic potential and the other
part traveling irreversibly outward on the unbound covalent potential. The ionic part is reflected at tR at the
outer turning point of the ionic potential, passes with P< 0 through the R= 6.93 ˚A curve crossing region where
it bifurcates again, and the resultant ionic and covalent parts are reflected outward at the inner turning points
of the ionic and covalent potential curves, respectively. Each outward passage of a wavepacket through the
curve crossing region results in a wavepacket traveling irreversibly outward on the unbound covalent
potential, eventually forming free Na(2S) and I(2P3/2) atoms. The probe pulse (not shown) interrogates the
dynamics by exciting Na(2S),I(2P3/2) weakly-bound molecules to a higher energy repulsive electronic state that
dissociates to Na(2P) + I(2P3/2) atoms. Excitation at centerwavelength longer than 589 nm samples NaI
molecules en route to full dissociation. Excitation centered at 589 nm provides what is essentially a time-
integrated sample of the accumulation of the free Na(2S) atoms. Reproduced with permission from Figure 1 in
T. S. Rose, M. J. Rosker, and A. H. Zewail, “Femtosecond real-time observations of wave packet oscillations
(resonance) in dissociation reactions,” J. Chem. Phys. 88, 6672–6673 (1988). Copyright 1988, AIP Publishing
LLC.
0
4
R
x
= 6.93Å
COVALENT Na +I
IONIC Na
+
+I
–
t
0
t
*
t
R
R(Å)
10
15
0
2
5
0
5
10
15
20
25
30
35
Energy (10
3
cm
–1
)
FS
pump (
λ
)
FS
probe (t,
λ
)
Na I*
Na
[
…
I]
‡
*
Na
[
……
I]
‡
*
Na + I + E
tr

Figure 3: Clocking of the Photodissociation of NaI (and NaBr) as the Nuclear Wavepacket Repeatedly
Traverses the Ionic/Covalent Curve Crossing (Figure 2 of Ref. 26). The wavepacket, illustrated in Fig. 6.5, is
created at t = t0 at the inner turning point on the covalent excited electronic state. At each outward-bound
traversal of the curve-crossing region, part of the wavepacket follows the covalent adiabatic curve irreversibly
outward to separated Na(2S)+I(2P3/2) atoms. If the probe laser centerwavelength is tuned slightly to the red of
the 589 nm free Na atom 2P←2S transition, each time a wavepacket of incompletely separated Na,I molecules
passes through the Optically Coupled Region, some not quite free Na atoms are excited to the 2P state, from
which spontaneous fluorescence is detected. The series of Na atom fluorescence pulses shown in Spectrum I
samples each outward passage of a wavepacket through the curve-crossing region. The temporal spacing of
the pulses corresponds to a 36 cm−1 vibrational frequency. When the center-wavelength of the probe laser is
tuned to 589 nm, the arrivals of free Na atom wavepackets are displayed in Spectrum II as a periodic series of
upward steps. Spectrum III shows that the (upper) adiabatic potential curve for NaBr is shallower and “leakier”
than that for NaI. Reproduced with permission from Figure 2 in T. S. Rose, M. J. Rosker, and A. H. Zewail,
“Femtosecond real-time observations of wave packet oscillations (resonance) in dissociation reactions,” J.
Chem. Phys. 88, 6672–6673 (1988). Copyright 1988, AIP Publishing LLC.
Ahmed Zewail was awarded the 1999 Nobel Prize in Chemistry for “Femtosecond Transition
State (FTS) Spectroscopy.” These experiments were described as the first time that the
mechanisms of real intramolecular dynamics were ”clocked” in real time. In a pump/probe
scheme, a femtosecond pump pulse creates a wavepacket on a repulsive or predissociated
electronically excited V1 potential energy surface at t = 0 by excitation from the v = 0 level of
the electronic ground state, V0 (ability to tune center energy of wavepacket by a small
500
fs
∆t (fs)
III
II

amount). After each excitation pulse, the time-evolving wavepacket is probed by a
femtosecond pulse with a chosen center wavelength at a time-delay t = τ. This delay time is
scanned, pulse-by-pulse, to determine the time at which the center of the wavepacket
crosses through the “Optically Coupled Region (OCR).” The probe pulse excites a portion of
the wavepacket from the V1 potential surface to a higher energy repulsive potential surface,
V2. The V2 potential surface is repulsive, dissociating to an electronically excited fragment.
The detected signal is the time-integrated ∼ 10 nanosecond lifetime fluorescence from this
excited fragment. The dynamically relevant information is encoded in the intensity vs. τ of
this time-integrated fluorescence, which samples the femtosecond passage of the
wavepacket through the OCR that is selected by the center wavelength of the probe pulse.
The ICN photodissociation experiment shows the effect of the presence of the I atom on the
frequency of the CN B2Σ+ − X2Σ+ electronic transition. As the I atom moves away from the CN
molecule, the energy of the CN electronic excitation increases from its value in the ICN
molecule to that of the free CN molecule. Did we know this before doing the experiment? As
the ICN bond stretches, the electronic structure of the CN moiety changes. This is
mechanism!
The photodissociation of NaI is mediated by a covalent-to-ionic curve crossing. The diabatic
(crossing) potential energy curves (solid lines) are the ones for which the electronic
character does not change rapidly as the molecule traverses the internuclear distance of the
curve crossing. The adiabatic curves (dashed lines), which are what “clamped nuclei”
quantum chemical calculations generate, exhibit a rapid change of electronic character at
the internuclear distance of the avoided crossing. As the molecule moves through the curve-
crossing region, it must decide whether it is going to follow the diabatic or the adiabatic
potential. Landau-Zener theory tells us the velocity-dependence of the probability of
jumping across the energy gap between the ionic and the covalent adiabatic curves. If you
drive too fast, you will be unable to stay on the road on a sharp curve. The sharpness of the
curve is determined by the magnitude of the interaction matrix element between the
diabatic potential curves. A very gentle curvature is the signature of a very large interaction
matrix element. In the Zewail experiments, the velocity in the curve-crossing region can be
systematically slightly adjusted by the choice of the center wavelength of the pump pulse.
At an NaI energy far above that of the curve-crossing, the velocity in the crossing region is
very large and the molecule stays on one of the diabatic potentials, in effect jumping the gap
between adiabatic curves. At an energy near that of the curve crossing, the molecule would
go through the crossing region slowly and stay on one of the adiabatic curves, with the result
that the wave packet that is born covalent, is nearly 100% converted to ionic at the
internuclear distance of the crossing. Zewail’s NaI experiments provide a direct
experimental determination of the internuclear distance of the curve crossing and an
explicit illustration of Landau-Zener theory.

Figure 1: Pump/Probe Scheme for Photodissociation of ICN (Figure 1 of Ref. 24). This is a reduced
dimension representation of three singlet potential energy surfaces of ICN: the bound ground electronic state,
V0 with minimum at Re, an excited unbound state, V1, which dissociates to CN(X2Σ+) and I(2P3/2), and a higher
energy unbound state, which dissociates to CN(B2Σ+) and I(2P3/2). A t = 0 pulse from the pump laser, with center
wavelength λ1, excites a vertical turning-point-to-turning-point (P0 = 0, P1 = 0) transition at R = R0 > Re to the
V1 potential surface. The wavepacket on the V1 potential surface experiences a force in the increasing RI-CN
direction, which causes the PI-CN momentum to increase monotonically with time. At t = τ , a pulse from the
probe laser, with center wavelength probes for the arrival of the wavepacket at RI-CN = R? or R∞ . The
energy of the vertical (ΔR=0) and momentumconserving (ΔP=0) transition also increases monotonically with
time as the wavepacket travels outward on V1. This V2−V1 transition is essentially an excitation of the CN B−X
electronic transition in the presence of the departing I atom. The R= RI-CN = R? Optically Coupled Region (OCR)
is interrogated by a probe pulse with center wavelength , where is the wavelength of the free CN
B−X v0 = 0 − v00 = 0 band. The detected signal is CN B-X spontaneous fluorescence. Reproduced with permission
from Figure 1 in M. J. Rosker, M. Dantus, and A. H. Zewail, “Femtosecond real-time probing of reactions. I. The
technique,”
J. Chem. Phys. 89, 6113–6127 (1988). Copyright 1988, AIP Publishing LLC.
Internuclear Separation

Figure 2: Wavepacket Transit through an Ionic∼Covalent Potential Energy Curve Crossing in NaI
(Figure 1 of Ref. 26). The diabatic (solid lines) Na+,I− and Na,I potential energy curves cross at Rx = 6.93A.˚ The
avoided crossing between the adiabatic potential curves is shown as dashed lines. At t = t0 the 310 nm pump
pulse creates a wavepacket at the inner turning point of the covalent (Na 2S, I2P3/2) potential curve at
R≈Re(X1Σ+) and P= 0. By adjusting the center wavelength of the pump pulse, the center total-energy (electronic
plus vibrational) of the wavepacket can be adjusted between 30,000 and 34,000 cm−1 . The excitation energy
of the ionic∼covalent curve crossing is ∼ 26, 000 cm−1 . The wavepacket is accelerated outward, passes through
the curve-crossing region at t?, and bifurcates, one part traveling on the bound ionic potential and the other
part traveling irreversibly outward on the unbound covalent potential. The ionic part is reflected at tR at the
outer turning point of the ionic potential, passes with P< 0 through the R= 6.93 ˚A curve crossing region where
it bifurcates again, and the resultant ionic and covalent parts are reflected outward at the inner turning points
of the ionic and covalent potential curves, respectively. Each outward passage of a wavepacket through the
curve crossing region results in a wavepacket traveling irreversibly outward on the unbound covalent
potential, eventually forming free Na(2S) and I(2P3/2) atoms. The probe pulse (not shown) interrogates the
dynamics by exciting Na(2S),I(2P3/2) weakly-bound molecules to a higher energy repulsive electronic state that
dissociates to Na(2P) + I(2P3/2) atoms. Excitation at centerwavelength longer than 589 nm samples NaI
molecules en route to full dissociation. Excitation centered at 589 nm provides what is essentially a time-
integrated sample of the accumulation of the free Na(2S) atoms. Reproduced with permission from Figure 1 in
T. S. Rose, M. J. Rosker, and A. H. Zewail, “Femtosecond real-time observations of wave packet oscillations
(resonance) in dissociation reactions,” J. Chem. Phys. 88, 6672–6673 (1988). Copyright 1988, AIP Publishing
LLC.
0
4
R
x
= 6.93Å
COVALENT Na +I
IONIC Na
+
+I
–
t
0
t
*
t
R
R(Å)
10
15
0
2
5
0
5
10
15
20
25
30
35
Energy (10
3
cm
–1
)
FS
pump (
λ
)
FS
probe (t,
λ
)
Na I*
Na
[
…
I]
‡
*
Na
[
……
I]
‡
*
Na + I + E
tr

Figure 3: Clocking of the Photodissociation of NaI (and NaBr) as the Nuclear Wavepacket Repeatedly
Traverses the Ionic/Covalent Curve Crossing (Figure 2 of Ref. 26). The wavepacket, illustrated in Fig. 6.5, is
created at t = t0 at the inner turning point on the covalent excited electronic state. At each outward-bound
traversal of the curve-crossing region, part of the wavepacket follows the covalent adiabatic curve irreversibly
outward to separated Na(2S)+I(2P3/2) atoms. If the probe laser centerwavelength is tuned slightly to the red of
the 589 nm free Na atom 2P←2S transition, each time a wavepacket of incompletely separated Na,I molecules
passes through the Optically Coupled Region, some not quite free Na atoms are excited to the 2P state, from
which spontaneous fluorescence is detected. The series of Na atom fluorescence pulses shown in Spectrum I
samples each outward passage of a wavepacket through the curve-crossing region. The temporal spacing of
the pulses corresponds to a 36 cm−1 vibrational frequency. When the center-wavelength of the probe laser is
tuned to 589 nm, the arrivals of free Na atom wavepackets are displayed in Spectrum II as a periodic series of
upward steps. Spectrum III shows that the (upper) adiabatic potential curve for NaBr is shallower and “leakier”
than that for NaI. Reproduced with permission from Figure 2 in T. S. Rose, M. J. Rosker, and A. H. Zewail,
“Femtosecond real-time observations of wave packet oscillations (resonance) in dissociation reactions,” J.
Chem. Phys. 88, 6672–6673 (1988). Copyright 1988, AIP Publishing LLC.
Ahmed Zewail was awarded the 1999 Nobel Prize in Chemistry for “Femtosecond Transition
State (FTS) Spectroscopy.” These experiments were described as the first time that the
mechanisms of real intramolecular dynamics were ”clocked” in real time. In a pump/probe
scheme, a femtosecond pump pulse creates a wavepacket on a repulsive or predissociated
electronically excited V1 potential energy surface at t = 0 by excitation from the v = 0 level of
the electronic ground state, V0 (ability to tune center energy of wavepacket by a small
500
fs
∆t (fs)
III
II

amount). After each excitation pulse, the time-evolving wavepacket is probed by a
femtosecond pulse with a chosen center wavelength at a time-delay t = τ. This delay time is
scanned, pulse-by-pulse, to determine the time at which the center of the wavepacket
crosses through the “Optically Coupled Region (OCR).” The probe pulse excites a portion of
the wavepacket from the V1 potential surface to a higher energy repulsive potential surface,
V2. The V2 potential surface is repulsive, dissociating to an electronically excited fragment.
The detected signal is the time-integrated ∼ 10 nanosecond lifetime fluorescence from this
excited fragment. The dynamically relevant information is encoded in the intensity vs. τ of
this time-integrated fluorescence, which samples the femtosecond passage of the
wavepacket through the OCR that is selected by the center wavelength of the probe pulse.
The ICN photodissociation experiment shows the effect of the presence of the I atom on the
frequency of the CN B2Σ+ − X2Σ+ electronic transition. As the I atom moves away from the CN
molecule, the energy of the CN electronic excitation increases from its value in the ICN
molecule to that of the free CN molecule. Did we know this before doing the experiment? As
the ICN bond stretches, the electronic structure of the CN moiety changes. This is
mechanism!
The photodissociation of NaI is mediated by a covalent-to-ionic curve crossing. The diabatic
(crossing) potential energy curves (solid lines) are the ones for which the electronic
character does not change rapidly as the molecule traverses the internuclear distance of the
curve crossing. The adiabatic curves (dashed lines), which are what “clamped nuclei”
quantum chemical calculations generate, exhibit a rapid change of electronic character at
the internuclear distance of the avoided crossing. As the molecule moves through the curve-
crossing region, it must decide whether it is going to follow the diabatic or the adiabatic
potential. Landau-Zener theory tells us the velocity-dependence of the probability of
jumping across the energy gap between the ionic and the covalent adiabatic curves. If you
drive too fast, you will be unable to stay on the road on a sharp curve. The sharpness of the
curve is determined by the magnitude of the interaction matrix element between the
diabatic potential curves. A very gentle curvature is the signature of a very large interaction
matrix element. In the Zewail experiments, the velocity in the curve-crossing region can be
systematically slightly adjusted by the choice of the center wavelength of the pump pulse.
At an NaI energy far above that of the curve-crossing, the velocity in the crossing region is
very large and the molecule stays on one of the diabatic potentials, in effect jumping the gap
between adiabatic curves. At an energy near that of the curve crossing, the molecule would
go through the crossing region slowly and stay on one of the adiabatic curves, with the result
that the wave packet that is born covalent, is nearly 100% converted to ionic at the
internuclear distance of the crossing. Zewail’s NaI experiments provide a direct
experimental determination of the internuclear distance of the curve crossing and an
explicit illustration of Landau-Zener theory.

Figure 1: Pump/Probe Scheme for Photodissociation of ICN (Figure 1 of Ref. 24). This is a reduced
dimension representation of three singlet potential energy surfaces of ICN: the bound ground electronic state,
V0 with minimum at Re, an excited unbound state, V1, which dissociates to CN(X2Σ+) and I(2P3/2), and a higher
energy unbound state, which dissociates to CN(B2Σ+) and I(2P3/2). A t = 0 pulse from the pump laser, with center
wavelength λ1, excites a vertical turning-point-to-turning-point (P0 = 0, P1 = 0) transition at R = R0 > Re to the
V1 potential surface. The wavepacket on the V1 potential surface experiences a force in the increasing RI-CN
direction, which causes the PI-CN momentum to increase monotonically with time. At t = τ , a pulse from the
probe laser, with center wavelength probes for the arrival of the wavepacket at RI-CN = R? or R∞ . The
energy of the vertical (ΔR=0) and momentumconserving (ΔP=0) transition also increases monotonically with
time as the wavepacket travels outward on V1. This V2−V1 transition is essentially an excitation of the CN B−X
electronic transition in the presence of the departing I atom. The R= RI-CN = R? Optically Coupled Region (OCR)
is interrogated by a probe pulse with center wavelength , where is the wavelength of the free CN
B−X v0 = 0 − v00 = 0 band. The detected signal is CN B-X spontaneous fluorescence. Reproduced with permission
from Figure 1 in M. J. Rosker, M. Dantus, and A. H. Zewail, “Femtosecond real-time probing of reactions. I. The
technique,”
J. Chem. Phys. 89, 6113–6127 (1988). Copyright 1988, AIP Publishing LLC.
Internuclear Separation

Figure 2: Wavepacket Transit through an Ionic∼Covalent Potential Energy Curve Crossing in NaI
(Figure 1 of Ref. 26). The diabatic (solid lines) Na+,I− and Na,I potential energy curves cross at Rx = 6.93A.˚ The
avoided crossing between the adiabatic potential curves is shown as dashed lines. At t = t0 the 310 nm pump
pulse creates a wavepacket at the inner turning point of the covalent (Na 2S, I2P3/2) potential curve at
R≈Re(X1Σ+) and P= 0. By adjusting the center wavelength of the pump pulse, the center total-energy (electronic
plus vibrational) of the wavepacket can be adjusted between 30,000 and 34,000 cm−1 . The excitation energy
of the ionic∼covalent curve crossing is ∼ 26, 000 cm−1 . The wavepacket is accelerated outward, passes through
the curve-crossing region at t?, and bifurcates, one part traveling on the bound ionic potential and the other
part traveling irreversibly outward on the unbound covalent potential. The ionic part is reflected at tR at the
outer turning point of the ionic potential, passes with P< 0 through the R= 6.93 ˚A curve crossing region where
it bifurcates again, and the resultant ionic and covalent parts are reflected outward at the inner turning points
of the ionic and covalent potential curves, respectively. Each outward passage of a wavepacket through the
curve crossing region results in a wavepacket traveling irreversibly outward on the unbound covalent
potential, eventually forming free Na(2S) and I(2P3/2) atoms. The probe pulse (not shown) interrogates the
dynamics by exciting Na(2S),I(2P3/2) weakly-bound molecules to a higher energy repulsive electronic state that
dissociates to Na(2P) + I(2P3/2) atoms. Excitation at centerwavelength longer than 589 nm samples NaI
molecules en route to full dissociation. Excitation centered at 589 nm provides what is essentially a time-
integrated sample of the accumulation of the free Na(2S) atoms. Reproduced with permission from Figure 1 in
T. S. Rose, M. J. Rosker, and A. H. Zewail, “Femtosecond real-time observations of wave packet oscillations
(resonance) in dissociation reactions,” J. Chem. Phys. 88, 6672–6673 (1988). Copyright 1988, AIP Publishing
LLC.
0
4
R
x
= 6.93Å
COVALENT Na +I
IONIC Na
+
+I
–
t
0
t
*
t
R
R(Å)
10
15
0
2
5
0
5
10
15
20
25
30
35
Energy (10
3
cm
–1
)
FS
pump (
λ
)
FS
probe (t,
λ
)
Na I*
Na
[
…
I]
‡
*
Na
[
……
I]
‡
*
Na + I + E
tr

Figure 3: Clocking of the Photodissociation of NaI (and NaBr) as the Nuclear Wavepacket Repeatedly
Traverses the Ionic/Covalent Curve Crossing (Figure 2 of Ref. 26). The wavepacket, illustrated in Fig. 6.5, is
created at t = t0 at the inner turning point on the covalent excited electronic state. At each outward-bound
traversal of the curve-crossing region, part of the wavepacket follows the covalent adiabatic curve irreversibly
outward to separated Na(2S)+I(2P3/2) atoms. If the probe laser centerwavelength is tuned slightly to the red of
the 589 nm free Na atom 2P←2S transition, each time a wavepacket of incompletely separated Na,I molecules
passes through the Optically Coupled Region, some not quite free Na atoms are excited to the 2P state, from
which spontaneous fluorescence is detected. The series of Na atom fluorescence pulses shown in Spectrum I
samples each outward passage of a wavepacket through the curve-crossing region. The temporal spacing of
the pulses corresponds to a 36 cm−1 vibrational frequency. When the center-wavelength of the probe laser is
tuned to 589 nm, the arrivals of free Na atom wavepackets are displayed in Spectrum II as a periodic series of
upward steps. Spectrum III shows that the (upper) adiabatic potential curve for NaBr is shallower and “leakier”
than that for NaI. Reproduced with permission from Figure 2 in T. S. Rose, M. J. Rosker, and A. H. Zewail,
“Femtosecond real-time observations of wave packet oscillations (resonance) in dissociation reactions,” J.
Chem. Phys. 88, 6672–6673 (1988). Copyright 1988, AIP Publishing LLC. Ahmed Zewail was awarded the
1999 Nobel Prize in Chemistry for “Femtosecond Transition State (FTS) Spectroscopy.”
These experiments were described as the first time that the mechanisms of real
intramolecular dynamics were ”clocked” in real time. In a pump/probe scheme, a
femtosecond pump pulse creates a wavepacket on a repulsive or predissociated
electronically excited V1 potential energy surface at t = 0 by excitation from the v = 0 level of
the electronic ground state, V0 (ability to tune center energy of wavepacket by a small
500
fs
∆t (fs)
III
II

amount). After each excitation pulse, the time-evolving wavepacket is probed by a
femtosecond pulse with a chosen center wavelength at a time-delay t = τ. This delay time is
scanned, pulse-by-pulse, to determine the time at which the center of the wavepacket
crosses through the “Optically Coupled Region (OCR).” The probe pulse excites a portion of
the wavepacket from the V1 potential surface to a higher energy repulsive potential surface,
V2. The V2 potential surface is repulsive, dissociating to an electronically excited fragment.
The detected signal is the time-integrated ∼ 10 nanosecond lifetime fluorescence from this
excited fragment. The dynamically relevant information is encoded in the intensity vs. τ of
this time-integrated fluorescence, which samples the femtosecond passage of the
wavepacket through the OCR that is selected by the center wavelength of the probe pulse.
The ICN photodissociation experiment shows the effect of the presence of the I atom on the
frequency of the CN B2Σ+ − X2Σ+ electronic transition. As the I atom moves away from the CN
molecule, the energy of the CN electronic excitation increases from its value in the ICN
molecule to that of the free CN molecule. Did we know this before doing the experiment? As
the ICN bond stretches, the electronic structure of the CN moiety changes. This is
mechanism!
The photodissociation of NaI is mediated by a covalent-to-ionic curve crossing. The diabatic
(crossing) potential energy curves (solid lines) are the ones for which the electronic
character does not change rapidly as the molecule traverses the internuclear distance of the
curve crossing. The adiabatic curves (dashed lines), which are what “clamped nuclei”
quantum chemical calculations generate, exhibit a rapid change of electronic character at
the internuclear distance of the avoided crossing. As the molecule moves through the curve-
crossing region, it must decide whether it is going to follow the diabatic or the adiabatic
potential. Landau-Zener theory tells us the velocity-dependence of the probability of
jumping across the energy gap between the ionic and the covalent adiabatic curves. If you
drive too fast, you will be unable to stay on the road on a sharp curve. The sharpness of the
curve is determined by the magnitude of the interaction matrix element between the
diabatic potential curves. A very gentle curvature is the signature of a very large interaction
matrix element. In the Zewail experiments, the velocity in the curve-crossing region can be
systematically slightly adjusted by the choice of the center wavelength of the pump pulse.
At an NaI energy far above that of the curve-crossing, the velocity in the crossing region is
very large and the molecule stays on one of the diabatic potentials, in effect jumping the gap
between adiabatic curves. At an energy near that of the curve crossing, the molecule would
go through the crossing region slowly and stay on one of the adiabatic curves, with the result
that the wave packet that is born covalent, is nearly 100% converted to ionic at the
internuclear distance of the crossing. Zewail’s NaI experiments provide a direct
experimental determination of the internuclear distance of the curve crossing and an
explicit illustration of Landau-Zener theory.

Figure 1: Pump/Probe Scheme for Photodissociation of ICN (Figure 1 of Ref. 24). This is a reduced
dimension representation of three singlet potential energy surfaces of ICN: the bound ground electronic state,
V0 with minimum at Re, an excited unbound state, V1, which dissociates to CN(X2Σ+) and I(2P3/2), and a higher
energy unbound state, which dissociates to CN(B2Σ+) and I(2P3/2). A t = 0 pulse from the pump laser, with center
wavelength λ1, excites a vertical turning-point-to-turning-point (P0 = 0, P1 = 0) transition at R = R0 > Re to the
V1 potential surface. The wavepacket on the V1 potential surface experiences a force in the increasing RI-CN
direction, which causes the PI-CN momentum to increase monotonically with time. At t = τ , a pulse from the
probe laser, with center wavelength probes for the arrival of the wavepacket at RI-CN = R? or R∞ . The
energy of the vertical (ΔR=0) and momentumconserving (ΔP=0) transition also increases monotonically with
time as the wavepacket travels outward on V1. This V2−V1 transition is essentially an excitation of the CN B−X
electronic transition in the presence of the departing I atom. The R= RI-CN = R? Optically Coupled Region (OCR)
is interrogated by a probe pulse with center wavelength , where is the wavelength of the free CN
B−X v0 = 0 − v00 = 0 band. The detected signal is CN B-X spontaneous fluorescence. Reproduced with permission
from Figure 1 in M. J. Rosker, M. Dantus, and A. H. Zewail, “Femtosecond real-time probing of reactions. I. The
technique,”
J. Chem. Phys. 89, 6113–6127 (1988). Copyright 1988, AIP Publishing LLC.
Internuclear Separation

Figure 2: Wavepacket Transit through an Ionic∼Covalent Potential Energy Curve Crossing in NaI
(Figure 1 of Ref. 26). The diabatic (solid lines) Na+,I− and Na,I potential energy curves cross at Rx = 6.93A.˚ The
avoided crossing between the adiabatic potential curves is shown as dashed lines. At t = t0 the 310 nm pump
pulse creates a wavepacket at the inner turning point of the covalent (Na 2S, I2P3/2) potential curve at
R≈Re(X1Σ+) and P= 0. By adjusting the center wavelength of the pump pulse, the center total-energy (electronic
plus vibrational) of the wavepacket can be adjusted between 30,000 and 34,000 cm−1 . The excitation energy
of the ionic∼covalent curve crossing is ∼ 26, 000 cm−1 . The wavepacket is accelerated outward, passes through
the curve-crossing region at t?, and bifurcates, one part traveling on the bound ionic potential and the other
part traveling irreversibly outward on the unbound covalent potential. The ionic part is reflected at tR at the
outer turning point of the ionic potential, passes with P< 0 through the R= 6.93 ˚A curve crossing region where
it bifurcates again, and the resultant ionic and covalent parts are reflected outward at the inner turning points
of the ionic and covalent potential curves, respectively. Each outward passage of a wavepacket through the
curve crossing region results in a wavepacket traveling irreversibly outward on the unbound covalent
potential, eventually forming free Na(2S) and I(2P3/2) atoms. The probe pulse (not shown) interrogates the
dynamics by exciting Na(2S),I(2P3/2) weakly-bound molecules to a higher energy repulsive electronic state that
dissociates to Na(2P) + I(2P3/2) atoms. Excitation at centerwavelength longer than 589 nm samples NaI
molecules en route to full dissociation. Excitation centered at 589 nm provides what is essentially a time-
integrated sample of the accumulation of the free Na(2S) atoms. Reproduced with permission from Figure 1 in
T. S. Rose, M. J. Rosker, and A. H. Zewail, “Femtosecond real-time observations of wave packet oscillations
(resonance) in dissociation reactions,” J. Chem. Phys. 88, 6672–6673 (1988). Copyright 1988, AIP Publishing
LLC.
0
4
R
x
= 6.93Å
COVALENT Na +I
IONIC Na
+
+I
–
t
0
t
*
t
R
R(Å)
10
15
0
2
5
0
5
10
15
20
25
30
35
Energy (10
3
cm
–1
)
FS
pump (
λ
)
FS
probe (t,
λ
)
Na I*
Na
[
…
I]
‡
*
Na
[
……
I]
‡
*
Na + I + E
tr

Figure 3: Clocking of the Photodissociation of NaI (and NaBr) as the Nuclear Wavepacket Repeatedly
Traverses the Ionic/Covalent Curve Crossing (Figure 2 of Ref. 26). The wavepacket, illustrated in Fig. 6.5, is
created at t = t0 at the inner turning point on the covalent excited electronic state. At each outward-bound
traversal of the curve-crossing region, part of the wavepacket follows the covalent adiabatic curve irreversibly
outward to separated Na(2S)+I(2P3/2) atoms. If the probe laser centerwavelength is tuned slightly to the red of
the 589 nm free Na atom 2P←2S transition, each time a wavepacket of incompletely separated Na,I molecules
passes through the Optically Coupled Region, some not quite free Na atoms are excited to the 2P state, from
which spontaneous fluorescence is detected. The series of Na atom fluorescence pulses shown in Spectrum I
samples each outward passage of a wavepacket through the curve-crossing region. The temporal spacing of
the pulses corresponds to a 36 cm−1 vibrational frequency. When the center-wavelength of the probe laser is
tuned to 589 nm, the arrivals of free Na atom wavepackets are displayed in Spectrum II as a periodic series of
upward steps. Spectrum III shows that the (upper) adiabatic potential curve for NaBr is shallower and “leakier”
than that for NaI. Reproduced with permission from Figure 2 in T. S. Rose, M. J. Rosker, and A. H. Zewail,
“Femtosecond real-time observations of wave packet oscillations (resonance) in dissociation reactions,” J.
Chem. Phys. 88, 6672–6673 (1988). Copyright 1988, AIP Publishing LLC.
Ahmed Zewail was awarded the 1999 Nobel Prize in Chemistry for “Femtosecond Transition
State (FTS) Spectroscopy.” These experiments were described as the first time that the
mechanisms of real intramolecular dynamics were ”clocked” in real time. In a pump/probe
scheme, a femtosecond pump pulse creates a wavepacket on a repulsive or predissociated
electronically excited V1 potential energy surface at t = 0 by excitation from the v = 0 level of
the electronic ground state, V0 (ability to tune center energy of wavepacket by a small
500
fs
∆t (fs)
III
II

amount). After each excitation pulse, the time-evolving wavepacket is probed by a
femtosecond pulse with a chosen center wavelength at a time-delay t = τ. This delay time is
scanned, pulse-by-pulse, to determine the time at which the center of the wavepacket
crosses through the “Optically Coupled Region (OCR).” The probe pulse excites a portion of
the wavepacket from the V1 potential surface to a higher energy repulsive potential surface,
V2. The V2 potential surface is repulsive, dissociating to an electronically excited fragment.
The detected signal is the time-integrated ∼ 10 nanosecond lifetime fluorescence from this
excited fragment. The dynamically relevant information is encoded in the intensity vs. τ of
this time-integrated fluorescence, which samples the femtosecond passage of the
wavepacket through the OCR that is selected by the center wavelength of the probe pulse.
The ICN photodissociation experiment shows the effect of the presence of the I atom on the
frequency of the CN B2Σ+ − X2Σ+ electronic transition. As the I atom moves away from the CN
molecule, the energy of the CN electronic excitation increases from its value in the ICN
molecule to that of the free CN molecule. Did we know this before doing the experiment? As
the ICN bond stretches, the electronic structure of the CN moiety changes. This is
mechanism!
The photodissociation of NaI is mediated by a covalent-to-ionic curve crossing. The diabatic
(crossing) potential energy curves (solid lines) are the ones for which the electronic
character does not change rapidly as the molecule traverses the internuclear distance of the
curve crossing. The adiabatic curves (dashed lines), which are what “clamped nuclei”
quantum chemical calculations generate, exhibit a rapid change of electronic character at
the internuclear distance of the avoided crossing. As the molecule moves through the curve-
crossing region, it must decide whether it is going to follow the diabatic or the adiabatic
potential. Landau-Zener theory tells us the velocity-dependence of the probability of
jumping across the energy gap between the ionic and the covalent adiabatic curves. If you
drive too fast, you will be unable to stay on the road on a sharp curve. The sharpness of the
curve is determined by the magnitude of the interaction matrix element between the
diabatic potential curves. A very gentle curvature is the signature of a very large interaction
matrix element. In the Zewail experiments, the velocity in the curve-crossing region can be
systematically slightly adjusted by the choice of the center wavelength of the pump pulse.
At an NaI energy far above that of the curve-crossing, the velocity in the crossing region is
very large and the molecule stays on one of the diabatic potentials, in effect jumping the gap
between adiabatic curves. At an energy near that of the curve crossing, the molecule would
go through the crossing region slowly and stay on one of the adiabatic curves, with the result
that the wave packet that is born covalent, is nearly 100% converted to ionic at the
internuclear distance of the crossing. Zewail’s NaI experiments provide a direct
experimental determination of the internuclear distance of the curve crossing and an
explicit illustration of Landau-Zener theory.

Figure 1: Pump/Probe Scheme for Photodissociation of ICN (Figure 1 of Ref. 24). This is a reduced
dimension representation of three singlet potential energy surfaces of ICN: the bound ground electronic state,
V0 with minimum at Re, an excited unbound state, V1, which dissociates to CN(X2Σ+) and I(2P3/2), and a higher
energy unbound state, which dissociates to CN(B2Σ+) and I(2P3/2). A t = 0 pulse from the pump laser, with center
wavelength λ1, excites a vertical turning-point-to-turning-point (P0 = 0, P1 = 0) transition at R = R0 > Re to the
V1 potential surface. The wavepacket on the V1 potential surface experiences a force in the increasing RI-CN
direction, which causes the PI-CN momentum to increase monotonically with time. At t = τ , a pulse from the
probe laser, with center wavelength probes for the arrival of the wavepacket at RI-CN = R? or R∞ . The
energy of the vertical (ΔR=0) and momentumconserving (ΔP=0) transition also increases monotonically with
time as the wavepacket travels outward on V1. This V2−V1 transition is essentially an excitation of the CN B−X
electronic transition in the presence of the departing I atom. The R= RI-CN = R? Optically Coupled Region (OCR)
is interrogated by a probe pulse with center wavelength , where is the wavelength of the free CN
B−X v0 = 0 − v00 = 0 band. The detected signal is CN B-X spontaneous fluorescence. Reproduced with permission
from Figure 1 in M. J. Rosker, M. Dantus, and A. H. Zewail, “Femtosecond real-time probing of reactions. I. The
technique,”
J. Chem. Phys. 89, 6113–6127 (1988). Copyright 1988, AIP Publishing LLC.
Internuclear Separation

Figure 2: Wavepacket Transit through an Ionic∼Covalent Potential Energy Curve Crossing in NaI
(Figure 1 of Ref. 26). The diabatic (solid lines) Na+,I− and Na,I potential energy curves cross at Rx = 6.93A.˚ The
avoided crossing between the adiabatic potential curves is shown as dashed lines. At t = t0 the 310 nm pump
pulse creates a wavepacket at the inner turning point of the covalent (Na 2S, I2P3/2) potential curve at
R≈Re(X1Σ+) and P= 0. By adjusting the center wavelength of the pump pulse, the center total-energy (electronic
plus vibrational) of the wavepacket can be adjusted between 30,000 and 34,000 cm−1 . The excitation energy
of the ionic∼covalent curve crossing is ∼ 26, 000 cm−1 . The wavepacket is accelerated outward, passes through
the curve-crossing region at t?, and bifurcates, one part traveling on the bound ionic potential and the other
part traveling irreversibly outward on the unbound covalent potential. The ionic part is reflected at tR at the
outer turning point of the ionic potential, passes with P< 0 through the R= 6.93 ˚A curve crossing region where
it bifurcates again, and the resultant ionic and covalent parts are reflected outward at the inner turning points
of the ionic and covalent potential curves, respectively. Each outward passage of a wavepacket through the
curve crossing region results in a wavepacket traveling irreversibly outward on the unbound covalent
potential, eventually forming free Na(2S) and I(2P3/2) atoms. The probe pulse (not shown) interrogates the
dynamics by exciting Na(2S),I(2P3/2) weakly-bound molecules to a higher energy repulsive electronic state that
dissociates to Na(2P) + I(2P3/2) atoms. Excitation at centerwavelength longer than 589 nm samples NaI
molecules en route to full dissociation. Excitation centered at 589 nm provides what is essentially a time-
integrated sample of the accumulation of the free Na(2S) atoms. Reproduced with permission from Figure 1 in
T. S. Rose, M. J. Rosker, and A. H. Zewail, “Femtosecond real-time observations of wave packet oscillations
(resonance) in dissociation reactions,” J. Chem. Phys. 88, 6672–6673 (1988). Copyright 1988, AIP Publishing
LLC.
0
4
R
x
= 6.93Å
COVALENT Na +I
IONIC Na
+
+I
–
t
0
t
*
t
R
R(Å)
10
15
0
2
5
0
5
10
15
20
25
30
35
Energy (10
3
cm
–1
)
FS
pump (
λ
)
FS
probe (t,
λ
)
Na I*
Na
[
…
I]
‡
*
Na
[
……
I]
‡
*
Na + I + E
tr

Figure 3: Clocking of the Photodissociation of NaI (and NaBr) as the Nuclear Wavepacket Repeatedly
Traverses the Ionic/Covalent Curve Crossing (Figure 2 of Ref. 26). The wavepacket, illustrated in Fig. 6.5, is
created at t = t0 at the inner turning point on the covalent excited electronic state. At each outward-bound
traversal of the curve-crossing region, part of the wavepacket follows the covalent adiabatic curve irreversibly
outward to separated Na(2S)+I(2P3/2) atoms. If the probe laser centerwavelength is tuned slightly to the red of
the 589 nm free Na atom 2P←2S transition, each time a wavepacket of incompletely separated Na,I molecules
passes through the Optically Coupled Region, some not quite free Na atoms are excited to the 2P state, from
which spontaneous fluorescence is detected. The series of Na atom fluorescence pulses shown in Spectrum I
samples each outward passage of a wavepacket through the curve-crossing region. The temporal spacing of
the pulses corresponds to a 36 cm−1 vibrational frequency. When the center-wavelength of the probe laser is
tuned to 589 nm, the arrivals of free Na atom wavepackets are displayed in Spectrum II as a periodic series of
upward steps. Spectrum III shows that the (upper) adiabatic potential curve for NaBr is shallower and “leakier”
than that for NaI. Reproduced with permission from Figure 2 in T. S. Rose, M. J. Rosker, and A. H. Zewail,
“Femtosecond real-time observations of wave packet oscillations (resonance) in dissociation reactions,” J.
Chem. Phys. 88, 6672–6673 (1988). Copyright 1988, AIP Publishing LLC.
Ahmed Zewail was awarded the 1999 Nobel Prize in Chemistry for “Femtosecond Transition
State (FTS) Spectroscopy.” These experiments were described as the first time that the
mechanisms of real intramolecular dynamics were ”clocked” in real time. In a pump/probe
scheme, a femtosecond pump pulse creates a wavepacket on a repulsive or predissociated
electronically excited V1 potential energy surface at t = 0 by excitation from the v = 0 level of
the electronic ground state, V0 (ability to tune center energy of wavepacket by a small
500
fs
∆t (fs)
III
II

amount). After each excitation pulse, the time-evolving wavepacket is probed by a
femtosecond pulse with a chosen center wavelength at a time-delay t = τ. This delay time is
scanned, pulse-by-pulse, to determine the time at which the center of the wavepacket
crosses through the “Optically Coupled Region (OCR).” The probe pulse excites a portion of
the wavepacket from the V1 potential surface to a higher energy repulsive potential surface,
V2. The V2 potential surface is repulsive, dissociating to an electronically excited fragment.
The detected signal is the time-integrated ∼ 10 nanosecond lifetime fluorescence from this
excited fragment. The dynamically relevant information is encoded in the intensity vs. τ of
this time-integrated fluorescence, which samples the femtosecond passage of the
wavepacket through the OCR that is selected by the center wavelength of the probe pulse.
The ICN photodissociation experiment shows the effect of the presence of the I atom on the
frequency of the CN B2Σ+ − X2Σ+ electronic transition. As the I atom moves away from the CN
molecule, the energy of the CN electronic excitation increases from its value in the ICN
molecule to that of the free CN molecule. Did we know this before doing the experiment? As
the ICN bond stretches, the electronic structure of the CN moiety changes. This is
mechanism!
The photodissociation of NaI is mediated by a covalent-to-ionic curve crossing. The diabatic
(crossing) potential energy curves (solid lines) are the ones for which the electronic
character does not change rapidly as the molecule traverses the internuclear distance of the
curve crossing. The adiabatic curves (dashed lines), which are what “clamped nuclei”
quantum chemical calculations generate, exhibit a rapid change of electronic character at
the internuclear distance of the avoided crossing. As the molecule moves through the curve-
crossing region, it must decide whether it is going to follow the diabatic or the adiabatic
potential. Landau-Zener theory tells us the velocity-dependence of the probability of
jumping across the energy gap between the ionic and the covalent adiabatic curves. If you
drive too fast, you will be unable to stay on the road on a sharp curve. The sharpness of the
curve is determined by the magnitude of the interaction matrix element between the
diabatic potential curves. A very gentle curvature is the signature of a very large interaction
matrix element. In the Zewail experiments, the velocity in the curve-crossing region can be
systematically slightly adjusted by the choice of the center wavelength of the pump pulse.
At an NaI energy far above that of the curve-crossing, the velocity in the crossing region is
very large and the molecule stays on one of the diabatic potentials, in effect jumping the gap
between adiabatic curves. At an energy near that of the curve crossing, the molecule would
go through the crossing region slowly and stay on one of the adiabatic curves, with the result
that the wave packet that is born covalent, is nearly 100% converted to ionic at the
internuclear distance of the crossing. Zewail’s NaI experiments provide a direct
experimental determination of the internuclear distance of the curve crossing and an
explicit illustration of Landau-Zener theory.

Figure 1: Pump/Probe Scheme for Photodissociation of ICN (Figure 1 of Ref. 24). This is a reduced
dimension representation of three singlet potential energy surfaces of ICN: the bound ground electronic state,
V0 with minimum at Re, an excited unbound state, V1, which dissociates to CN(X2Σ+) and I(2P3/2), and a higher
energy unbound state, which dissociates to CN(B2Σ+) and I(2P3/2). A t = 0 pulse from the pump laser, with center
wavelength λ1, excites a vertical turning-point-to-turning-point (P0 = 0, P1 = 0) transition at R = R0 > Re to the
V1 potential surface. The wavepacket on the V1 potential surface experiences a force in the increasing RI-CN
direction, which causes the PI-CN momentum to increase monotonically with time. At t = τ , a pulse from the
probe laser, with center wavelength probes for the arrival of the wavepacket at RI-CN = R? or R∞ . The
energy of the vertical (ΔR=0) and momentumconserving (ΔP=0) transition also increases monotonically with
time as the wavepacket travels outward on V1. This V2−V1 transition is essentially an excitation of the CN B−X
electronic transition in the presence of the departing I atom. The R= RI-CN = R? Optically Coupled Region (OCR)
is interrogated by a probe pulse with center wavelength , where is the wavelength of the free CN
B−X v0 = 0 − v00 = 0 band. The detected signal is CN B-X spontaneous fluorescence. Reproduced with permission
from Figure 1 in M. J. Rosker, M. Dantus, and A. H. Zewail, “Femtosecond real-time probing of reactions. I. The
technique,”
J. Chem. Phys. 89, 6113–6127 (1988). Copyright 1988, AIP Publishing LLC.
Internuclear Separation

Figure 2: Wavepacket Transit through an Ionic∼Covalent Potential Energy Curve Crossing in NaI
(Figure 1 of Ref. 26). The diabatic (solid lines) Na+,I− and Na,I potential energy curves cross at Rx = 6.93A.˚ The
avoided crossing between the adiabatic potential curves is shown as dashed lines. At t = t0 the 310 nm pump
pulse creates a wavepacket at the inner turning point of the covalent (Na 2S, I2P3/2) potential curve at
R≈Re(X1Σ+) and P= 0. By adjusting the center wavelength of the pump pulse, the center total-energy (electronic
plus vibrational) of the wavepacket can be adjusted between 30,000 and 34,000 cm−1 . The excitation energy
of the ionic∼covalent curve crossing is ∼ 26, 000 cm−1 . The wavepacket is accelerated outward, passes through
the curve-crossing region at t?, and bifurcates, one part traveling on the bound ionic potential and the other
part traveling irreversibly outward on the unbound covalent potential. The ionic part is reflected at tR at the
outer turning point of the ionic potential, passes with P< 0 through the R= 6.93 ˚A curve crossing region where
it bifurcates again, and the resultant ionic and covalent parts are reflected outward at the inner turning points
of the ionic and covalent potential curves, respectively. Each outward passage of a wavepacket through the
curve crossing region results in a wavepacket traveling irreversibly outward on the unbound covalent
potential, eventually forming free Na(2S) and I(2P3/2) atoms. The probe pulse (not shown) interrogates the
dynamics by exciting Na(2S),I(2P3/2) weakly-bound molecules to a higher energy repulsive electronic state that
dissociates to Na(2P) + I(2P3/2) atoms. Excitation at centerwavelength longer than 589 nm samples NaI
molecules en route to full dissociation. Excitation centered at 589 nm provides what is essentially a time-
integrated sample of the accumulation of the free Na(2S) atoms. Reproduced with permission from Figure 1 in
T. S. Rose, M. J. Rosker, and A. H. Zewail, “Femtosecond real-time observations of wave packet oscillations
(resonance) in dissociation reactions,” J. Chem. Phys. 88, 6672–6673 (1988). Copyright 1988, AIP Publishing
LLC.
0
4
R
x
= 6.93Å
COVALENT Na +I
IONIC Na
+
+I
–
t
0
t
*
t
R
R(Å)
10
15
0
2
5
0
5
10
15
20
25
30
35
Energy (10
3
cm
–1
)
FS
pump (
λ
)
FS
probe (t,
λ
)
Na I*
Na
[
…
I]
‡
*
Na
[
……
I]
‡
*
Na + I + E
tr

Figure 3: Clocking of the Photodissociation of NaI (and NaBr) as the Nuclear Wavepacket Repeatedly
Traverses the Ionic/Covalent Curve Crossing (Figure 2 of Ref. 26). The wavepacket, illustrated in Fig. 6.5, is
created at t = t0 at the inner turning point on the covalent excited electronic state. At each outward-bound
traversal of the curve-crossing region, part of the wavepacket follows the covalent adiabatic curve irreversibly
outward to separated Na(2S)+I(2P3/2) atoms. If the probe laser centerwavelength is tuned slightly to the red of
the 589 nm free Na atom 2P←2S transition, each time a wavepacket of incompletely separated Na,I molecules
passes through the Optically Coupled Region, some not quite free Na atoms are excited to the 2P state, from
which spontaneous fluorescence is detected. The series of Na atom fluorescence pulses shown in Spectrum I
samples each outward passage of a wavepacket through the curve-crossing region. The temporal spacing of
the pulses corresponds to a 36 cm−1 vibrational frequency. When the center-wavelength of the probe laser is
tuned to 589 nm, the arrivals of free Na atom wavepackets are displayed in Spectrum II as a periodic series of
upward steps. Spectrum III shows that the (upper) adiabatic potential curve for NaBr is shallower and “leakier”
than that for NaI. Reproduced with permission from Figure 2 in T. S. Rose, M. J. Rosker, and A. H. Zewail,
“Femtosecond real-time observations of wave packet oscillations (resonance) in dissociation reactions,” J.
Chem. Phys. 88, 6672–6673 (1988). Copyright 1988, AIP Publishing LLC.
Ahmed Zewail was awarded the 1999 Nobel Prize in Chemistry for “Femtosecond Transition
State (FTS) Spectroscopy.” These experiments were described as the first time that the
mechanisms of real intramolecular dynamics were ”clocked” in real time. In a pump/probe
scheme, a femtosecond pump pulse creates a wavepacket on a repulsive or predissociated
electronically excited V1 potential energy surface at t = 0 by excitation from the v = 0 level of
the electronic ground state, V0 (ability to tune center energy of wavepacket by a small
500
fs
∆t (fs)
III
II

amount). After each excitation pulse, the time-evolving wavepacket is probed by a
femtosecond pulse with a chosen center wavelength at a time-delay t = τ. This delay time is
scanned, pulse-by-pulse, to determine the time at which the center of the wavepacket
crosses through the “Optically Coupled Region (OCR).” The probe pulse excites a portion of
the wavepacket from the V1 potential surface to a higher energy repulsive potential surface,
V2. The V2 potential surface is repulsive, dissociating to an electronically excited fragment.
The detected signal is the time-integrated ∼ 10 nanosecond lifetime fluorescence from this
excited fragment. The dynamically relevant information is encoded in the intensity vs. τ of
this time-integrated fluorescence, which samples the femtosecond passage of the
wavepacket through the OCR that is selected by the center wavelength of the probe pulse.
The ICN photodissociation experiment shows the effect of the presence of the I atom on the
frequency of the CN B2Σ+ − X2Σ+ electronic transition. As the I atom moves away from the CN
molecule, the energy of the CN electronic excitation increases from its value in the ICN
molecule to that of the free CN molecule. Did we know this before doing the experiment? As
the ICN bond stretches, the electronic structure of the CN moiety changes. This is
mechanism!
The photodissociation of NaI is mediated by a covalent-to-ionic curve crossing. The diabatic
(crossing) potential energy curves (solid lines) are the ones for which the electronic
character does not change rapidly as the molecule traverses the internuclear distance of the
curve crossing. The adiabatic curves (dashed lines), which are what “clamped nuclei”
quantum chemical calculations generate, exhibit a rapid change of electronic character at
the internuclear distance of the avoided crossing. As the molecule moves through the curve-
crossing region, it must decide whether it is going to follow the diabatic or the adiabatic
potential. Landau-Zener theory tells us the velocity-dependence of the probability of
jumping across the energy gap between the ionic and the covalent adiabatic curves. If you
drive too fast, you will be unable to stay on the road on a sharp curve. The sharpness of the
curve is determined by the magnitude of the interaction matrix element between the
diabatic potential curves. A very gentle curvature is the signature of a very large interaction
matrix element. In the Zewail experiments, the velocity in the curve-crossing region can be
systematically slightly adjusted by the choice of the center wavelength of the pump pulse.
At an NaI energy far above that of the curve-crossing, the velocity in the crossing region is
very large and the molecule stays on one of the diabatic potentials, in effect jumping the gap
between adiabatic curves. At an energy near that of the curve crossing, the molecule would
go through the crossing region slowly and stay on one of the adiabatic curves, with the result
that the wave packet that is born covalent, is nearly 100% converted to ionic at the
internuclear distance of the crossing. Zewail’s NaI experiments provide a direct
experimental determination of the internuclear distance of the curve crossing and an
explicit illustration of Landau-Zener theory.

Figure 1: Pump/Probe Scheme for Photodissociation of ICN (Figure 1 of Ref. 24). This is a reduced
dimension representation of three singlet potential energy surfaces of ICN: the bound ground electronic state,
V0 with minimum at Re, an excited unbound state, V1, which dissociates to CN(X2Σ+) and I(2P3/2), and a higher
energy unbound state, which dissociates to CN(B2Σ+) and I(2P3/2). A t = 0 pulse from the pump laser, with center
wavelength λ1, excites a vertical turning-point-to-turning-point (P0 = 0, P1 = 0) transition at R = R0 > Re to the
V1 potential surface. The wavepacket on the V1 potential surface experiences a force in the increasing RI-CN
direction, which causes the PI-CN momentum to increase monotonically with time. At t = τ , a pulse from the
probe laser, with center wavelength probes for the arrival of the wavepacket at RI-CN = R? or R∞ . The
energy of the vertical (ΔR=0) and momentumconserving (ΔP=0) transition also increases monotonically with
time as the wavepacket travels outward on V1. This V2−V1 transition is essentially an excitation of the CN B−X
electronic transition in the presence of the departing I atom. The R= RI-CN = R? Optically Coupled Region (OCR)
is interrogated by a probe pulse with center wavelength , where is the wavelength of the free CN
B−X v0 = 0 − v00 = 0 band. The detected signal is CN B-X spontaneous fluorescence. Reproduced with permission
from Figure 1 in M. J. Rosker, M. Dantus, and A. H. Zewail, “Femtosecond real-time probing of reactions. I. The
technique,”
J. Chem. Phys. 89, 6113–6127 (1988). Copyright 1988, AIP Publishing LLC.
Internuclear Separation

Figure 2: Wavepacket Transit through an Ionic∼Covalent Potential Energy Curve Crossing in NaI
(Figure 1 of Ref. 26). The diabatic (solid lines) Na+,I− and Na,I potential energy curves cross at Rx = 6.93A.˚ The
avoided crossing between the adiabatic potential curves is shown as dashed lines. At t = t0 the 310 nm pump
pulse creates a wavepacket at the inner turning point of the covalent (Na 2S, I2P3/2) potential curve at
R≈Re(X1Σ+) and P= 0. By adjusting the center wavelength of the pump pulse, the center total-energy (electronic
plus vibrational) of the wavepacket can be adjusted between 30,000 and 34,000 cm−1 . The excitation energy
of the ionic∼covalent curve crossing is ∼ 26, 000 cm−1 . The wavepacket is accelerated outward, passes through
the curve-crossing region at t?, and bifurcates, one part traveling on the bound ionic potential and the other
part traveling irreversibly outward on the unbound covalent potential. The ionic part is reflected at tR at the
outer turning point of the ionic potential, passes with P< 0 through the R= 6.93 ˚A curve crossing region where
it bifurcates again, and the resultant ionic and covalent parts are reflected outward at the inner turning points
of the ionic and covalent potential curves, respectively. Each outward passage of a wavepacket through the
curve crossing region results in a wavepacket traveling irreversibly outward on the unbound covalent
potential, eventually forming free Na(2S) and I(2P3/2) atoms. The probe pulse (not shown) interrogates the
dynamics by exciting Na(2S),I(2P3/2) weakly-bound molecules to a higher energy repulsive electronic state that
dissociates to Na(2P) + I(2P3/2) atoms. Excitation at centerwavelength longer than 589 nm samples NaI
molecules en route to full dissociation. Excitation centered at 589 nm provides what is essentially a time-
integrated sample of the accumulation of the free Na(2S) atoms. Reproduced with permission from Figure 1 in
T. S. Rose, M. J. Rosker, and A. H. Zewail, “Femtosecond real-time observations of wave packet oscillations
(resonance) in dissociation reactions,” J. Chem. Phys. 88, 6672–6673 (1988). Copyright 1988, AIP Publishing
LLC.
0
4
R
x
= 6.93Å
COVALENT Na +I
IONIC Na
+
+I
–
t
0
t
*
t
R
R(Å)
10
15
0
2
5
0
5
10
15
20
25
30
35
Energy (10
3
cm
–1
)
FS
pump (
λ
)
FS
probe (t,
λ
)
Na I*
Na
[
…
I]
‡
*
Na
[
……
I]
‡
*
Na + I + E
tr

Figure 3: Clocking of the Photodissociation of NaI (and NaBr) as the Nuclear Wavepacket Repeatedly
Traverses the Ionic/Covalent Curve Crossing (Figure 2 of Ref. 26). The wavepacket, illustrated in Fig. 6.5, is
created at t = t0 at the inner turning point on the covalent excited electronic state. At each outward-bound
traversal of the curve-crossing region, part of the wavepacket follows the covalent adiabatic curve irreversibly
outward to separated Na(2S)+I(2P3/2) atoms. If the probe laser centerwavelength is tuned slightly to the red of
the 589 nm free Na atom 2P←2S transition, each time a wavepacket of incompletely separated Na,I molecules
passes through the Optically Coupled Region, some not quite free Na atoms are excited to the 2P state, from
which spontaneous fluorescence is detected. The series of Na atom fluorescence pulses shown in Spectrum I
samples each outward passage of a wavepacket through the curve-crossing region. The temporal spacing of
the pulses corresponds to a 36 cm−1 vibrational frequency. When the center-wavelength of the probe laser is
tuned to 589 nm, the arrivals of free Na atom wavepackets are displayed in Spectrum II as a periodic series of
upward steps. Spectrum III shows that the (upper) adiabatic potential curve for NaBr is shallower and “leakier”
than that for NaI. Reproduced with permission from Figure 2 in T. S. Rose, M. J. Rosker, and A. H. Zewail,
“Femtosecond real-time observations of wave packet oscillations (resonance) in dissociation reactions,” J.
Chem. Phys. 88, 6672–6673 (1988). Copyright 1988, AIP Publishing LLC. Ahmed Zewail was awarded the
1999 Nobel Prize in Chemistry for “Femtosecond Transition State (FTS) Spectroscopy.”
These experiments were described as the first time that the mechanisms of real
intramolecular dynamics were ”clocked” in real time. In a pump/probe scheme, a
femtosecond pump pulse creates a wavepacket on a repulsive or predissociated
electronically excited V1 potential energy surface at t = 0 by excitation from the v = 0 level of
the electronic ground state, V0 (ability to tune center energy of wavepacket by a small
500
fs
∆t (fs)
III
II

amount). After each excitation pulse, the time-evolving wavepacket is probed by a
femtosecond pulse with a chosen center wavelength at a time-delay t = τ. This delay time is
scanned, pulse-by-pulse, to determine the time at which the center of the wavepacket
crosses through the “Optically Coupled Region (OCR).” The probe pulse excites a portion of
the wavepacket from the V1 potential surface to a higher energy repulsive potential surface,
V2. The V2 potential surface is repulsive, dissociating to an electronically excited fragment.
The detected signal is the time-integrated ∼ 10 nanosecond lifetime fluorescence from this
excited fragment. The dynamically relevant information is encoded in the intensity vs. τ of
this time-integrated fluorescence, which samples the femtosecond passage of the
wavepacket through the OCR that is selected by the center wavelength of the probe pulse.
The ICN photodissociation experiment shows the effect of the presence of the I atom on the
frequency of the CN B2Σ+ − X2Σ+ electronic transition. As the I atom moves away from the CN
molecule, the energy of the CN electronic excitation increases from its value in the ICN
molecule to that of the free CN molecule. Did we know this before doing the experiment? As
the ICN bond stretches, the electronic structure of the CN moiety changes. This is
mechanism!
The photodissociation of NaI is mediated by a covalent-to-ionic curve crossing. The diabatic
(crossing) potential energy curves (solid lines) are the ones for which the electronic
character does not change rapidly as the molecule traverses the internuclear distance of the
curve crossing. The adiabatic curves (dashed lines), which are what “clamped nuclei”
quantum chemical calculations generate, exhibit a rapid change of electronic character at
the internuclear distance of the avoided crossing. As the molecule moves through the curve-
crossing region, it must decide whether it is going to follow the diabatic or the adiabatic
potential. Landau-Zener theory tells us the velocity-dependence of the probability of
jumping across the energy gap between the ionic and the covalent adiabatic curves. If you
drive too fast, you will be unable to stay on the road on a sharp curve. The sharpness of the
curve is determined by the magnitude of the interaction matrix element between the
diabatic potential curves. A very gentle curvature is the signature of a very large interaction
matrix element. In the Zewail experiments, the velocity in the curve-crossing region can be
systematically slightly adjusted by the choice of the center wavelength of the pump pulse.
At an NaI energy far above that of the curve-crossing, the velocity in the crossing region is
very large and the molecule stays on one of the diabatic potentials, in effect jumping the gap
between adiabatic curves. At an energy near that of the curve crossing, the molecule would
go through the crossing region slowly and stay on one of the adiabatic curves, with the result
that the wave packet that is born covalent, is nearly 100% converted to ionic at the
internuclear distance of the crossing. Zewail’s NaI experiments provide a direct
experimental determination of the internuclear distance of the curve crossing and an
explicit illustration of Landau-Zener theory.

Figure 1: Pump/Probe Scheme for Photodissociation of ICN (Figure 1 of Ref. 24). This is a reduced
dimension representation of three singlet potential energy surfaces of ICN: the bound ground electronic state,
V0 with minimum at Re, an excited unbound state, V1, which dissociates to CN(X2Σ+) and I(2P3/2), and a higher
energy unbound state, which dissociates to CN(B2Σ+) and I(2P3/2). A t = 0 pulse from the pump laser, with center
wavelength λ1, excites a vertical turning-point-to-turning-point (P0 = 0, P1 = 0) transition at R = R0 > Re to the
V1 potential surface. The wavepacket on the V1 potential surface experiences a force in the increasing RI-CN
direction, which causes the PI-CN momentum to increase monotonically with time. At t = τ , a pulse from the
probe laser, with center wavelength probes for the arrival of the wavepacket at RI-CN = R? or R∞ . The
energy of the vertical (ΔR=0) and momentumconserving (ΔP=0) transition also increases monotonically with
time as the wavepacket travels outward on V1. This V2−V1 transition is essentially an excitation of the CN B−X
electronic transition in the presence of the departing I atom. The R= RI-CN = R? Optically Coupled Region (OCR)
is interrogated by a probe pulse with center wavelength , where is the wavelength of the free CN
B−X v0 = 0 − v00 = 0 band. The detected signal is CN B-X spontaneous fluorescence. Reproduced with permission
from Figure 1 in M. J. Rosker, M. Dantus, and A. H. Zewail, “Femtosecond real-time probing of reactions. I. The
technique,”
J. Chem. Phys. 89, 6113–6127 (1988). Copyright 1988, AIP Publishing LLC.
Internuclear Separation

Figure 2: Wavepacket Transit through an Ionic∼Covalent Potential Energy Curve Crossing in NaI
(Figure 1 of Ref. 26). The diabatic (solid lines) Na+,I− and Na,I potential energy curves cross at Rx = 6.93A.˚ The
avoided crossing between the adiabatic potential curves is shown as dashed lines. At t = t0 the 310 nm pump
pulse creates a wavepacket at the inner turning point of the covalent (Na 2S, I2P3/2) potential curve at
R≈Re(X1Σ+) and P= 0. By adjusting the center wavelength of the pump pulse, the center total-energy (electronic
plus vibrational) of the wavepacket can be adjusted between 30,000 and 34,000 cm−1 . The excitation energy
of the ionic∼covalent curve crossing is ∼ 26, 000 cm−1 . The wavepacket is accelerated outward, passes through
the curve-crossing region at t?, and bifurcates, one part traveling on the bound ionic potential and the other
part traveling irreversibly outward on the unbound covalent potential. The ionic part is reflected at tR at the
outer turning point of the ionic potential, passes with P< 0 through the R= 6.93 ˚A curve crossing region where
it bifurcates again, and the resultant ionic and covalent parts are reflected outward at the inner turning points
of the ionic and covalent potential curves, respectively. Each outward passage of a wavepacket through the
curve crossing region results in a wavepacket traveling irreversibly outward on the unbound covalent
potential, eventually forming free Na(2S) and I(2P3/2) atoms. The probe pulse (not shown) interrogates the
dynamics by exciting Na(2S),I(2P3/2) weakly-bound molecules to a higher energy repulsive electronic state that
dissociates to Na(2P) + I(2P3/2) atoms. Excitation at centerwavelength longer than 589 nm samples NaI
molecules en route to full dissociation. Excitation centered at 589 nm provides what is essentially a time-
integrated sample of the accumulation of the free Na(2S) atoms. Reproduced with permission from Figure 1 in
T. S. Rose, M. J. Rosker, and A. H. Zewail, “Femtosecond real-time observations of wave packet oscillations
(resonance) in dissociation reactions,” J. Chem. Phys. 88, 6672–6673 (1988). Copyright 1988, AIP Publishing
LLC.
0
4
R
x
= 6.93Å
COVALENT Na +I
IONIC Na
+
+I
–
t
0
t
*
t
R
R(Å)
10
15
0
2
5
0
5
10
15
20
25
30
35
Energy (10
3
cm
–1
)
FS
pump (
λ
)
FS
probe (t,
λ
)
Na I*
Na
[
…
I]
‡
*
Na
[
……
I]
‡
*
Na + I + E
tr

Figure 3: Clocking of the Photodissociation of NaI (and NaBr) as the Nuclear Wavepacket Repeatedly
Traverses the Ionic/Covalent Curve Crossing (Figure 2 of Ref. 26). The wavepacket, illustrated in Fig. 6.5, is
created at t = t0 at the inner turning point on the covalent excited electronic state. At each outward-bound
traversal of the curve-crossing region, part of the wavepacket follows the covalent adiabatic curve irreversibly
outward to separated Na(2S)+I(2P3/2) atoms. If the probe laser centerwavelength is tuned slightly to the red of
the 589 nm free Na atom 2P←2S transition, each time a wavepacket of incompletely separated Na,I molecules
passes through the Optically Coupled Region, some not quite free Na atoms are excited to the 2P state, from
which spontaneous fluorescence is detected. The series of Na atom fluorescence pulses shown in Spectrum I
samples each outward passage of a wavepacket through the curve-crossing region. The temporal spacing of
the pulses corresponds to a 36 cm−1 vibrational frequency. When the center-wavelength of the probe laser is
tuned to 589 nm, the arrivals of free Na atom wavepackets are displayed in Spectrum II as a periodic series of
upward steps. Spectrum III shows that the (upper) adiabatic potential curve for NaBr is shallower and “leakier”
than that for NaI. Reproduced with permission from Figure 2 in T. S. Rose, M. J. Rosker, and A. H. Zewail,
“Femtosecond real-time observations of wave packet oscillations (resonance) in dissociation reactions,” J.
Chem. Phys. 88, 6672–6673 (1988). Copyright 1988, AIP Publishing LLC.
Ahmed Zewail was awarded the 1999 Nobel Prize in Chemistry for “Femtosecond Transition
State (FTS) Spectroscopy.” These experiments were described as the first time that the
mechanisms of real intramolecular dynamics were ”clocked” in real time. In a pump/probe
scheme, a femtosecond pump pulse creates a wavepacket on a repulsive or predissociated
electronically excited V1 potential energy surface at t = 0 by excitation from the v = 0 level of
the electronic ground state, V0 (ability to tune center energy of wavepacket by a small
500
fs
∆t (fs)
III
II

amount). After each excitation pulse, the time-evolving wavepacket is probed by a
femtosecond pulse with a chosen center wavelength at a time-delay t = τ. This delay time is
scanned, pulse-by-pulse, to determine the time at which the center of the wavepacket
crosses through the “Optically Coupled Region (OCR).” The probe pulse excites a portion of
the wavepacket from the V1 potential surface to a higher energy repulsive potential surface,
V2. The V2 potential surface is repulsive, dissociating to an electronically excited fragment.
The detected signal is the time-integrated ∼ 10 nanosecond lifetime fluorescence from this
excited fragment. The dynamically relevant information is encoded in the intensity vs. τ of
this time-integrated fluorescence, which samples the femtosecond passage of the
wavepacket through the OCR that is selected by the center wavelength of the probe pulse.
The ICN photodissociation experiment shows the effect of the presence of the I atom on the
frequency of the CN B2Σ+ − X2Σ+ electronic transition. As the I atom moves away from the CN
molecule, the energy of the CN electronic excitation increases from its value in the ICN
molecule to that of the free CN molecule. Did we know this before doing the experiment? As
the ICN bond stretches, the electronic structure of the CN moiety changes. This is
mechanism!
The photodissociation of NaI is mediated by a covalent-to-ionic curve crossing. The diabatic
(crossing) potential energy curves (solid lines) are the ones for which the electronic
character does not change rapidly as the molecule traverses the internuclear distance of the
curve crossing. The adiabatic curves (dashed lines), which are what “clamped nuclei”
quantum chemical calculations generate, exhibit a rapid change of electronic character at
the internuclear distance of the avoided crossing. As the molecule moves through the curve-
crossing region, it must decide whether it is going to follow the diabatic or the adiabatic
potential. Landau-Zener theory tells us the velocity-dependence of the probability of
jumping across the energy gap between the ionic and the covalent adiabatic curves. If you
drive too fast, you will be unable to stay on the road on a sharp curve. The sharpness of the
curve is determined by the magnitude of the interaction matrix element between the
diabatic potential curves. A very gentle curvature is the signature of a very large interaction
matrix element. In the Zewail experiments, the velocity in the curve-crossing region can be
systematically slightly adjusted by the choice of the center wavelength of the pump pulse.
At an NaI energy far above that of the curve-crossing, the velocity in the crossing region is
very large and the molecule stays on one of the diabatic potentials, in effect jumping the gap
between adiabatic curves. At an energy near that of the curve crossing, the molecule would
go through the crossing region slowly and stay on one of the adiabatic curves, with the result
that the wave packet that is born covalent, is nearly 100% converted to ionic at the
internuclear distance of the crossing. Zewail’s NaI experiments provide a direct
experimental determination of the internuclear distance of the curve crossing and an
explicit illustration of Landau-Zener theory.

Figure 1: Pump/Probe Scheme for Photodissociation of ICN (Figure 1 of Ref. 24). This is a reduced
dimension representation of three singlet potential energy surfaces of ICN: the bound ground electronic state,
V0 with minimum at Re, an excited unbound state, V1, which dissociates to CN(X2Σ+) and I(2P3/2), and a higher
energy unbound state, which dissociates to CN(B2Σ+) and I(2P3/2). A t = 0 pulse from the pump laser, with center
wavelength λ1, excites a vertical turning-point-to-turning-point (P0 = 0, P1 = 0) transition at R = R0 > Re to the
V1 potential surface. The wavepacket on the V1 potential surface experiences a force in the increasing RI-CN
direction, which causes the PI-CN momentum to increase monotonically with time. At t = τ , a pulse from the
probe laser, with center wavelength probes for the arrival of the wavepacket at RI-CN = R? or R∞ . The
energy of the vertical (ΔR=0) and momentumconserving (ΔP=0) transition also increases monotonically with
time as the wavepacket travels outward on V1. This V2−V1 transition is essentially an excitation of the CN B−X
electronic transition in the presence of the departing I atom. The R= RI-CN = R? Optically Coupled Region (OCR)
is interrogated by a probe pulse with center wavelength , where is the wavelength of the free CN
B−X v0 = 0 − v00 = 0 band. The detected signal is CN B-X spontaneous fluorescence. Reproduced with permission
from Figure 1 in M. J. Rosker, M. Dantus, and A. H. Zewail, “Femtosecond real-time probing of reactions. I. The
technique,”
J. Chem. Phys. 89, 6113–6127 (1988). Copyright 1988, AIP Publishing LLC.
Internuclear Separation

Figure 2: Wavepacket Transit through an Ionic∼Covalent Potential Energy Curve Crossing in NaI
(Figure 1 of Ref. 26). The diabatic (solid lines) Na+,I− and Na,I potential energy curves cross at Rx = 6.93A.˚ The
avoided crossing between the adiabatic potential curves is shown as dashed lines. At t = t0 the 310 nm pump
pulse creates a wavepacket at the inner turning point of the covalent (Na 2S, I2P3/2) potential curve at
R≈Re(X1Σ+) and P= 0. By adjusting the center wavelength of the pump pulse, the center total-energy (electronic
plus vibrational) of the wavepacket can be adjusted between 30,000 and 34,000 cm−1 . The excitation energy
of the ionic∼covalent curve crossing is ∼ 26, 000 cm−1 . The wavepacket is accelerated outward, passes through
the curve-crossing region at t?, and bifurcates, one part traveling on the bound ionic potential and the other
part traveling irreversibly outward on the unbound covalent potential. The ionic part is reflected at tR at the
outer turning point of the ionic potential, passes with P< 0 through the R= 6.93 ˚A curve crossing region where
it bifurcates again, and the resultant ionic and covalent parts are reflected outward at the inner turning points
of the ionic and covalent potential curves, respectively. Each outward passage of a wavepacket through the
curve crossing region results in a wavepacket traveling irreversibly outward on the unbound covalent
potential, eventually forming free Na(2S) and I(2P3/2) atoms. The probe pulse (not shown) interrogates the
dynamics by exciting Na(2S),I(2P3/2) weakly-bound molecules to a higher energy repulsive electronic state that
dissociates to Na(2P) + I(2P3/2) atoms. Excitation at centerwavelength longer than 589 nm samples NaI
molecules en route to full dissociation. Excitation centered at 589 nm provides what is essentially a time-
integrated sample of the accumulation of the free Na(2S) atoms. Reproduced with permission from Figure 1 in
T. S. Rose, M. J. Rosker, and A. H. Zewail, “Femtosecond real-time observations of wave packet oscillations
(resonance) in dissociation reactions,” J. Chem. Phys. 88, 6672–6673 (1988). Copyright 1988, AIP Publishing
LLC.
0
4
R
x
= 6.93Å
COVALENT Na +I
IONIC Na
+
+I
–
t
0
t
*
t
R
R(Å)
10
15
0
2
5
0
5
10
15
20
25
30
35
Energy (10
3
cm
–1
)
FS
pump (
λ
)
FS
probe (t,
λ
)
Na I*
Na
[
…
I]
‡
*
Na
[
……
I]
‡
*
Na + I + E
tr

Figure 3: Clocking of the Photodissociation of NaI (and NaBr) as the Nuclear Wavepacket Repeatedly
Traverses the Ionic/Covalent Curve Crossing (Figure 2 of Ref. 26). The wavepacket, illustrated in Fig. 6.5, is
created at t = t0 at the inner turning point on the covalent excited electronic state. At each outward-bound
traversal of the curve-crossing region, part of the wavepacket follows the covalent adiabatic curve irreversibly
outward to separated Na(2S)+I(2P3/2) atoms. If the probe laser centerwavelength is tuned slightly to the red of
the 589 nm free Na atom 2P←2S transition, each time a wavepacket of incompletely separated Na,I molecules
passes through the Optically Coupled Region, some not quite free Na atoms are excited to the 2P state, from
which spontaneous fluorescence is detected. The series of Na atom fluorescence pulses shown in Spectrum I
samples each outward passage of a wavepacket through the curve-crossing region. The temporal spacing of
the pulses corresponds to a 36 cm−1 vibrational frequency. When the center-wavelength of the probe laser is
tuned to 589 nm, the arrivals of free Na atom wavepackets are displayed in Spectrum II as a periodic series of
upward steps. Spectrum III shows that the (upper) adiabatic potential curve for NaBr is shallower and “leakier”
than that for NaI. Reproduced with permission from Figure 2 in T. S. Rose, M. J. Rosker, and A. H. Zewail,
“Femtosecond real-time observations of wave packet oscillations (resonance) in dissociation reactions,” J.
Chem. Phys. 88, 6672–6673 (1988). Copyright 1988, AIP Publishing LLC.
Ahmed Zewail was awarded the 1999 Nobel Prize in Chemistry for “Femtosecond Transition
State (FTS) Spectroscopy.” These experiments were described as the first time that the
mechanisms of real intramolecular dynamics were ”clocked” in real time. In a pump/probe
scheme, a femtosecond pump pulse creates a wavepacket on a repulsive or predissociated
electronically excited V1 potential energy surface at t = 0 by excitation from the v = 0 level of
the electronic ground state, V0 (ability to tune center energy of wavepacket by a small
500
fs
∆t (fs)
III
II

amount). After each excitation pulse, the time-evolving wavepacket is probed by a
femtosecond pulse with a chosen center wavelength at a time-delay t = τ. This delay time is
scanned, pulse-by-pulse, to determine the time at which the center of the wavepacket
crosses through the “Optically Coupled Region (OCR).” The probe pulse excites a portion of
the wavepacket from the V1 potential surface to a higher energy repulsive potential surface,
V2. The V2 potential surface is repulsive, dissociating to an electronically excited fragment.
The detected signal is the time-integrated ∼ 10 nanosecond lifetime fluorescence from this
excited fragment. The dynamically relevant information is encoded in the intensity vs. τ of
this time-integrated fluorescence, which samples the femtosecond passage of the
wavepacket through the OCR that is selected by the center wavelength of the probe pulse.
The ICN photodissociation experiment shows the effect of the presence of the I atom on the
frequency of the CN B2Σ+ − X2Σ+ electronic transition. As the I atom moves away from the CN
molecule, the energy of the CN electronic excitation increases from its value in the ICN
molecule to that of the free CN molecule. Did we know this before doing the experiment? As
the ICN bond stretches, the electronic structure of the CN moiety changes. This is
mechanism!
The photodissociation of NaI is mediated by a covalent-to-ionic curve crossing. The diabatic
(crossing) potential energy curves (solid lines) are the ones for which the electronic
character does not change rapidly as the molecule traverses the internuclear distance of the
curve crossing. The adiabatic curves (dashed lines), which are what “clamped nuclei”
quantum chemical calculations generate, exhibit a rapid change of electronic character at
the internuclear distance of the avoided crossing. As the molecule moves through the curve-
crossing region, it must decide whether it is going to follow the diabatic or the adiabatic
potential. Landau-Zener theory tells us the velocity-dependence of the probability of
jumping across the energy gap between the ionic and the covalent adiabatic curves. If you
drive too fast, you will be unable to stay on the road on a sharp curve. The sharpness of the
curve is determined by the magnitude of the interaction matrix element between the
diabatic potential curves. A very gentle curvature is the signature of a very large interaction
matrix element. In the Zewail experiments, the velocity in the curve-crossing region can be
systematically slightly adjusted by the choice of the center wavelength of the pump pulse.
At an NaI energy far above that of the curve-crossing, the velocity in the crossing region is
very large and the molecule stays on one of the diabatic potentials, in effect jumping the gap
between adiabatic curves. At an energy near that of the curve crossing, the molecule would
go through the crossing region slowly and stay on one of the adiabatic curves, with the result
that the wave packet that is born covalent, is nearly 100% converted to ionic at the
internuclear distance of the crossing. Zewail’s NaI experiments provide a direct
experimental determination of the internuclear distance of the curve crossing and an
explicit illustration of Landau-Zener theory.

Figure 1: Pump/Probe Scheme for Photodissociation of ICN (Figure 1 of Ref. 24). This is a reduced
dimension representation of three singlet potential energy surfaces of ICN: the bound ground electronic state,
V0 with minimum at Re, an excited unbound state, V1, which dissociates to CN(X2Σ+) and I(2P3/2), and a higher
energy unbound state, which dissociates to CN(B2Σ+) and I(2P3/2). A t = 0 pulse from the pump laser, with center
wavelength λ1, excites a vertical turning-point-to-turning-point (P0 = 0, P1 = 0) transition at R = R0 > Re to the
V1 potential surface. The wavepacket on the V1 potential surface experiences a force in the increasing RI-CN
direction, which causes the PI-CN momentum to increase monotonically with time. At t = τ , a pulse from the
probe laser, with center wavelength probes for the arrival of the wavepacket at RI-CN = R? or R∞ . The
energy of the vertical (ΔR=0) and momentumconserving (ΔP=0) transition also increases monotonically with
time as the wavepacket travels outward on V1. This V2−V1 transition is essentially an excitation of the CN B−X
electronic transition in the presence of the departing I atom. The R= RI-CN = R? Optically Coupled Region (OCR)
is interrogated by a probe pulse with center wavelength , where is the wavelength of the free CN
B−X v0 = 0 − v00 = 0 band. The detected signal is CN B-X spontaneous fluorescence. Reproduced with permission
from Figure 1 in M. J. Rosker, M. Dantus, and A. H. Zewail, “Femtosecond real-time probing of reactions. I. The
technique,”
J. Chem. Phys. 89, 6113–6127 (1988). Copyright 1988, AIP Publishing LLC.
Internuclear Separation

Figure 2: Wavepacket Transit through an Ionic∼Covalent Potential Energy Curve Crossing in NaI
(Figure 1 of Ref. 26). The diabatic (solid lines) Na+,I− and Na,I potential energy curves cross at Rx = 6.93A.˚ The
avoided crossing between the adiabatic potential curves is shown as dashed lines. At t = t0 the 310 nm pump
pulse creates a wavepacket at the inner turning point of the covalent (Na 2S, I2P3/2) potential curve at
R≈Re(X1Σ+) and P= 0. By adjusting the center wavelength of the pump pulse, the center total-energy (electronic
plus vibrational) of the wavepacket can be adjusted between 30,000 and 34,000 cm−1 . The excitation energy
of the ionic∼covalent curve crossing is ∼ 26, 000 cm−1 . The wavepacket is accelerated outward, passes through
the curve-crossing region at t?, and bifurcates, one part traveling on the bound ionic potential and the other
part traveling irreversibly outward on the unbound covalent potential. The ionic part is reflected at tR at the
outer turning point of the ionic potential, passes with P< 0 through the R= 6.93 ˚A curve crossing region where
it bifurcates again, and the resultant ionic and covalent parts are reflected outward at the inner turning points
of the ionic and covalent potential curves, respectively. Each outward passage of a wavepacket through the
curve crossing region results in a wavepacket traveling irreversibly outward on the unbound covalent
potential, eventually forming free Na(2S) and I(2P3/2) atoms. The probe pulse (not shown) interrogates the
dynamics by exciting Na(2S),I(2P3/2) weakly-bound molecules to a higher energy repulsive electronic state that
dissociates to Na(2P) + I(2P3/2) atoms. Excitation at centerwavelength longer than 589 nm samples NaI
molecules en route to full dissociation. Excitation centered at 589 nm provides what is essentially a time-
integrated sample of the accumulation of the free Na(2S) atoms. Reproduced with permission from Figure 1 in
T. S. Rose, M. J. Rosker, and A. H. Zewail, “Femtosecond real-time observations of wave packet oscillations
(resonance) in dissociation reactions,” J. Chem. Phys. 88, 6672–6673 (1988). Copyright 1988, AIP Publishing
LLC.
0
4
R
x
= 6.93Å
COVALENT Na +I
IONIC Na
+
+I
–
t
0
t
*
t
R
R(Å)
10
15
0
2
5
0
5
10
15
20
25
30
35
Energy (10
3
cm
–1
)
FS
pump (
λ
)
FS
probe (t,
λ
)
Na I*
Na
[
…
I]
‡
*
Na
[
……
I]
‡
*
Na + I + E
tr

Figure 3: Clocking of the Photodissociation of NaI (and NaBr) as the Nuclear Wavepacket Repeatedly
Traverses the Ionic/Covalent Curve Crossing (Figure 2 of Ref. 26). The wavepacket, illustrated in Fig. 6.5, is
created at t = t0 at the inner turning point on the covalent excited electronic state. At each outward-bound
traversal of the curve-crossing region, part of the wavepacket follows the covalent adiabatic curve irreversibly
outward to separated Na(2S)+I(2P3/2) atoms. If the probe laser centerwavelength is tuned slightly to the red of
the 589 nm free Na atom 2P←2S transition, each time a wavepacket of incompletely separated Na,I molecules
passes through the Optically Coupled Region, some not quite free Na atoms are excited to the 2P state, from
which spontaneous fluorescence is detected. The series of Na atom fluorescence pulses shown in Spectrum I
samples each outward passage of a wavepacket through the curve-crossing region. The temporal spacing of
the pulses corresponds to a 36 cm−1 vibrational frequency. When the center-wavelength of the probe laser is
tuned to 589 nm, the arrivals of free Na atom wavepackets are displayed in Spectrum II as a periodic series of
upward steps. Spectrum III shows that the (upper) adiabatic potential curve for NaBr is shallower and “leakier”
than that for NaI. Reproduced with permission from Figure 2 in T. S. Rose, M. J. Rosker, and A. H. Zewail,
“Femtosecond real-time observations of wave packet oscillations (resonance) in dissociation reactions,” J.
Chem. Phys. 88, 6672–6673 (1988). Copyright 1988, AIP Publishing LLC.
Ahmed Zewail was awarded the 1999 Nobel Prize in Chemistry for “Femtosecond Transition
State (FTS) Spectroscopy.” These experiments were described as the first time that the
mechanisms of real intramolecular dynamics were ”clocked” in real time. In a pump/probe
scheme, a femtosecond pump pulse creates a wavepacket on a repulsive or predissociated
electronically excited V1 potential energy surface at t = 0 by excitation from the v = 0 level of
the electronic ground state, V0 (ability to tune center energy of wavepacket by a small
500
fs
∆t (fs)
III
II

amount). After each excitation pulse, the time-evolving wavepacket is probed by a
femtosecond pulse with a chosen center wavelength at a time-delay t = τ. This delay time is
scanned, pulse-by-pulse, to determine the time at which the center of the wavepacket
crosses through the “Optically Coupled Region (OCR).” The probe pulse excites a portion of
the wavepacket from the V1 potential surface to a higher energy repulsive potential surface,
V2. The V2 potential surface is repulsive, dissociating to an electronically excited fragment.
The detected signal is the time-integrated ∼ 10 nanosecond lifetime fluorescence from this
excited fragment. The dynamically relevant information is encoded in the intensity vs. τ of
this time-integrated fluorescence, which samples the femtosecond passage of the
wavepacket through the OCR that is selected by the center wavelength of the probe pulse.
The ICN photodissociation experiment shows the effect of the presence of the I atom on the
frequency of the CN B2Σ+ − X2Σ+ electronic transition. As the I atom moves away from the CN
molecule, the energy of the CN electronic excitation increases from its value in the ICN
molecule to that of the free CN molecule. Did we know this before doing the experiment? As
the ICN bond stretches, the electronic structure of the CN moiety changes. This is
mechanism!
The photodissociation of NaI is mediated by a covalent-to-ionic curve crossing. The diabatic
(crossing) potential energy curves (solid lines) are the ones for which the electronic
character does not change rapidly as the molecule traverses the internuclear distance of the
curve crossing. The adiabatic curves (dashed lines), which are what “clamped nuclei”
quantum chemical calculations generate, exhibit a rapid change of electronic character at
the internuclear distance of the avoided crossing. As the molecule moves through the curve-
crossing region, it must decide whether it is going to follow the diabatic or the adiabatic
potential. Landau-Zener theory tells us the velocity-dependence of the probability of
jumping across the energy gap between the ionic and the covalent adiabatic curves. If you
drive too fast, you will be unable to stay on the road on a sharp curve. The sharpness of the
curve is determined by the magnitude of the interaction matrix element between the
diabatic potential curves. A very gentle curvature is the signature of a very large interaction
matrix element. In the Zewail experiments, the velocity in the curve-crossing region can be
systematically slightly adjusted by the choice of the center wavelength of the pump pulse.
At an NaI energy far above that of the curve-crossing, the velocity in the crossing region is
very large and the molecule stays on one of the diabatic potentials, in effect jumping the gap
between adiabatic curves. At an energy near that of the curve crossing, the molecule would
go through the crossing region slowly and stay on one of the adiabatic curves, with the result
that the wave packet that is born covalent, is nearly 100% converted to ionic at the
internuclear distance of the crossing. Zewail’s NaI experiments provide a direct
experimental determination of the internuclear distance of the curve crossing and an
explicit illustration of Landau-Zener theory.

Figure 1: Pump/Probe Scheme for Photodissociation of ICN (Figure 1 of Ref. 24). This is a reduced
dimension representation of three singlet potential energy surfaces of ICN: the bound ground electronic state,
V0 with minimum at Re, an excited unbound state, V1, which dissociates to CN(X2Σ+) and I(2P3/2), and a higher
energy unbound state, which dissociates to CN(B2Σ+) and I(2P3/2). A t = 0 pulse from the pump laser, with center
wavelength λ1, excites a vertical turning-point-to-turning-point (P0 = 0, P1 = 0) transition at R = R0 > Re to the
V1 potential surface. The wavepacket on the V1 potential surface experiences a force in the increasing RI-CN
direction, which causes the PI-CN momentum to increase monotonically with time. At t = τ , a pulse from the
probe laser, with center wavelength probes for the arrival of the wavepacket at RI-CN = R? or R∞ . The
energy of the vertical (ΔR=0) and momentumconserving (ΔP=0) transition also increases monotonically with
time as the wavepacket travels outward on V1. This V2−V1 transition is essentially an excitation of the CN B−X
electronic transition in the presence of the departing I atom. The R= RI-CN = R? Optically Coupled Region (OCR)
is interrogated by a probe pulse with center wavelength , where is the wavelength of the free CN
B−X v0 = 0 − v00 = 0 band. The detected signal is CN B-X spontaneous fluorescence. Reproduced with permission
from Figure 1 in M. J. Rosker, M. Dantus, and A. H. Zewail, “Femtosecond real-time probing of reactions. I. The
technique,”
J. Chem. Phys. 89, 6113–6127 (1988). Copyright 1988, AIP Publishing LLC.
Internuclear Separation

Figure 2: Wavepacket Transit through an Ionic∼Covalent Potential Energy Curve Crossing in NaI
(Figure 1 of Ref. 26). The diabatic (solid lines) Na+,I− and Na,I potential energy curves cross at Rx = 6.93A.˚ The
avoided crossing between the adiabatic potential curves is shown as dashed lines. At t = t0 the 310 nm pump
pulse creates a wavepacket at the inner turning point of the covalent (Na 2S, I2P3/2) potential curve at
R≈Re(X1Σ+) and P= 0. By adjusting the center wavelength of the pump pulse, the center total-energy (electronic
plus vibrational) of the wavepacket can be adjusted between 30,000 and 34,000 cm−1 . The excitation energy
of the ionic∼covalent curve crossing is ∼ 26, 000 cm−1 . The wavepacket is accelerated outward, passes through
the curve-crossing region at t?, and bifurcates, one part traveling on the bound ionic potential and the other
part traveling irreversibly outward on the unbound covalent potential. The ionic part is reflected at tR at the
outer turning point of the ionic potential, passes with P< 0 through the R= 6.93 ˚A curve crossing region where
it bifurcates again, and the resultant ionic and covalent parts are reflected outward at the inner turning points
of the ionic and covalent potential curves, respectively. Each outward passage of a wavepacket through the
curve crossing region results in a wavepacket traveling irreversibly outward on the unbound covalent
potential, eventually forming free Na(2S) and I(2P3/2) atoms. The probe pulse (not shown) interrogates the
dynamics by exciting Na(2S),I(2P3/2) weakly-bound molecules to a higher energy repulsive electronic state that
dissociates to Na(2P) + I(2P3/2) atoms. Excitation at centerwavelength longer than 589 nm samples NaI
molecules en route to full dissociation. Excitation centered at 589 nm provides what is essentially a time-
integrated sample of the accumulation of the free Na(2S) atoms. Reproduced with permission from Figure 1 in
T. S. Rose, M. J. Rosker, and A. H. Zewail, “Femtosecond real-time observations of wave packet oscillations
(resonance) in dissociation reactions,” J. Chem. Phys. 88, 6672–6673 (1988). Copyright 1988, AIP Publishing
LLC.
0
4
R
x
= 6.93Å
COVALENT Na +I
IONIC Na
+
+I
–
t
0
t
*
t
R
R(Å)
10
15
0
2
5
0
5
10
15
20
25
30
35
Energy (10
3
cm
–1
)
FS
pump (
λ
)
FS
probe (t,
λ
)
Na I*
Na
[
…
I]
‡
*
Na
[
……
I]
‡
*
Na + I + E
tr

Figure 3: Clocking of the Photodissociation of NaI (and NaBr) as the Nuclear Wavepacket Repeatedly
Traverses the Ionic/Covalent Curve Crossing (Figure 2 of Ref. 26). The wavepacket, illustrated in Fig. 6.5, is
created at t = t0 at the inner turning point on the covalent excited electronic state. At each outward-bound
traversal of the curve-crossing region, part of the wavepacket follows the covalent adiabatic curve irreversibly
outward to separated Na(2S)+I(2P3/2) atoms. If the probe laser centerwavelength is tuned slightly to the red of
the 589 nm free Na atom 2P←2S transition, each time a wavepacket of incompletely separated Na,I molecules
passes through the Optically Coupled Region, some not quite free Na atoms are excited to the 2P state, from
which spontaneous fluorescence is detected. The series of Na atom fluorescence pulses shown in Spectrum I
samples each outward passage of a wavepacket through the curve-crossing region. The temporal spacing of
the pulses corresponds to a 36 cm−1 vibrational frequency. When the center-wavelength of the probe laser is
tuned to 589 nm, the arrivals of free Na atom wavepackets are displayed in Spectrum II as a periodic series of
upward steps. Spectrum III shows that the (upper) adiabatic potential curve for NaBr is shallower and “leakier”
than that for NaI. Reproduced with permission from Figure 2 in T. S. Rose, M. J. Rosker, and A. H. Zewail,
“Femtosecond real-time observations of wave packet oscillations (resonance) in dissociation reactions,” J.
Chem. Phys. 88, 6672–6673 (1988). Copyright 1988, AIP Publishing LLC. Ahmed Zewail was awarded the
1999 Nobel Prize in Chemistry for “Femtosecond Transition State (FTS) Spectroscopy.”
These experiments were described as the first time that the mechanisms of real
intramolecular dynamics were ”clocked” in real time. In a pump/probe scheme, a
femtosecond pump pulse creates a wavepacket on a repulsive or predissociated
electronically excited V1 potential energy surface at t = 0 by excitation from the v = 0 level of
the electronic ground state, V0 (ability to tune center energy of wavepacket by a small
500
fs
∆t (fs)
III
II

amount). After each excitation pulse, the time-evolving wavepacket is probed by a
femtosecond pulse with a chosen center wavelength at a time-delay t = τ. This delay time is
scanned, pulse-by-pulse, to determine the time at which the center of the wavepacket
crosses through the “Optically Coupled Region (OCR).” The probe pulse excites a portion of
the wavepacket from the V1 potential surface to a higher energy repulsive potential surface,
V2. The V2 potential surface is repulsive, dissociating to an electronically excited fragment.
The detected signal is the time-integrated ∼ 10 nanosecond lifetime fluorescence from this
excited fragment. The dynamically relevant information is encoded in the intensity vs. τ of
this time-integrated fluorescence, which samples the femtosecond passage of the
wavepacket through the OCR that is selected by the center wavelength of the probe pulse.
The ICN photodissociation experiment shows the effect of the presence of the I atom on the
frequency of the CN B2Σ+ − X2Σ+ electronic transition. As the I atom moves away from the CN
molecule, the energy of the CN electronic excitation increases from its value in the ICN
molecule to that of the free CN molecule. Did we know this before doing the experiment? As
the ICN bond stretches, the electronic structure of the CN moiety changes. This is
mechanism!
The photodissociation of NaI is mediated by a covalent-to-ionic curve crossing. The diabatic
(crossing) potential energy curves (solid lines) are the ones for which the electronic
character does not change rapidly as the molecule traverses the internuclear distance of the
curve crossing. The adiabatic curves (dashed lines), which are what “clamped nuclei”
quantum chemical calculations generate, exhibit a rapid change of electronic character at
the internuclear distance of the avoided crossing. As the molecule moves through the curve-
crossing region, it must decide whether it is going to follow the diabatic or the adiabatic
potential. Landau-Zener theory tells us the velocity-dependence of the probability of
jumping across the energy gap between the ionic and the covalent adiabatic curves. If you
drive too fast, you will be unable to stay on the road on a sharp curve. The sharpness of the
curve is determined by the magnitude of the interaction matrix element between the
diabatic potential curves. A very gentle curvature is the signature of a very large interaction
matrix element. In the Zewail experiments, the velocity in the curve-crossing region can be
systematically slightly adjusted by the choice of the center wavelength of the pump pulse.
At an NaI energy far above that of the curve-crossing, the velocity in the crossing region is
very large and the molecule stays on one of the diabatic potentials, in effect jumping the gap
between adiabatic curves. At an energy near that of the curve crossing, the molecule would
go through the crossing region slowly and stay on one of the adiabatic curves, with the result
that the wave packet that is born covalent, is nearly 100% converted to ionic at the
internuclear distance of the crossing. Zewail’s NaI experiments provide a direct
experimental determination of the internuclear distance of the curve crossing and an
explicit illustration of Landau-Zener theory.

Figure 1: Pump/Probe Scheme for Photodissociation of ICN (Figure 1 of Ref. 24). This is a reduced
dimension representation of three singlet potential energy surfaces of ICN: the bound ground electronic state,
V0 with minimum at Re, an excited unbound state, V1, which dissociates to CN(X2Σ+) and I(2P3/2), and a higher
energy unbound state, which dissociates to CN(B2Σ+) and I(2P3/2). A t = 0 pulse from the pump laser, with center
wavelength λ1, excites a vertical turning-point-to-turning-point (P0 = 0, P1 = 0) transition at R = R0 > Re to the
V1 potential surface. The wavepacket on the V1 potential surface experiences a force in the increasing RI-CN
direction, which causes the PI-CN momentum to increase monotonically with time. At t = τ , a pulse from the
probe laser, with center wavelength probes for the arrival of the wavepacket at RI-CN = R? or R∞ . The
energy of the vertical (ΔR=0) and momentumconserving (ΔP=0) transition also increases monotonically with
time as the wavepacket travels outward on V1. This V2−V1 transition is essentially an excitation of the CN B−X
electronic transition in the presence of the departing I atom. The R= RI-CN = R? Optically Coupled Region (OCR)
is interrogated by a probe pulse with center wavelength , where is the wavelength of the free CN
B−X v0 = 0 − v00 = 0 band. The detected signal is CN B-X spontaneous fluorescence. Reproduced with permission
from Figure 1 in M. J. Rosker, M. Dantus, and A. H. Zewail, “Femtosecond real-time probing of reactions. I. The
technique,”
J. Chem. Phys. 89, 6113–6127 (1988). Copyright 1988, AIP Publishing LLC.
Internuclear Separation

Figure 2: Wavepacket Transit through an Ionic∼Covalent Potential Energy Curve Crossing in NaI
(Figure 1 of Ref. 26). The diabatic (solid lines) Na+,I− and Na,I potential energy curves cross at Rx = 6.93A.˚ The
avoided crossing between the adiabatic potential curves is shown as dashed lines. At t = t0 the 310 nm pump
pulse creates a wavepacket at the inner turning point of the covalent (Na 2S, I2P3/2) potential curve at
R≈Re(X1Σ+) and P= 0. By adjusting the center wavelength of the pump pulse, the center total-energy (electronic
plus vibrational) of the wavepacket can be adjusted between 30,000 and 34,000 cm−1 . The excitation energy
of the ionic∼covalent curve crossing is ∼ 26, 000 cm−1 . The wavepacket is accelerated outward, passes through
the curve-crossing region at t?, and bifurcates, one part traveling on the bound ionic potential and the other
part traveling irreversibly outward on the unbound covalent potential. The ionic part is reflected at tR at the
outer turning point of the ionic potential, passes with P< 0 through the R= 6.93 ˚A curve crossing region where
it bifurcates again, and the resultant ionic and covalent parts are reflected outward at the inner turning points
of the ionic and covalent potential curves, respectively. Each outward passage of a wavepacket through the
curve crossing region results in a wavepacket traveling irreversibly outward on the unbound covalent
potential, eventually forming free Na(2S) and I(2P3/2) atoms. The probe pulse (not shown) interrogates the
dynamics by exciting Na(2S),I(2P3/2) weakly-bound molecules to a higher energy repulsive electronic state that
dissociates to Na(2P) + I(2P3/2) atoms. Excitation at centerwavelength longer than 589 nm samples NaI
molecules en route to full dissociation. Excitation centered at 589 nm provides what is essentially a time-
integrated sample of the accumulation of the free Na(2S) atoms. Reproduced with permission from Figure 1 in
T. S. Rose, M. J. Rosker, and A. H. Zewail, “Femtosecond real-time observations of wave packet oscillations
(resonance) in dissociation reactions,” J. Chem. Phys. 88, 6672–6673 (1988). Copyright 1988, AIP Publishing
LLC.
0
4
R
x
= 6.93Å
COVALENT Na +I
IONIC Na
+
+I
–
t
0
t
*
t
R
R(Å)
10
15
0
2
5
0
5
10
15
20
25
30
35
Energy (10
3
cm
–1
)
FS
pump (
λ
)
FS
probe (t,
λ
)
Na I*
Na
[
…
I]
‡
*
Na
[
……
I]
‡
*
Na + I + E
tr

Figure 3: Clocking of the Photodissociation of NaI (and NaBr) as the Nuclear Wavepacket Repeatedly
Traverses the Ionic/Covalent Curve Crossing (Figure 2 of Ref. 26). The wavepacket, illustrated in Fig. 6.5, is
created at t = t0 at the inner turning point on the covalent excited electronic state. At each outward-bound
traversal of the curve-crossing region, part of the wavepacket follows the covalent adiabatic curve irreversibly
outward to separated Na(2S)+I(2P3/2) atoms. If the probe laser centerwavelength is tuned slightly to the red of
the 589 nm free Na atom 2P←2S transition, each time a wavepacket of incompletely separated Na,I molecules
passes through the Optically Coupled Region, some not quite free Na atoms are excited to the 2P state, from
which spontaneous fluorescence is detected. The series of Na atom fluorescence pulses shown in Spectrum I
samples each outward passage of a wavepacket through the curve-crossing region. The temporal spacing of
the pulses corresponds to a 36 cm−1 vibrational frequency. When the center-wavelength of the probe laser is
tuned to 589 nm, the arrivals of free Na atom wavepackets are displayed in Spectrum II as a periodic series of
upward steps. Spectrum III shows that the (upper) adiabatic potential curve for NaBr is shallower and “leakier”
than that for NaI. Reproduced with permission from Figure 2 in T. S. Rose, M. J. Rosker, and A. H. Zewail,
“Femtosecond real-time observations of wave packet oscillations (resonance) in dissociation reactions,” J.
Chem. Phys. 88, 6672–6673 (1988). Copyright 1988, AIP Publishing LLC.
Ahmed Zewail was awarded the 1999 Nobel Prize in Chemistry for “Femtosecond Transition
State (FTS) Spectroscopy.” These experiments were described as the first time that the
mechanisms of real intramolecular dynamics were ”clocked” in real time. In a pump/probe
scheme, a femtosecond pump pulse creates a wavepacket on a repulsive or predissociated
electronically excited V1 potential energy surface at t = 0 by excitation from the v = 0 level of
the electronic ground state, V0 (ability to tune center energy of wavepacket by a small
500
fs
∆t (fs)
III
II

amount). After each excitation pulse, the time-evolving wavepacket is probed by a
femtosecond pulse with a chosen center wavelength at a time-delay t = τ. This delay time is
scanned, pulse-by-pulse, to determine the time at which the center of the wavepacket
crosses through the “Optically Coupled Region (OCR).” The probe pulse excites a portion of
the wavepacket from the V1 potential surface to a higher energy repulsive potential surface,
V2. The V2 potential surface is repulsive, dissociating to an electronically excited fragment.
The detected signal is the time-integrated ∼ 10 nanosecond lifetime fluorescence from this
excited fragment. The dynamically relevant information is encoded in the intensity vs. τ of
this time-integrated fluorescence, which samples the femtosecond passage of the
wavepacket through the OCR that is selected by the center wavelength of the probe pulse.
The ICN photodissociation experiment shows the effect of the presence of the I atom on the
frequency of the CN B2Σ+ − X2Σ+ electronic transition. As the I atom moves away from the CN
molecule, the energy of the CN electronic excitation increases from its value in the ICN
molecule to that of the free CN molecule. Did we know this before doing the experiment? As
the ICN bond stretches, the electronic structure of the CN moiety changes. This is
mechanism!
The photodissociation of NaI is mediated by a covalent-to-ionic curve crossing. The diabatic
(crossing) potential energy curves (solid lines) are the ones for which the electronic
character does not change rapidly as the molecule traverses the internuclear distance of the
curve crossing. The adiabatic curves (dashed lines), which are what “clamped nuclei”
quantum chemical calculations generate, exhibit a rapid change of electronic character at
the internuclear distance of the avoided crossing. As the molecule moves through the curve-
crossing region, it must decide whether it is going to follow the diabatic or the adiabatic
potential. Landau-Zener theory tells us the velocity-dependence of the probability of
jumping across the energy gap between the ionic and the covalent adiabatic curves. If you
drive too fast, you will be unable to stay on the road on a sharp curve. The sharpness of the
curve is determined by the magnitude of the interaction matrix element between the
diabatic potential curves. A very gentle curvature is the signature of a very large interaction
matrix element. In the Zewail experiments, the velocity in the curve-crossing region can be
systematically slightly adjusted by the choice of the center wavelength of the pump pulse.
At an NaI energy far above that of the curve-crossing, the velocity in the crossing region is
very large and the molecule stays on one of the diabatic potentials, in effect jumping the gap
between adiabatic curves. At an energy near that of the curve crossing, the molecule would
go through the crossing region slowly and stay on one of the adiabatic curves, with the result
that the wave packet that is born covalent, is nearly 100% converted to ionic at the
internuclear distance of the crossing. Zewail’s NaI experiments provide a direct
experimental determination of the internuclear distance of the curve crossing and an
explicit illustration of Landau-Zener theory.

Figure 1: Pump/Probe Scheme for Photodissociation of ICN (Figure 1 of Ref. 24). This is a reduced
dimension representation of three singlet potential energy surfaces of ICN: the bound ground electronic state,
V0 with minimum at Re, an excited unbound state, V1, which dissociates to CN(X2Σ+) and I(2P3/2), and a higher
energy unbound state, which dissociates to CN(B2Σ+) and I(2P3/2). A t = 0 pulse from the pump laser, with center
wavelength λ1, excites a vertical turning-point-to-turning-point (P0 = 0, P1 = 0) transition at R = R0 > Re to the
V1 potential surface. The wavepacket on the V1 potential surface experiences a force in the increasing RI-CN
direction, which causes the PI-CN momentum to increase monotonically with time. At t = τ , a pulse from the
probe laser, with center wavelength probes for the arrival of the wavepacket at RI-CN = R? or R∞ . The
energy of the vertical (ΔR=0) and momentumconserving (ΔP=0) transition also increases monotonically with
time as the wavepacket travels outward on V1. This V2−V1 transition is essentially an excitation of the CN B−X
electronic transition in the presence of the departing I atom. The R= RI-CN = R? Optically Coupled Region (OCR)
is interrogated by a probe pulse with center wavelength , where is the wavelength of the free CN
B−X v0 = 0 − v00 = 0 band. The detected signal is CN B-X spontaneous fluorescence. Reproduced with permission
from Figure 1 in M. J. Rosker, M. Dantus, and A. H. Zewail, “Femtosecond real-time probing of reactions. I. The
technique,”
J. Chem. Phys. 89, 6113–6127 (1988). Copyright 1988, AIP Publishing LLC.
Internuclear Separation

Figure 2: Wavepacket Transit through an Ionic∼Covalent Potential Energy Curve Crossing in NaI
(Figure 1 of Ref. 26). The diabatic (solid lines) Na+,I− and Na,I potential energy curves cross at Rx = 6.93A.˚ The
avoided crossing between the adiabatic potential curves is shown as dashed lines. At t = t0 the 310 nm pump
pulse creates a wavepacket at the inner turning point of the covalent (Na 2S, I2P3/2) potential curve at
R≈Re(X1Σ+) and P= 0. By adjusting the center wavelength of the pump pulse, the center total-energy (electronic
plus vibrational) of the wavepacket can be adjusted between 30,000 and 34,000 cm−1 . The excitation energy
of the ionic∼covalent curve crossing is ∼ 26, 000 cm−1 . The wavepacket is accelerated outward, passes through
the curve-crossing region at t?, and bifurcates, one part traveling on the bound ionic potential and the other
part traveling irreversibly outward on the unbound covalent potential. The ionic part is reflected at tR at the
outer turning point of the ionic potential, passes with P< 0 through the R= 6.93 ˚A curve crossing region where
it bifurcates again, and the resultant ionic and covalent parts are reflected outward at the inner turning points
of the ionic and covalent potential curves, respectively. Each outward passage of a wavepacket through the
curve crossing region results in a wavepacket traveling irreversibly outward on the unbound covalent
potential, eventually forming free Na(2S) and I(2P3/2) atoms. The probe pulse (not shown) interrogates the
dynamics by exciting Na(2S),I(2P3/2) weakly-bound molecules to a higher energy repulsive electronic state that
dissociates to Na(2P) + I(2P3/2) atoms. Excitation at centerwavelength longer than 589 nm samples NaI
molecules en route to full dissociation. Excitation centered at 589 nm provides what is essentially a time-
integrated sample of the accumulation of the free Na(2S) atoms. Reproduced with permission from Figure 1 in
T. S. Rose, M. J. Rosker, and A. H. Zewail, “Femtosecond real-time observations of wave packet oscillations
(resonance) in dissociation reactions,” J. Chem. Phys. 88, 6672–6673 (1988). Copyright 1988, AIP Publishing
LLC.
0
4
R
x
= 6.93Å
COVALENT Na +I
IONIC Na
+
+I
–
t
0
t
*
t
R
R(Å)
10
15
0
2
5
0
5
10
15
20
25
30
35
Energy (10
3
cm
–1
)
FS
pump (
λ
)
FS
probe (t,
λ
)
Na I*
Na
[
…
I]
‡
*
Na
[
……
I]
‡
*
Na + I + E
tr

Figure 3: Clocking of the Photodissociation of NaI (and NaBr) as the Nuclear Wavepacket Repeatedly
Traverses the Ionic/Covalent Curve Crossing (Figure 2 of Ref. 26). The wavepacket, illustrated in Fig. 6.5, is
created at t = t0 at the inner turning point on the covalent excited electronic state. At each outward-bound
traversal of the curve-crossing region, part of the wavepacket follows the covalent adiabatic curve irreversibly
outward to separated Na(2S)+I(2P3/2) atoms. If the probe laser centerwavelength is tuned slightly to the red of
the 589 nm free Na atom 2P←2S transition, each time a wavepacket of incompletely separated Na,I molecules
passes through the Optically Coupled Region, some not quite free Na atoms are excited to the 2P state, from
which spontaneous fluorescence is detected. The series of Na atom fluorescence pulses shown in Spectrum I
samples each outward passage of a wavepacket through the curve-crossing region. The temporal spacing of
the pulses corresponds to a 36 cm−1 vibrational frequency. When the center-wavelength of the probe laser is
tuned to 589 nm, the arrivals of free Na atom wavepackets are displayed in Spectrum II as a periodic series of
upward steps. Spectrum III shows that the (upper) adiabatic potential curve for NaBr is shallower and “leakier”
than that for NaI. Reproduced with permission from Figure 2 in T. S. Rose, M. J. Rosker, and A. H. Zewail,
“Femtosecond real-time observations of wave packet oscillations (resonance) in dissociation reactions,” J.
Chem. Phys. 88, 6672–6673 (1988). Copyright 1988, AIP Publishing LLC.
Ahmed Zewail was awarded the 1999 Nobel Prize in Chemistry for “Femtosecond Transition
State (FTS) Spectroscopy.” These experiments were described as the first time that the
mechanisms of real intramolecular dynamics were ”clocked” in real time. In a pump/probe
scheme, a femtosecond pump pulse creates a wavepacket on a repulsive or predissociated
electronically excited V1 potential energy surface at t = 0 by excitation from the v = 0 level of
the electronic ground state, V0 (ability to tune center energy of wavepacket by a small
500
fs
∆t (fs)
III
II

amount). After each excitation pulse, the time-evolving wavepacket is probed by a
femtosecond pulse with a chosen center wavelength at a time-delay t = τ. This delay time is
scanned, pulse-by-pulse, to determine the time at which the center of the wavepacket
crosses through the “Optically Coupled Region (OCR).” The probe pulse excites a portion of
the wavepacket from the V1 potential surface to a higher energy repulsive potential surface,
V2. The V2 potential surface is repulsive, dissociating to an electronically excited fragment.
The detected signal is the time-integrated ∼ 10 nanosecond lifetime fluorescence from this
excited fragment. The dynamically relevant information is encoded in the intensity vs. τ of
this time-integrated fluorescence, which samples the femtosecond passage of the
wavepacket through the OCR that is selected by the center wavelength of the probe pulse.
The ICN photodissociation experiment shows the effect of the presence of the I atom on the
frequency of the CN B2Σ+ − X2Σ+ electronic transition. As the I atom moves away from the CN
molecule, the energy of the CN electronic excitation increases from its value in the ICN
molecule to that of the free CN molecule. Did we know this before doing the experiment? As
the ICN bond stretches, the electronic structure of the CN moiety changes. This is
mechanism!
The photodissociation of NaI is mediated by a covalent-to-ionic curve crossing. The diabatic
(crossing) potential energy curves (solid lines) are the ones for which the electronic
character does not change rapidly as the molecule traverses the internuclear distance of the
curve crossing. The adiabatic curves (dashed lines), which are what “clamped nuclei”
quantum chemical calculations generate, exhibit a rapid change of electronic character at
the internuclear distance of the avoided crossing. As the molecule moves through the curve-
crossing region, it must decide whether it is going to follow the diabatic or the adiabatic
potential. Landau-Zener theory tells us the velocity-dependence of the probability of
jumping across the energy gap between the ionic and the covalent adiabatic curves. If you
drive too fast, you will be unable to stay on the road on a sharp curve. The sharpness of the
curve is determined by the magnitude of the interaction matrix element between the
diabatic potential curves. A very gentle curvature is the signature of a very large interaction
matrix element. In the Zewail experiments, the velocity in the curve-crossing region can be
systematically slightly adjusted by the choice of the center wavelength of the pump pulse.
At an NaI energy far above that of the curve-crossing, the velocity in the crossing region is
very large and the molecule stays on one of the diabatic potentials, in effect jumping the gap
between adiabatic curves. At an energy near that of the curve crossing, the molecule would
go through the crossing region slowly and stay on one of the adiabatic curves, with the result
that the wave packet that is born covalent, is nearly 100% converted to ionic at the
internuclear distance of the crossing. Zewail’s NaI experiments provide a direct
experimental determination of the internuclear distance of the curve crossing and an
explicit illustration of Landau-Zener theory.

Figure 1: Pump/Probe Scheme for Photodissociation of ICN (Figure 1 of Ref. 24). This is a reduced
dimension representation of three singlet potential energy surfaces of ICN: the bound ground electronic state,
V0 with minimum at Re, an excited unbound state, V1, which dissociates to CN(X2Σ+) and I(2P3/2), and a higher
energy unbound state, which dissociates to CN(B2Σ+) and I(2P3/2). A t = 0 pulse from the pump laser, with center
wavelength λ1, excites a vertical turning-point-to-turning-point (P0 = 0, P1 = 0) transition at R = R0 > Re to the
V1 potential surface. The wavepacket on the V1 potential surface experiences a force in the increasing RI-CN
direction, which causes the PI-CN momentum to increase monotonically with time. At t = τ , a pulse from the
probe laser, with center wavelength probes for the arrival of the wavepacket at RI-CN = R? or R∞ . The
energy of the vertical (ΔR=0) and momentumconserving (ΔP=0) transition also increases monotonically with
time as the wavepacket travels outward on V1. This V2−V1 transition is essentially an excitation of the CN B−X
electronic transition in the presence of the departing I atom. The R= RI-CN = R? Optically Coupled Region (OCR)
is interrogated by a probe pulse with center wavelength , where is the wavelength of the free CN
B−X v0 = 0 − v00 = 0 band. The detected signal is CN B-X spontaneous fluorescence. Reproduced with permission
from Figure 1 in M. J. Rosker, M. Dantus, and A. H. Zewail, “Femtosecond real-time probing of reactions. I. The
technique,”
J. Chem. Phys. 89, 6113–6127 (1988). Copyright 1988, AIP Publishing LLC.
Internuclear Separation

Figure 2: Wavepacket Transit through an Ionic∼Covalent Potential Energy Curve Crossing in NaI
(Figure 1 of Ref. 26). The diabatic (solid lines) Na+,I− and Na,I potential energy curves cross at Rx = 6.93A.˚ The
avoided crossing between the adiabatic potential curves is shown as dashed lines. At t = t0 the 310 nm pump
pulse creates a wavepacket at the inner turning point of the covalent (Na 2S, I2P3/2) potential curve at
R≈Re(X1Σ+) and P= 0. By adjusting the center wavelength of the pump pulse, the center total-energy (electronic
plus vibrational) of the wavepacket can be adjusted between 30,000 and 34,000 cm−1 . The excitation energy
of the ionic∼covalent curve crossing is ∼ 26, 000 cm−1 . The wavepacket is accelerated outward, passes through
the curve-crossing region at t?, and bifurcates, one part traveling on the bound ionic potential and the other
part traveling irreversibly outward on the unbound covalent potential. The ionic part is reflected at tR at the
outer turning point of the ionic potential, passes with P< 0 through the R= 6.93 ˚A curve crossing region where
it bifurcates again, and the resultant ionic and covalent parts are reflected outward at the inner turning points
of the ionic and covalent potential curves, respectively. Each outward passage of a wavepacket through the
curve crossing region results in a wavepacket traveling irreversibly outward on the unbound covalent
potential, eventually forming free Na(2S) and I(2P3/2) atoms. The probe pulse (not shown) interrogates the
dynamics by exciting Na(2S),I(2P3/2) weakly-bound molecules to a higher energy repulsive electronic state that
dissociates to Na(2P) + I(2P3/2) atoms. Excitation at centerwavelength longer than 589 nm samples NaI
molecules en route to full dissociation. Excitation centered at 589 nm provides what is essentially a time-
integrated sample of the accumulation of the free Na(2S) atoms. Reproduced with permission from Figure 1 in
T. S. Rose, M. J. Rosker, and A. H. Zewail, “Femtosecond real-time observations of wave packet oscillations
(resonance) in dissociation reactions,” J. Chem. Phys. 88, 6672–6673 (1988). Copyright 1988, AIP Publishing
LLC.
0
4
R
x
= 6.93Å
COVALENT Na +I
IONIC Na
+
+I
–
t
0
t
*
t
R
R(Å)
10
15
0
2
5
0
5
10
15
20
25
30
35
Energy (10
3
cm
–1
)
FS
pump (
λ
)
FS
probe (t,
λ
)
Na I*
Na
[
…
I]
‡
*
Na
[
……
I]
‡
*
Na + I + E
tr

Figure 3: Clocking of the Photodissociation of NaI (and NaBr) as the Nuclear Wavepacket Repeatedly
Traverses the Ionic/Covalent Curve Crossing (Figure 2 of Ref. 26). The wavepacket, illustrated in Fig. 6.5, is
created at t = t0 at the inner turning point on the covalent excited electronic state. At each outward-bound
traversal of the curve-crossing region, part of the wavepacket follows the covalent adiabatic curve irreversibly
outward to separated Na(2S)+I(2P3/2) atoms. If the probe laser centerwavelength is tuned slightly to the red of
the 589 nm free Na atom 2P←2S transition, each time a wavepacket of incompletely separated Na,I molecules
passes through the Optically Coupled Region, some not quite free Na atoms are excited to the 2P state, from
which spontaneous fluorescence is detected. The series of Na atom fluorescence pulses shown in Spectrum I
samples each outward passage of a wavepacket through the curve-crossing region. The temporal spacing of
the pulses corresponds to a 36 cm−1 vibrational frequency. When the center-wavelength of the probe laser is
tuned to 589 nm, the arrivals of free Na atom wavepackets are displayed in Spectrum II as a periodic series of
upward steps. Spectrum III shows that the (upper) adiabatic potential curve for NaBr is shallower and “leakier”
than that for NaI. Reproduced with permission from Figure 2 in T. S. Rose, M. J. Rosker, and A. H. Zewail,
“Femtosecond real-time observations of wave packet oscillations (resonance) in dissociation reactions,” J.
Chem. Phys. 88, 6672–6673 (1988). Copyright 1988, AIP Publishing LLC.
Ahmed Zewail was awarded the 1999 Nobel Prize in Chemistry for “Femtosecond Transition
State (FTS) Spectroscopy.” These experiments were described as the first time that the
mechanisms of real intramolecular dynamics were ”clocked” in real time. In a pump/probe
scheme, a femtosecond pump pulse creates a wavepacket on a repulsive or predissociated
electronically excited V1 potential energy surface at t = 0 by excitation from the v = 0 level of
the electronic ground state, V0 (ability to tune center energy of wavepacket by a small
500
fs
∆t (fs)
III
II

amount). After each excitation pulse, the time-evolving wavepacket is probed by a
femtosecond pulse with a chosen center wavelength at a time-delay t = τ. This delay time is
scanned, pulse-by-pulse, to determine the time at which the center of the wavepacket
crosses through the “Optically Coupled Region (OCR).” The probe pulse excites a portion of
the wavepacket from the V1 potential surface to a higher energy repulsive potential surface,
V2. The V2 potential surface is repulsive, dissociating to an electronically excited fragment.
The detected signal is the time-integrated ∼ 10 nanosecond lifetime fluorescence from this
excited fragment. The dynamically relevant information is encoded in the intensity vs. τ of
this time-integrated fluorescence, which samples the femtosecond passage of the
wavepacket through the OCR that is selected by the center wavelength of the probe pulse.
The ICN photodissociation experiment shows the effect of the presence of the I atom on the
frequency of the CN B2Σ+ − X2Σ+ electronic transition. As the I atom moves away from the CN
molecule, the energy of the CN electronic excitation increases from its value in the ICN
molecule to that of the free CN molecule. Did we know this before doing the experiment? As
the ICN bond stretches, the electronic structure of the CN moiety changes. This is
mechanism!
The photodissociation of NaI is mediated by a covalent-to-ionic curve crossing. The diabatic
(crossing) potential energy curves (solid lines) are the ones for which the electronic
character does not change rapidly as the molecule traverses the internuclear distance of the
curve crossing. The adiabatic curves (dashed lines), which are what “clamped nuclei”
quantum chemical calculations generate, exhibit a rapid change of electronic character at
the internuclear distance of the avoided crossing. As the molecule moves through the curve-
crossing region, it must decide whether it is going to follow the diabatic or the adiabatic
potential. Landau-Zener theory tells us the velocity-dependence of the probability of
jumping across the energy gap between the ionic and the covalent adiabatic curves. If you
drive too fast, you will be unable to stay on the road on a sharp curve. The sharpness of the
curve is determined by the magnitude of the interaction matrix element between the
diabatic potential curves. A very gentle curvature is the signature of a very large interaction
matrix element. In the Zewail experiments, the velocity in the curve-crossing region can be
systematically slightly adjusted by the choice of the center wavelength of the pump pulse.
At an NaI energy far above that of the curve-crossing, the velocity in the crossing region is
very large and the molecule stays on one of the diabatic potentials, in effect jumping the gap
between adiabatic curves. At an energy near that of the curve crossing, the molecule would
go through the crossing region slowly and stay on one of the adiabatic curves, with the result
that the wave packet that is born covalent, is nearly 100% converted to ionic at the
internuclear distance of the crossing. Zewail’s NaI experiments provide a direct
experimental determination of the internuclear distance of the curve crossing and an
explicit illustration of Landau-Zener theory.

Figure 1: Pump/Probe Scheme for Photodissociation of ICN (Figure 1 of Ref. 24). This is a reduced
dimension representation of three singlet potential energy surfaces of ICN: the bound ground electronic state,
V0 with minimum at Re, an excited unbound state, V1, which dissociates to CN(X2Σ+) and I(2P3/2), and a higher
energy unbound state, which dissociates to CN(B2Σ+) and I(2P3/2). A t = 0 pulse from the pump laser, with center
wavelength λ1, excites a vertical turning-point-to-turning-point (P0 = 0, P1 = 0) transition at R = R0 > Re to the
V1 potential surface. The wavepacket on the V1 potential surface experiences a force in the increasing RI-CN
direction, which causes the PI-CN momentum to increase monotonically with time. At t = τ , a pulse from the
probe laser, with center wavelength probes for the arrival of the wavepacket at RI-CN = R? or R∞ . The
energy of the vertical (ΔR=0) and momentumconserving (ΔP=0) transition also increases monotonically with
time as the wavepacket travels outward on V1. This V2−V1 transition is essentially an excitation of the CN B−X
electronic transition in the presence of the departing I atom. The R= RI-CN = R? Optically Coupled Region (OCR)
is interrogated by a probe pulse with center wavelength , where is the wavelength of the free CN
B−X v0 = 0 − v00 = 0 band. The detected signal is CN B-X spontaneous fluorescence. Reproduced with permission
from Figure 1 in M. J. Rosker, M. Dantus, and A. H. Zewail, “Femtosecond real-time probing of reactions. I. The
technique,”
J. Chem. Phys. 89, 6113–6127 (1988). Copyright 1988, AIP Publishing LLC.
Internuclear Separation

Figure 2: Wavepacket Transit through an Ionic∼Covalent Potential Energy Curve Crossing in NaI
(Figure 1 of Ref. 26). The diabatic (solid lines) Na+,I− and Na,I potential energy curves cross at Rx = 6.93A.˚ The
avoided crossing between the adiabatic potential curves is shown as dashed lines. At t = t0 the 310 nm pump
pulse creates a wavepacket at the inner turning point of the covalent (Na 2S, I2P3/2) potential curve at
R≈Re(X1Σ+) and P= 0. By adjusting the center wavelength of the pump pulse, the center total-energy (electronic
plus vibrational) of the wavepacket can be adjusted between 30,000 and 34,000 cm−1 . The excitation energy
of the ionic∼covalent curve crossing is ∼ 26, 000 cm−1 . The wavepacket is accelerated outward, passes through
the curve-crossing region at t?, and bifurcates, one part traveling on the bound ionic potential and the other
part traveling irreversibly outward on the unbound covalent potential. The ionic part is reflected at tR at the
outer turning point of the ionic potential, passes with P< 0 through the R= 6.93 ˚A curve crossing region where
it bifurcates again, and the resultant ionic and covalent parts are reflected outward at the inner turning points
of the ionic and covalent potential curves, respectively. Each outward passage of a wavepacket through the
curve crossing region results in a wavepacket traveling irreversibly outward on the unbound covalent
potential, eventually forming free Na(2S) and I(2P3/2) atoms. The probe pulse (not shown) interrogates the
dynamics by exciting Na(2S),I(2P3/2) weakly-bound molecules to a higher energy repulsive electronic state that
dissociates to Na(2P) + I(2P3/2) atoms. Excitation at centerwavelength longer than 589 nm samples NaI
molecules en route to full dissociation. Excitation centered at 589 nm provides what is essentially a time-
integrated sample of the accumulation of the free Na(2S) atoms. Reproduced with permission from Figure 1 in
T. S. Rose, M. J. Rosker, and A. H. Zewail, “Femtosecond real-time observations of wave packet oscillations
(resonance) in dissociation reactions,” J. Chem. Phys. 88, 6672–6673 (1988). Copyright 1988, AIP Publishing
LLC.
0
4
R
x
= 6.93Å
COVALENT Na +I
IONIC Na
+
+I
–
t
0
t
*
t
R
R(Å)
10
15
0
2
5
0
5
10
15
20
25
30
35
Energy (10
3
cm
–1
)
FS
pump (
λ
)
FS
probe (t,
λ
)
Na I*
Na
[
…
I]
‡
*
Na
[
……
I]
‡
*
Na + I + E
tr

Figure 3: Clocking of the Photodissociation of NaI (and NaBr) as the Nuclear Wavepacket Repeatedly
Traverses the Ionic/Covalent Curve Crossing (Figure 2 of Ref. 26). The wavepacket, illustrated in Fig. 6.5, is
created at t = t0 at the inner turning point on the covalent excited electronic state. At each outward-bound
traversal of the curve-crossing region, part of the wavepacket follows the covalent adiabatic curve irreversibly
outward to separated Na(2S)+I(2P3/2) atoms. If the probe laser centerwavelength is tuned slightly to the red of
the 589 nm free Na atom 2P←2S transition, each time a wavepacket of incompletely separated Na,I molecules
passes through the Optically Coupled Region, some not quite free Na atoms are excited to the 2P state, from
which spontaneous fluorescence is detected. The series of Na atom fluorescence pulses shown in Spectrum I
samples each outward passage of a wavepacket through the curve-crossing region. The temporal spacing of
the pulses corresponds to a 36 cm−1 vibrational frequency. When the center-wavelength of the probe laser is
tuned to 589 nm, the arrivals of free Na atom wavepackets are displayed in Spectrum II as a periodic series of
upward steps. Spectrum III shows that the (upper) adiabatic potential curve for NaBr is shallower and “leakier”
than that for NaI. Reproduced with permission from Figure 2 in T. S. Rose, M. J. Rosker, and A. H. Zewail,
“Femtosecond real-time observations of wave packet oscillations (resonance) in dissociation reactions,” J.
Chem. Phys. 88, 6672–6673 (1988). Copyright 1988, AIP Publishing LLC. Ahmed Zewail was awarded the
1999 Nobel Prize in Chemistry for “Femtosecond Transition State (FTS) Spectroscopy.”
These experiments were described as the first time that the mechanisms of real
intramolecular dynamics were ”clocked” in real time. In a pump/probe scheme, a
femtosecond pump pulse creates a wavepacket on a repulsive or predissociated
electronically excited V1 potential energy surface at t = 0 by excitation from the v = 0 level of
the electronic ground state, V0 (ability to tune center energy of wavepacket by a small
500
fs
∆t (fs)
III
II

amount). After each excitation pulse, the time-evolving wavepacket is probed by a
femtosecond pulse with a chosen center wavelength at a time-delay t = τ. This delay time is
scanned, pulse-by-pulse, to determine the time at which the center of the wavepacket
crosses through the “Optically Coupled Region (OCR).” The probe pulse excites a portion of
the wavepacket from the V1 potential surface to a higher energy repulsive potential surface,
V2. The V2 potential surface is repulsive, dissociating to an electronically excited fragment.
The detected signal is the time-integrated ∼ 10 nanosecond lifetime fluorescence from this
excited fragment. The dynamically relevant information is encoded in the intensity vs. τ of
this time-integrated fluorescence, which samples the femtosecond passage of the
wavepacket through the OCR that is selected by the center wavelength of the probe pulse.
The ICN photodissociation experiment shows the effect of the presence of the I atom on the
frequency of the CN B2Σ+ − X2Σ+ electronic transition. As the I atom moves away from the CN
molecule, the energy of the CN electronic excitation increases from its value in the ICN
molecule to that of the free CN molecule. Did we know this before doing the experiment? As
the ICN bond stretches, the electronic structure of the CN moiety changes. This is
mechanism!
The photodissociation of NaI is mediated by a covalent-to-ionic curve crossing. The diabatic
(crossing) potential energy curves (solid lines) are the ones for which the electronic
character does not change rapidly as the molecule traverses the internuclear distance of the
curve crossing. The adiabatic curves (dashed lines), which are what “clamped nuclei”
quantum chemical calculations generate, exhibit a rapid change of electronic character at
the internuclear distance of the avoided crossing. As the molecule moves through the curve-
crossing region, it must decide whether it is going to follow the diabatic or the adiabatic
potential. Landau-Zener theory tells us the velocity-dependence of the probability of
jumping across the energy gap between the ionic and the covalent adiabatic curves. If you
drive too fast, you will be unable to stay on the road on a sharp curve. The sharpness of the
curve is determined by the magnitude of the interaction matrix element between the
diabatic potential curves. A very gentle curvature is the signature of a very large interaction
matrix element. In the Zewail experiments, the velocity in the curve-crossing region can be
systematically slightly adjusted by the choice of the center wavelength of the pump pulse.
At an NaI energy far above that of the curve-crossing, the velocity in the crossing region is
very large and the molecule stays on one of the diabatic potentials, in effect jumping the gap
between adiabatic curves. At an energy near that of the curve crossing, the molecule would
go through the crossing region slowly and stay on one of the adiabatic curves, with the result
that the wave packet that is born covalent, is nearly 100% converted to ionic at the
internuclear distance of the crossing. Zewail’s NaI experiments provide a direct
experimental determination of the internuclear distance of the curve crossing and an
explicit illustration of Landau-Zener theory.

Figure 1: Pump/Probe Scheme for Photodissociation of ICN (Figure 1 of Ref. 24). This is a reduced
dimension representation of three singlet potential energy surfaces of ICN: the bound ground electronic state,
V0 with minimum at Re, an excited unbound state, V1, which dissociates to CN(X2Σ+) and I(2P3/2), and a higher
energy unbound state, which dissociates to CN(B2Σ+) and I(2P3/2). A t = 0 pulse from the pump laser, with center
wavelength λ1, excites a vertical turning-point-to-turning-point (P0 = 0, P1 = 0) transition at R = R0 > Re to the
V1 potential surface. The wavepacket on the V1 potential surface experiences a force in the increasing RI-CN
direction, which causes the PI-CN momentum to increase monotonically with time. At t = τ , a pulse from the
probe laser, with center wavelength probes for the arrival of the wavepacket at RI-CN = R? or R∞ . The
energy of the vertical (ΔR=0) and momentumconserving (ΔP=0) transition also increases monotonically with
time as the wavepacket travels outward on V1. This V2−V1 transition is essentially an excitation of the CN B−X
electronic transition in the presence of the departing I atom. The R= RI-CN = R? Optically Coupled Region (OCR)
is interrogated by a probe pulse with center wavelength , where is the wavelength of the free CN
B−X v0 = 0 − v00 = 0 band. The detected signal is CN B-X spontaneous fluorescence. Reproduced with permission
from Figure 1 in M. J. Rosker, M. Dantus, and A. H. Zewail, “Femtosecond real-time probing of reactions. I. The
technique,”
J. Chem. Phys. 89, 6113–6127 (1988). Copyright 1988, AIP Publishing LLC.
Internuclear Separation

Figure 2: Wavepacket Transit through an Ionic∼Covalent Potential Energy Curve Crossing in NaI
(Figure 1 of Ref. 26). The diabatic (solid lines) Na+,I− and Na,I potential energy curves cross at Rx = 6.93A.˚ The
avoided crossing between the adiabatic potential curves is shown as dashed lines. At t = t0 the 310 nm pump
pulse creates a wavepacket at the inner turning point of the covalent (Na 2S, I2P3/2) potential curve at
R≈Re(X1Σ+) and P= 0. By adjusting the center wavelength of the pump pulse, the center total-energy (electronic
plus vibrational) of the wavepacket can be adjusted between 30,000 and 34,000 cm−1 . The excitation energy
of the ionic∼covalent curve crossing is ∼ 26, 000 cm−1 . The wavepacket is accelerated outward, passes through
the curve-crossing region at t?, and bifurcates, one part traveling on the bound ionic potential and the other
part traveling irreversibly outward on the unbound covalent potential. The ionic part is reflected at tR at the
outer turning point of the ionic potential, passes with P< 0 through the R= 6.93 ˚A curve crossing region where
it bifurcates again, and the resultant ionic and covalent parts are reflected outward at the inner turning points
of the ionic and covalent potential curves, respectively. Each outward passage of a wavepacket through the
curve crossing region results in a wavepacket traveling irreversibly outward on the unbound covalent
potential, eventually forming free Na(2S) and I(2P3/2) atoms. The probe pulse (not shown) interrogates the
dynamics by exciting Na(2S),I(2P3/2) weakly-bound molecules to a higher energy repulsive electronic state that
dissociates to Na(2P) + I(2P3/2) atoms. Excitation at centerwavelength longer than 589 nm samples NaI
molecules en route to full dissociation. Excitation centered at 589 nm provides what is essentially a time-
integrated sample of the accumulation of the free Na(2S) atoms. Reproduced with permission from Figure 1 in
T. S. Rose, M. J. Rosker, and A. H. Zewail, “Femtosecond real-time observations of wave packet oscillations
(resonance) in dissociation reactions,” J. Chem. Phys. 88, 6672–6673 (1988). Copyright 1988, AIP Publishing
LLC.
0
4
R
x
= 6.93Å
COVALENT Na +I
IONIC Na
+
+I
–
t
0
t
*
t
R
R(Å)
10
15
0
2
5
0
5
10
15
20
25
30
35
Energy (10
3
cm
–1
)
FS
pump (
λ
)
FS
probe (t,
λ
)
Na I*
Na
[
…
I]
‡
*
Na
[
……
I]
‡
*
Na + I + E
tr
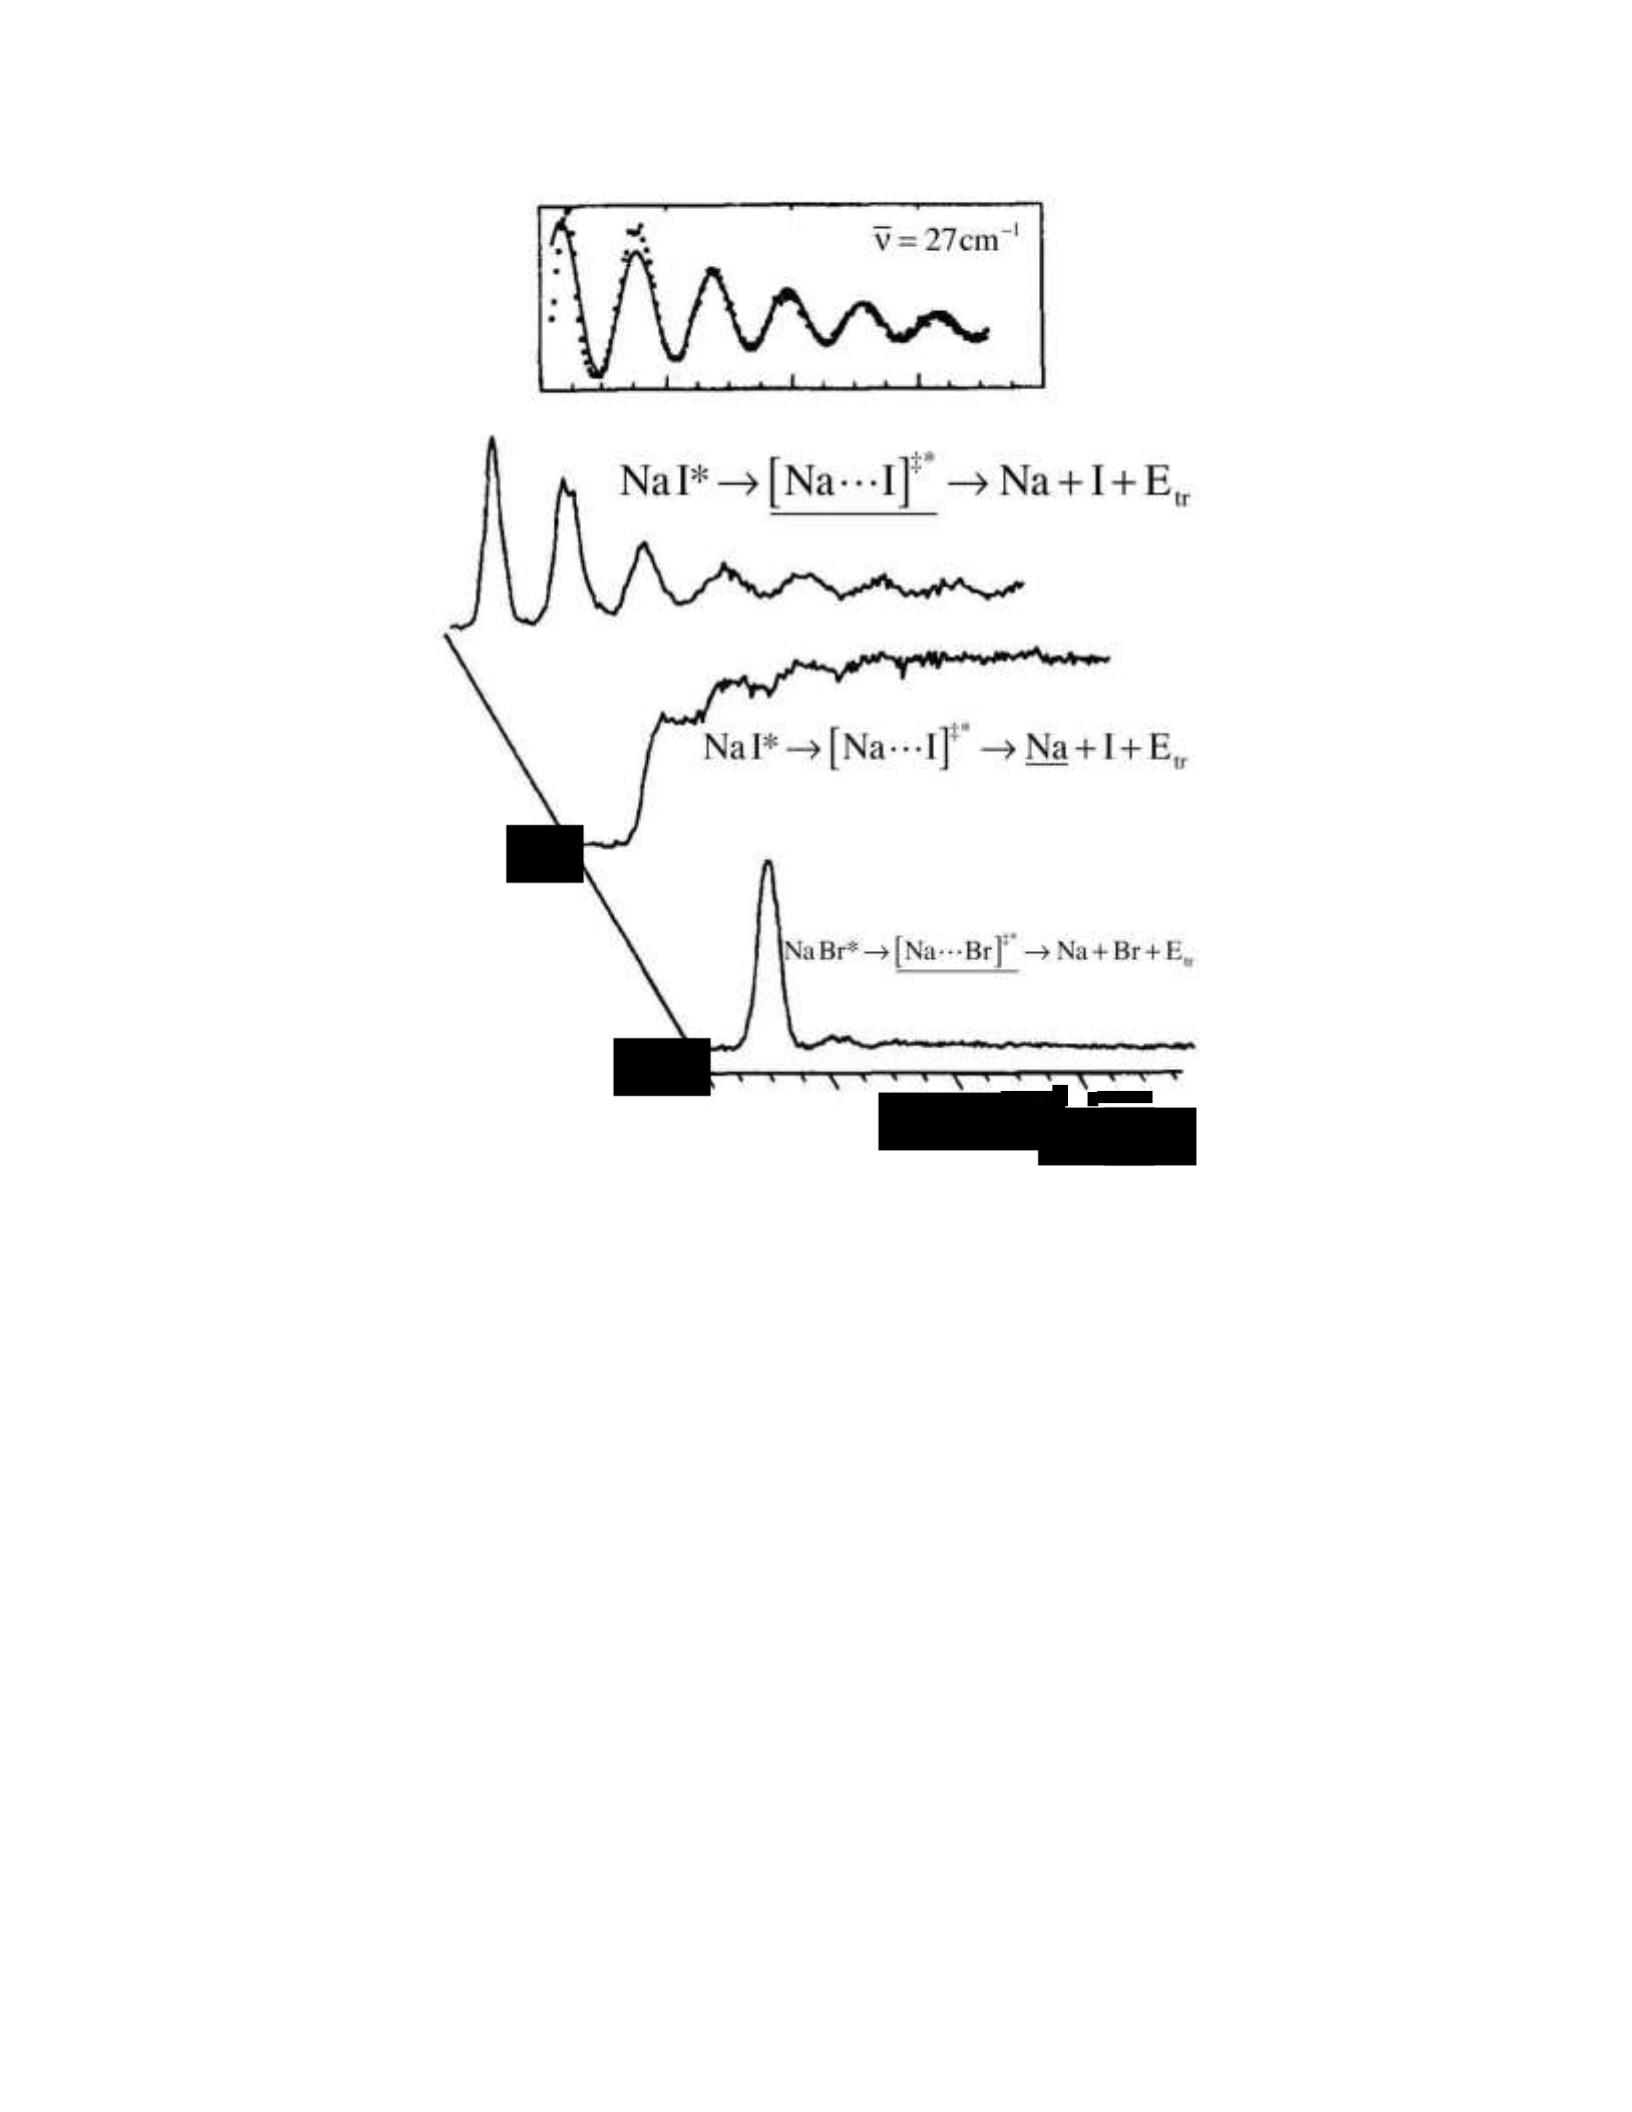
Figure 3: Clocking of the Photodissociation of NaI (and NaBr) as the Nuclear Wavepacket Repeatedly
Traverses the Ionic/Covalent Curve Crossing (Figure 2 of Ref. 26). The wavepacket, illustrated in Fig. 6.5, is
created at t = t0 at the inner turning point on the covalent excited electronic state. At each outward-bound
traversal of the curve-crossing region, part of the wavepacket follows the covalent adiabatic curve irreversibly
outward to separated Na(2S)+I(2P3/2) atoms. If the probe laser centerwavelength is tuned slightly to the red of
the 589 nm free Na atom 2P←2S transition, each time a wavepacket of incompletely separated Na,I molecules
passes through the Optically Coupled Region, some not quite free Na atoms are excited to the 2P state, from
which spontaneous fluorescence is detected. The series of Na atom fluorescence pulses shown in Spectrum I
samples each outward passage of a wavepacket through the curve-crossing region. The temporal spacing of
the pulses corresponds to a 36 cm−1 vibrational frequency. When the center-wavelength of the probe laser is
tuned to 589 nm, the arrivals of free Na atom wavepackets are displayed in Spectrum II as a periodic series of
upward steps. Spectrum III shows that the (upper) adiabatic potential curve for NaBr is shallower and “leakier”
than that for NaI. Reproduced with permission from Figure 2 in T. S. Rose, M. J. Rosker, and A. H. Zewail,
“Femtosecond real-time observations of wave packet oscillations (resonance) in dissociation reactions,” J.
Chem. Phys. 88, 6672–6673 (1988). Copyright 1988, AIP Publishing LLC.
Ahmed Zewail was awarded the 1999 Nobel Prize in Chemistry for “Femtosecond Transition
State (FTS) Spectroscopy.” These experiments were described as the first time that the
mechanisms of real intramolecular dynamics were ”clocked” in real time. In a pump/probe
scheme, a femtosecond pump pulse creates a wavepacket on a repulsive or predissociated
electronically excited V1 potential energy surface at t = 0 by excitation from the v = 0 level of
the electronic ground state, V0 (ability to tune center energy of wavepacket by a small
500
fs
∆t (fs)
III
II

amount). After each excitation pulse, the time-evolving wavepacket is probed by a
femtosecond pulse with a chosen center wavelength at a time-delay t = τ. This delay time is
scanned, pulse-by-pulse, to determine the time at which the center of the wavepacket
crosses through the “Optically Coupled Region (OCR).” The probe pulse excites a portion of
the wavepacket from the V1 potential surface to a higher energy repulsive potential surface,
V2. The V2 potential surface is repulsive, dissociating to an electronically excited fragment.
The detected signal is the time-integrated ∼ 10 nanosecond lifetime fluorescence from this
excited fragment. The dynamically relevant information is encoded in the intensity vs. τ of
this time-integrated fluorescence, which samples the femtosecond passage of the
wavepacket through the OCR that is selected by the center wavelength of the probe pulse.
The ICN photodissociation experiment shows the effect of the presence of the I atom on the
frequency of the CN B2Σ+ − X2Σ+ electronic transition. As the I atom moves away from the CN
molecule, the energy of the CN electronic excitation increases from its value in the ICN
molecule to that of the free CN molecule. Did we know this before doing the experiment? As
the ICN bond stretches, the electronic structure of the CN moiety changes. This is
mechanism!
The photodissociation of NaI is mediated by a covalent-to-ionic curve crossing. The diabatic
(crossing) potential energy curves (solid lines) are the ones for which the electronic
character does not change rapidly as the molecule traverses the internuclear distance of the
curve crossing. The adiabatic curves (dashed lines), which are what “clamped nuclei”
quantum chemical calculations generate, exhibit a rapid change of electronic character at
the internuclear distance of the avoided crossing. As the molecule moves through the curve-
crossing region, it must decide whether it is going to follow the diabatic or the adiabatic
potential. Landau-Zener theory tells us the velocity-dependence of the probability of
jumping across the energy gap between the ionic and the covalent adiabatic curves. If you
drive too fast, you will be unable to stay on the road on a sharp curve. The sharpness of the
curve is determined by the magnitude of the interaction matrix element between the
diabatic potential curves. A very gentle curvature is the signature of a very large interaction
matrix element. In the Zewail experiments, the velocity in the curve-crossing region can be
systematically slightly adjusted by the choice of the center wavelength of the pump pulse.
At an NaI energy far above that of the curve-crossing, the velocity in the crossing region is
very large and the molecule stays on one of the diabatic potentials, in effect jumping the gap
between adiabatic curves. At an energy near that of the curve crossing, the molecule would
go through the crossing region slowly and stay on one of the adiabatic curves, with the result
that the wave packet that is born covalent, is nearly 100% converted to ionic at the
internuclear distance of the crossing. Zewail’s NaI experiments provide a direct
experimental determination of the internuclear distance of the curve crossing and an
explicit illustration of Landau-Zener theory.

Figure 1: Pump/Probe Scheme for Photodissociation of ICN (Figure 1 of Ref. 24). This is a reduced
dimension representation of three singlet potential energy surfaces of ICN: the bound ground electronic state,
V0 with minimum at Re, an excited unbound state, V1, which dissociates to CN(X2Σ+) and I(2P3/2), and a higher
energy unbound state, which dissociates to CN(B2Σ+) and I(2P3/2). A t = 0 pulse from the pump laser, with center
wavelength λ1, excites a vertical turning-point-to-turning-point (P0 = 0, P1 = 0) transition at R = R0 > Re to the
V1 potential surface. The wavepacket on the V1 potential surface experiences a force in the increasing RI-CN
direction, which causes the PI-CN momentum to increase monotonically with time. At t = τ , a pulse from the
probe laser, with center wavelength probes for the arrival of the wavepacket at RI-CN = R? or R∞ . The
energy of the vertical (ΔR=0) and momentumconserving (ΔP=0) transition also increases monotonically with
time as the wavepacket travels outward on V1. This V2−V1 transition is essentially an excitation of the CN B−X
electronic transition in the presence of the departing I atom. The R= RI-CN = R? Optically Coupled Region (OCR)
is interrogated by a probe pulse with center wavelength , where is the wavelength of the free CN
B−X v0 = 0 − v00 = 0 band. The detected signal is CN B-X spontaneous fluorescence. Reproduced with permission
from Figure 1 in M. J. Rosker, M. Dantus, and A. H. Zewail, “Femtosecond real-time probing of reactions. I. The
technique,”
J. Chem. Phys. 89, 6113–6127 (1988). Copyright 1988, AIP Publishing LLC.
Internuclear Separation

Figure 2: Wavepacket Transit through an Ionic∼Covalent Potential Energy Curve Crossing in NaI
(Figure 1 of Ref. 26). The diabatic (solid lines) Na+,I− and Na,I potential energy curves cross at Rx = 6.93A.˚ The
avoided crossing between the adiabatic potential curves is shown as dashed lines. At t = t0 the 310 nm pump
pulse creates a wavepacket at the inner turning point of the covalent (Na 2S, I2P3/2) potential curve at
R≈Re(X1Σ+) and P= 0. By adjusting the center wavelength of the pump pulse, the center total-energy (electronic
plus vibrational) of the wavepacket can be adjusted between 30,000 and 34,000 cm−1 . The excitation energy
of the ionic∼covalent curve crossing is ∼ 26, 000 cm−1 . The wavepacket is accelerated outward, passes through
the curve-crossing region at t?, and bifurcates, one part traveling on the bound ionic potential and the other
part traveling irreversibly outward on the unbound covalent potential. The ionic part is reflected at tR at the
outer turning point of the ionic potential, passes with P< 0 through the R= 6.93 ˚A curve crossing region where
it bifurcates again, and the resultant ionic and covalent parts are reflected outward at the inner turning points
of the ionic and covalent potential curves, respectively. Each outward passage of a wavepacket through the
curve crossing region results in a wavepacket traveling irreversibly outward on the unbound covalent
potential, eventually forming free Na(2S) and I(2P3/2) atoms. The probe pulse (not shown) interrogates the
dynamics by exciting Na(2S),I(2P3/2) weakly-bound molecules to a higher energy repulsive electronic state that
dissociates to Na(2P) + I(2P3/2) atoms. Excitation at centerwavelength longer than 589 nm samples NaI
molecules en route to full dissociation. Excitation centered at 589 nm provides what is essentially a time-
integrated sample of the accumulation of the free Na(2S) atoms. Reproduced with permission from Figure 1 in
T. S. Rose, M. J. Rosker, and A. H. Zewail, “Femtosecond real-time observations of wave packet oscillations
(resonance) in dissociation reactions,” J. Chem. Phys. 88, 6672–6673 (1988). Copyright 1988, AIP Publishing
LLC.
0
4
R
x
= 6.93Å
COVALENT Na +I
IONIC Na
+
+I
–
t
0
t
*
t
R
R(Å)
10
15
0
2
5
0
5
10
15
20
25
30
35
Energy (10
3
cm
–1
)
FS
pump (
λ
)
FS
probe (t,
λ
)
Na I*
Na
[
…
I]
‡
*
Na
[
……
I]
‡
*
Na + I + E
tr

Figure 3: Clocking of the Photodissociation of NaI (and NaBr) as the Nuclear Wavepacket Repeatedly
Traverses the Ionic/Covalent Curve Crossing (Figure 2 of Ref. 26). The wavepacket, illustrated in Fig. 6.5, is
created at t = t0 at the inner turning point on the covalent excited electronic state. At each outward-bound
traversal of the curve-crossing region, part of the wavepacket follows the covalent adiabatic curve irreversibly
outward to separated Na(2S)+I(2P3/2) atoms. If the probe laser centerwavelength is tuned slightly to the red of
the 589 nm free Na atom 2P←2S transition, each time a wavepacket of incompletely separated Na,I molecules
passes through the Optically Coupled Region, some not quite free Na atoms are excited to the 2P state, from
which spontaneous fluorescence is detected. The series of Na atom fluorescence pulses shown in Spectrum I
samples each outward passage of a wavepacket through the curve-crossing region. The temporal spacing of
the pulses corresponds to a 36 cm−1 vibrational frequency. When the center-wavelength of the probe laser is
tuned to 589 nm, the arrivals of free Na atom wavepackets are displayed in Spectrum II as a periodic series of
upward steps. Spectrum III shows that the (upper) adiabatic potential curve for NaBr is shallower and “leakier”
than that for NaI. Reproduced with permission from Figure 2 in T. S. Rose, M. J. Rosker, and A. H. Zewail,
“Femtosecond real-time observations of wave packet oscillations (resonance) in dissociation reactions,” J.
Chem. Phys. 88, 6672–6673 (1988). Copyright 1988, AIP Publishing LLC.
Ahmed Zewail was awarded the 1999 Nobel Prize in Chemistry for “Femtosecond Transition
State (FTS) Spectroscopy.” These experiments were described as the first time that the
mechanisms of real intramolecular dynamics were ”clocked” in real time. In a pump/probe
scheme, a femtosecond pump pulse creates a wavepacket on a repulsive or predissociated
electronically excited V1 potential energy surface at t = 0 by excitation from the v = 0 level of
the electronic ground state, V0 (ability to tune center energy of wavepacket by a small
500
fs
∆t (fs)
III
II

amount). After each excitation pulse, the time-evolving wavepacket is probed by a
femtosecond pulse with a chosen center wavelength at a time-delay t = τ. This delay time is
scanned, pulse-by-pulse, to determine the time at which the center of the wavepacket
crosses through the “Optically Coupled Region (OCR).” The probe pulse excites a portion of
the wavepacket from the V1 potential surface to a higher energy repulsive potential surface,
V2. The V2 potential surface is repulsive, dissociating to an electronically excited fragment.
The detected signal is the time-integrated ∼ 10 nanosecond lifetime fluorescence from this
excited fragment. The dynamically relevant information is encoded in the intensity vs. τ of
this time-integrated fluorescence, which samples the femtosecond passage of the
wavepacket through the OCR that is selected by the center wavelength of the probe pulse.
The ICN photodissociation experiment shows the effect of the presence of the I atom on the
frequency of the CN B2Σ+ − X2Σ+ electronic transition. As the I atom moves away from the CN
molecule, the energy of the CN electronic excitation increases from its value in the ICN
molecule to that of the free CN molecule. Did we know this before doing the experiment? As
the ICN bond stretches, the electronic structure of the CN moiety changes. This is
mechanism!
The photodissociation of NaI is mediated by a covalent-to-ionic curve crossing. The diabatic
(crossing) potential energy curves (solid lines) are the ones for which the electronic
character does not change rapidly as the molecule traverses the internuclear distance of the
curve crossing. The adiabatic curves (dashed lines), which are what “clamped nuclei”
quantum chemical calculations generate, exhibit a rapid change of electronic character at
the internuclear distance of the avoided crossing. As the molecule moves through the curve-
crossing region, it must decide whether it is going to follow the diabatic or the adiabatic
potential. Landau-Zener theory tells us the velocity-dependence of the probability of
jumping across the energy gap between the ionic and the covalent adiabatic curves. If you
drive too fast, you will be unable to stay on the road on a sharp curve. The sharpness of the
curve is determined by the magnitude of the interaction matrix element between the
diabatic potential curves. A very gentle curvature is the signature of a very large interaction
matrix element. In the Zewail experiments, the velocity in the curve-crossing region can be
systematically slightly adjusted by the choice of the center wavelength of the pump pulse.
At an NaI energy far above that of the curve-crossing, the velocity in the crossing region is
very large and the molecule stays on one of the diabatic potentials, in effect jumping the gap
between adiabatic curves. At an energy near that of the curve crossing, the molecule would
go through the crossing region slowly and stay on one of the adiabatic curves, with the result
that the wave packet that is born covalent, is nearly 100% converted to ionic at the
internuclear distance of the crossing. Zewail’s NaI experiments provide a direct
experimental determination of the internuclear distance of the curve crossing and an
explicit illustration of Landau-Zener theory.

Figure 1: Pump/Probe Scheme for Photodissociation of ICN (Figure 1 of Ref. 24). This is a reduced
dimension representation of three singlet potential energy surfaces of ICN: the bound ground electronic state,
V0 with minimum at Re, an excited unbound state, V1, which dissociates to CN(X2Σ+) and I(2P3/2), and a higher
energy unbound state, which dissociates to CN(B2Σ+) and I(2P3/2). A t = 0 pulse from the pump laser, with center
wavelength λ1, excites a vertical turning-point-to-turning-point (P0 = 0, P1 = 0) transition at R = R0 > Re to the
V1 potential surface. The wavepacket on the V1 potential surface experiences a force in the increasing RI-CN
direction, which causes the PI-CN momentum to increase monotonically with time. At t = τ , a pulse from the
probe laser, with center wavelength probes for the arrival of the wavepacket at RI-CN = R? or R∞ . The
energy of the vertical (ΔR=0) and momentumconserving (ΔP=0) transition also increases monotonically with
time as the wavepacket travels outward on V1. This V2−V1 transition is essentially an excitation of the CN B−X
electronic transition in the presence of the departing I atom. The R= RI-CN = R? Optically Coupled Region (OCR)
is interrogated by a probe pulse with center wavelength , where is the wavelength of the free CN
B−X v0 = 0 − v00 = 0 band. The detected signal is CN B-X spontaneous fluorescence. Reproduced with permission
from Figure 1 in M. J. Rosker, M. Dantus, and A. H. Zewail, “Femtosecond real-time probing of reactions. I. The
technique,”
J. Chem. Phys. 89, 6113–6127 (1988). Copyright 1988, AIP Publishing LLC.
Internuclear Separation

Figure 2: Wavepacket Transit through an Ionic∼Covalent Potential Energy Curve Crossing in NaI
(Figure 1 of Ref. 26). The diabatic (solid lines) Na+,I− and Na,I potential energy curves cross at Rx = 6.93A.˚ The
avoided crossing between the adiabatic potential curves is shown as dashed lines. At t = t0 the 310 nm pump
pulse creates a wavepacket at the inner turning point of the covalent (Na 2S, I2P3/2) potential curve at
R≈Re(X1Σ+) and P= 0. By adjusting the center wavelength of the pump pulse, the center total-energy (electronic
plus vibrational) of the wavepacket can be adjusted between 30,000 and 34,000 cm−1 . The excitation energy
of the ionic∼covalent curve crossing is ∼ 26, 000 cm−1 . The wavepacket is accelerated outward, passes through
the curve-crossing region at t?, and bifurcates, one part traveling on the bound ionic potential and the other
part traveling irreversibly outward on the unbound covalent potential. The ionic part is reflected at tR at the
outer turning point of the ionic potential, passes with P< 0 through the R= 6.93 ˚A curve crossing region where
it bifurcates again, and the resultant ionic and covalent parts are reflected outward at the inner turning points
of the ionic and covalent potential curves, respectively. Each outward passage of a wavepacket through the
curve crossing region results in a wavepacket traveling irreversibly outward on the unbound covalent
potential, eventually forming free Na(2S) and I(2P3/2) atoms. The probe pulse (not shown) interrogates the
dynamics by exciting Na(2S),I(2P3/2) weakly-bound molecules to a higher energy repulsive electronic state that
dissociates to Na(2P) + I(2P3/2) atoms. Excitation at centerwavelength longer than 589 nm samples NaI
molecules en route to full dissociation. Excitation centered at 589 nm provides what is essentially a time-
integrated sample of the accumulation of the free Na(2S) atoms. Reproduced with permission from Figure 1 in
T. S. Rose, M. J. Rosker, and A. H. Zewail, “Femtosecond real-time observations of wave packet oscillations
(resonance) in dissociation reactions,” J. Chem. Phys. 88, 6672–6673 (1988). Copyright 1988, AIP Publishing
LLC.
0
4
R
x
= 6.93Å
COVALENT Na +I
IONIC Na
+
+I
–
t
0
t
*
t
R
R(Å)
10
15
0
2
5
0
5
10
15
20
25
30
35
Energy (10
3
cm
–1
)
FS
pump (
λ
)
FS
probe (t,
λ
)
Na I*
Na
[
…
I]
‡
*
Na
[
……
I]
‡
*
Na + I + E
tr

Figure 3: Clocking of the Photodissociation of NaI (and NaBr) as the Nuclear Wavepacket Repeatedly
Traverses the Ionic/Covalent Curve Crossing (Figure 2 of Ref. 26). The wavepacket, illustrated in Fig. 6.5, is
created at t = t0 at the inner turning point on the covalent excited electronic state. At each outward-bound
traversal of the curve-crossing region, part of the wavepacket follows the covalent adiabatic curve irreversibly
outward to separated Na(2S)+I(2P3/2) atoms. If the probe laser centerwavelength is tuned slightly to the red of
the 589 nm free Na atom 2P←2S transition, each time a wavepacket of incompletely separated Na,I molecules
passes through the Optically Coupled Region, some not quite free Na atoms are excited to the 2P state, from
which spontaneous fluorescence is detected. The series of Na atom fluorescence pulses shown in Spectrum I
samples each outward passage of a wavepacket through the curve-crossing region. The temporal spacing of
the pulses corresponds to a 36 cm−1 vibrational frequency. When the center-wavelength of the probe laser is
tuned to 589 nm, the arrivals of free Na atom wavepackets are displayed in Spectrum II as a periodic series of
upward steps. Spectrum III shows that the (upper) adiabatic potential curve for NaBr is shallower and “leakier”
than that for NaI. Reproduced with permission from Figure 2 in T. S. Rose, M. J. Rosker, and A. H. Zewail,
“Femtosecond real-time observations of wave packet oscillations (resonance) in dissociation reactions,” J.
Chem. Phys. 88, 6672–6673 (1988). Copyright 1988, AIP Publishing LLC.
500
fs
∆t (fs)
III
II

