

math guruu
 AliceRanwodds
9.4.2 Example 2—An Income Statement Analysis
We now consider a slightly more complex model for scenario analysis. In this example, we focus on a standard income statement and a related set of scenarios that are provided by a decision maker. The decision maker would like to determine the bottom-line (net profit) that results from various combinations of input values. In Fig. 9.17 we can see that we have 7 input variables, and each variable has two possible values. This is not a particularly complex problem, but with a greater number of possible input values, this problem could easily become quite cumbersome. The 7 input values represent standard inputs that are often estimated in proforma Income Statement analysis:
· Sales Revenue = (Volume)*(Price)
· COGS = (percentage 4 )*(Sales Revenue)
· Variable Operating Expense = (percentage)*(Sales Revenue)
· Fixed Operating Expenses
· Depreciation Expense
· Interest Expense
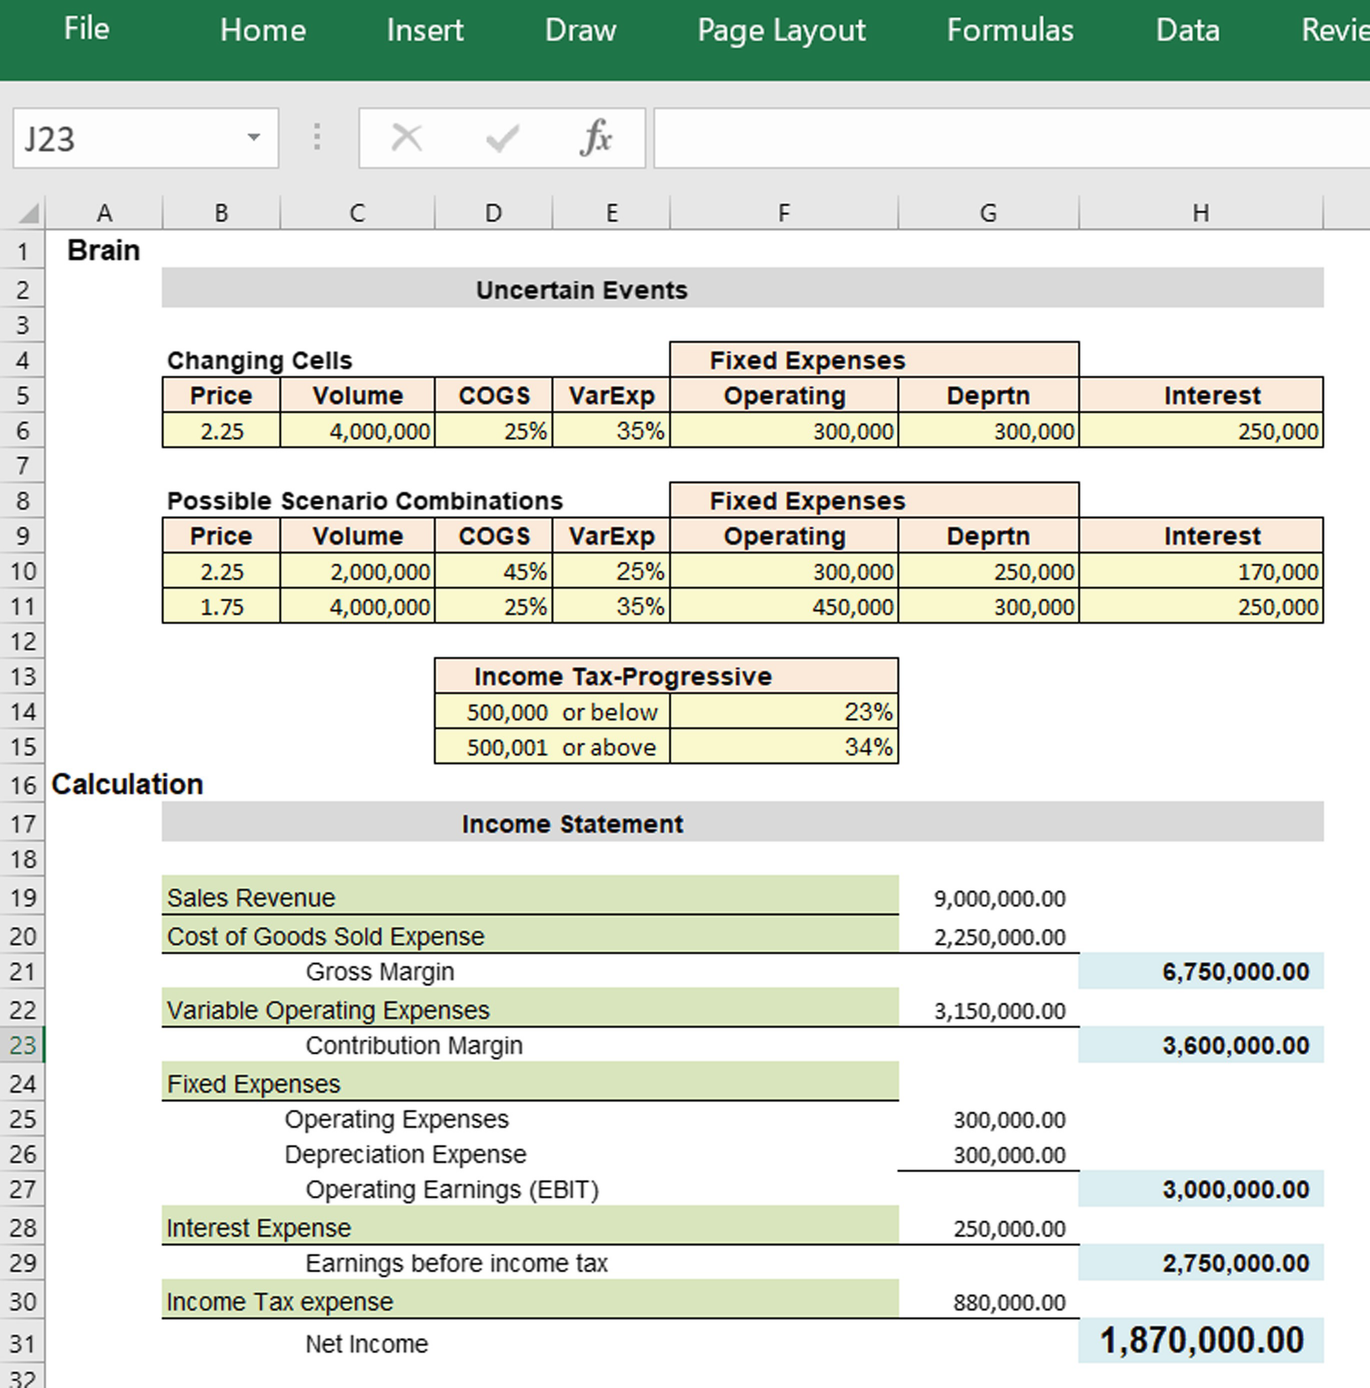
Fig. 9.17
Income statement analysis example
Obviously, we cannot use a two variable Data Table for this type of analysis; there are too many variables to consider simultaneously. This example is an excellent use of the Scenarios tools. Figure 9.18 shows the results of the 4 scenarios. They range from a loss of $300,000 to a gain of $2,417,800.
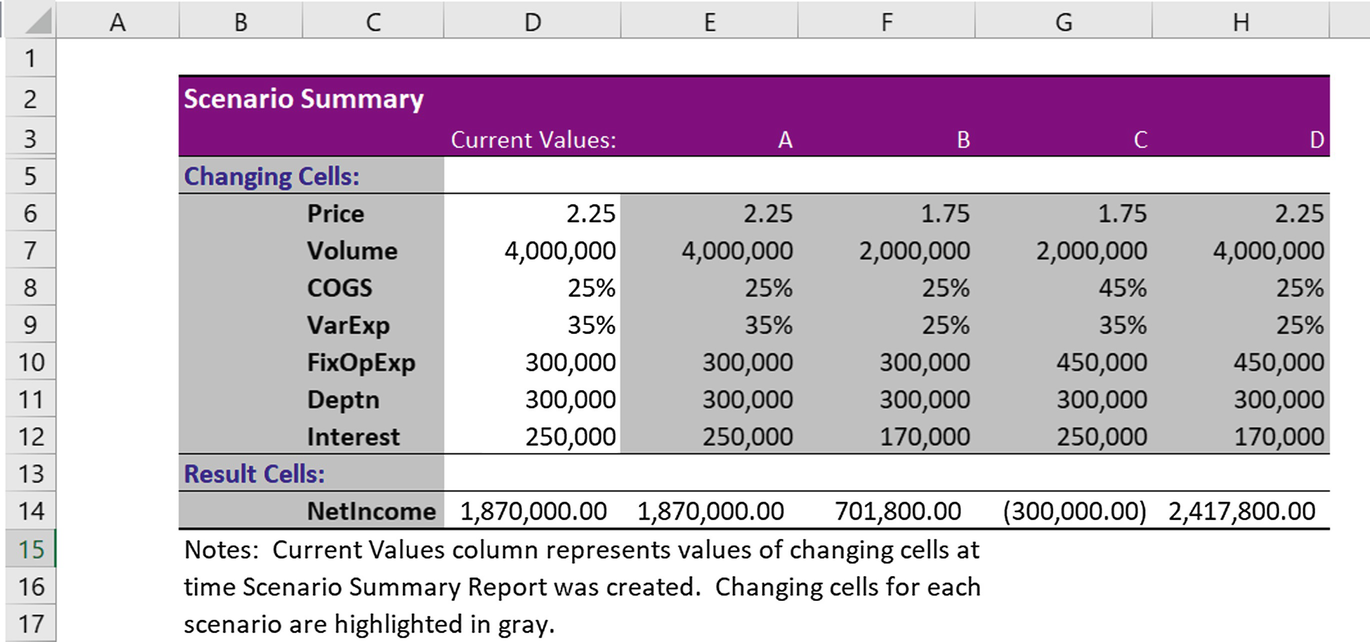
Fig. 9.18
Income statement scenarios