

geography discussion
7/3/2020 主题: Discussion 3: Analysis and Interpretation of Physical Geography Patterns
https://canvas.pasadena.edu/courses/1105361/discussion_topics/3998456?module_item_id=11971442 1/15
此讨论为计分作业:满分 10 分* 截止时间 7月5日
Discussion 3: Analysis and Interpretation of Physical Geography Patterns 9 18
Overview
This assignment addresses Learning Outcome SLO 2 & Student Performance Objective SPO 5, and General Education Outcome 2.
Directions
For your Initial Post due by Sunday at 11:59 PM PST (2 point):
1. Research and find a credible map of a specific physical geography phenomena (from the lithosphere, biosphere, hydrosphere or atmosphere).
2. Post a new reply to this discussion board with the map (as an attached .doc, .pdf, or functioning web link), and citation.
Examples of credible maps of a speci�c physical geography phenomena:
Global Rain Forest Distribution (National Geographic 2013 http://images.nationalgeographic.com/wpf/media- live/photos/000/063/cache/map-world-rainforest_6367_600x450.jpg (http://images.nationalgeographic.com/wpf/media- live/photos/000/063/cache/map-world-rainforest_6367_600x450.jpg) )
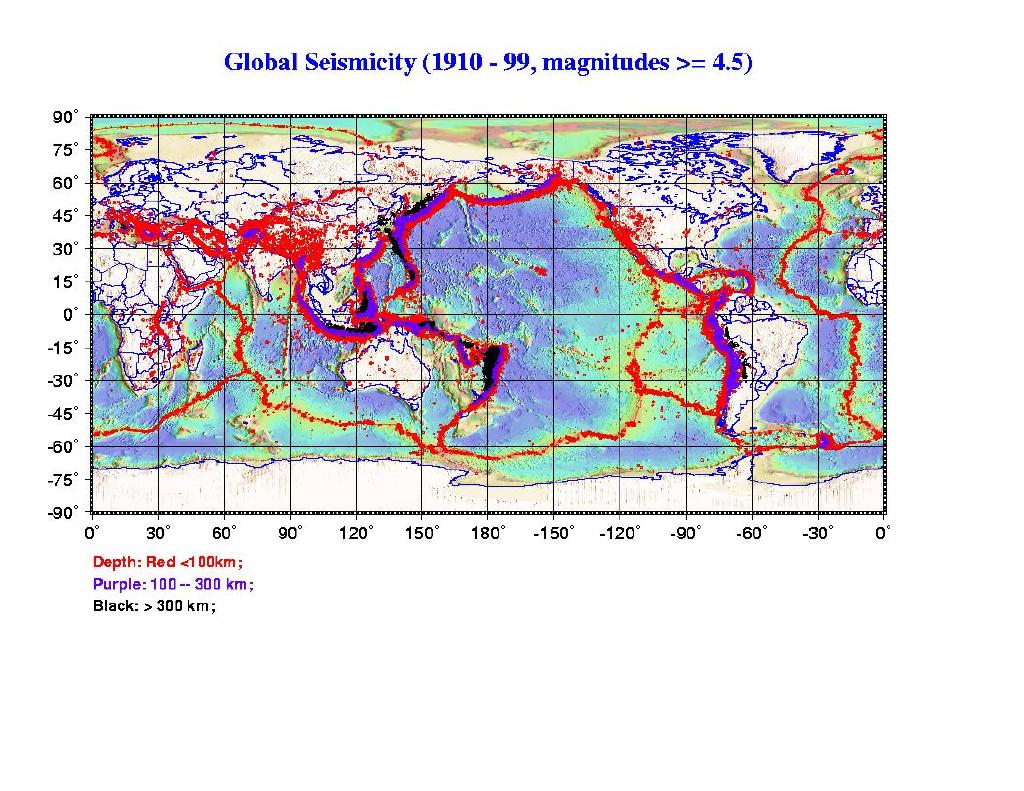
Global Distribution of Earthquakes: (Missouri University of Science and Technology, http://web.mst.edu/~sgao/g51/plo/0916_global_seismicity.jpg (http://web.mst.edu/~sgao/g51/plots/0916_global_seismicity.jpg) )
7/3/2020 主题: Discussion 3: Analysis and Interpretation of Physical Geography Patterns
https://canvas.pasadena.edu/courses/1105361/discussion_topics/3998456?module_item_id=11971442 2/15
For your Response to at least 2 classmates due by Tuesday at 11:59 PM PST (4 points each - 8 points total):
1. Review several of your peers maps and then the posts in which to reply (in your own words, college level writing) with the following information:
Research the map pattern and process. Identify the geographic pattern(s) on the map. Identify the process in the map, and describe your hypothesis about what is specifically causing the pattern to occur and why? Identify a research question that you have after thinking about the pattern and processes in the map. Your TWO replies may include the following language: "The map shows_______ pattern." There seems to be a pattern on the map in these locations ___________." My hypothesis why that pattern would occur is ________________." After seeing this map I have the following research questions _________________." Your Instructor will monitor the posts and replies and provide feedback using the detailed rubric below.
7/3/2020 主题: Discussion 3: Analysis and Interpretation of Physical Geography Patterns
https://canvas.pasadena.edu/courses/1105361/discussion_topics/3998456?module_item_id=11971442 3/15
搜索条目或作者
回复
Discussion Guidelines
Read and respond to others' posts as well, keeping in mind some basic rules for netiquette (http://www.albion.com/netiquette/corerules.html) :
Be kind and respectful to others Use full sentences Don't use too much jargon Treat others online as you wish to be treated Use language that supports others
未读 订阅
(https:// Taylor Post (https://canvas.pasadena.edu/courses/1105361/users/3767669)
星期二
回复
NWS JetStream MAX - Major Ocean Currents. NOAA's National Weather Service, US Department of Commerce. 9 Aug. 2019, https://www.weather.gov/jetstream/currents_max (https://www.weather.gov/jetstream/currents_max)
7/3/2020 主题: Discussion 3: Analysis and Interpretation of Physical Geography Patterns
https://canvas.pasadena.edu/courses/1105361/discussion_topics/3998456?module_item_id=11971442 4/15
(https:// Hantong Zhao (https://canvas.pasadena.edu/courses/1105361/users/3770262)
星期三
回复
Pawel Netzel et al, Climate Similarity Search - GeoWeb Tool for Exploring Climate Variability, Bulletin of the American Meteorological Society (2017). https://phys.org/news/2018-03-interactive-climate-world.amp (https://phys.org/news/2018- 03-interactive-climate-world.amp)
(https:// Ziying Huang (https://canvas.pasadena.edu/courses/1105361/users/3770337)
星期三
回复
Citation: Pidwirny, M. (2006). "Global Distribution of Precipitation". Fundamentals of Physical Geography, 2nd Edition. Date Viewed. http://www.physicalgeography.net/fundamentals/8g.html
http://www.physicalgeography.net/fundamentals/images/GPCP_ave_annual_1980_2004.gif (http://www.physicalgeography.net/fundamentals/images/GPCP_ave_annual_1980_2004.gif)
(http Taylor Post (https://canvas.pasadena.edu/courses/1105361/users/3767669)
星期三
Hi Ziying. I enjoyed researching your map regarding the global distribution of precipitation relating to a physical geography phenomena from the atmosphere.
The map shows annual global precipitation patterns in millimeters. There seems to be a pattern on the map, where there the least amount of precipitation (most dry) occurs at the poles of the globe and the subtropical areas above and below the