

Data Visualization for Business With Tableau
 Daraja
Visualisation for Business
ANL 201
Business Performance Dashboard
Study Unit 6
January 2020
Business Performance
Dashboard
3
Business Performance Dashboard The big idea (1/2)
‣ A business performance dashboard can be defined as a visual display of the most important information needed to achieve one or more objectives,
consolidated and arranged on a single screen so that the information can be
monitored at a glance
‣ This allows management to identify business processes that are doing well and those that are having problems and requiring corrective action
4
Business Performance Dashboard The big idea (2/2)
‣ The business performance dashboard serves as a critical performance reporting function in the strategic performance management model
‣ It acts like a magnifying glass to bring to focus an organisation’s attention on deficiencies that impede the achievement of the overall strategy
5
Business Performance Dashboard The strategic dashboard
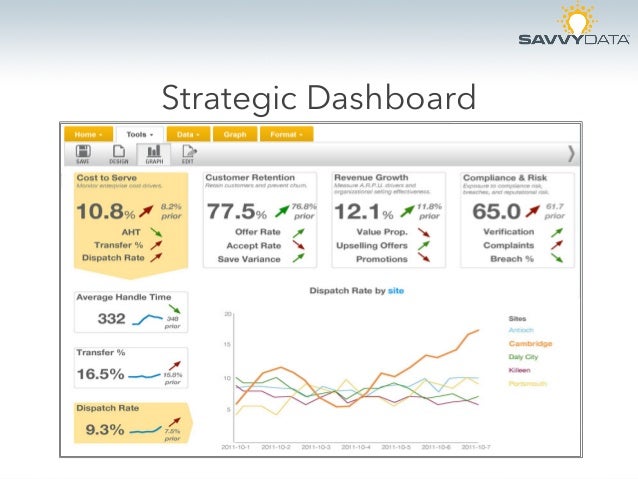
‣ The strategic dashboard is used by senior executives and managers to monitor the execution of strategic objectives. These strategic objectives can be the
results of using a balanced scorecard approach
‣ The key features of the strategic dashboard are simplicity and high visual impact
‣ An intuitive strategic dashboard is something that allows senior management to understand the company’s performance at a glance, and drill down to the details
of any indicator or the underlying tactical dashboard
Strategic Dashboard
Source: http://image.slidesharecdn.com/artandscienceofdashboarddesign-
140313160137-phpapp01/95/art-and-science-of-dashboard-design-24-
638.jpg?cb=1394726642
7
Business Performance Dashboard The tactical dashboard
‣ A tactical dashboard is used by managers and analysts to track the progress of departmental processes and projects against budget plans, forecasts or previous
periods achievements
Tactical Dashboard
Source: http://www.visualmining.com/wp-content/uploads/2012/10/Retail-Example-Dashboard.jpg
9
Business Performance Dashboard The operational dashboard
‣ The operational dashboard is used by operational staff and their supervisors to monitor operational processes
Operational Dashboard
Source: http://www.dashboardinsight.com/CMS/bcd462ac-24a3-44af-ad1d-
2cadc951ae0d/website-operational-dashboard.png
11
‣ Communicate strategy — Business performance dashboards facilitate the translation of corporate strategy into measures with their corresponding targets
‣ Increase insight — Business performance dashboards empower the management team with greater insights into the business performance in a
timely manner
‣ Increase motivation — With the measures and the corresponding targets displayed in business performance dashboards, the motivation to excel in the
measured areas is increased
Business Performance Dashboard Benefits of the business performance dashboard (1/3)
12
‣ Increase coordination — Objectivity, openness and transparency in business performance dashboards help promote effective coordination, and encourage
different departments to work more closely
‣ Consistent view of business — Business performance dashboards consolidate and integrate business performance information using a common platform,
definition, measures, and rules
Business Performance Dashboard Benefits of the business performance dashboard (2/3)
13
‣ Reduce cost and redundancy — Standardising information and reporting based on business performance dashboards can eliminate the duplication of reports
‣ User sufficiency and empowerment — Business performance dashboards allow users to be self-sufficient in creating, organising, and presenting information on
business performance
Business Performance Dashboard Benefits of the business performance dashboard (3/3)
14
‣ Display of selected measures and their corresponding targets that track business performance
‣ Graphics that facilitate visualisation of past trends or magnitude of differences
‣ The use of traffic light colours (green, ember, and red) to demarcate regions of desirability for a measure
Business Performance Dashboard Attributes of the business performance dashboard
Dashboard Design Principles
16
Dashboard Design Principles Dashboard design principles
‣ Keep it simple
‣ Don’t display everything
‣ Keep to a single page
‣ Avoid fancy formatting
‣ Use layout and placement
‣ Format numbers effectively
‣ Use titles and labels effectively
What is wrong with this dashboard?
Discussion
Source: https://www.geckoboard.com/blog/5-terrible-dashboard-designs-and-how-to-fix-them/#.WD1IHYVOKuU
What is wrong with this dashboard?
Discussion
Source: https://www.geckoboard.com/blog/5-terrible-dashboard-designs-and-how-to-fix-them/#.WD1IHYVOKuU
Creating Business
Performance Dashboards
20
Creating Business Performance Dashboards Creating business performance dashboards in Tableau
‣ Position objects in the dashboard workspace
‣ Use action to create advanced dashboard navigation
https://public.tableau.com/en-us/s/blog/2015/06/rough-guide-dashboard-actions
Tableau (Class Activity)
Tableau (Class Activity)
1. Follow your instructor to create a storyboard using dashboards for Amazing
Mart.
Amazing Mart’s Sales Manager would like to have a dashboard that tracks the
sales and profits of the products they sell.
The collected data is stored in 2 entities, List of Orders and Order Breakdown.
List of Orders contains information about the customer, such as customer name,
the segment they are in, order date, shipping date, and mode.
Order Breakdown contains information about the product they purchased, the
sales price and the profit that was made from the sales.
Tableau (Class Activity)
Tableau (Class Activity)
25
Tableau (Class Activity)
suss.edu.sg
Course Homepage https://canvas.suss.edu.sg/courses/21575
Study Guide https://ibookstore.suss.edu.sg/
Tableau Desktop https://www.tableau.com/products/trial
Tableau Tutorials https://www.tableau.com/learn/get-started/creator
Academic Calendar https://www.suss.edu.sg/docs/default-
source/contentdoc/cel/ft-2020acadcalendar.pdf