

STATISTICS FOR DECISION MAKING
 jroero
2/3/2021 QNT/275T: Statistics for Decision Making home
https://learn.zybooks.com/zybook/QNT_275T_54402574/chapter/4/print 1/40
4.1 Introduction to probability
Experiments, outcomes, and sample spaces
An experiment is a procedure that results in one out of a number of possible outcomes. An outcome is the result of an experiment. Ex: Rolling a six-sided die is an experiment, and the number of dots displayed is an outcome. The set of all possible outcomes is called the sample space of the experiment and is denoted S. Ex: The sample space of a six-sided die roll is S = {1, 2, 3, 4, 5, 6}.
PARTICIPATION ACTIVITY 4.1.1: Experiments, outcomes, and sample spaces.
Example 4.1.1: Experiments, outcomes, and sample space.
A standard deck of playing cards contains 52 cards. Each card has a rank of 2, 3, 4, 5, 6, 7, 8, 9, 10, J (for jack), Q (for queen), K (for king), or A (for ace). Each card also has a suit of spades (♠), clubs (♣), hearts (♥), or diamonds (♦). Spades and clubs are black cards, and hearts and diamonds are red cards. The cards in a standard deck are shown below.
Animation captions:
1. Rolling a six-sided die is an experiment that results in 1, 2, 3, 4, 5, or 6. 2. A roll of 1 is an experiment and the result 1 is an outcome. A different roll of 3 is an
experiment, and the result 3 is an outcome. 3. The sample space is the set of all possible outcomes.
©zyBooks 02/03/21 13:11 922949 Julio Romero
QNT_275T_54402574
©zyBooks 02/03/21 13:11 922949 Julio Romero
QNT_275T_54402574
2/3/2021 QNT/275T: Statistics for Decision Making home
https://learn.zybooks.com/zybook/QNT_275T_54402574/chapter/4/print 2/40
A person draws a random card from the deck. The card drawn is the 3 of spades.
a. Is drawing a random card from the deck an experiment or an outcome? b. Is drawing the 3 of spades an experiment or an outcome? c. What is the size of the sample space of this experiment?
Solution
a. The act of drawing a random card is an experiment. The experiment can be repeated many times, each time with a potentially different outcome from drawing the 3 of spades.
b. Drawing the 3 of spades is one of many possible outcomes of the experiment. Repeating the experiment may result in a different card being drawn, which would be a different outcome.
c. Since one of 52 different cards could be drawn each time the experiment is performed, the sample space contains 52 outcomes, one for each card in the deck.
PARTICIPATION ACTIVITY 4.1.2: Experiments, outcomes, and sample spaces.
1) A 6-sided die is rolled and the number of dots displayed is recorded. Is the roll of the die an experiment or an outcome?
2) A 6-sided die is rolled and the number of dots displayed is recorded. 4 dots are displayed. Is the 4 dots being displayed an experiment or an outcome?
3) An experiment of rolling a die is repeated 3 times. The experiments result in the 3 outcomes 2, 4, and 5. Do the three outcomes represent the sample space?
Source: English pattern playing cards deck (Dmitry Fomin / CC0 1.0 via Wikimedia Commons) 1
an experiment
an outcome
an experiment
an outcome
Yes
©zyBooks 02/03/21 13:11 922949 Julio Romero
QNT_275T_54402574
©zyBooks 02/03/21 13:11 922949 Julio Romero
QNT_275T_54402574
2/3/2021 QNT/275T: Statistics for Decision Making home
https://learn.zybooks.com/zybook/QNT_275T_54402574/chapter/4/print 3/40
4) A 6-sided die is rolled. Is the sample space {1, 2, 3, 4, 5, 6}?.
5) An experiment involves �ipping two coins. Two coins are �ipped, and heads is observed on the �rst coin and tails on the second coin, represented as HT. Is HT an outcome of this experiment?
6) An experiment involves �ipping two coins. Two coins are �ipped, and the outcome HT is observed. Is the sample space {H, T}?
Events
A subset of the sample space is called an event. Ex: For a die roll, the event A is rolling an even number. The event A = {2, 4, 6} is a subset of the sample space {1, 2, 3, 4, 5, 6}.
A compound event is a subset of the sample space consisting of more than one outcome. Ex: The event A = {2, 4, 6} is a compound event since rolling an even number consists of three outcomes.
A simple event is a subset with a single outcome. Ex: The event C is rolling a 5 on the die. Thus, C = {5} is a simple event because C contains only one outcome.
Example 4.1.2: Simple and compound events.
A 6-sided die is rolled. For each of the following events, list the possible outcomes, and whether the event is simple or compound.
a. A 5 is rolled. b. A number less than 5 is rolled. c. An even number is rolled. d. An even prime number is rolled. e. A number is rolled.
No
Yes
No
Yes
No
Yes
No
©zyBooks 02/03/21 13:11 922949 Julio Romero
QNT_275T_54402574
©zyBooks 02/03/21 13:11 922949 Julio Romero
QNT_275T_54402574
2/3/2021 QNT/275T: Statistics for Decision Making home
https://learn.zybooks.com/zybook/QNT_275T_54402574/chapter/4/print 4/40
a. The event contains only one outcome and is {5}. Since the event has only one outcome, the event is a simple event.
b. The event contains four outcomes and is {1, 2, 3, 4}. Since the event has more than one outcome, the event is a compound event.
c. The event is {2, 4, 6}. Since the event has more than one outcome, the event is a compound event.
d. The only even prime number is 2, so the event is {2}. Since the event has only one outcome, the event is a simple event.
e. A number will always be rolled, so the event contains all outcomes in the sample space, or {1, 2, 3, 4, 5, 6}. Since the event has more than one outcome, the event is a compound event.
PARTICIPATION ACTIVITY 4.1.3: Events.
1) The event B is rolling less than a 3 on a six-sided die. B is best described as _____ .
2) Noah conducts an experiment by �ipping a coin twice. The sample space for this experiment is {HH, HT, TH, TT}. Which of the following is a simple event?
3) A gym teacher de�nes an experiment to be running a mile race three times in gym class. Sue runs the mile three times. Sue's fastest time was 6:10. This time can best be described as _____ .
a simple event
a compound event
not an event
Noah �ips two heads.
Noah �ips one heads and one tails.
Since Noah is �ipping the coin twice, no simple events can exist.
©zyBooks 02/03/21 13:11 922949 Julio Romero
QNT_275T_54402574
©zyBooks 02/03/21 13:11 922949 Julio Romero
QNT_275T_54402574
2/3/2021 QNT/275T: Statistics for Decision Making home
https://learn.zybooks.com/zybook/QNT_275T_54402574/chapter/4/print 5/40
PARTICIPATION ACTIVITY 4.1.4: Experiments.
Researchers sought to learn how many calories were expended by students in a typical school day. The researchers placed calorie measuring devices on children during school hours for a school day and then read the displayed value for each child. Possible calorie expenditure readings for one measuring device were integers from 1 to 5000 calories.
Placing a calorie measuring device on a child for a day and then reading the device value.
1200
1, 2, 3, …, 4999, 5000
A "low" calorie expenditure de�ned as fewer than 800 calories.
Probability
Probability is a measure of how likely an event is to occur. The probability of an event A is denoted P(A), and is the sum of the probabilities of each outcome in the event.
One de�nition of probability is the number of desired outcomes divided by the total number of outcomes in the sample space, assuming that all outcomes are equally likely. Ex: If a (fair) coin is �ipped, the probability that the coin turns up heads is 1 desired outcome of heads divided by 2
outcomes in the sample space (heads and tails), or 1 2 .
However, the size of the sample space often cannot be counted or determined in a practical way, or the different outcomes are not equally likely. Thus, another de�nition of probability is the relative frequency of the desired outcome, or the proportion of times the outcome will occur when an
a simple event
a compound event
not an event
Event Sample space Experiment Outcome
Reset
©zyBooks 02/03/21 13:11 922949 Julio Romero
QNT_275T_54402574
©zyBooks 02/03/21 13:11 922949 Julio Romero
QNT_275T_54402574
2/3/2021 QNT/275T: Statistics for Decision Making home
https://learn.zybooks.com/zybook/QNT_275T_54402574/chapter/4/print 6/40
experiment is repeated an in�nite number of times. Ex: If a coin is �ipped many times, the frequency
of heads will approach 1 2 over time. Thus, the probability of heads is
1 2 . Ex: If the frequency of red hair
in a population is 0.17, and the experiment of selecting a random person from the population is performed many times, the probability that a person with red hair is selected will approach 0.17.
PARTICIPATION ACTIVITY 4.1.5: Calculating the probability of a compound event.
Example 4.1.3: Probability with equally likely outcomes.
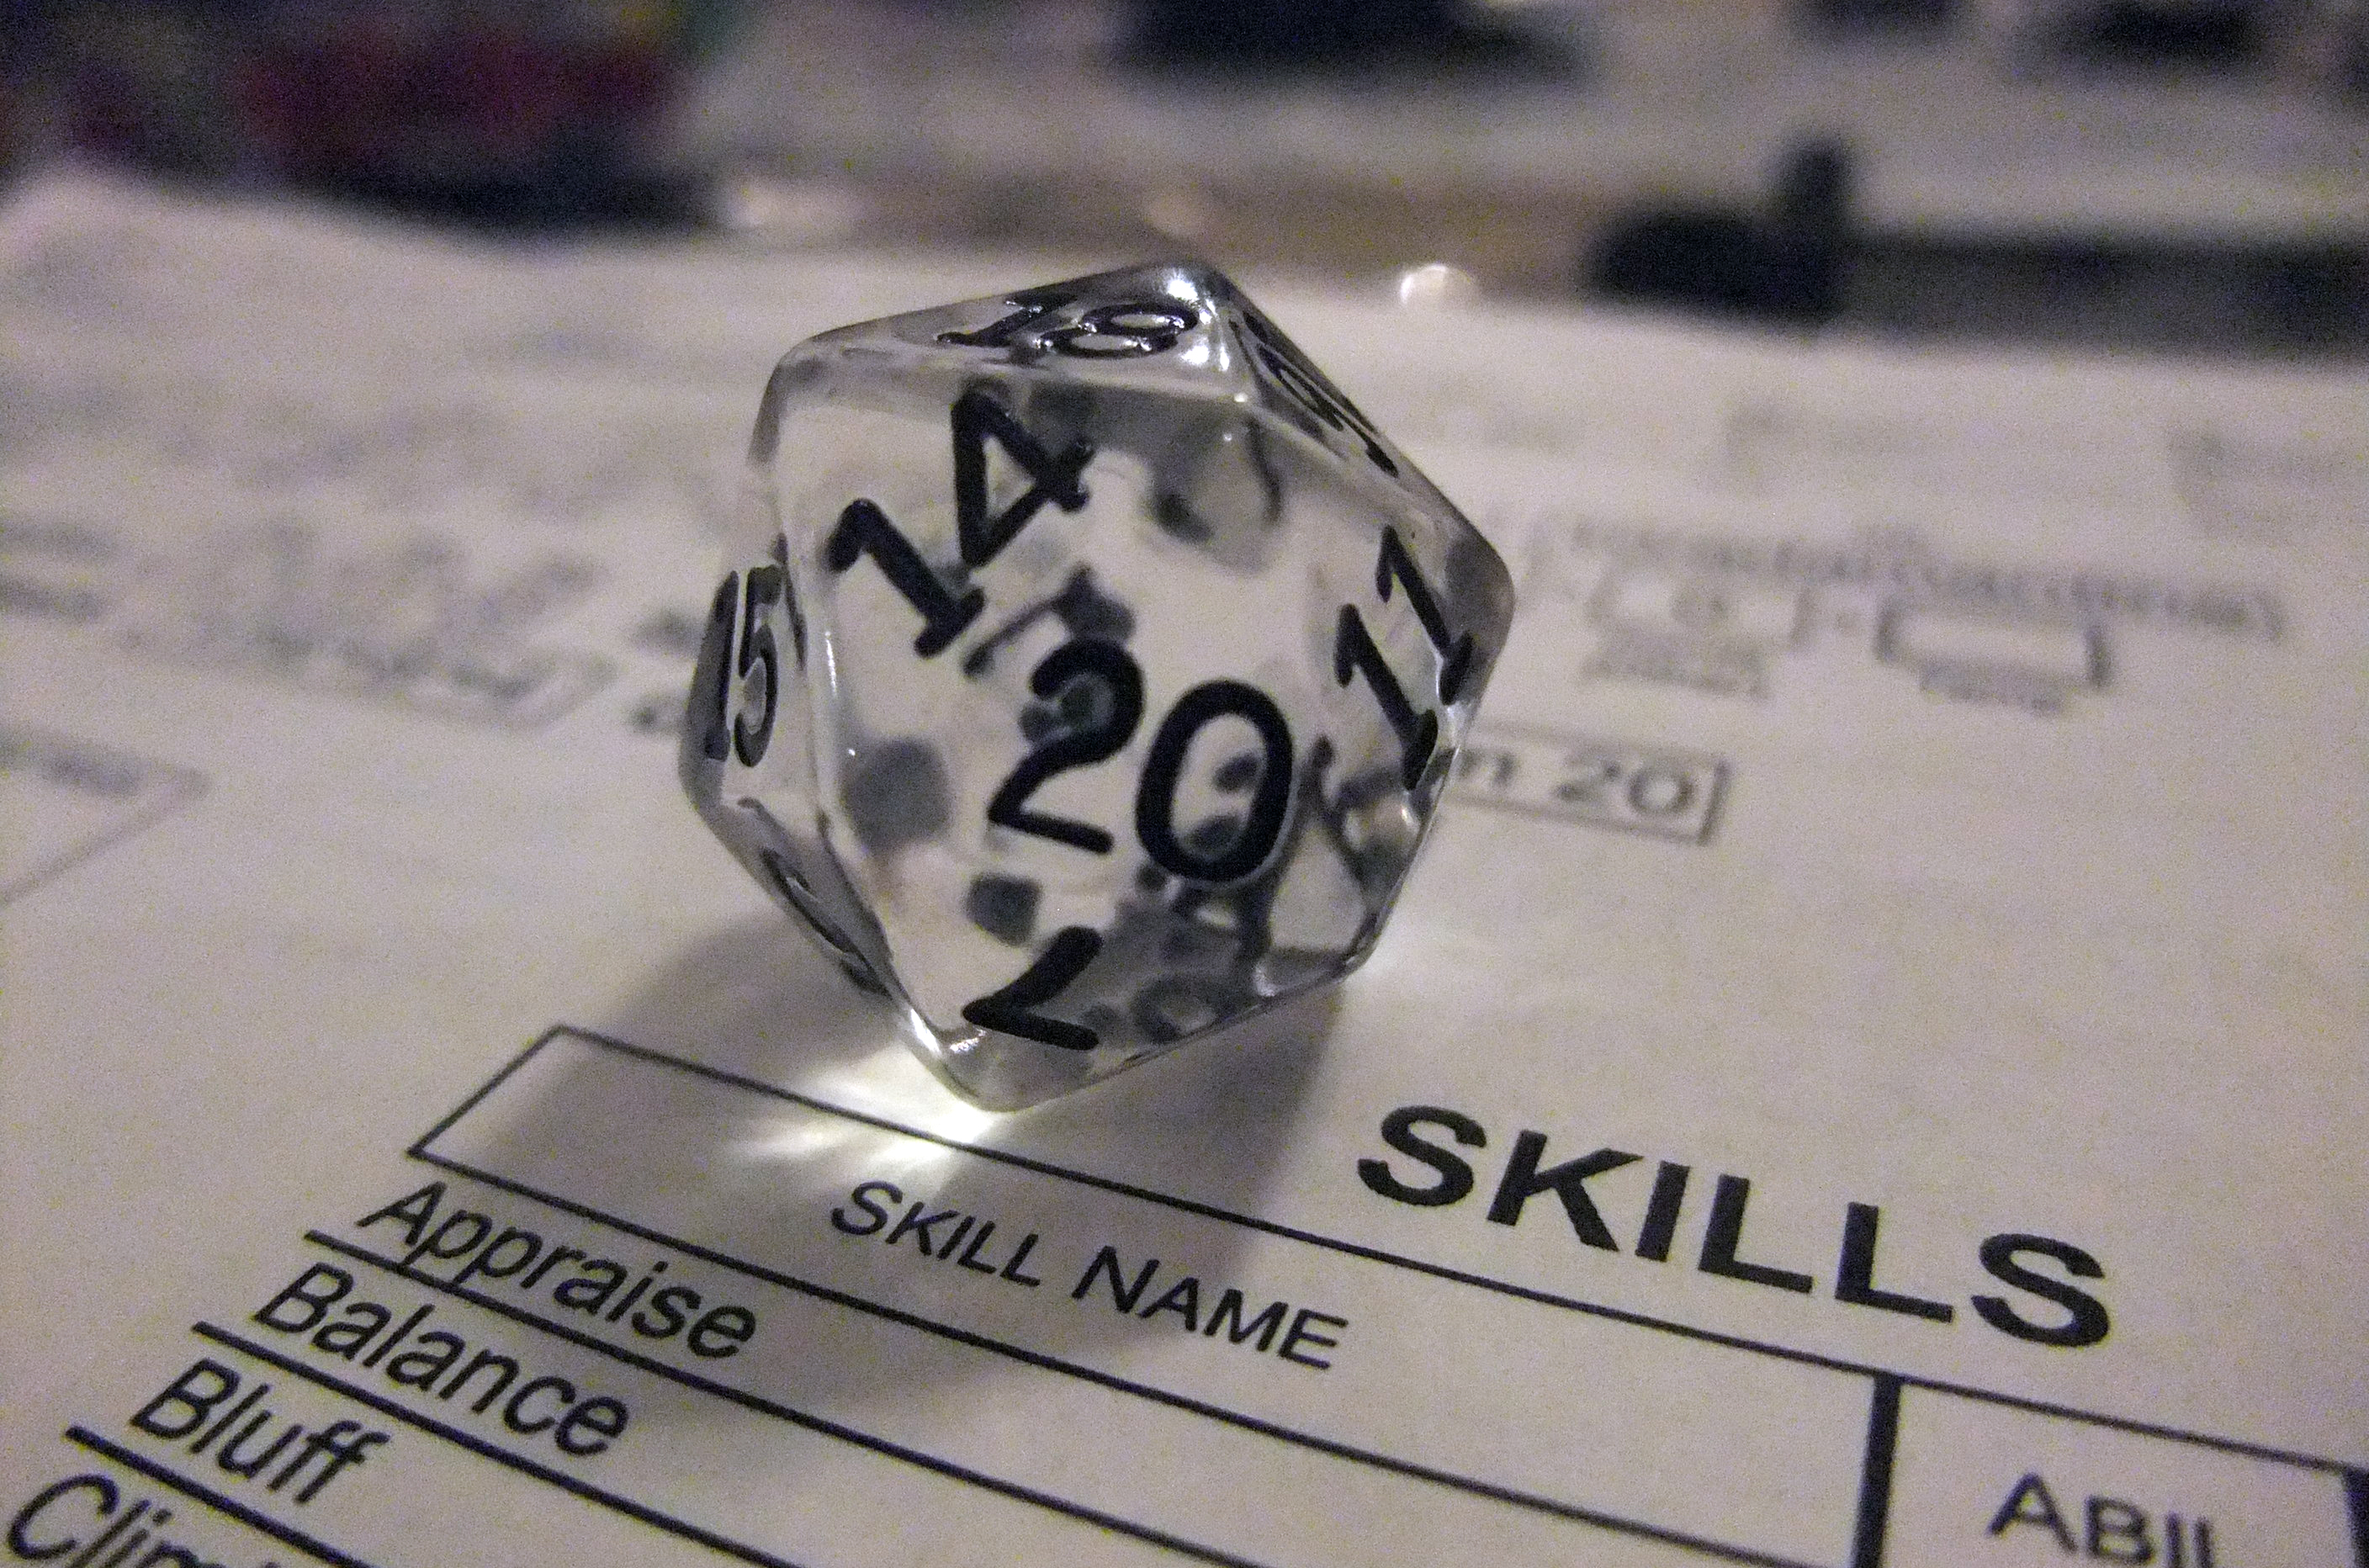
In many pen-and-paper role-playing games, a 20-sided die (or d20), shown below, is used to determine the success or failure of actions in the game. Each side of the d20 is labeled with a number from 1 to 20.
a. A player critically fails a certain action if a 1, 2, or 3 is rolled. Assuming a fair d20, what is the probability of critical failure?
b. What is the probability that the player avoids a critical failure?
Animation content:
undefined
Animation captions:
1. To �nd the probability of an event, the outcomes in the event should �rst be identi�ed. 2. Since the die is fair, each of the six numbers is equally likely, and the probability of each
number is 1 6 .
3. The probability of an event is the sum of the probabilities of the outcomes in the event.
Source: D20 (4510874033) (janet galore / CC-BY-2.0 via Wikimedia Commons) 2
©zyBooks 02/03/21 13:11 922949 Julio Romero
QNT_275T_54402574
©zyBooks 02/03/21 13:11 922949 Julio Romero
QNT_275T_54402574
2/3/2021 QNT/275T: Statistics for Decision Making home
https://learn.zybooks.com/zybook/QNT_275T_54402574/chapter/4/print 7/40
Solution
a. Since the d20 is fair, the probability of each number is equally likely. Thus,
P(1) = P(2) = P(3) = 1
20 . The probability of critical failure is the sum of the probabilities
of the outcomes 1, 2, and 3, or P(1) + P(2) + P(3) = 1
20 + 1
20 + 1
20 = 3
20 . b. Rolling any number 4 or greater avoids critical failure. 17 such numbers can be rolled
(4, 5, 6, …, 20). Thus, the probability of avoiding critical failure is
P(4) + P(5) + ⋯ + P(20) = 17 1
20 = 17 20 .
PARTICIPATION ACTIVITY 4.1.6: Probability with equally likely outcomes.
The same role-playing game also uses 10-sided dice, or d10. Each side of the d10 is labeled with a number from 1 to 10.
1) A player succeeds at an action if a 9 or 10 is rolled. Assuming a fair d10, what is the probability of success? Type as: #.#
2) What is the probability that the player fails? Type as: #.#
( )
Source: White RPG dice including a d4, d6, d8, d10, d12, and a d20 (modi�ed) (Veikk0.ma / CC-BY-SA-4.0 via Wikimedia
Commons) 3
Check Show answer
©zyBooks 02/03/21 13:11 922949 Julio Romero
QNT_275T_54402574
©zyBooks 02/03/21 13:11 922949 Julio Romero
QNT_275T_54402574
2/3/2021 QNT/275T: Statistics for Decision Making home
https://learn.zybooks.com/zybook/QNT_275T_54402574/chapter/4/print 8/40
Unlike �ipping a coin or rolling a die, the probability of each outcome need not be the same.
Example 4.1.4: Probability with outcomes that are not equally likely.
The relative frequencies of the eight major human blood types in the United States are given below.
Blood type Frequency
O+ 0.38
O- 0.07
A+ 0.34
A- 0.06
B+ 0.09
B- 0.02
AB+ 0.03
AB- 0.01
a. What is the probability that a randomly selected American has a blood type of O+? b. What is the probability that a randomly selected American has a blood type of either O+ or O-? c. What is the probability that a randomly selected American does not have blood type O?
Solution
a. The event of randomly selecting an O+ American has only one outcome, O+. The probability is P(O + ) = 0.38.
b. The event of randomly selecting an O+ or O- American has two outcomes, O+ and O-. The probability is P(O + ) + P(O − ) = 0.38 + 0.07 = 0.45.
c. The event of randomly selecting an American who is not type O has six outcomes, A+, A-, B+, B AB+, and AB-. The probability is P(A + ) + P(A − ) + P(B + ) + P(B − ) + P(AB + ) + P(AB − ) = 0.34 + 0.06 + 0.09 + 0.02 + 0.03 + 0.0 .
Check Show answer
Source: San Diego Blood Bank 4
©zyBooks 02/03/21 13:11 922949 Julio Romero
QNT_275T_54402574
©zyBooks 02/03/21 13:11 922949 Julio Romero
QNT_275T_54402574
2/3/2021 QNT/275T: Statistics for Decision Making home
https://learn.zybooks.com/zybook/QNT_275T_54402574/chapter/4/print 9/40
PARTICIPATION ACTIVITY 4.1.7: Probability with outcomes that are not equally likely.
Flower color in a certain plant is controlled by a gene with two alleles, or variants, called A and a. Every plant has two alleles that make up the genotype, or genetic composition. In turn, the plant's genotype determines the plant's phenotype, or outward appearance.
In a certain garden, the genotype and phenotype frequencies of this plant are as follows.
Genotype Phenotype Frequency
AA Purple �owers 0.49
Aa Purple �owers 0.42
aa White �owers 0.09
1) A �ower is chosen at random from the garden. What is the probability that the �ower is purple? Type as: #.##
2) A �ower is chosen at random from the garden. What is the probability that the �ower carries at least one a allele? Type as: #.##
Challenge activities
CHALLENGE ACTIVITY 4.1.1: Probability of an event.
Check Show answer
Check Show answer
Start
Two dice are rolled. Enter the size of the set that corresponds to the event that one die is even and the other is odd.
Ex: 8
©zyBooks 02/03/21 13:11 922949 Julio Romero
QNT_275T_54402574
©zyBooks 02/03/21 13:11 922949 Julio Romero
QNT_275T_54402574
2/3/2021 QNT/275T: Statistics for Decision Making home
https://learn.zybooks.com/zybook/QNT_275T_54402574/chapter/4/print 10/40
References
(*1) Fomin, Dmitry. "English pattern playing cards deck" Wikimedia Commons. 13 June 2019, https://upload.wikimedia.org/wikipedia/commons/thumb/8/81/English_pattern_playing_cards_deck.sv English_pattern_playing_cards_deck.svg.png.
(*2) janet galore. "D20 (4510874033)" Wikimedia Commons. 13 June 2019, https://upload.wikimedia.org/wikipedia/commons/d/d8/D20_%284510874033%29.jpg.
(*3) Veikk0.ma. "White RPG dice including a d4, d6, d8, d10, d12, and a d20" (modi�ed) Wikimedia Commons. 13 June 2019, https://upload.wikimedia.org/wikipedia/commons/b/b8/White_RPG_dice_including_a_d4%2C_d6%2C_
(*4) San Diego Blood Bank. "What is the Most Common Blood Type?" San Diego Blood Bank. 13 June 2019, https://www.sandiegobloodbank.org/what-most-common-blood-type .
2 3
Check Next
4.2 Addition rule and complements
Events as sets
Events are sets of outcomes and subsets of the sample space. Thus, the terminology and notation of sets can be used to describe events and outcomes.
A sample space and sets of events in the sample space can be represented visually with a Venn diagram. In a Venn diagram, the sample space is represented by a rectangle. Every outcome appears inside the rectangle. An event is represented by a circle enclosing the outcomes in that event. Events with outcomes in common are represented as overlapping circles.
Example 4.2.1: Constructing a Venn diagram.
A 6-sided die is rolled. Let A be the event a number less than 4 is rolled. Let B be the event an odd number is rolled. Construct the Venn diagram for these events.
Solution
1
©zyBooks 02/03/21 13:11 922949 Julio Romero
QNT_275T_54402574
©zyBooks 02/03/21 13:11 922949 Julio Romero
QNT_275T_54402574
2/3/2021 QNT/275T: Statistics for Decision Making home
https://learn.zybooks.com/zybook/QNT_275T_54402574/chapter/4/print 11/40
The sample space S = {1, 2, 3, 4, 5, 6} contains all 6 outcomes of rolling the die. A contains the three outcomes 1, 2, and 3 and B contains the three outcomes 1, 3, and 5. Outcomes 1 and 3 are common to both A and B. Outcome 2 is in A but not B, and outcome 5 is in B but not A. Outcomes 4 and 6 are in the sample space but in neither A nor B. Thus, the Venn diagram is as follows.
PARTICIPATION ACTIVITY 4.2.1: Using a Venn diagram to represent events.
Each of the following Venn diagrams represent events when rolling a 6-sided die. Match each Venn diagram with the correct event descriptions.
©zyBooks 02/03/21 13:11 922949 Julio Romero
QNT_275T_54402574
©zyBooks 02/03/21 13:11 922949 Julio Romero
QNT_275T_54402574
2/3/2021 QNT/275T: Statistics for Decision Making home
https://learn.zybooks.com/zybook/QNT_275T_54402574/chapter/4/print 12/40
A is the event of rolling a number less than 4. B is the event of rolling a number greater than 2.
A is the event of rolling a number greater than 3 B is the event of rolling an odd number.
A is the event of rolling a number less than 5. B is the event of rolling an even number.
A is the event of rolling an even number less than 5. B is the event of rolling a number less than 3.
Union, intersection, and complement
Several set operations are used frequently in probability.
The union of two events A and B is denoted A ∪ B and is the event that includes outcomes in A or B or both.
Figure 4.2.1: Venn diagram of A ∪ B.
(b) (c) (d) (a)
Reset
©zyBooks 02/03/21 13:11 922949 Julio Romero
QNT_275T_54402574
©zyBooks 02/03/21 13:11 922949 Julio Romero
QNT_275T_54402574
2/3/2021 QNT/275T: Statistics for Decision Making home
https://learn.zybooks.com/zybook/QNT_275T_54402574/chapter/4/print 13/40
The intersection of two events A and B is denoted A ∩ B and is the event consisting of outcomes that are in both A and B.
Figure 4.2.2: Venn diagram of A ∩ B.
The complement of an event A is denoted ¯ A and is the event consisting of outcomes that are not in A.
Figure 4.2.3: Venn diagram of ¯ A.
©zyBooks 02/03/21 13:11 922949 Julio Romero
QNT_275T_54402574
©zyBooks 02/03/21 13:11 922949 Julio Romero
QNT_275T_54402574
2/3/2021 QNT/275T: Statistics for Decision Making home
https://learn.zybooks.com/zybook/QNT_275T_54402574/chapter/4/print 14/40
The empty set is the event consisting of no outcomes. Ex: A coin is tossed. The intersection of the event of the coin coming up heads and the event of the coin coming up tails is the empty set because no outcomes exist where the coin comes up both heads and tails. In other words, a coin cannot come up both heads and tails at the same time.
Example 4.2.2: Union, intersection, and complement.
An integer between 1 and 10 (inclusive) is selected at random. Let A be the event a number greater than 5 is selected, B be the event that a number smaller than 5 is selected, and C be the event an even number is selected.
a. What is the sample space? b. What is A ∩ C? c. What is A ∪ C? d. What is A ∩ B? e. What is A ∪ B?
f. What is ¯ A?
Solution
a. The sample space is all of the integers between 1 and 10 inclusive, or {1, 2, 3, 4, 5, 6, 7, 8, 9, 10}.
b. A ∩ C is the set of outcomes in the sample space that are both greater than 5 and even, or {6, 8, 10}.
©zyBooks 02/03/21 13:11 922949 Julio Romero
QNT_275T_54402574
©zyBooks 02/03/21 13:11 922949 Julio Romero
QNT_275T_54402574
2/3/2021 QNT/275T: Statistics for Decision Making home
https://learn.zybooks.com/zybook/QNT_275T_54402574/chapter/4/print 15/40
c. A ∪ C is the set of outcomes in the sample space that are either greater than 5 or even or both, or {2, 4, 6, 7, 8, 9, 10}.
d. Since a number cannot be both greater than 5 and less than 5, A ∩ B has no outcomes and is the empty set ∅.
e. A ∪ B is the set of outcomes in the sample space that are either greater than 5 or less than 5, or {1, 2, 3, 4, 6, 7, 8, 9, 10}.
f. ¯ A is the set of outcomes in the sample space that does not include the outcomes of A.
Since A = {6, 7, 8, 9, 10}, ¯ A = {1, 2, 3, 4, 5}.
PARTICIPATION ACTIVITY 4.2.2: Union, intersection, and complement.
A 6-sided die is rolled. Let A be the event that an odd number is rolled, B be the event that the numbers 1, 2, or 3 is rolled, and C be the event that an even number is rolled. Match each set of outcomes with the correct expression.
{1, 3}
{1, 2, 3, 5}
{1, 2, 3, 4, 6}
{4, 5, 6}
∅
Mutually exclusive events
Two events A and B are mutually exclusive if A ∩ B = ∅, that is, A and B have no outcomes in common. Ex: A coin is tossed. The event of the coin coming up heads and the event of the coin coming up tails are mutually exclusive because the coin cannot come up both heads and tails at the same time.
A ∩ C B ∪ C A ∩ B A ∪ B ¯ B
Reset
©zyBooks 02/03/21 13:11 922949 Julio Romero
QNT_275T_54402574
©zyBooks 02/03/21 13:11 922949 Julio Romero
QNT_275T_54402574
2/3/2021 QNT/275T: Statistics for Decision Making home
https://learn.zybooks.com/zybook/QNT_275T_54402574/chapter/4/print 16/40
Mutually exclusive events are represented by non-overlapping circles in a Venn diagram.
Figure 4.2.4: Venn diagram of mutually exclusive events A and B.
Example 4.2.3: Mutually exclusive events.
An integer between 1 and 10 (inclusive) is selected at random. Let A be the event a number greater than 5 is selected, B be the event that a number smaller than 5 is selected, and C be the event an even number is selected.
a. Are events A and B mutually exclusive? b. Are events B and C mutually exclusive?
c. Are events A and ¯ A mutually exclusive?
Solution
a. A number cannot be both greater than 5 and less than 5. Therefore, A ∩ B = ∅, and A and B are mutually exclusive.
b. Since B = {1, 2, 3, 4} and C = {2, 4, 6, 8, 10}, B ∩ C = {2, 4}, and B and C are not mutually exclusive.
c. Since A = {6, 7, 8, 9, 10} and ¯ A = {1, 2, 3, 4, 5}, A and
¯ A have no outcomes in common
and are mutually exclusive. In general, an event and the complement of that event are mutually exclusive.
©zyBooks 02/03/21 13:11 922949 Julio Romero
QNT_275T_54402574
©zyBooks 02/03/21 13:11 922949 Julio Romero
QNT_275T_54402574
2/3/2021 QNT/275T: Statistics for Decision Making home
https://learn.zybooks.com/zybook/QNT_275T_54402574/chapter/4/print 17/40
PARTICIPATION ACTIVITY 4.2.3: Identifying mutually exclusive events.
Given each description, select the pair of events A and B that are mutually exclusive.
1) A 6-sided die is rolled.
2) A card from a standard 52-card deck of playing cards is drawn.
3) A coin is �ipped �ve times. Ex: HTHTH means that the �ve �ips are heads, tails, heads, tails, and heads, in that order.
A is the event of rolling a number less than 5. B is the event of rolling a number greater than 3.
A is the event of rolling a number greater than 5. B is the event of rolling a number less than 3.
A is the event of rolling an even number. B is the event of rolling a prime number.
A is the event of drawing a 5. B is the event of drawing a club.
A is the event of drawing a club. B is the event of drawing a black card.
A is the event of drawing a club. B is the event of drawing a spade.
A is the event that the �rst �ip comes up heads. B is the event that the last �ip comes up tails.
A is the event that the �rst two �ips come up heads. B is the event that the last two �ips come up tails.
©zyBooks 02/03/21 13:11 922949 Julio Romero
QNT_275T_54402574
©zyBooks 02/03/21 13:11 922949 Julio Romero
QNT_275T_54402574
2/3/2021 QNT/275T: Statistics for Decision Making home
https://learn.zybooks.com/zybook/QNT_275T_54402574/chapter/4/print 18/40
The axioms of probability
Probability has three fundamental properties, or axioms.
The axioms of probability
Let A and B be mutually exclusive events in the sample space S.
1. 0 ≤ P(A) ≤ 1 2. P(S) = 1 3. P(A ∪ B) = P(A) + P(B)
The smallest possible probability is 0 when an outcome never occurs, 1 when an outcome always occurs. Thus, axiom 1 states the probability of an event must be between 0 and 1, inclusive.
An outcome in the sample space must always occur in the long run. Thus, axiom 2 states that the probability of an outcome in the sample space is 1.
Individual outcomes are mutually exclusive events, so all events are unions of mutually exclusive events. Thus, axiom 3 implies that the long-term proportion that each of the outcomes in an event occurs is the sum of the probabilities of each outcome.
The axioms of probability can be used to prove some properties of probability.
Example 4.2.4: Probability of the empty set.
Use the axioms of probability to show that P(∅) = 0.
Solution
The empty set ∅ is the event of no outcomes and the sample space S is the event of every outcome. Thus, ∅ and S are mutually exclusive. Also, since S includes every outcome, S ∪ ∅ = S. By axiom 3, P(S ∪ ∅) = P(S) = P(S) + P(∅). By axiom 2, P(S) = 1. Thus, 1 = 1 + P(∅), and P(∅) = 0.
A is the event that the �rst three �ips come up heads. B is the event that the last three �ips come up tails.
©zyBooks 02/03/21 13:11 922949 Julio Romero
QNT_275T_54402574
©zyBooks 02/03/21 13:11 922949 Julio Romero
QNT_275T_54402574
2/3/2021 QNT/275T: Statistics for Decision Making home
https://learn.zybooks.com/zybook/QNT_275T_54402574/chapter/4/print 19/40
PARTICIPATION ACTIVITY 4.2.4: The axioms of probability.
Let A be an event in the sample space S.
1) P(A) > 1
2) P(A) < 0
The complement rule
The axioms of probability have two important consequences, which are the complement rule and the addition rule of probability. The complement rule relates the probability of an event to the probability of the complement of the event.
Theorem 4.2.1: The complement rule.
For any event A, if the probability of A is P(A), the probability of ¯ A is P(
¯ A) = 1 − P(A).
Proof.
By de�nition of complement, A and ¯ A are mutually exclusive, and A ∪
¯ A = S. By axiom 3,
P(A) + P( ¯ A) = P(S). By axiom 2, P(S) = 1. Thus, P(A) + P(
¯ A) = 1. Rearranging gives
P( ¯ A) = 1 − P(A). ■
PARTICIPATION ACTIVITY 4.2.5: The complement rule.
True
False
True
False
Animation content:
undefined
Animation captions:
©zyBooks 02/03/21 13:11 922949 Julio Romero
QNT_275T_54402574
©zyBooks 02/03/21 13:11 922949 Julio Romero
QNT_275T_54402574
2/3/2021 QNT/275T: Statistics for Decision Making home
https://learn.zybooks.com/zybook/QNT_275T_54402574/chapter/4/print 20/40
If the complement of an event can be inferred from the description of the event, the probability of the complement can be calculated using the complement rule, as the following example illustrates.
Example 4.2.5: Applying the complement rule.
The San Francisco Bridges and the Mississauga Dinosaurs are competing for a basketball championship decided by a best-of-7 series, meaning that the �rst team to win 4 games wins the championship. Sports experts predict a probability of 0.744 for the Bridges to sweep the series, meaning that the Bridges win 4 games in a row and the Dinosaurs do not win any games.
Let A be the event that the Bridges sweep the series.
a. What is P(A)?
b. What is ¯ A?
c. What is P( ¯ A), and what is the interpretation of this probability?
Solution
a. Since the probability of the Bridges sweeping the series is 0.744, P(A) = 0.744. b. The sample space consists of outcomes in which the Dinosaurs win 0, 1, 2, 3, or 4
games. Since A is the event that the Dinosaurs win 0 games, the complement of A is
the event that the Dinosaurs win 1, 2, 3, or 4 games. In other words, ¯ A is the event that
the Dinosaurs win at least one game, that is, the Bridges do not sweep the series.
c. By the complement rule, P( ¯ A) = 1 − P(A) = 1 − 0.744 = 0.256. P(
¯ A) is the probability that
the Dinosaurs win at least one game in the series.
PARTICIPATION ACTIVITY 4.2.6: Applying the complement rule.
In a certain city, 17% of residents own a house, 48% of residents own a car, and 42% of residents own neither a house nor a car. Let A be the event that a randomly selected resident
1. The union of A and ¯ A is the sample space S.
2. Since A and ¯ A are mutually exclusive, P(A) + P(
¯ A) = P(S), by axiom 3.
3. By axiom 2, P(S) = 1. Thus, P(A) + P( ¯ A) = 1.
4. Rearranging gives the complement rule P( ¯ A) = 1 − P(A).
©zyBooks 02/03/21 13:11 922949 Julio Romero
QNT_275T_54402574
©zyBooks 02/03/21 13:11 922949 Julio Romero
QNT_275T_54402574
2/3/2021 QNT/275T: Statistics for Decision Making home
https://learn.zybooks.com/zybook/QNT_275T_54402574/chapter/4/print 21/40
from the city owns a house and B be the event that a randomly selected resident from the city owns a car.
1) What is the probability that a resident does not own a house?
2) What is the probability that a resident does not own a car?
3) What is the probability that a resident owns a car, a house, or both?
The addition rule
The addition rule generalizes axiom 3 to events that are not mutually exclusive.
Theorem 4.2.2: The addition rule.
For any events A and B, P(A ∪ B) = P(A) + P(B) − P(A ∩ B).
Proof.
P(A ∪ B) = P(A ∩ ¯ B) + P(A ∩ B) + P(
¯ A ∩ B)
= P(A ∩ ¯ B) + P(A ∩ B) + P(
¯ A ∩ B) + P(A ∩ B) − P(A ∩ B)
= [P(A ∩ ¯ B) + P(A ∩ B)] + [P(
¯ A ∩ B) + P(A ∩ B)] − P(A ∩ B)
= P(A) + P(B) − P(A ∩ B)
■
If A and B are mutually exclusive, then A ∩ B = ∅, P(A ∩ B) = 0, and the addition rule reduces to axiom 3.
Check Show answer
Check Show answer
Check Show answer
©zyBooks 02/03/21 13:11 922949 Julio Romero
QNT_275T_54402574
©zyBooks 02/03/21 13:11 922949 Julio Romero
QNT_275T_54402574
2/3/2021 QNT/275T: Statistics for Decision Making home
https://learn.zybooks.com/zybook/QNT_275T_54402574/chapter/4/print 22/40
PARTICIPATION ACTIVITY 4.2.7: The addition rule.
Example 4.2.6: Applying the addition rule.
A card is drawn from a standard deck of 52 playing cards. Let A be the event that a 5 is drawn, and let B be the event that a heart is drawn.
a. What are P(A) and P(B)? b. Are A and B mutually exclusive events? c. What is P(A ∩ B)? d. What is P(A ∪ B)?
Solution
a. Of the 52 cards in the deck, 4 cards are 5s. Thus, the probability of drawing a 5 is
P(A) = 4
52 = 1
13 . Similarly, 13 cards are hearts, so the probability of drawing a heart is
P(B) = 13 52 =
1 4 .
b. Since drawing the 5 of hearts is an outcome in both A and B, A and B are not mutually exclusive events.
c. A ∩ B is the event of drawing a card that is both a 5 and a heart, that is, drawing the
single 5 of hearts in the deck. Thus, P(A ∩ B) = 1
52 .
d. P(A ∪ B) is the event of drawing either a 5 or a heart, or both. Since A and B are not mutually exclusive, the addition rule is used.
Animation content:
undefined
Animation captions:
1. Let events A and B be non-mutually exclusive events. 2. Event A has probability P(A) and event B has probability P(B). 3. Adding P(A) and P(B) results in P(A ∩ B) being counted twice. 4. Subtracting P(A ∩ B) gives P(A ∪ B) for non-mutually exclusive events A and B.
©zyBooks 02/03/21 13:11 922949 Julio Romero
QNT_275T_54402574
©zyBooks 02/03/21 13:11 922949 Julio Romero
QNT_275T_54402574
2/3/2021 QNT/275T: Statistics for Decision Making home
https://learn.zybooks.com/zybook/QNT_275T_54402574/chapter/4/print 23/40
P(A ∪ B) = P(A) + P(B) − P(A ∩ B)
= 1 13
+ 1 4
− 1 52
= 16 52
= 4 13
PARTICIPATION ACTIVITY 4.2.8: Applying the addition rule.
In a certain city, 46% of residents own a house, 67% of residents own a car, and 21% of residents own both a house and a car. Let A be the event that a randomly selected resident from the city owns a house and B be the event that a randomly selected resident from the city owns a car.
1) What is the probability that a resident owns a house, a car, or both?
2) What is the probability that a resident owns neither a house nor a car?
3) What is the probability that a resident owns a house but not a car?
Check Show answer
Check Show answer
Check Show answer
4.3 Multiplication rule and independence
©zyBooks 02/03/21 13:11 922949 Julio Romero
QNT_275T_54402574
©zyBooks 02/03/21 13:11 922949 Julio Romero
QNT_275T_54402574
2/3/2021 QNT/275T: Statistics for Decision Making home
https://learn.zybooks.com/zybook/QNT_275T_54402574/chapter/4/print 24/40
Independent events
Two events are independent if the probability of one event does not affect the probability of the other. Ex: A nickel and a dime are �ipped. Whether the nickel comes up heads or tails is not affected by whether the dime comes up heads or tails. Thus, �ipping the nickel and �ipping the dime are independent events.
Example 4.3.1: Identifying independent events.
a. A coin is �ipped and a 6-sided die is rolled, separately. Let A be the event of getting tails with the coin and B be the event of getting a number less than 3 with the die. Are A and B independent events?
b. A coin is �ipped twice. Let A be the event of getting tails on the �rst �ip and B be the event of getting tails on the second �ip. Are A and B independent events?
c. A coin is �ipped twice. Let A be the event of getting heads on the second �ip and B be the event of getting tails on the second �ip. Are A and B independent events?
d. A bag contains 5 red marbles and 5 black marbles. Two marbles are picked at random from the bag without replacement. Let A be the event of picking a red marble on the �rst pick, and B be the event of picking a red marble on the second pick. Are A and B independent events?
Solution
a. Assuming that the coin and the die are not physically connected, the coin �ip will not affect the die roll and vice versa. Thus, A and B are independent events.
b. Since the outcome of the �rst �ip does not in�uence the outcome of the second �ip, A and B are independent events.
c. Since the second �ip cannot be both heads and tails, event A occurring prevents event B from occurring, and vice versa. Thus, A and B are dependent events.
d. Since a marble is removed from the bag after event A, the probability of B is changed by event A occurring. Thus, A and B are dependent events.
PARTICIPATION ACTIVITY 4.3.1: Identifying independent events.
Determine whether A and B are independent or dependent events.
1) One card is drawn from each of two decks of cards. A is the event of drawing a red card from the �rst deck.
©zyBooks 02/03/21 13:11 922949 Julio Romero
QNT_275T_54402574
©zyBooks 02/03/21 13:11 922949 Julio Romero
QNT_275T_54402574
2/3/2021 QNT/275T: Statistics for Decision Making home
https://learn.zybooks.com/zybook/QNT_275T_54402574/chapter/4/print 25/40
B is the event of drawing a red card from the second deck.
2) Two cards are drawn from the same deck of cards. The �rst card is not put back into the deck after being drawn. A is the event of drawing a red card on the �rst draw. B is the event of drawing a red card on the second draw.
3) Two cards are drawn from the same deck of cards. The �rst card is put back into the deck after being drawn. A is the event of drawing a red card on the �rst draw. B is the event of drawing a red card on the second draw.
The multiplication rule
The multiplication rule gives the probability of 2 independent events happening together.
Theorem 4.3.1: The multiplication rule.
Let A and B be independent events. The probability that both A and B occur is
P(A ∩ B) = P(A)P(B)
Independent events are different from mutually exclusive events. Mutually exclusive events are dependent events by de�nition, because if one event occurs, the other event cannot occur. However, the addition rule can be used to �nd the probability of the union of two events regardless of whether the events are independent or mutually exclusive.
Independent events
Dependent events
Independent events
Dependent events
Independent events
Dependent events
©zyBooks 02/03/21 13:11 922949 Julio Romero
QNT_275T_54402574
©zyBooks 02/03/21 13:11 922949 Julio Romero
QNT_275T_54402574
2/3/2021 QNT/275T: Statistics for Decision Making home
https://learn.zybooks.com/zybook/QNT_275T_54402574/chapter/4/print 26/40
Example 4.3.2: Applying the multiplication rule.
a. A coin is �ipped and a 6-sided die is rolled, separately. Let A be the event of getting tails with the coin and B be the event of getting a number less than 3 with the die. What is P(A ∩ B)?
b. A coin is �ipped twice. Let A be the event of getting tails on the �rst �ip and B be the event of getting tails on the second �ip. What is P(A ∩ B)?
Solution
a. Since A and B are independent events, the multiplication rule applies. P(A) = 1 2 and
P(B) = 1 3 . Thus, P(A ∩ B) = P(A)P(B) =
1 2
1 3 =
1 6 .
b. Since A and B are independent events, the multiplication rule applies. P(A) = P(B) = 1 2 .
Thus, P(A ∩ B) = P(A)P(B) = 1 2
1 2 =
1 4 .
PARTICIPATION ACTIVITY 4.3.2: Probabilities of independent and mutually exclusive events.
Let events A and B have probabilities P(A) = 0.3 and P(B) = 0.5, respectively.
1) If A and B are mutually exclusive, what is P(A ∩ B)?
2) If A and B are mutually exclusive, what is P(A ∪ B)?
3) If A and B are independent, what is P(A ∩ B)?
( )( )
( )( )
Check Show answer
Check Show answer
Check Show answer
©zyBooks 02/03/21 13:11 922949 Julio Romero
QNT_275T_54402574
©zyBooks 02/03/21 13:11 922949 Julio Romero
QNT_275T_54402574
2/3/2021 QNT/275T: Statistics for Decision Making home
https://learn.zybooks.com/zybook/QNT_275T_54402574/chapter/4/print 27/40
4) If A and B are independent, what is P(A ∪ B)?
The generalized multiplication rule
The multiplication rule can also be generalized to more than 2 independent events. Given independent events A1, A2, …, An,
P(A1 ∩ A2 ∩ …An) = P(A1)P(A2)…P(An)
Example 4.3.3: Applying the multiplication rule to more than two events.
Three 6-sided dice are rolled.
a. What is the probability that three 1s are rolled? b. What is the probability that three 1s or three 6s are rolled? c. What is the probability that at least one 1 is rolled?
Solution
Each die roll is an independent event. Thus, the multiplication rule can be applied.
a. For each die, the probability of rolling a 1 is 1 6 .
P(three 1s) = P(1 on die 1 ∩ 1 on die 2 ∩ 1 on die 3) = P(1 on die 1) ⋅ P(1 on die 2) ⋅ P(1 on die 3)
= 1 6
1 6
1 6
= 1
216
b. The event of rolling three 1s and the event of rolling three 6s are mutually exclusive events. Thus, the addition rule is used.
Check Show answer
Check Show answer
( )( )( )
©zyBooks 02/03/21 13:11 922949 Julio Romero
QNT_275T_54402574
©zyBooks 02/03/21 13:11 922949 Julio Romero
QNT_275T_54402574
2/3/2021 QNT/275T: Statistics for Decision Making home
https://learn.zybooks.com/zybook/QNT_275T_54402574/chapter/4/print 28/40
P(three 1s ∪ three 6s) = P(three 1s) + P(three 6s)
= 1
216 +
1 216
= 2
216
= 1
108
c. The complement rule is used with the multiplication rule. The complement of the event that at least one 1 is rolled is the event that no 1s are rolled. For each die, the probability
of not rolling a 1 is P(not 1) = 1 − P(1) = 1 − 1 6 =
5 6 .
P(at least one 1) = 1 − P(no 1s) = 1 − P(not 1 on die 1) ⋅ P(not 1 on die 2) ⋅ P(not 1 on die 3)
= 1 − 5 6
5 6
5 6
= 1 − 125 216
= 91 216
Thus, the probability that at least one 1 is rolled is 91
216 .
PARTICIPATION ACTIVITY 4.3.3: Applying the multiplication rule.
A basketball player is fouled in the act of shooting a three-point shot and is awarded three free throws. The player makes free throws 80% of the time. Assume that each free throw is an independent event.
1) What is the probability that the player makes all three free throws? Type as: #.###
2) What is the probability that the player
( )( )( )
Check Show answer
©zyBooks 02/03/21 13:11 922949 Julio Romero
QNT_275T_54402574
©zyBooks 02/03/21 13:11 922949 Julio Romero
QNT_275T_54402574
2/3/2021 QNT/275T: Statistics for Decision Making home
https://learn.zybooks.com/zybook/QNT_275T_54402574/chapter/4/print 29/40
misses all three free throws? Type as: #.###
3) What is the probability that the player misses at least one free throw? Type as: #.###
4) What is the probability that the player makes at least one free throw? Type as: #.###
Challenge activities
CHALLENGE ACTIVITY 4.3.1: Counting password possibilities.
Check Show answer
Check Show answer
Check Show answer
Start
Each character in a password is either a digit [0-9] or lowercase letter [a-z]. How many valid passwords are there with the given restriction(s)?
Length is 11.
2 3 4 5
Ex: 26 * 36^21 Write a as: a^bb
Check Next
1
©zyBooks 02/03/21 13:11 922949 Julio Romero
QNT_275T_54402574
©zyBooks 02/03/21 13:11 922949 Julio Romero
QNT_275T_54402574
2/3/2021 QNT/275T: Statistics for Decision Making home
https://learn.zybooks.com/zybook/QNT_275T_54402574/chapter/4/print 30/40
4.4 Introduction to random variables
Random variables
A random variable is a rule that assigns a number to every outcome in the sample space of an experiment. Ex: In the experiment of a coin toss, a random variable may assign 1 to heads and 0 to tails. A random variable is typically de�ned using a capital letter, such as X = 1 (if the coin toss yielded heads) or 0 (if the coin toss yielded tails).
Random variables can be used to model quantities that can change if an experiment is repeated.
PARTICIPATION ACTIVITY 4.4.1: De�ning a random variable.
PARTICIPATION ACTIVITY 4.4.2: Random variables.
1) A radar gun records a car's speed. A sign displays the text SPEEDING or NOT SPEEDING. The text displayed is a random variable.
2) A survey asks a participant to indicate eye color. Possible responses are blue, brown, or green. Y is assigned 1 for blue, 2 for brown, and 3 for green. Y is a random variable.
3) A survey asks a participant to indicate age. Y is assigned the value of the response, which ranges from 1 to 120. Y is a random variable.
Animation captions:
1. Flipping a coin is an experiment with the sample space {heads, tails}. 2. The outcome of a coin �ip may be de�ned by X, where X = 1 is heads and X = 0 is tails. 3. The de�nition of a random variable can be written as a conditional equation.
True
False
True
False
©zyBooks 02/03/21 13:11 922949 Julio Romero
QNT_275T_54402574
©zyBooks 02/03/21 13:11 922949 Julio Romero
QNT_275T_54402574
2/3/2021 QNT/275T: Statistics for Decision Making home
https://learn.zybooks.com/zybook/QNT_275T_54402574/chapter/4/print 31/40
4) A person observes cars that drive past. Y is assigned the car's manufacturer, which may be Ford, Chevy, Toyota, or Honda. Y is a random variable.
5) Some airports, like John Wayne Airport in California, measure noise levels when a plane �ies over houses near the airport and �ne airlines that exceed thresholds. Y is assigned 1 if a plane's measured sound exceeds 100 dB, and 0 otherwise. Y is a random variable.
6) A person wins $100 per dot on the roll of a die. Z is the amount won on a die roll. Z is a random variable.
Discrete and continuous random variables
A random variable may be discrete or continuous. A discrete random variable can take on a countable number of distinct values like the integers between 0 and 100. Ex: The possible outcomes of a die roll are 1, 2, 3, 4, 5, or 6. A continuous random variable can take on any value within a range of values like the real numbers between 0 and 1. Ex: The time used by a student to complete a timed 60-minute test is a continuous random variable with possible outcomes in the range [0, 60], such as 30.2 minutes, 33.657 minutes, 59 minutes, or 49.0000001 minutes. Continuous random variables are typically measured, while discrete random variables are typically counted.
Understanding discrete and continuous random variables is important in determining the best model for a situation. Ex: An analyst interested in modeling the average global temperature over time would use a continuous random variable. On the other hand, the number of days a particular city experiences temperatures above 90 degrees is best modeled using a discrete random variable.
PARTICIPATION ACTIVITY 4.4.3: Discrete and continuous random variables.
True
False
True
False
True
False
True
False
©zyBooks 02/03/21 13:11 922949 Julio Romero
QNT_275T_54402574
©zyBooks 02/03/21 13:11 922949 Julio Romero
QNT_275T_54402574
2/3/2021 QNT/275T: Statistics for Decision Making home
https://learn.zybooks.com/zybook/QNT_275T_54402574/chapter/4/print 32/40
Specify if the random variable is discrete or continuous.
1) X = number of red cars in a parking lot
2) D = Distance a ball is thrown
3) W = Weight of a watermelon
4) Z = Fraction of games a team wins in a 16-game football season
5) X = 1 if a person passes a driver's test and X = 0 if the person fails.
6) B = The alcohol concentration in a person's blood
7) Y = The water temperature at different ocean depths
Discrete
Continuous
Discrete
Continuous
Discrete
Continuous
Discrete
Continuous
Discrete
Continuous
Discrete
Continuous
Discrete
Continuous
4.5 Properties of discrete probability distributions
©zyBooks 02/03/21 13:11 922949 Julio Romero
QNT_275T_54402574
©zyBooks 02/03/21 13:11 922949 Julio Romero
QNT_275T_54402574
2/3/2021 QNT/275T: Statistics for Decision Making home
https://learn.zybooks.com/zybook/QNT_275T_54402574/chapter/4/print 33/40
The probability mass function of a discrete probability distribution
Random variables have many powerful uses in modeling real world situations. A probability mass function captures useful information about a discrete random variable. A probability mass function (pmf) assigns the probability that a discrete random variable is exactly equal to some value (typically depicted as a table, plot, or equation). The notation p(X = x) or p(x) is typically used for the pmf of X. The probabilities assigned in a pmf are between 0 and 1, and the total probability must sum to 1.
Example 4.5.1: The probability mass function of a discrete random variable.
An adult can be classi�ed as either underweight, normal weight, overweight, or obese. The discrete random variable W is used to model the weight classi�cation of a randomly selected person from the U.S. population. W is assigned 0 if the person is underweight, 1 if normal weight, 2 if overweight, and 3 if obese.
In recent years, 2% of the adult population of the U.S. is classi�ed as underweight, 27% as normal weight, 33% as overweight, and 38% as obese. Construct a table showing the probability mass function (pmf) of W.
Solution
The pmf of W is p(W = 0) = 0.02, p(W = 1) = 0.27, p(W = 2) = 0.33, and p(W = 3) = 0.38.
W 0 1 2 3
p(W) 0.02 0.27 0.33 0.38
PARTICIPATION ACTIVITY 4.5.1: Probability mass functions.
An experiment involves randomly selecting one review of the 100 online reviews for Joe's Restaurant. Often potential customers only read one review, so the rating for the one chosen is important. The rating corresponding to the randomly selected review ranges from 1 (worst) to 5 (best) stars. 70 raters gave 5 stars, 20 gave 4 stars, and 10 gave 3 stars for Joe's Restaurant.
1) Is the star rating, labeled S, a discrete or a continuous random variable?
a discrete random variable
a continuous random variable
©zyBooks 02/03/21 13:11 922949 Julio Romero
QNT_275T_54402574
©zyBooks 02/03/21 13:11 922949 Julio Romero
QNT_275T_54402574
2/3/2021 QNT/275T: Statistics for Decision Making home
https://learn.zybooks.com/zybook/QNT_275T_54402574/chapter/4/print 34/40
2) What is the probability that the displayed rating is 5 stars?
3) Does the table below represent an experiment, an outcome, or a probability mass function?
Stars Probability
5 0.70
4 0.20
3 0.10
2 0.00
1 0.00
4) Does the table below represent a probability mass function?
Stars Observed proportion
5 0.75
4 0.15
3 0.10
2 0.05
1 0.05
The cumulative distribution function of a probability distribution
70
0.70
0.07
an experiment
an outcome
a probability mass function
Yes
No
©zyBooks 02/03/21 13:11 922949 Julio Romero
QNT_275T_54402574
©zyBooks 02/03/21 13:11 922949 Julio Romero
QNT_275T_54402574
2/3/2021 QNT/275T: Statistics for Decision Making home
https://learn.zybooks.com/zybook/QNT_275T_54402574/chapter/4/print 35/40
Another function used to describe the probabilities for all possible outcomes of a random variable is a cumulative distribution function. The cumulative distribution function (cdf) of a discrete random variable is the probability that for any number x, the observed value of the random variable will be at most x or p(X ≤ x). Ex: When a fair die is rolled and the value facing up recorded, the cdf describes the probability of getting less than or equal to any value x such that the probability X is less than or equal to 3, that is, p(X ≤ 3) = p(1) + p(2) + p(3). The notation F(x) is typically used for the cdf of X. Ex:
F(3) = p(X ≤ 3) = 1 2 is read "the probability X is less than or equal to 3 is one half". The cdf always
starts at 0 and ends at 1 and never decreases as the value of X increases.
Example 4.5.2: The probability mass function of a discrete random variable.
An adult can be classi�ed as either underweight, normal weight, overweight, or obese. The discrete random variable W is used to model the weight classi�cation of a randomly selected person from the U.S. population. W is assigned 0 if the person is underweight, 1 if normal weight, 2 if overweight, and 3 if obese.
In recent years, 2% of the adult population of the U.S. is classi�ed as underweight, 27% as normal weight, 33% as overweight, and 38% as obese. Construct a table showing the cumulative distribution function (cdf) of W.
Solution
The pmf of W is used to �nd the cumulative distribution function. The probability that W is less than or equal to 0 is 0.02. Thus, F(0) = 0.02. F(1) is the probability a randomly selected person is underweight or normal weight, or either W = 0 or W = 1. Thus, F(1) = 0.02 + 0.27 = 0.29. The rest of the cdf is computed similarly.
W 0 1 2 3
p(W) 0.02 0.27 0.33 0.38
F(W) 0.02 0.29 0.62 1
F(W) starts at 0 for values of W < 0 and ends at 1 for values of W ≥ 3.
PARTICIPATION ACTIVITY 4.5.2: Cumulative distribution function.
Bea's Herbs and Teas offers �ve teas at a tea tasting. X is the number of teas a customer purchases after the tasting. Based on information from previous tastings, the pmf of X is
©zyBooks 02/03/21 13:11 922949 Julio Romero
QNT_275T_54402574
©zyBooks 02/03/21 13:11 922949 Julio Romero
QNT_275T_54402574
2/3/2021 QNT/275T: Statistics for Decision Making home
https://learn.zybooks.com/zybook/QNT_275T_54402574/chapter/4/print 36/40
shown below.
X 0 1 2 3 4 5
p(X) 0.05 0.1 0.2 0.15 0.2 0.3
1) What is the cdf value F(0) = p(X ≤ 0)?
2) What is the quantity that provides the probability a customer purchases no more than 3 teas?
3) What is the correct value for F(3)?
4) What is F(6)?
5) What is F(4) − F(2)?
Mean or expected value of a discrete random variable
The mean or expected value μ of a discrete random variable X is the sum of the possible values of X multiplied by the probability of the value. The mean is calculated as follows.
μ = E(X) = ∑ (x ⋅ p(x))
0
0.05
Cannot determine from the information provided
F(2)
F(3)
1 − F(3)
0.15
0.35
0.5
0
0.3
1
0
0.15
0.35
©zyBooks 02/03/21 13:11 922949 Julio Romero
QNT_275T_54402574
©zyBooks 02/03/21 13:11 922949 Julio Romero
QNT_275T_54402574
2/3/2021 QNT/275T: Statistics for Decision Making home
https://learn.zybooks.com/zybook/QNT_275T_54402574/chapter/4/print 37/40
The mean is a weighted average of the possible values of X with the probabilities as the weights. The mean represents the average value for the population modeled by the random variable X. Computing the mean does not always make sense for a discrete random variable. Ex: X models the race of a randomly selected voter with 1 denoting white, 2 black and 3 other. The mean of X is 1.63, but reporting the mean race is not useful.
Example 4.5.3: The mean of a discrete random variable.
Grace earns money testing websites at $10 per site. Let X represent Grace's weekly earnings. Grace estimates the probability of testing 0 sites in a week is 20%, of 10 sites is 70%, and of 15 sites is 10%. What is the mean of X?
Solution
The possible outcomes of X are X = 0 with probability 0.2, X = 100 with probability 0.7, and X = 150 with probability 0.1. First, the pmf of X is constructed.
X 0 100 150
p ∗ (X) 0.2 0.7 0.1
To �nd the mean, each value of X is multiplied by the corresponding probability, and the products are added.
μ = E(X)
= ∑ (X ⋅ p(X)) = 0(0.2) + 100(0.7) + 150(0.1) = 0 + 70 + 15 = 85
The expected value of $85 means that the web designer earns $85 per week on average.
PARTICIPATION ACTIVITY 4.5.3: Mean of discrete random variables.
Refer to the example above.
1) Grace decides she needs to earn more money and changes her probabilities. Without knowing the probabilities, which of the following could NOT be the resulting mean?
©zyBooks 02/03/21 13:11 922949 Julio Romero
QNT_275T_54402574
©zyBooks 02/03/21 13:11 922949 Julio Romero
QNT_275T_54402574
2/3/2021 QNT/275T: Statistics for Decision Making home
https://learn.zybooks.com/zybook/QNT_275T_54402574/chapter/4/print 38/40
2) The new probabilities Grace assigns are 0.05 for X = 0, 0.75 for X = 100, and 0.2 for X = 150. What is Grace's new expected earnings?
3) If the probabilities remain the same for each of the 3 possible X values, but Grace decides that on weeks she has less time she will still test at least 1 website instead of 0, will the expected value decrease, increase, or remain the same?
4) Grace's friend Mark also begins working. His schedule is less consistent and he believes his probabilities for X = 0, X = 100, and
X = 150 will be 1 8 ,
6 10 , and
2 10 ,
respectively. He also believes he will achieve X = 200 (twenty sites tested) the remaining 7.5% of the weeks. How does the expected value for Mark compare to the $105 Grace expects?
Variance and standard deviation of a discrete random variable
$100
$149
$155
$100
$83.333
$105
Decrease
Increase
Remain the same
Mark's is lower at $90.
Mark has the same expected value, $105.
Mark's is higher at $120.
©zyBooks 02/03/21 13:11 922949 Julio Romero
QNT_275T_54402574
©zyBooks 02/03/21 13:11 922949 Julio Romero
QNT_275T_54402574
2/3/2021 QNT/275T: Statistics for Decision Making home
https://learn.zybooks.com/zybook/QNT_275T_54402574/chapter/4/print 39/40
The mean of a discrete random variable is a measure of the center of the distribution. The variance of a discrete random variable X is a measure of the spread of a distribution. The variance is calculated as follows.
σ2 = V(X) = ∑ ((x − μ)2 ⋅ p(x)) Like the mean, the variance is a weighted average with the probabilities as the weights. The variance measures the average of the squared distance of each possible value of X from the mean.
The standard deviation is another measure of spread. The standard deviation is the square root of the variance.
σ = √σ2
Example 4.5.4: The mean of a discrete random variable.
Grace earns money testing websites at $10 per site. Let X represent Grace's weekly earnings. Grace estimates the probability of testing 0 sites in a week is 20%, of 10 sites is 70%, and of 15 sites is 10%.
What is the variance of X? What is the standard deviation of X?
Solution
The variance σ2 is a measure of the spread of the distribution and is calculated as σ2 = V(X) = ∑ ((X − μ)2 ⋅ p(X)).
The mean was previously calculated as μ = 85. To �nd σ2, the squares of the difference of each value of X from μ are found. σ2 is the sum of the squared differences weighted by the probability of each value of X.
X μ X − μ (X − μ)2 p(X) p(X) ⋅ (X − μ)2
0 85 −85 7225 0.2 1445
100 85 15 225 0.7 157.5
150 85 65 4225 0.1 422.5
The variance is
©zyBooks 02/03/21 13:11 922949 Julio Romero
QNT_275T_54402574
©zyBooks 02/03/21 13:11 922949 Julio Romero
QNT_275T_54402574
2/3/2021 QNT/275T: Statistics for Decision Making home
https://learn.zybooks.com/zybook/QNT_275T_54402574/chapter/4/print 40/40
σ2 = V(X)
= ∑ ((X − μ)2 ⋅ p(X)) = 7225(0.2) + 225(0.7) + 4225(0.1) = 2025
The standard deviation σ is the square root of σ2, or σ = √2025 = 45.
PARTICIPATION ACTIVITY 4.5.4: Variance and standard deviation of discrete random variables.
1) Which gives the measure of the center of a distribution?
2) Consider the example above. Grace decides she will never have a week with no earnings, but instead increases the $0 weeks to $20. If the probabilities remain the same, will the variance increase, decrease, or remain the same?
3) If Grace earns $20, $100, and $150 weekly, the variance is $1409. Grace receives a guaranteed amount of $10 per week regardless of how much she works. In other words, her earnings are $30, $110, and $160 with the same probabilities. What will happen to the variance?
the variance
the mean
the standard deviation
Increase
Decrease
Remain the same
Becomes less than $1409
Remains the same at $1409
Becomes higher than $1409
©zyBooks 02/03/21 13:11 922949 Julio Romero
QNT_275T_54402574
©zyBooks 02/03/21 13:11 922949 Julio Romero
QNT_275T_54402574