


x-bar and R chart /smiler to the example that i posted
 hno1411
Assignment:
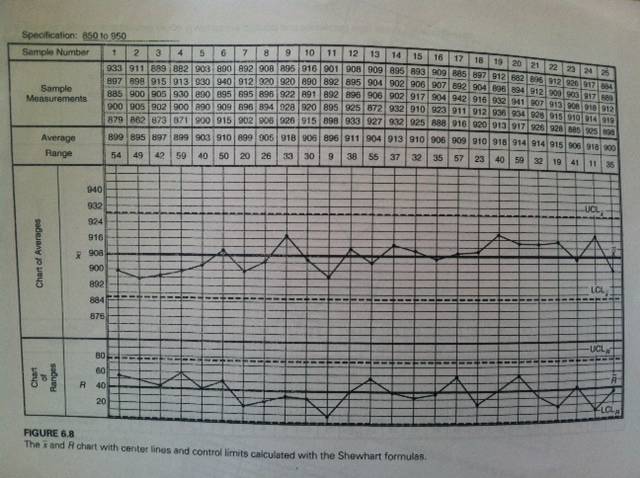
You will complete an x-bar and R chart similar to the example shown in Chapter 6, figure 6.8, from our textbook “Statistical Process Control and quality Improvement”, starting from the provided Excel template
 . You will enter the numerical data from the section below, and calculate all of the averages and ranges, then plot these numbers and add the connecting lines, in the appropriate chart sections. You will also calculate and plot the UCLX, LCLX, UCLR, and LCLR. The control limit formulas are on page 203 of the textbook. Be sure to include your upper and lower control limit calculations below the chart.
Numerical Data:
| 1 | 2 | 3 | 4 | 5 | 6 | 7 | 8 | 9 | 10 | 11 | 12 | 13 | 14 | 15 | 16 | 17 | 18 | 19 | 20 | 21 | 22 | 23 | 24 | 25 | |||||||||||||||||||||||||
| 890 | 892 | 908 | 895 | 916 | 933 | 911 | 889 | 882 | 903 | 896 | 912 | 926 | 917 | 884 | 901 | 908 | 909 | 895 | 893 | 909 | 885 | 897 | 912 | 882 | |||||||||||||||||||||||||
| 940 | 912 | 920 | 920 | 890 | 897 | 898 | 915 | 913 | 930 | 912 | 909 | 903 | 917 | 889 | 892 | 895 | 904 | 902 | 906 | 907 | 892 | 904 | 896 | 894 | |||||||||||||||||||||||||
| 895 | 895 | 896 | 922 | 891 | 885 | 900 | 905 | 930 | 890 | 907 | 913 | 908 | 918 | 912 | 892 | 896 | 906 | 902 | 917 | 904 | 942 | 916 | 932 | 941 | |||||||||||||||||||||||||
| 909 | 896 | 894 | 928 | 920 | 900 | 905 | 902 | 900 | 890 | 928 | 915 | 910 | 914 | 919 | 895 | 925 | 872 | 932 | 910 | 923 | 911 | 912 | 936 | 934 | |||||||||||||||||||||||||
| 915 | 902 | 906 | 926 | 915 | 879 | 862 | 873 | 871 | 900 | 926 | 928 | 885 | 925 | 898 | 898 | 933 | 927 | 932 | 925 | 888 | 916 | 920 | 913 | 917 |
Formatting:
Text Size: All of the text in this assignment has been preset to the individual cells.
Margins: The margins have been preset in this assignment. If you file doesn’t display correctly, you will need to change the page setup. The top, bottom, and right side are set for ¼’ (0.25) margins. The left margin is set to ½” (0.5”). The view is set to normal; the page is set to US Legal, landscape, and fit to page.
Name Block: Place the name block in the upper left corner of the page, in cells A1 through A3. Put yourname first, then the class title, as per the example:
Your Name
TECH 458 Quality Assurance
Saving/Naming Your File:
When you save your file make sure that your name and the project number are included in it.
Example: YourName458A1

 11 years ago
 5
5
- What was one of the most distinctive characteristic of the mature male figure in the First Intermediate Period?
- MGT 350 Week 3 Disscussion Questions
- MGT 350 Decisions in Paradise III
- Only for a-Plus Writer
- 1.A random sample of 50 students at the University of Florida revealed the mean number of hours slept last night was 6 hours and 48 minutes (6.8 hours). The standard deviation of the sample was .9 hours. A previous study concluded that Americans get a mea
- Human sexuality
- HCA 415 Week 4 Debate: Is Health Care a Right or a Privilege?
- MGT 230 Week 4 Individual Assignment Organizational Structure Paper
- Financial management of health care organizations
- BSHS 441 Week 4 Individual Assignment Paper Based on Literature Review

