


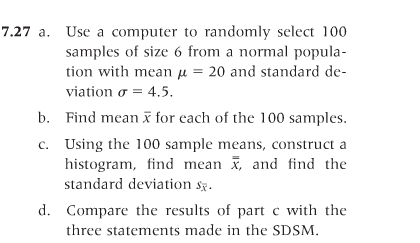
Use a computer to randomly select 100 samples of size 6 from a normal population with mean µ = 20 and standard deviation σ = 4.5
 tutor4helpyou
Use a computer to randomly select 100 samples of size 6 from a normal population with mean µ = 20 and standard deviation σ = 4.5.
- Find mean x̄ for each of the 100 samples.
- Using the 100 sample means, construct a histogram, find mean x-double bar, and find the standard deviation.
- Compare the results of part c with the three statements made the SDSM.
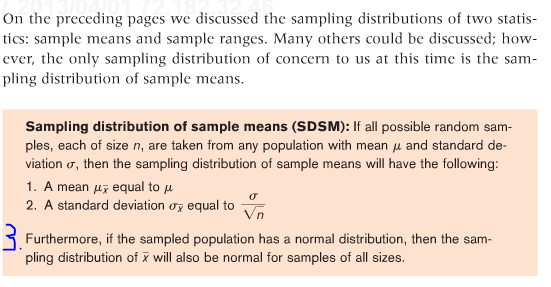
On the preceding pages we discussed the sampling distributions of two statistics: sample means and sample ranges. Many others could be discussed; however, the only sampling distribution of concern to us at this time is the sampling distribution of sample means.
Sampling distribution of sample means (SDSM):
If all possible random samples, each of size n, are taken from any population with mean µ and standard deviation sigma, then the sampling distribution of sample means will have the following:
- A mean µx̄ equal to µ
- A standard deviation σx̄ equal to σ/route over n
Furthermore, if the sampled population has a normal distribution, then the sampling distribution of x̄ will also be normal for samples of all sizes.
 12 years ago
Purchase the answer to view it

 answer.docx
- ref.xlsx

