

STATS QUIZ:
1. An analysis of variance was carried out after transforming the data to a logarithmic scale. One purpose of the transformation might have been to remove
a.single effects
b. main effects
c. fixed effects
d. random effects
2. Consider the six treatment groups A1B1, A1B2, A1B3, A2B1, A2B2, and A2B3. Suppose the mean responses to these treatment combinations are as follows:
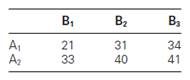
The average (33+40+41)/3=38 is called the
a. main effect of A1
b. main effect of A2
c. simple effect of A2 at B1, B2, and B3
d. interaction of A and B
e. error of A
3. Linear regression can only model functions which are straight lines (that's why it's called linear).
a. True
b. False
4. The administrator of a clinical trial is concerned that the experimenters might unwittingly tip the subjects off to which treatment they are receiving. To prevent this, neither the experimenters nor the subjects know which treatment is being used for any individual subject. This practice is called
a. randomization
b. blinding
c. double-blinding
d. blocking
e. stratification
5.An experimenter is designing a balanced experiment using completely randomized design. He has 45 mice to allocate to three treatment groups. Unknown to him, 9 of the mice have a birth defect that is sensitive to the treatments in his experiment. What is the probability that one of the groups has 5 defective mice,
and the others have 2 each?
a. 0.037
b. 0.093
c. 0.014
d. 0.279
e. 0.112
6. Which statistical data collection method is used to determine cause-and-effect
relationships?
a. sampling
b. simulation
c. designed experiments
d. observational studies
e. meta-analysis
7. Regression diagnostics are useful in determining the
a. coefficient of variation
b. adequacy of a fitted model
c. degrees of freedom in a two-way contingency table
d. percentiles of the t –distribution
e. parameters of a normal distribution
8. A study was conducted to investigate the relationship between the estriol level of pregnant women and subsequent height of their children at birth. A scatter diagram of the data suggested a linear relationship. Pearson’s product-moment correlation coefficient was computed and found to be r = 0.411. The researcher decided to re-express height in inches rather than centimeters and then recompute r . The recalculation should yield the following value of r :
a. 0.000
b. -0.411
c. 0.411
d. 0.500
e. cannot be determined from data available
9. You suspect two measurement variables are related by some monotonic relationship, but not necessarily a straight line. You can test this sort of non-linear relationship using
a. Pearson's product-moment correlation
b. covariance
c. Spearman's rank correlation
d. the Q-Q plot
e. the Breusch-Pagan test
10. If X and Y are independent random variables, then the correlation  is:
is:
a. 1
b. 0
c. -1
d.½
e. impossible to determine without data
 10 years ago
Purchase the answer to view it

 stats_quiz.docx