

STAT 200 Examination Check point 02
 Waqas Ahmed
Question 1
Question 2
The histogram below displays the distribution of 50 ages at death due to trauma (unnatural accidents and homicides) that were observed in a certain hospital during a week.
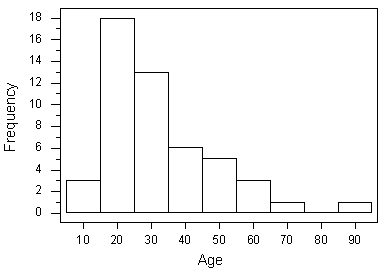
Which of the following are the appropriate numerical measures to describe the center and spread of the above distribution?
Question 3
A student survey was conducted at a major university, and data were collected from a random sample of 750 undergraduate students. One variable that was recorded for each student was the student's answer to the question: “What region of the country did you live in just prior to enrolling in this university? Northeast/Southeast/Northwest/Southwest/Midwest/Outside the U.S.”
These data would be best displayed using which of the following?
The next four questions relate to the same boxplot graph, shown below.
Question 4
The boxplots below show the real estate values of single-family homes in two neighboring cities (in thousands of dollars).
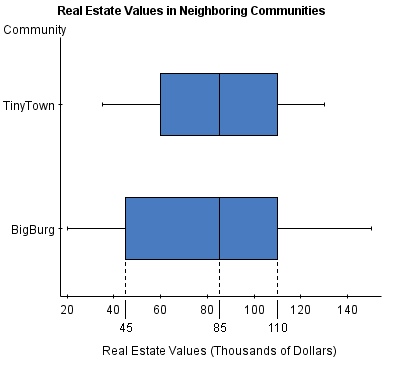
Which city has more households?
Question 5
The boxplots below show the real estate values of single-family homes in two neighboring cities (in thousands of dollars).
Which city has greater variability in real estate values?
Question 6
The boxplots below show the real estate values of single-family homes in two neighboring cities (in thousands of dollars).
Which city has the greater percentage of households with real estate values above $85,000?
Question 7
The boxplots below show the real estate values of single-family homes in two neighboring cities (in thousands of dollars).
Which city has a greater percentage of homes with real estate values between $55,000 and $85,000?
Please answer the question below. Your response will not be graded, but will be available for your instructor to read.
Question 8
 11 years ago
Purchase the answer to view it

 examining_distributions_checkpoint_2.pdf