| | | | | | | | | | | | | | | All Daily Reports | | A variety of reports and information combined into one document. | | Profile Info | | Personal: Luigi Vallazza Male 19 yrs 6 ft 3 in 290 lb | | | Day(s): Thursday, Friday, Saturday | | Activity Level: Sedentary | Strive for an Active activity level. | | Weight Change: None | Best not to exceed 2 lbs per week. | | BMI: 36.2 | Normal is 18.5 to 25. Clinically Obese is 30 or higher. | | | | | | Actual Intakes -vs- Recommended Intakes | | The actual intakes -vs- recommended intakes report displays the amount of nutrients consumed as they compare to your dietary intake recommendations in a bar graph format. | | Nutrient | Actual | Rec. | Percent | 0 | 50 | 100 | 150 | | Basic Components | | | Calories | 1,185.03 | 3,488.70 | 34 | % |  | | Calories from Fat | 458.73 | 976.84 | 47 | % |  | | Calories from SatFat | 125.96 | 313.98 | 40 | % |  | | Protein (g) | 72.76 | 105.23 | 69 | % |  | | Carbohydrates (g) | 107.90 | 479.70 | 22 | % |  | | Sugar (g) | 33.13 | | | | Dietary Fiber (g) | 3.44 | 48.84 | 7 | % |  | | Soluble Fiber (g) | 0.00 | | | | InSoluble Fiber (g) | 0.00 | | | | Fat (g) | 50.97 | 108.54 | 47 | % | | | Saturated Fat (g) | 14.00 | 34.89 | 40 | % | | | Trans Fat (g) | 0.17 | | | | Mono Fat (g) | 16.07 | 38.76 | 41 | % |  | | Poly Fat (g) | 13.76 | 34.89 | 39 | % |  | | Cholesterol (mg) | 288.16 | 300.00 | 96 | % |  | | Water (g) | 586.52 | 3,700.00 | 16 | % |  | | Vitamins | | | Vitamin A - RAE (mcg) | 75.54 | 900.00 | 8 | % |  | | Beta-carotene (mcg) | 47.68 | | | | Vitamin B1 - Thiamin (mg) | 1.71 | 1.20 | 142 | % |  | | Vitamin B2 - Riboflavin (mg) | 1.12 | 1.30 | 86 | % |  | | Vitamin B3 - Niacin (mg) | 15.40 | 16.00 | 96 | % | | | Vitamin B6 (mg) | 1.04 | 1.30 | 80 | % |  | | Vitamin B12 (mcg) | 1.83 | 2.40 | 76 | % |  | | Vitamin C (mg) | 10.84 | 90.00 | 12 | % |  | | Vitamin D - mcg (mcg) | 0.32 | 15.00 | 2 | % |  | | Vitamin E - Alpha Toc. (mg) | 1.59 | 15.00 | 11 | % |  | | Folate (mcg) | 103.27 | 400.00 | 26 | % |  | | Minerals | | | | | Calcium (mg) | 246.01 | 1,000.00 | 25 | % |  | | Iron (mg) | 7.32 | 8.00 | 91 | % |  | | Magnesium (mg) | 94.12 | 400.00 | 24 | % |  | | Phosphorus (mg) | 748.73 | 700.00 | 107 | % |  | | Potassium (mg) | 1,614.45 | 4,700.00 | 34 | % |  | | Selenium (mcg) | 84.12 | | | | Sodium (mg) | 2,784.47 | 2,300.00 | 121 | % |  | | Zinc (mg) | 6.91 | 11.00 | 63 | % |  | | Other | | | Omega-3 (g) | 1.01 | | | | Omega-6 (g) | 9.56 | | | | Alcohol (g) | 0.00 | | | | Caffeine (mg) | 108.05 | | | | | | |
| | | | | | | | | | | | | All Nutrients Spreadsheet | | This report shows all nutrient values in a spreadsheet format. Nutrients are displayed horizontally, with totals at the bottom of the list. | | | | | | |
|---|
| | | | | French Toast, w/butter, fast |
|---|
| | | | | |
|---|
| | | Coffee, brewed w/tap water |
|---|
| | | | | |
|---|
| | | | Rice Dish, long grain & wild, |
|---|
| | | | | |
|---|
| | | Frank, turkey, Butcher Boy |
|---|
| | | | | |
|---|
| | | Soda, Coca-Cola (Coca-Cola) |
|---|
| | | | | |
|---|
| | | | | | |
|---|
| | | Bread, white, Texas toast, thick |
|---|
| | | | | |
|---|
| | | | | |
|---|
| | | | | Dish, chicken, General Tso's |
|---|
| | | | | |
|---|
| | | | | |
|---|
| | | | | Dish, chicken, General Tso's |
|---|
| | | | | |
|---|
| | | | Soup, Traditional, turkey noodle, |
|---|
| | | | | |
|---|
| | | | Pork, tenderloin, lean, chop, |
|---|
| | | | | |
|---|
| | | | Lunchmeat, bologna, chicken |
|---|
| | | | | |
|---|
| | | Bread, white, enriched, sandwich |
|---|
| | | | | |
|---|
| | | | | |
|---|
| | | | | |
|---|
| | | | | | | | |
|---|
| | | | | French Toast, w/butter, fast |
|---|
| | | | | | |
|---|
| | | Coffee, brewed w/tap water |
|---|
| | | | | | |
|---|
| | | | Rice Dish, long grain & wild, |
|---|
| | | | | | |
|---|
| | | Frank, turkey, Butcher Boy |
|---|
| | | | | | |
|---|
| | | Soda, Coca-Cola (Coca-Cola) |
|---|
| | | | | | |
|---|
| | | | | | | |
|---|
| | | Bread, white, Texas toast, thick |
|---|
| | | | | | |
|---|
| | | | | | |
|---|
| | | | | Dish, chicken, General Tso's |
|---|
| | | | | | |
|---|
| | | | | | |
|---|
| | | | | Dish, chicken, General Tso's |
|---|
| | | | | | |
|---|
| | | | Soup, Traditional, turkey noodle, |
|---|
| | | | | | |
|---|
| | | | Pork, tenderloin, lean, chop, |
|---|
| | | | | | |
|---|
| | | | Lunchmeat, bologna, chicken |
|---|
| | | | | | |
|---|
| | | Bread, white, enriched, sandwich |
|---|
| | | | | | |
|---|
| | | | | | |
|---|
| | | | | | |
|---|
| | | |
| | | | | | | | | MyFoodList Report | | The MyFoodList Report shows the foods you have entered and their calories. | | | | Amount | Item | Cals | | Day 1 | | | 0.3 | box | Rice Dish, long grain & wild, original recipe, dry (Uncle Ben's) | 200 | | 100.0 | g | Frank, turkey, Butcher Boy Meats, FS (Tyson Food Service) | 239 | | 1.0 | btl | Soda, Coca-Cola (Coca-Cola) | 170 | | 1.0 | cup | Soup, chicken noodle, homestyle, cond, cnd (Campbells) | 141 | | 2.0 | slc | Bread, white, Texas toast, thick sliced (Oroweat) | 220 | | 2.0 | piece | French Toast, w/butter, fast food (USDA SR-24: Fast Food) | 356 | | 24.0 | fl oz | Coffee, brewed w/tap water (USDA SR-24) | 7 | | | Day Total | 1334 | | Day 2 | | | 15.0 | piece | Dish, chicken, General Tso's (USDA SR-24: Chinese | 782 | | | Day Total | 782 | | Day 3 | | | 5.0 | piece | Dish, chicken, General Tso's (USDA SR-24: Chinese | 261 | | 1.0 | cup | Soup, Traditional, turkey noodle, cnd (Progresso) | 80 | | 4.0 | piece | Lunchmeat, bologna, chicken pork & beef, slice (USDA SR-24) | 305 | | 2.0 | slc | Bread, white, enriched, sandwich (Oroweat) | 140 | | 350.0 | g | Pork, tenderloin, lean, chop, brld (USDA SR-24) | 654 | | | Day Total | 1440 | | | | | | | | | Total | 3555 | | | Day Average | 1185 | | | Item Average | 273 | | | | | | |
| | | | | | | | | | | | | | | | MyPlate | | The MyPlate Food Guide report displays graphically how close the foodlist compares to the lastest USDA Dietary Guidelines (see ChooseMyPlate.gov for more info). |  | | | Intake vs. Recommendation | | 3200 Calorie Pattern | | | | | | Group | Percent | Comparison | Amount | * | | | | Grains Intake | 26 | % | | 2.6 | oz equivalent |  | | Grains Recommendation | | | | 10. | oz equivalent |  | | | | Vegetables Intake | 0 | % | | 0.0 | cup equivalent |  | | Vegetables | | | | 4.0 | cup equivalent |  | | | | Fruits Intake | 0 | % | | 0.0 | cup equivalent |  | | Fruits Recommendation | | | | 2.5 | cup equivalent |  | | | | Dairy Intake | 0 | % | | 0.0 | cup equivalent |  | | Dairy Recommendation | | | | 3.0 | cup equivalent |  | | | | Protein Foods Intake | 95 | % | | 6.6 | oz equivalent |  | | Protein Foods Recommendation | | | 7.0 | oz equivalent |  | | | | Make Half Your Grains Whole | | Vary Your Vegetables | | Aim for at least 5.0 whole grains a day | | Dark Green Vegetables | 3.0 | cups weekly | | | Orange Vegetables | 2.5 | cups weekly | | Oils & Empty Calories | | Dry Beans & Peas | 3.5 | cups weekly | | Aim for 11.0 teaspoons of oils a day | | Starchy Vegetables | 9.0 | cups weekly | | Limit your extra fats & sugars to 648 Calories | | Other Vegetables | 10. | cups weekly | | | | * | oz equivalent is a 1 ounce estimate, rounded to consumer friendly units. For example, an oz equivalent of Grains is a 1 slice of bread, or 1/2 cup of rice. An oz equivalent of Protein Foods 1 oz of meat, 1 egg, or 1/4 cup cooked beans. | | | | | | | | | | |
| | | | | | | | | | | Energy Balance | | The Energy Balance report compares the calories you've consumed to your total energy expenditure. | | Intake | | | Calories consumed | = | 1185 | Calories | | | | | Expenditure | | | Sedentary Activity Calories | = | 3489 | Calories | | | Additional exercise Calories | = | 3867 | Calories | | | Calories expended | = | 7356 | Calories | | | | | Energy Balance: | -6171 | Calories | | 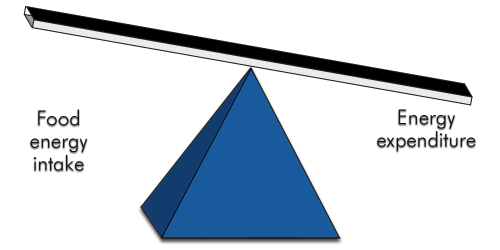 | | Intake | vs | Expenditure | | 1185 Calories | | 7356 Calories | | | | | | |
| | | | | | | | | | | | | | | | | | | | | Calorie and Fat Sources | | The Calorie and Fat Sources report is useful for quickly seeing the calorie and fat breakdowns of your intake. The Source of Calories window shows graphically the percentage of calories from protein, carbohydrates, fat, and alcohol. The Source of Fat window shows the breakdown of fat (saturated, monounsaturated, polyunsaturated, and other fats). | | Calories: 1185 | | Source of Calories | 0 | 50 | 100 | | Source of Fat | 0 | 50 | 100 | | Protein | 25 | % | | Saturated Fat | 32 | % | | | |  | | | | | | | | Carbohydrate | 37 | % | | Mono Fat | 37 | % | |  | | | | | | | | | | Fat | 39 | % | | Poly Fat | 31 | % | | | |  | | | | | | | | Alcohol | 0 | % | | Trans Fat | 0 | % | |  | | | | | | | | | | | | | | | | | | Exchanges | | Ratios | | Starch | 5.61 | Fruit | | | P:S ( Poly Fat / Saturated Fat ) | 0.98 | : 1 | | Other Carbs | 0.83 | Vegetables | | | Potassium : Sodium | 0.58 | : 1 | | Very Lean Meat | | Milk | | | Calcium : Phosphorus | 0.33 | : 1 | | Meat | | | CSI ( Cholesterol / Saturated Fat ) | 28.54 | | | | | | | | | | | | | | |
| | | | | | | | | | | | | Nutrition Facts | | Formats the analysis as a Nutrition Facts label. | | | | | | | | | | | Nutrition Facts | | | | | Serving Size ( 959 g ) | | | | | | | | | | | | | Amount Per Serving | | | | | | | | | | | | | Calories 1185 | Calories from Fat 459 | | | | | | | | | | % Daily Value * | | | | | | | | | | Total Fat 51g | | 47% | | | | | | | | | | Saturated Fat 14g | | 40% | | | | | | | | | | Trans Fat 0g | | | | | | | | | | Cholesterol 288mg | | 96% | | | | | | | | | | Sodium 2784mg | | 121% | | | | | | | | | | Total Carbohydrates | | 22% | | | | | | | | | | Dietary Fiber 3g | | 7% | | | | | | | | | | Sugars 33g | | | | | | | | | | Protein 73g | | 69% | | | | | | | | | | | | | | | | Vitamin A 8% | | Vitamin C 12% | | | | | | | | | | Calcium 25% | | Iron 91% | | | | | | | | | | * Percent Daily Values are based on your custom | | | | | | | | | | | | | | |
| | | | | | | | Calorie Assessment | | A close-up picture of the Calories consumed. | | | | Calories to maintain current weight | | | | Calories to maintain current weight | 3489 | | Calorie adjustment for weight change of 0 lb (per week) | 0 | | Goal Calories | 3489 | | | | Average Daily Intake & Expenditures | | | | Average Intake | 1185 | | Average Expenditure | 7356 | | | | Calories For The Day | Goal | Intake | Assessment | | | | Total Calories | 3489 | 1185 | Below Goal | | Carbohydrates (45-65% Calories) | 1570 to 2267 | 433 | Below Goal | | Protein (10-35% Calories) | 349 to 1221 | 292 | Below Goal | | Fat (20-35% Calories) | 698 to 1221 | 460 | Below Goal | | | | | | | | |
| | | | | | | | | | | | | | | | | | | | | | | | | | | | | | | | | Meal Assessment Report | | Sources of Calories, Protein, Carbohydrates, and Fats by Meal | | | Calories | | % | 0 | 50 | 100 | | Protein | | % | 0 | 50 | 100 | | | | Breakfast | 624 | 18 | % | | Breakfast | 22.6 | 10 | % | | | |  | | | | | | Lunch | 689 | 19 | % | | Lunch | 24.4 | 11 | % | | | |  | |  | | | | Snack | 445 | 13 | % | | Snack | 16.7 | 8 | % | | | |  | | | | | | Dinner | 179 | 51 | % | | Dinner | 154. | 71 | % | | | |  | |  | | | | Not | 0 | 0 | % | | Not | 0 | 0 | % | | | | | | | | | | | | | | | | | | Carbohydrate | | % | 0 | 50 | 100 | | Fat | | % | 0 | 50 | 100 | | | | Breakfast | 57.2 | 18 | % | | Breakfast | 33.3 | 22 | % | | | | | | | | | | Lunch | 106. | 33 | % | | Lunch | 19.7 | 13 | % | | | | | | | | | | Snack | 34.3 | 11 | % | | Snack | 27.4 | 18 | % | | | | | | | | | | Dinner | 125. | 39 | % | | Dinner | 72.5 | 47 | % | | | | | |  | | | | Not | 0 | 0 | % | | Not | 0 | 0 | % | | | | | | | | | | | | | | | | | | | | | | | |
| | | | | | | | | | | | | | Activity Summary | | List of the Activities performed, their METs, duration and Calories burned. | | Profile Calorie Goal: | 3489 | | | Daily Activity Details | | | | Thursday | | | | Duration | Mets | Exercise | Calories | | 3 | hours | 4.0 | sports, table tennis, ping pong | 1657 | | 3 | hours | 5.0 | occupation, walking, carrying 25-49 lbs | 2072 | | | Sedentary Activities of Daily Living† | 3489 | | | Total Calories (Very Active) | 7218 | | Friday | | | | Duration | Mets | Exercise | Calories | | 3 | hours | 4.0 | sports, table tennis, ping pong | 1657 | | 3 | hours | 5.0 | occupation, walking, carrying 25-49 lbs | 2072 | | | Sedentary Activities of Daily Living† | 3489 | | | Total Calories (Very Active) | 7218 | | Saturday | | | | Duration | Mets | Exercise | Calories | | 6 | hours | 5.0 | occupation, walking, carrying 25-49 lbs | 4144 | | | Sedentary Activities of Daily Living† | 3489 | | | Total Calories (Very Active) | 7632 | | | | Summary | | | Calories | | | | Sedentary Activities of Daily Living† | 3489 | | | | Average Daily Calories Expended | 3867 | | | | Daily Average# | 7356 | | | | | [†] The Sedentary activity level includes basic daily tasks such as getting ready for the day, housework, walking to work or class, and light yard work. These tasks are called Activities of Daily Living (ADL). If you engage in physical activity beyond that included in the activities of daily living, you may increase your activity level to Low Active, Active or Very Active. The Active activity level is recommended by the government for health. | | | | [#] Your Daily Average put you in the Very Active activity level, and suggests 5020 Calories to maintain your current weight. | | | | |  | | | Calorie Goal | Calories Expended | | 3489 | | 7356 | | | | | | | | | | | | | | |
| | | | | | | Recommendations | | The Recommendations Report lists the recommended daily nutrient intake for a person based on the information entered. Often referred to as the DRI (Dietary Reference Intake). | | Nutrient | Value | Notes | | Basic Components | | | Calories | 3,488.70 | | | Protein (g) | 105.23 | 10% - 35% of Calories (adults 19-70 yrs) * | | | | Carbohydrates (g) | 479.70 | 45% - 65% of Calories (adults 19-70 yrs) * | | | | Dietary Fiber (g) | 48.84 | | | Fat (g) | 108.54 | 20% - 35% of Calories (adults 19-70 yrs) * | | | | Saturated Fat (g) | 34.89 | Less than 10% of Calories + | | Mono Fat (g) | 38.76 | | | Poly Fat (g) | 34.89 | | | Cholesterol (mg) | 300.00 | Less than 300 mg per day + | | Water (g) | 3,700.00 | | | Vitamins | | | Vitamin A - RAE (mcg) | 900.00 | | | Vitamin B1 - Thiamin (mg) | 1.20 | | | Vitamin B2 - Riboflavin (mg) | 1.30 | | | Vitamin B3 - Niacin (mg) | 16.00 | | | Vitamin B6 (mg) | 1.30 | Do not exceed 100 mg * | | Vitamin B12 (mcg) | 2.40 | Over 50 should take a supplement * | | Vitamin C (mg) | 90.00 | | | Vitamin D - mcg (mcg) | 15.00 | Do not exceed 100 mcg * | | Vitamin E - Alpha Toc. (mg) | 15.00 | | | Folate (mcg) | 400.00 | Women of child bearing age should take a supplement * | | | | Minerals | | | Calcium (mg) | 1,000.00 | Do not exceed 2500 mg * | | Iron (mg) | 8.00 | Do not exceed 45 mg * | | Magnesium (mg) | 400.00 | Do not exceed 350 mg by supplement * | | | | Phosphorus (mg) | 700.00 | Do not exceed 4000 mg * | | Potassium (mg) | 4,700.00 | | | Sodium (mg) | 2,300.00 | Less than 2300 mg - lower for some people + | | | | Zinc (mg) | 11.00 | Do not exceed 40 mg * | | | | Sources: | | | | * Dietary Reference Intakes | | + 2010 Dietary Guidelines for Americans | | | | | | |
| |


 lawigi
 11 years ago
 20
20