


I need the graphs in excel and Questions in word document
 Arun1990
You have to answer the following 5 questions:
Q1: What is a collar strategy and how does it work?
Q2: Construct a collar strategy with at-the-money calls and at-the-money puts using the historical data in case Exhibit 3. Back-test what would have been the growth in value of a $1 invested from the start of December 1990 to the end of December 2007 following this strategy. See case Exhibit 2 for details on a collar strategy. Plot it against the monthly growth in value of $1 in the HFRX EH: Equity Market Neutral Index (HFRI EH), the S&P 500 Index, and in one-month Treasury bills (T-bills). What do you conclude? What would have been the Sharpe ratio of this strategy?
Q3: Now do the same but with a collar strategy with OTM calls (with strikes equal to 105% of the current value of the S&P 500 Index) and OTM puts (with strikes equal to 95% of the current value of the S&P 500 Index). What would have been the growth in the value of $1 following this strategy? And what would have been the Sharpe ratio?
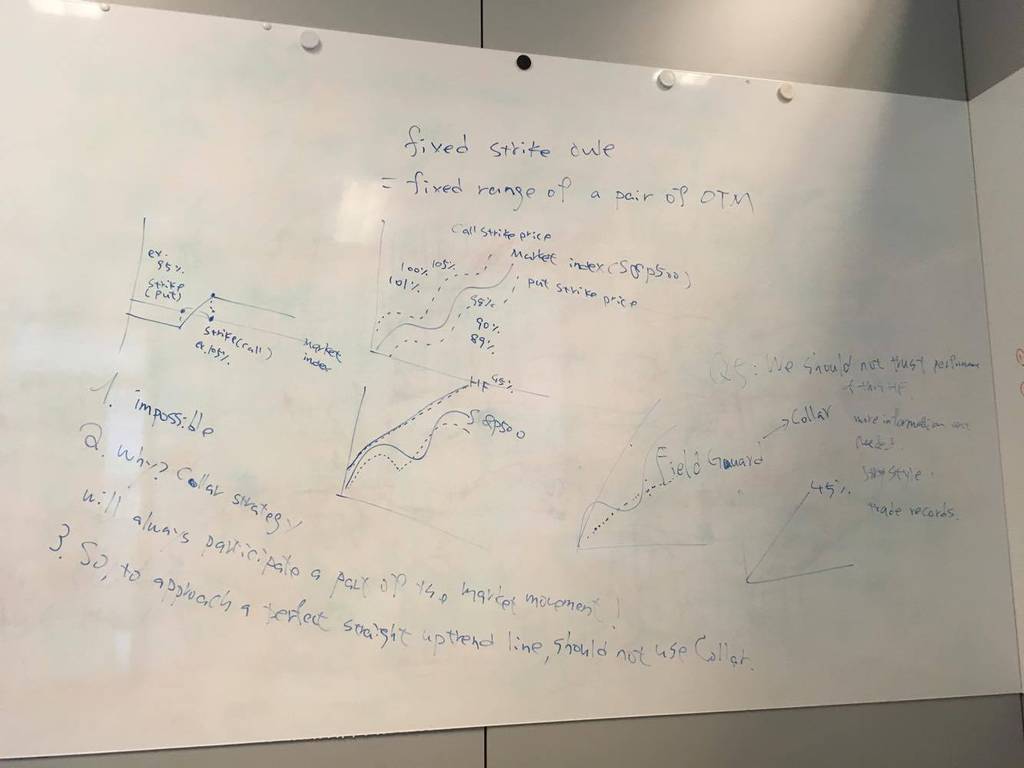
Q4: Can you get a fixed-strike rule for the “moneyness” of the call and put options on the collar strategy so you can match the growth in the value of $1 experienced by the Fairfield Guard hedge fund? A fixed-strike rule means that you should keep the moneyness (the percentage that makes the strikes for the call and put options to be OTM) held constant over time.
Q5: What are your observations? What do you conclude?
 9 years ago
 25
25
Purchase the answer to view it

 hm493.xlsx
- hm_493.docx
- hm493_2.xlsx
- hm_493_1.docx
- hm_493_2.docx
- hm493_3.xlsx
- hm493_4.xlsx

