

Astronomy Stage 2
 tar.ca
Brief Overview of Activity: Locate and analyze two news reports of recent astronomical discoveries.
Required Items: The internet and/or periodicals such as (for example) The Washington Post or Sky and Telescope
The daily news is not just sports and politics. It includes science too! For this simple activity all you need to do is find two articles related to astronomy (either online or in hard copy), summarize and analyze them. The topics can be anything of your choosing so long as they are relevant to the course material. Examples could be a new telescope that has recently come online, the discovery of a new exoplanet, etc.; the idea is for you to find and write up something you are interested in! The writeup should be roughly one page long (double-spaced); the first half should be a summary of what was discovered, and the second should be your analysis of it--did it make sense? Was it well-written? Did it tie into things we've discussed in class? What are some of the ramifications, etc.? Include the complete citation of the original article (hyperlinked if it is from the internet). Make sure your sources are reputable ones, whether online or not; if you have any concerns about whether that's the case or not, please simply contact me and I can give you my opinion.
HR Diagram Activity (30 points)
Brief Overview of Activity: Use an HR diagram to learn about the differences between the stars in our stellar neighborhood and the brightest stars in the sky.
Required Items: this HR diagram, red & black ink pens.
Procedure:
On the HR diagram, plot each star from the "Brightest Stars Group" in black ink and then plot each star from the "Nearest Stars Group" in red ink.
Data for both groups of stars can be found below.
Describe any differences between the two groups of stars - such as their location on the diagram, color, mass, and the types of stars in each group.
Which of the two groups of stars is most representative of the vast majority stars in the universe?
Data
| Name | Spectral Type | Absolute Mag |
|---|---|---|
| Sirius | A1 | 1.45 |
| Canopus | F0 | -5.63 |
| Rigel Kentaurus | G2 | 4.39 |
| Arcturus | K2 | -0.32 |
| Vega | A0 | 0.61 |
| Capella | G8 | -0.52 |
| Rigel | B8 | -7.01 |
| Procyon | F5 | 2.66 |
| Betelgeuse | M2 | -5.48 |
| Achernar | B3 | -2.71 |
| Hadar | B1 | -4.78 |
| Altair | A7 | 2.22 |
| Aldebaran | K5 | -0.63 |
| Acrux | B0.5 | -4.18 |
| Spica | B1 | -3.44 |
| Antares | M1 | -5.12 |
| Fomalhaut | A3 | 1.75 |
| Pollux | K0 | 1.07 |
| Deneb | A2 | -6.90 |
| Mimosa | B0.5 | -3.90 |
Nearest Stars Group
| Name | Spectral Type | Absolute Mag |
|---|---|---|
| Sun | G2 | 4.83 |
| Proxima Centauri | M5.5 | 15.48 |
| Alpha Centauri A | G2 | 4.38 |
| Alpha Centauri B | K0 | 5.71 |
| Barnard's Star | M3.5 | 13.25 |
| Wolf 359 | M5.5 | 16.64 |
| Lalande 21185 | M2 | 10.44 |
| Sirius A | A1 | 1.44 |
| Sirius B | A2 | 11.34 |
| Epsilon Eridani | K2 | 6.20 |
| Lacaille 9352 | M1 | 9.76 |
| Ross 128 | M4 | 13.53 |
| 61 Cygni A | K5 | 7.48 |
| 61 Cygni B | K7 | 8.31 |
| Procyon A | F5 | 2.65 |
| Procyon B | A0 | 12.98 |
| Struve 2398 | M3 | 11.17 |
| Groombridge 34 | M1.5 | 10.31 |
| Epsilon Indi | K4 | 6.98 |
| Tau Ceti | G8.5 | 5.68 |
Radioactive Dating Activity (due at Stage 2) (30 points)
Brief Overview of Activity: Radioactive decay is one of the sources of the heat that drive the Earth's geologic activity. Radioactive decay also allows us to date rocks and determine the age of the Earth and other solar system bodies.
Required Items: 36 coins, a calculator, pencil & paper.
Procedure:
In this activity you will simulate the radioactive decay of 36 atoms of a rare isotope of uranium, U-235. Uranium-235 has a half-life of 700 million years. Gather 36 coins and arrange them in a 6 x 6 grid with all of the coins facing heads up.
Flip each coin into the air and then place it back in its original location on the grid. This represents the passage of 1 half-life (700 million years for this example). The coins that came up heads represent atoms that have not yet decayed; the coins that came up tails represent atoms that have decayed. Record the number of heads below.
Next flip each one of the remaining heads-up coins once and place it back in its original location. 1.4 billion years have now passed by (2 x 700 million). Record the number of remaining heads below. Repeat this process until all coins are tails up.
_______ Original number of U-235 atoms
_______ Remaining number of U-235 atoms after 1st flip
_______ Remaining number of U-235 atoms after 2nd flip
Add additional lines as needed.
Questions:
How many half-lives did it take for all of the atoms to decay?
How many years does that equate to?
Do you think everyone in class will get the same answer? Why?
Diameter of the Sun Activity (25 points)
Brief Overview of Activity: A pinhole can form an image in much the same way as a lens. Measuring the size of the Sun's projected image and the distance between the pinhole and the image, you will be able to calculate the diameter of the Sun.
Required Items: a friend to help you, a broom handle (or mop handle or long straight piece of wood of similar dimensions), a ruler (marked in centimeters), two envelopes (or two 5 x 7 index cards), a pencil, masking tape, one stickpin.
Number of Observations needed: 1
Timing of Observations: near noon on a bright sunny day
Procedure:
Preparation: Use the stickpin to poke a small hole near the center of one of the envelopes. Mark a location near the top of the broom handle with masking tape (this is where your friend will hold the envelope with the pin-hole). Mark another location near the end of the broom handle with masking tape (this is where you will observe and mark the image). Carefully measure the distance between your two marked locations on your broom handle. Make your measurement to the nearest 0.1 centimeter and record here: ___________ cm.
Observation: Caution: never stare directly at the Sun. Gather your friend, marked broom handle, two envelopes, pencil, and then head outside. With your friend holding the envelope with the pinhole at the upper marked position and you holding the other envelope at the lower marked location, align the broom handle such that a small faint image of the Sun's disk is seen on the lower envelope. You may find it convenient to actually sit on the ground for this procedure. With a pencil, carefully mark the location of opposite sides of the Sun's disk. Here is a link showing a diagram of the setup.
Calculation: From your marked envelope, carefully measure the size of the projected image of the Sun's disk to the nearest 0.1 centimeter and record here: __________ cm.
Next, use the relationship below to calculate the Sun's diameter in kilometers. Note that the distance to the Sun is 1.5 x 10 8 km.
    Sun's diameter in kilometers              image diameter in centimeters
------------------------------------- = ------------------------------------------
 Distance to the Sun in kilometers       distance between image and pinhole in cm
Record your calculated value for the diameter of the Sun ______________________ km
Setup Diagram


Brief Overview of Activity: Over a period of at least three consecutive evenings, you will make careful observation of the Moon's changes in appearance and position.
Required Items: a notebook to take notes or make a sketch (bring your red flashlight), you may take digital photos if you wish.
Number of Observations needed: 3
Timing of Observations: 3 consecutive nights, around (and after) sunset, a few days after the Moon is new. Your instructor will inform you what the appropriate viewing days are in the term.
Procedure:
Choose a location with a good view of the western horizon from which you can clearly observe the Sun at sunset. Since we will be timing our observations a few days after the Moon is new, the Moon should be visible in the sky at (and for a while after) sunset. It is important that you make all of your observations from the same location and at the same time. You may want to mark the location with a piece of tape to insure you are observing from the same location each time.
First measurement: This measurement is important. It will be used as a reference point for all future measurements. Arrive a little early and try to find a suitable reference object in the distance near the horizon. Look for a distinctive tree, building, rock formation, or other object. Pick something you will remember and be able to easily spot each time you come to observe. Mark the location and description of your reference object in your notebook.
For Each Observation: Make a note in your notebook about appearance of the Moon and its location in the sky. You may make a sketch if you wish. Note any changes from the previous day's observation. Be sure to note the location, date, and time of your observations.
Location of Observations: _______________________________________________
Observation (1) Date ____________________Time __________ pm
- Horizontal angular measurement ___________ degrees
- Vertical angular measurement ___________ degrees
- Appearance _____________________________________________
Observation (2) Date ____________________Time __________ pm
- Horizontal angular measurement ___________ degrees
- Vertical angular measurement ___________ degrees
- Appearance _____________________________________________
Observation (3) Date ____________________Time __________ pm
- Horizontal angular measurement ___________ degrees
- Vertical angular measurement ___________ degrees
- Appearance _____________________________________________
Angular Measurement: As shown below, you can use your fingers (or hand) to estimate angles. Using your measured angles, it is possible to determine the angular change in the Moon's position from day to day. You will need to make two angular measurements for each observation - one horizontal angular measurement and one vertical angular measurement. Your horizontal measurements are made from the reference object/point to the Moon. Your vertical measurements are made from the horizon to the Moon.

Fully extend your arm and use the finger/hand guidelines to make your angular measurements.
Questions:
Describe any changes in the Moon's appearance from observation to observation.
Describe any change in Moon's position in the sky from observation to observation.
Using the methods laid out above, what is your estimate of the daily amount of angular change in the Moon's position?
Star Count Activity (25 points)
Brief Overview of Activity: Determine the number of stars visible to the naked eye by collecting sample star counts over a small area of the sky.
Required Items: a ruler (marked in centimeters), one small cardboard tube (the center tube from a roll of toilet paper is ideal. Note: the length of the tube must be greater than its width.), red-light flashlight (or tape a piece of red cellophane or plastic over a white-light flashlight). Using a regular white-light flashlight will interfere with your night vision.
Number of Observations needed: 3, each at a different location as detailed below.
Timing of Observations: clear, dark moonless night
Procedure:
Preparation: Carefully measure the length of your cardboard tube. Make your measurement to the nearest 0.1 centimeter
and record here: L = _______ cm.
Next, carefully measure the diameter of your cardboard tube. Make your measurement to the nearest 0.1 centimeter
and record here: D = _______ cm.
Observation: On a clear, dark, moonless night, allow a few minutes for your eyes to adapt to the dark, then hold the tube up to your eye then count and record the number of stars that you can see through the tube. Hold the tube steady, with your eye at the center of the tube's opening, during each star count. Do this ten times, choosing random areas of the sky to measure. Be sure to sample all directions equally.
Calculation: You can estimate the total number of naked-eye stars visible in the night sky by using: the length (L) of the cardboard tube, the diameter (D) of the cardboard tube, and the number of stars in your sample (NSAMPLE). Use your measurements and the formula below to estimate the number of naked-eye stars visible in the night sky. For anyone interested, a derivation of this formula can be found at the bottom of the page.

Your answer is an estimate of the total number of stars in the night sky that are visible to the naked eye at this particular location.
Follow this procedure three times: once in a city, once in a rural location away from city lights and once in another location. In the end, you should have three different estimations of stars for three different locations. Make sure you record the locations, dates, and times of your three sets of observations on the next page.
Star Count Observations and Data
Location of Observation (1): ____________________________________________
Date ____________________Time __________ pm
Total Number of Sample Stars Observed ___________
Calculated Number of Visible Stars ___________
Location of Observation (2): ____________________________________________
Date ____________________Time __________ pm
Total Number of Sample Stars Observed ___________
Calculated Number of Visible Stars ___________
Location of Observation (3): ____________________________________________
Date ____________________Time __________ pm
Total Number of Sample Stars Observed ___________
Calculated Number of Visible Stars _________________
Question: Discuss possible reasons why your observed number of stars might be different at each of your observation locations.
If you want to know where the formula comes from.... continue reading below...
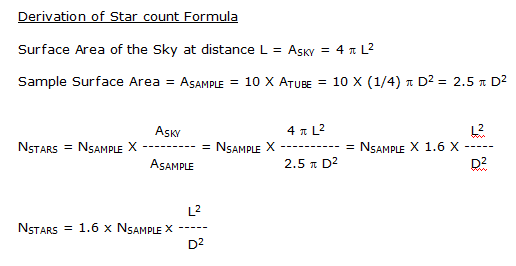
Constellation Activity (25 points)
Brief Overview of Activity: Locate five constellations.
Required Items: Night Sky Planisphere, red-light flashlight (or tape a piece of red cellophane or plastic over a white-light flashlight). Using a regular white-light flashlight will interfere with your night vision.
Number of Observations needed: 1
Timing of Observations: a clear, dark night when the moon is not prominent (ideally)
Use your Night Sky Planisphere to identify any five constellations in the night sky. If you are in the Northern Hemisphere, also find the Big Dipper and the North Star (Polaris). Submit the names of the five constellations you found, describe how you found Polaris, and comment about how easy (or hard) it was to use the star chart to locate constellations. Do the constellations in the sky look like the ones on the star chart? If not, how do they differ?
 11 years ago
 15
15
- Individual Project: POM-QM for Windows software - Individual Project
- algebra questons chapter 14
- Medical Office Management Assignment!
- Turn in one or two pages write-up about what you learned from reading that article and/or how it relates to the course materials.
- Solve the following equations using substitution or elimination: 7x+3y=13 and 3x-2y= -1
- here is the source: Sir, I am obliged for your attention to my letter and now beg to forward Petition praying for...
- Slope intercept form of the line that passes through (2,1) and has a slope of -1
- A salesperson recieves a base salary of 35,000 and a commission of 10%. write a linear question that shows total...
- A farm has 60 cows,pigs,and horses. There are 4 times as many cows and pigs as horses.How many horses are...
- Statistics