


Applying the Concepts - Interpreting the Results of Correlations and Regressions
 vanaym
Big Sky Beef raises grass-fed beef cattle for sale to high-end grocery chains (like Whole Foods) and farm-to-table restaurants. As sales have escalated over the past 2 years, the herd needs to be replenished more frequently to meet customer demands.
Big Sky would like to develop a simple predictive model for estimating herd replenishment costs prior to attending large cattle auctions. Big Sky reports that the average head of cattle weighs 500 pounds, and it will need at least 1,000 head of cattle. Your team has been hired to perform the research necessary to create this model.
To create a simple but effective model, the team collected two pieces of data for each head of cattle sold at local auctions for the past 12 months - (a) price of the cow (DV), and the cow's weight (IV).
The following were the statistical results:
Results of correlation analysis:
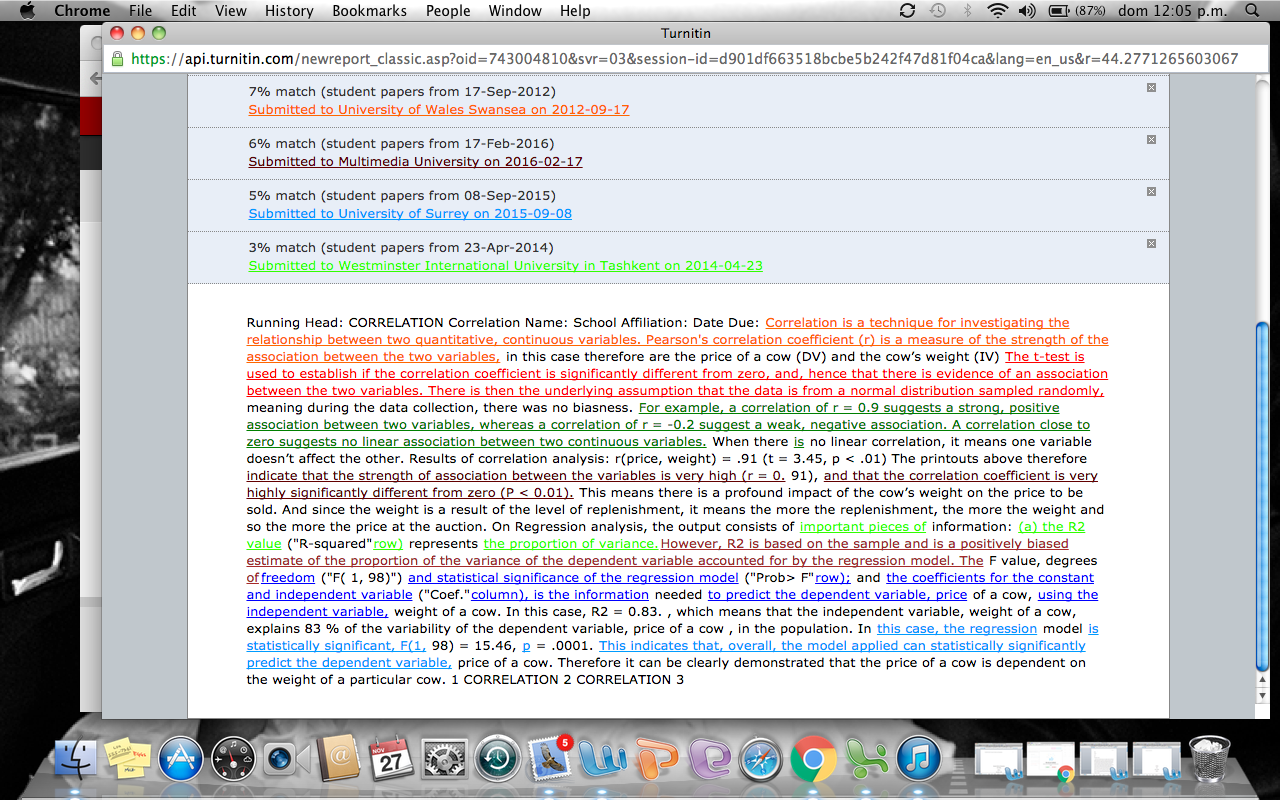
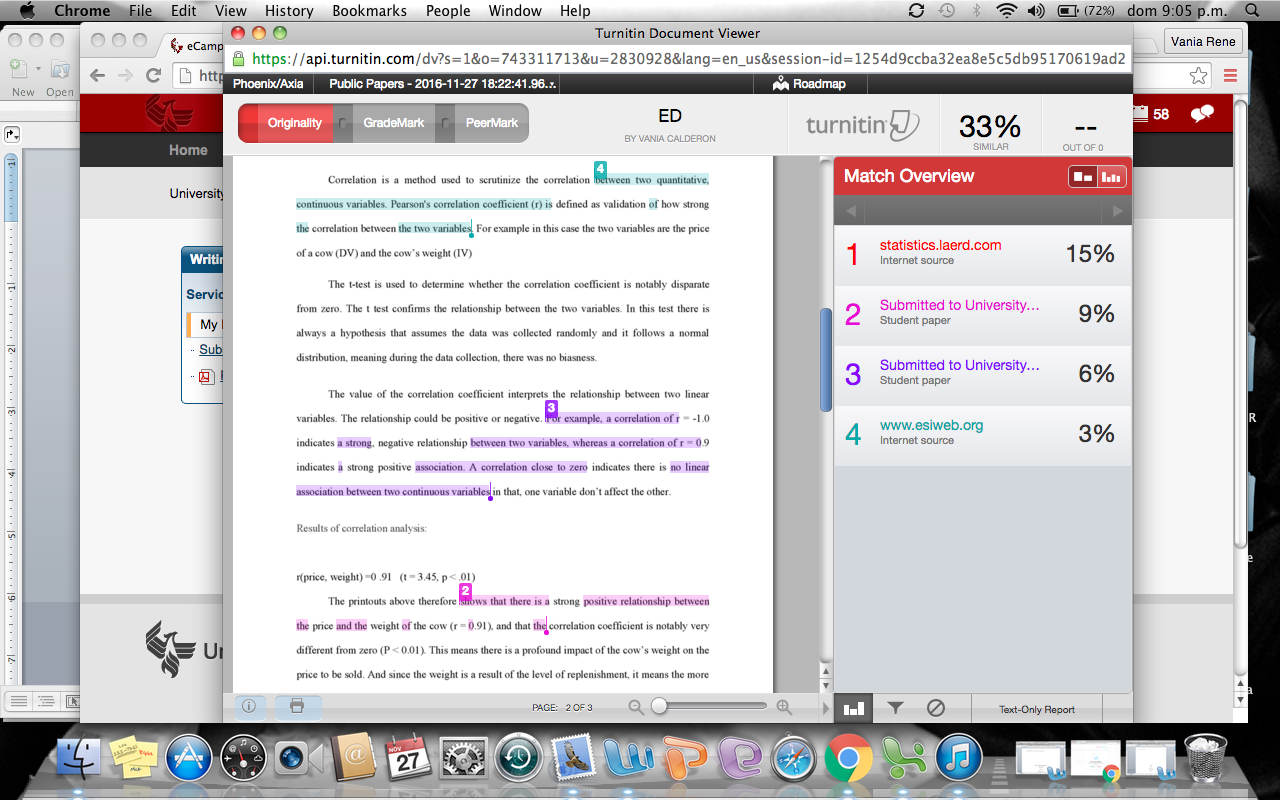
r(price, weight) = .91 (t = 3.45, p < .01)
Results of simple regression analysis
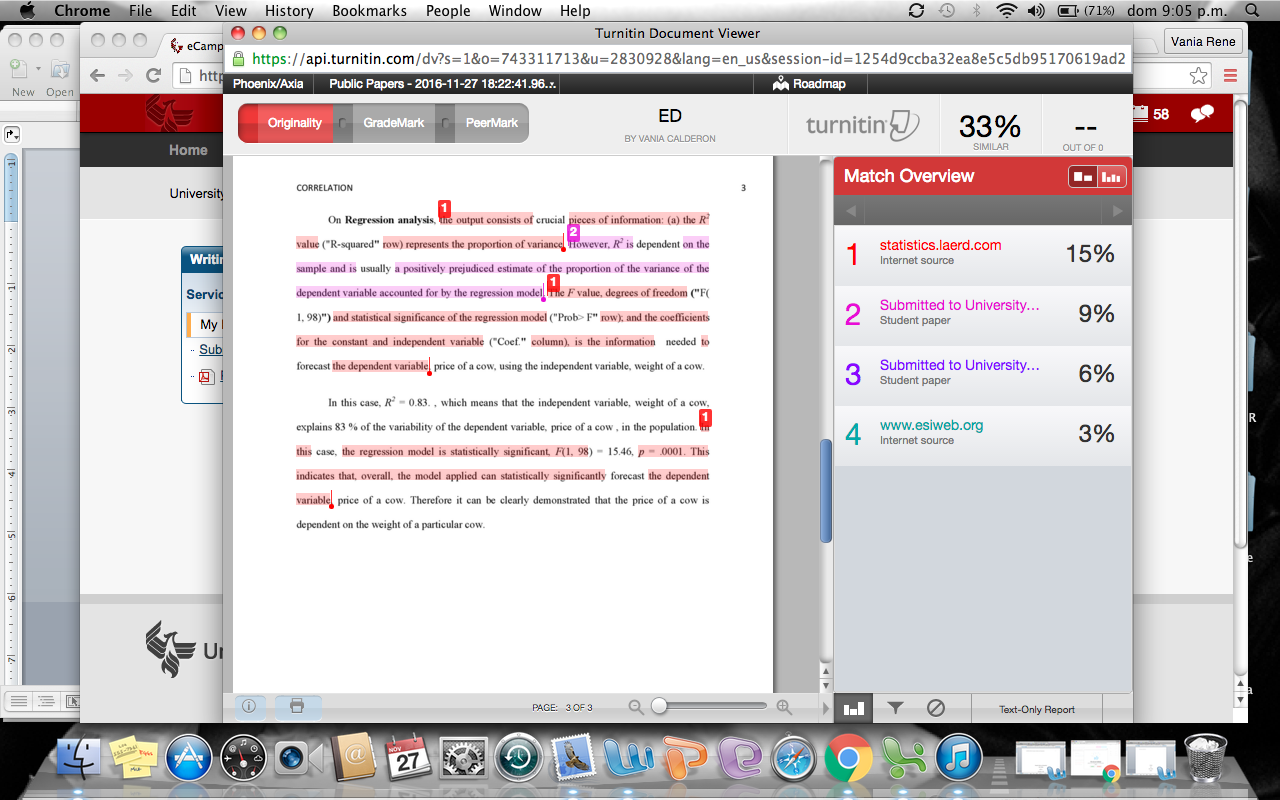
y = 200 + .15x (R2 = .83, F = 15.46, p = .001)
The research team has asked you to interpret the statistical results, and present it in a narrative form that their buyers can easily understand.
 10 years ago
 3
3
Purchase the answer to view it

 correlation_final.docx
- Introduction and Discussion of the article "The Dangerous Morality of Managing Earnings"
- asap
- 1.Respond to the following statement: Unless teachers learn and respect the culture of their students it will be impossible to teach...
- partnership liquidation
- Examine the Federal Sentencing Guidelines for Organizations (FSGO), Sarbanes – Oxley Act (SOX), and the Consumer Financial Protection Bureau (CFPB). In a three to five page paper excluding title page and reference page(s) complete the following: Explai
- Human Resource Question, no plaigerism!!!!!!!! APA FORMAT
- Experiential Leadership Exercise #5
- Multiple Questions Answers
- work
- Ecet 330 Quiz

